
The Effects of Coal Switching and Improvements in Electricity Production Efficiency and Consumption on CO2 Mitigation Goals in China

Abstract
:1. Introduction


2. Methodology
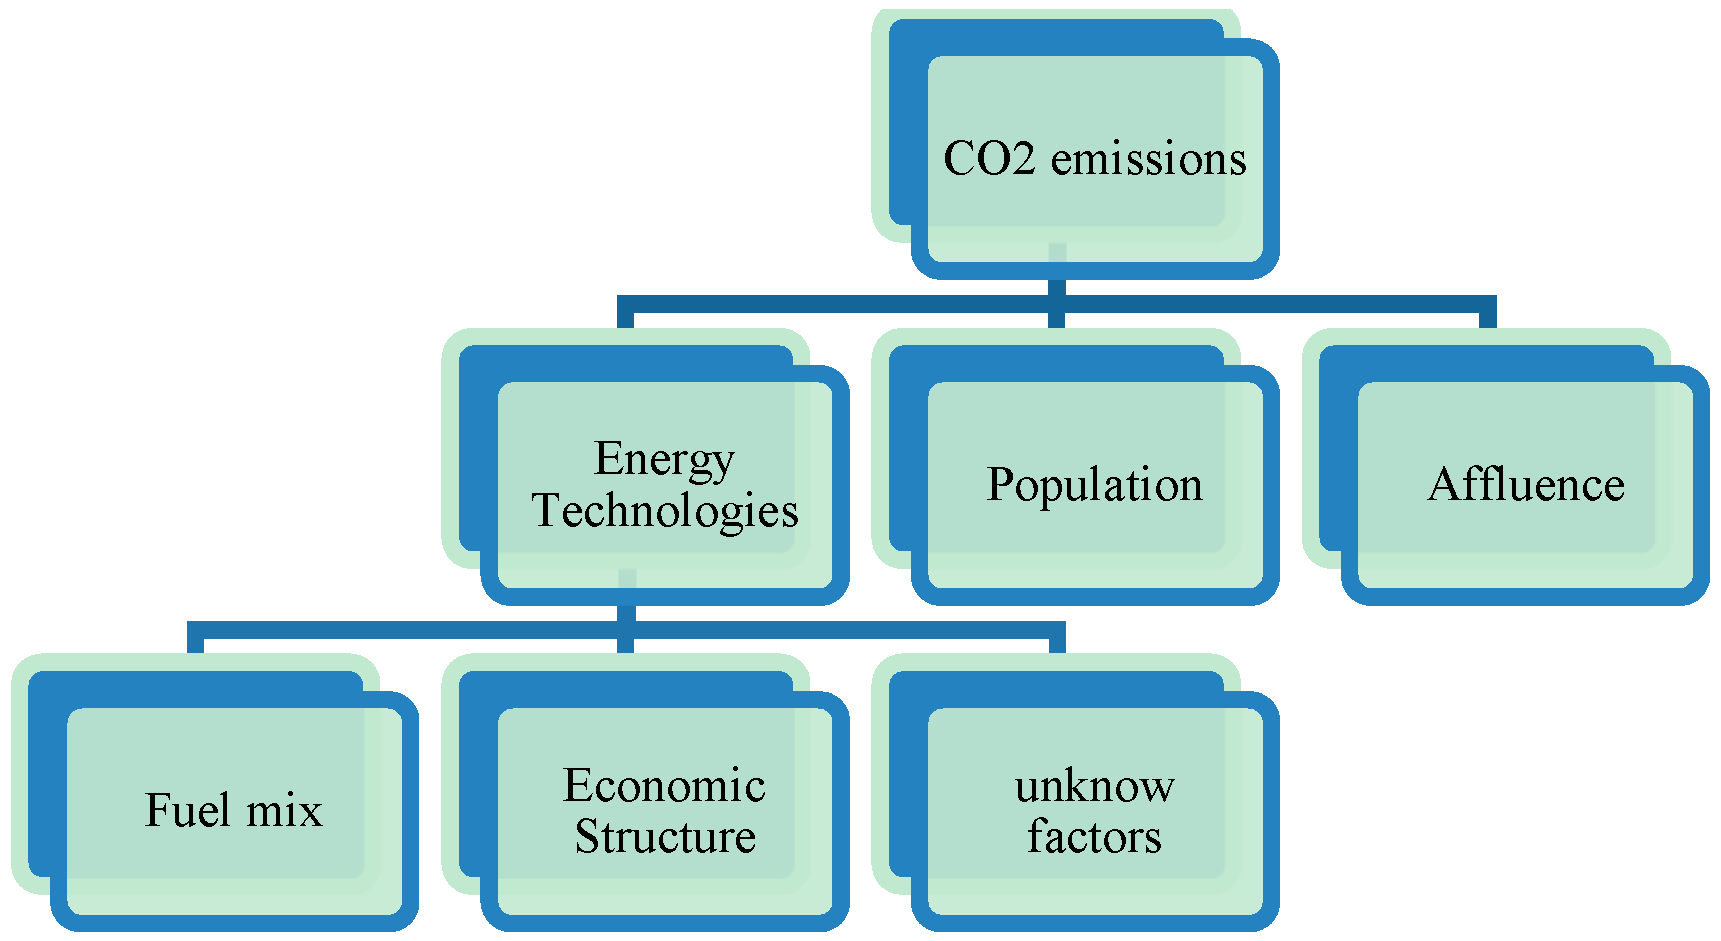
2.1. Description
2.2. A double-Layers STIRPAT Model

3. Data Processing and Scenario Development
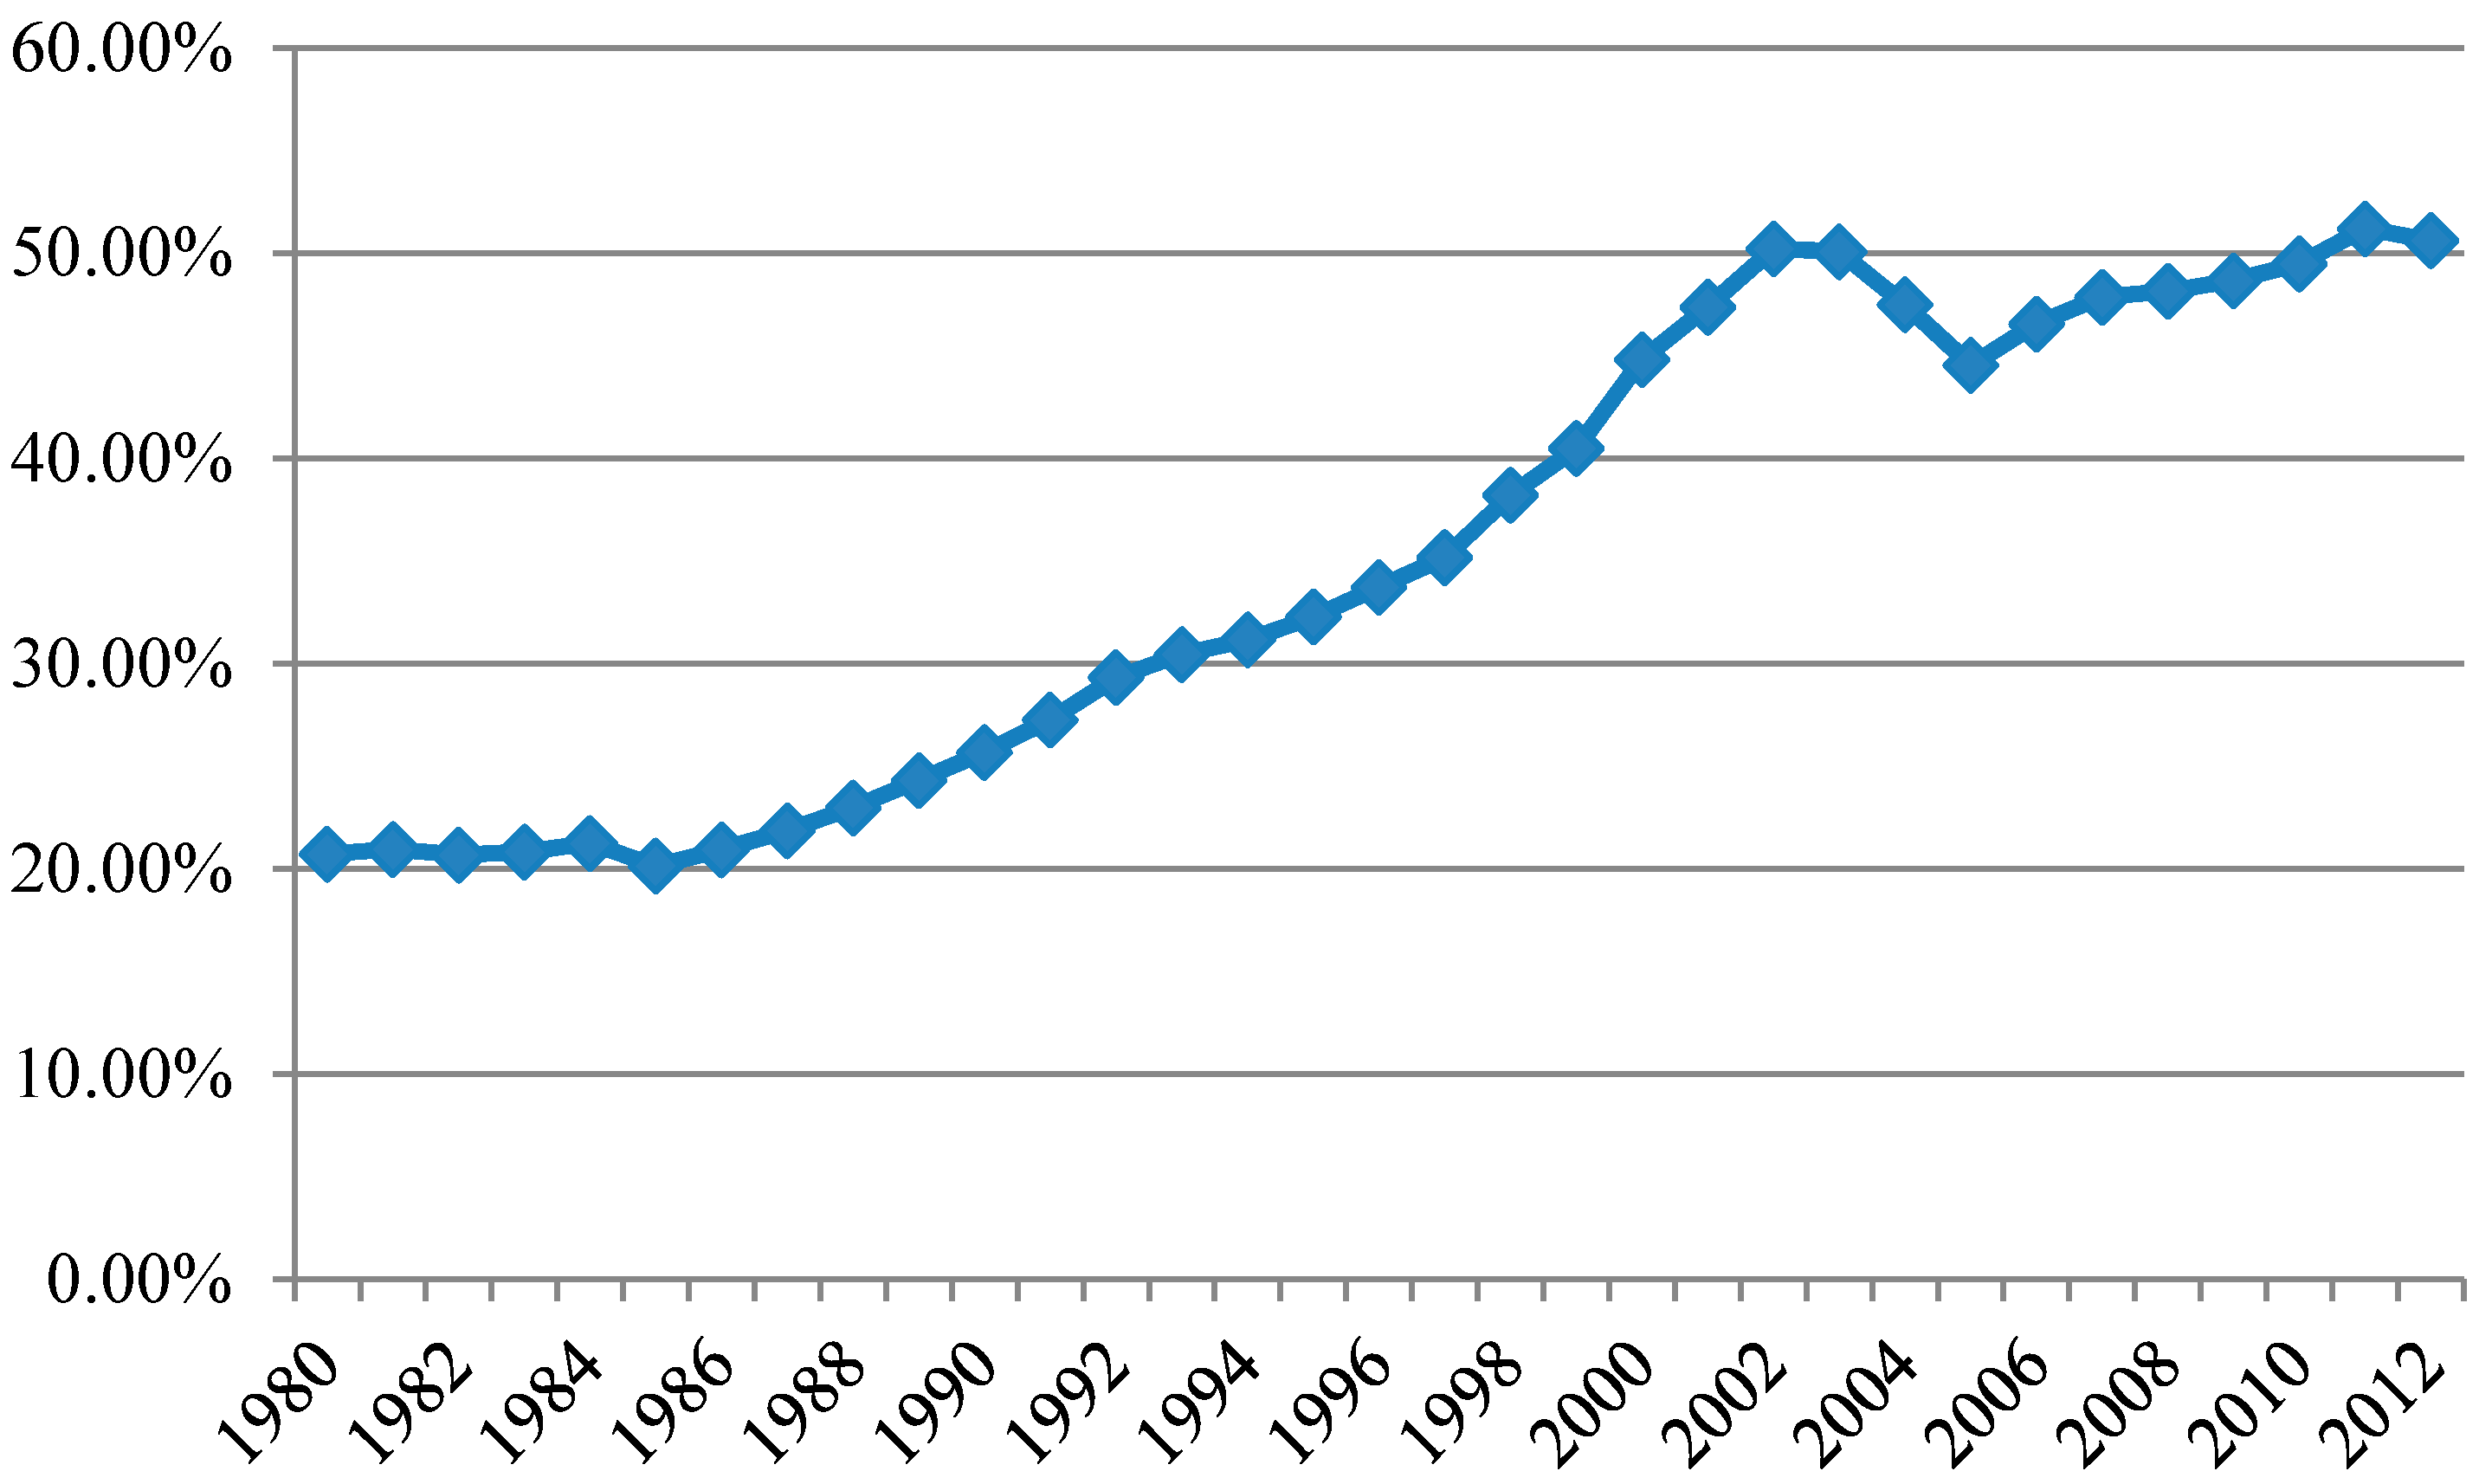
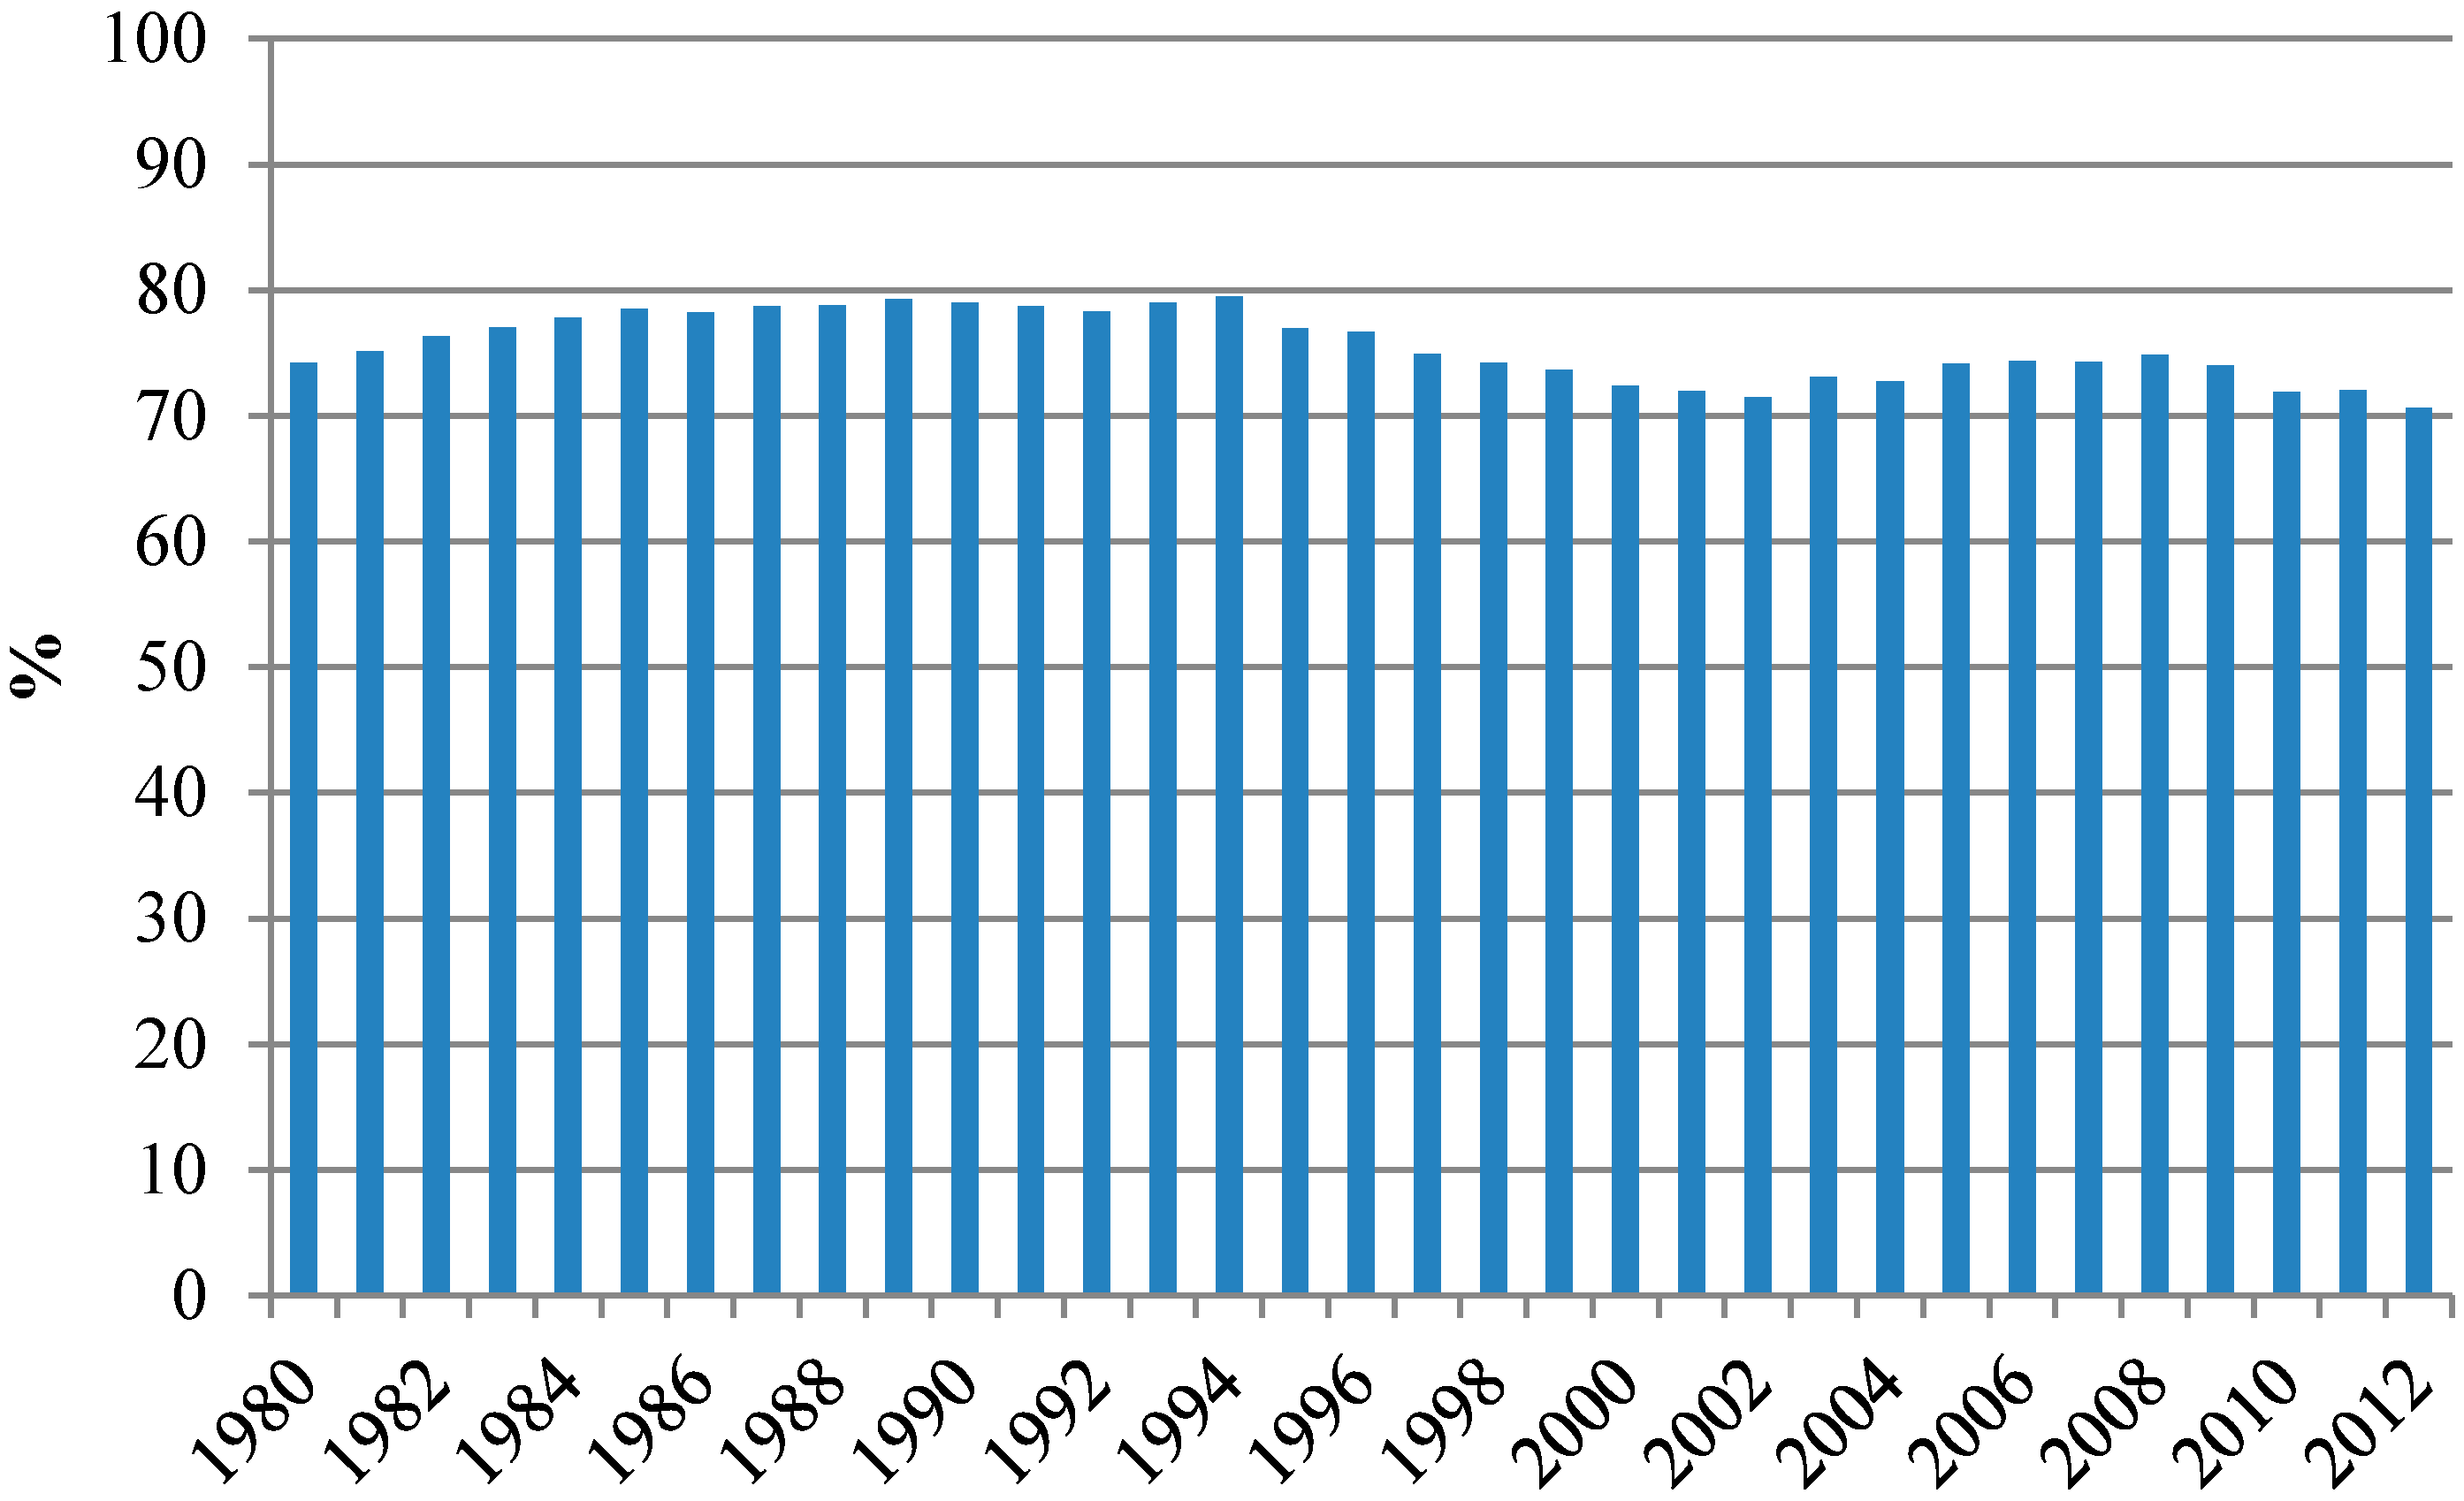
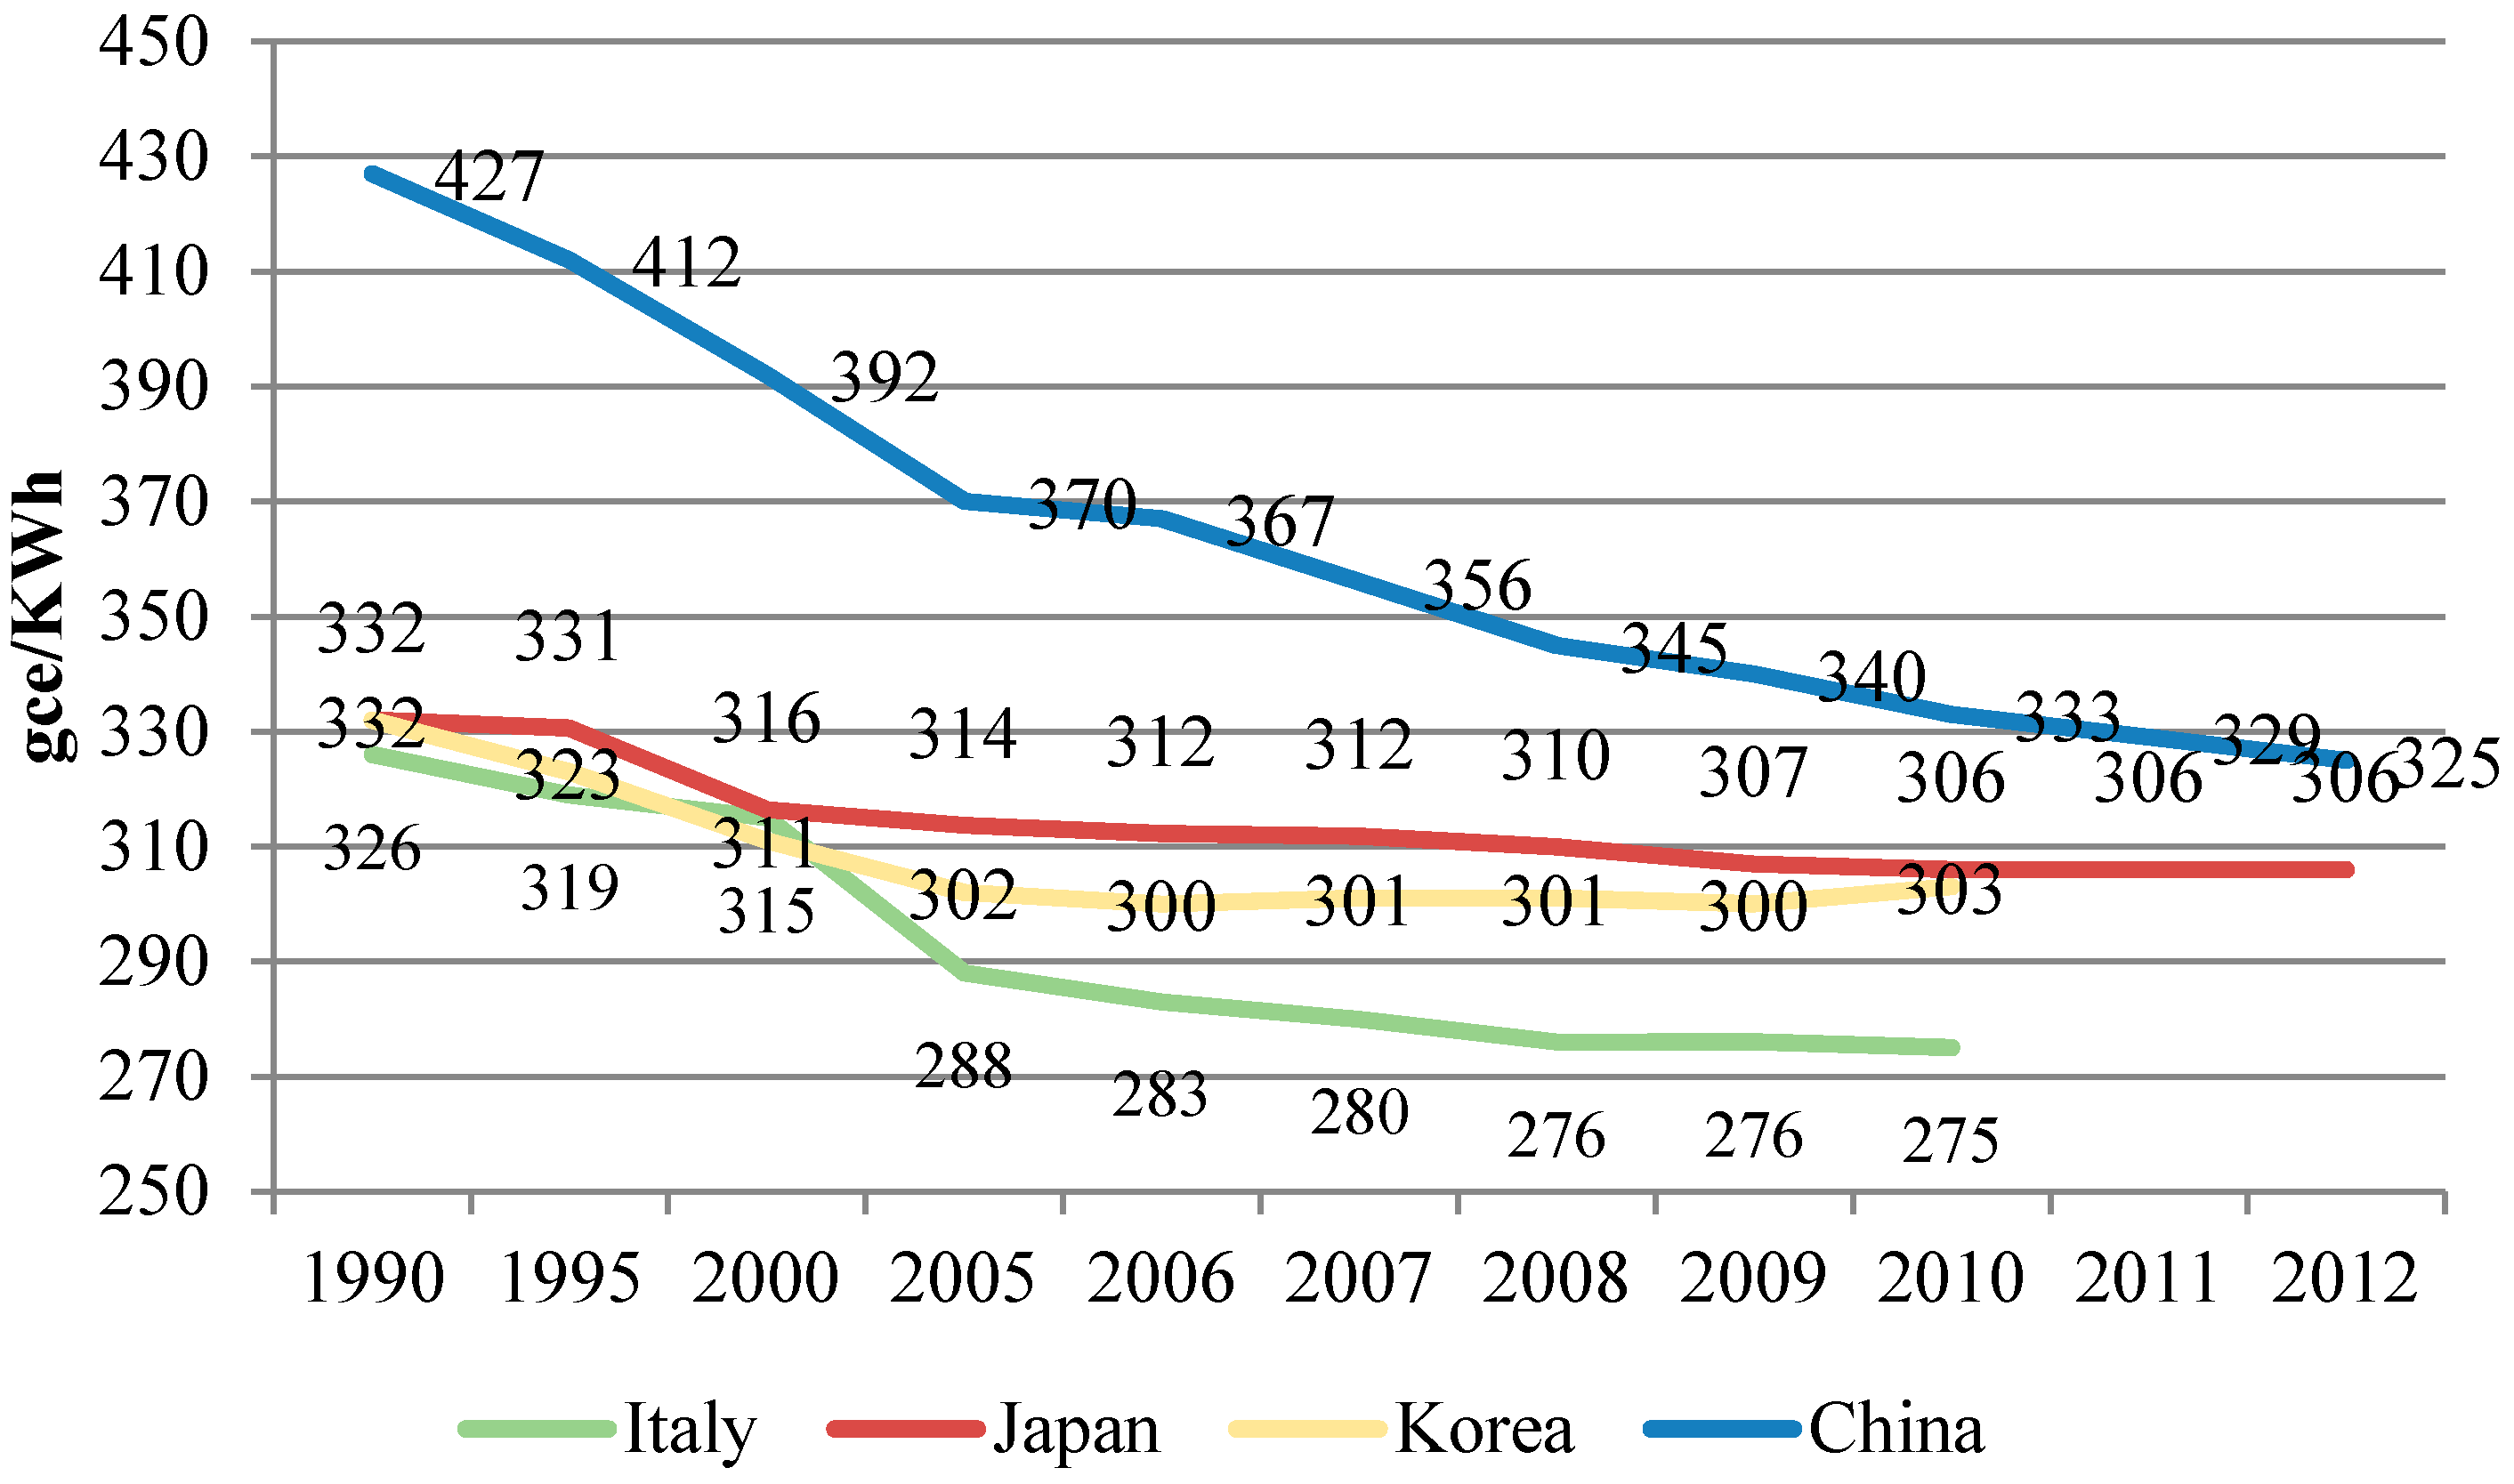
3.1. Data Collection
3.2. Data Processing
3.2.1. Unit Root Tests
3.2.2. Cointegration

| Variables | ADF | DF-GLS | PP | |||
|---|---|---|---|---|---|---|
| Level | 1st Difference | Level | 1st Difference | Level | 1st Difference | |
| ln Ic | 0.081 | −2.801 * | 0.030 | −2.385 ** | 0.686 | −2.835 * |
| ln P | −2.245 | −2.834 * | 0.859 | −2.665 ** | −7.760 *** | - |
| ln GDP/P | 1.495 | −3.453 ** | 0.203 | −1.968 ** | 0.606 | −3.362 ** |
| ln EI | −1.039 | −3.103 ** | 0.212 | −2.955 *** | −1.335 | −1.612 * |
| ln FMc | −0.193 | −4.404 *** | −1.257 | −2.218 ** | −0.799 | −4.520 *** |
| ln EIelec | −1.263 | −3.598 ** | −0.486 | −3.203 *** | −2.417 | −2.445 ** |
| ln CIp | 4.187 | 0.570 | 0.123 | −2.563 ** | 3.959 | −3.712 ** |
| ln IS | −2.129 | −3.819 *** | −0.015 | −3.881 *** | −2.462 | −3.753 *** |
| Group of Variables | Hypothesized No. of CE(s) | T-Statistic | Prob. |
|---|---|---|---|
| ln Ic, lnP, lnGDP/P, lnEI | None * | 53.864 | 0.0123 |
| At most 1 * | 32.183 | 0.0261 | |
| At most 2 | 12.788 | 0.1228 | |
| At most 3 * | 4.575 | 0.0324 | |
| ln EI, lnFMc, ln EIelec, lnCIp, lnIS | None * | 74.990 | 0.0182 |
| At most 1 | 40.066 | 0.2202 | |
| At most 2 | 19.188 | 0.4795 | |
| At most 3 | 15.495 | 0.4183 | |
| At most 4 | 0.047 | 0.8287 |
3.2.3. Estimation of the Long-Term Relationship
Adjusted R2 = 0.998, DW = 0.563
Adjusted R2 = 0.999, DW = 2.021
Adjusted R2 = 0.995, DW = 1.989
4. Scenario Development
4.1. Elasticities
4.2. Features of the Scenarios

| Variables | Periods | ||
|---|---|---|---|
| 2013–2020 | 2020–2030 | 2030–2040 | |
| P | 0.4% | 0.329% | 0.244% |
| GDP/P | 6.9% | 5.3% | 3.2% |
| IS | 0.87% | 1.21% | 1.13% |
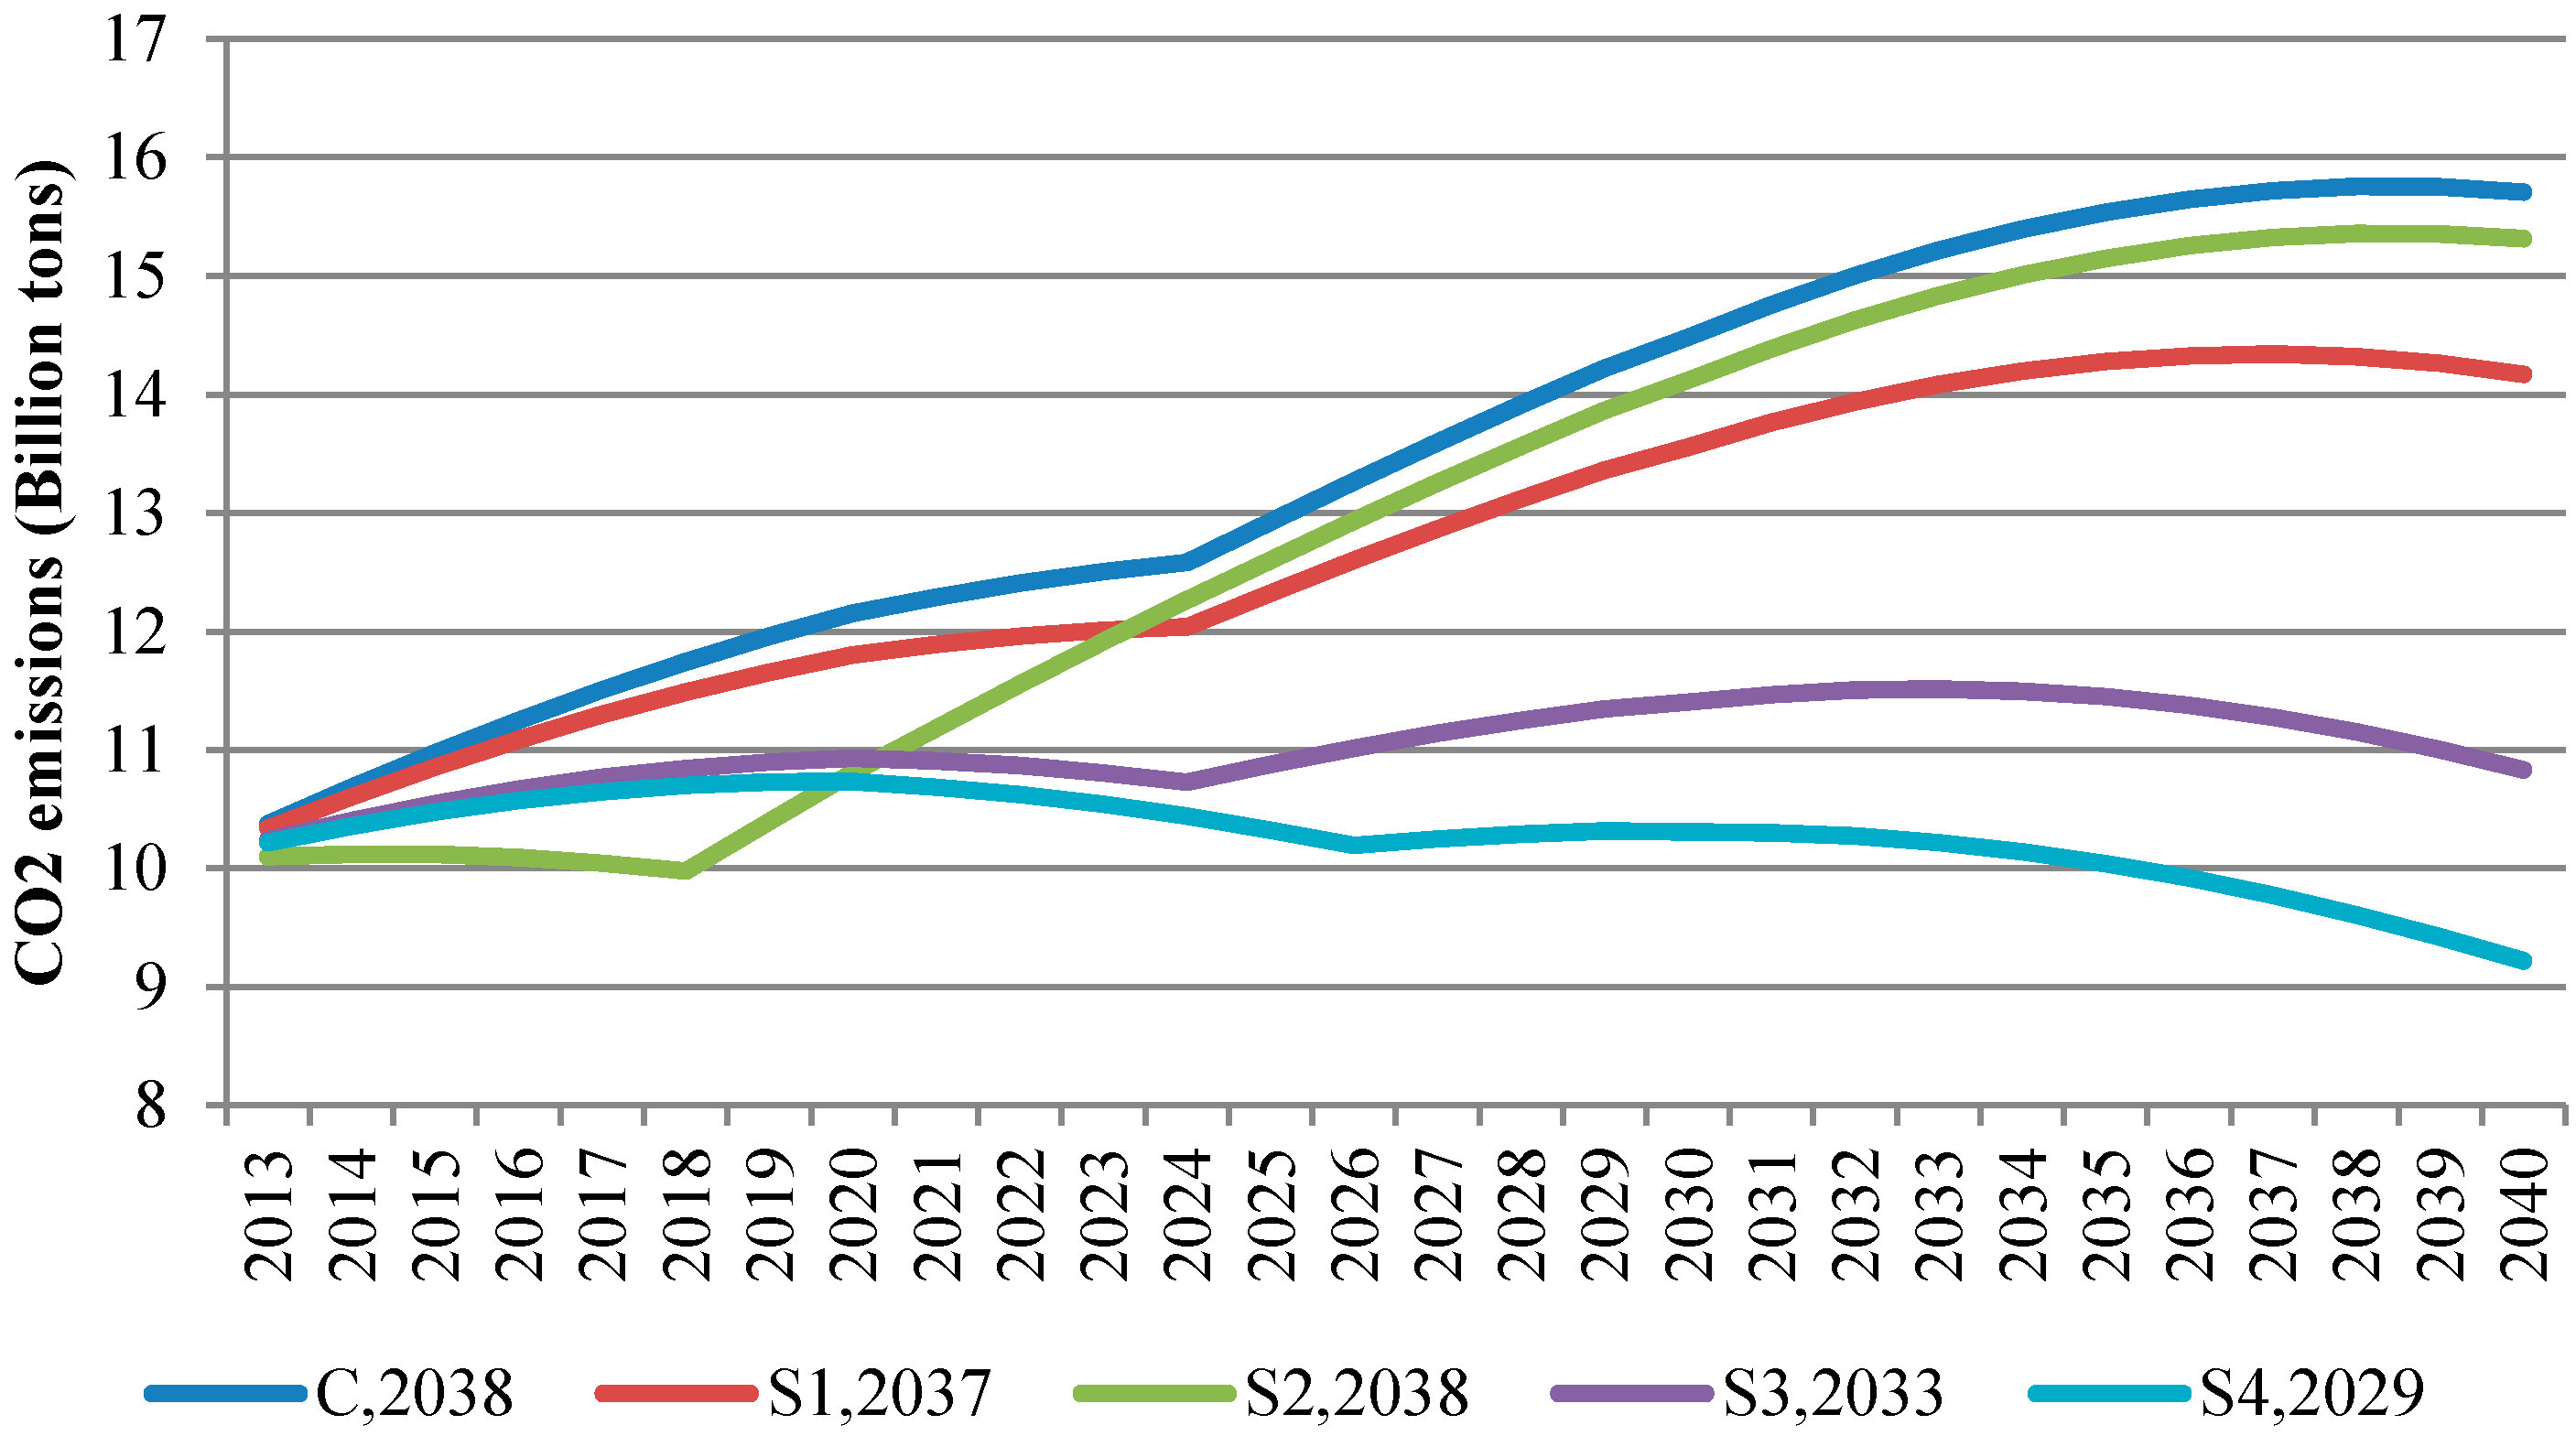
5. Results Analysis
5.1. Simulation Results Analysis

| Scenario | Variables | Growth Rate (%) | Value | ||
|---|---|---|---|---|---|
| 2020 | 2030 | 2040 | |||
| C | Ic(Billion tons) | 1.49 | 12.152 | 13.989 | 14.314 |
| FMc(%) | 0.215 | 69.405 | 67.928 | 66.480 | |
| EIelec(KWh/Yuan) | 1.00 | 0.088 | 0.080 | 0.072 | |
| CIp(gce/KWh) | 1.38 | 291 | 272 | 266 | |
| S1 | Ic(Billion tons) | 1.13 | 11.799 | 13.092 | 12.914 |
| FMc(%) | 0.43 | 68.217 | 65.340 | 62.584 | |
| EIelec(KWh/Yuan) | 1.00 | 0.088 | 0.080 | 0.072 | |
| CIp(gce/KWh) | 1.38 | 291 | 272 | 266 | |
| S2 | Ic(Billion tons) | 1.50 | 10.806 | 14.121 | 15.314 |
| FMc(%) | 0.215 | 69.405 | 67.928 | 66.480 | |
| EIelec(KWh/Yuan) | 1.00 | 0.088 | 0.080 | 0.072 | |
| CIp(gce/KWh) | 2.76 | 291 | 274 | 263 | |
| S3 | Ic(Billion tons) | 0.20 | 10.926 | 11.404 | 10.829 |
| FMc(%) | 0.215 | 69.405 | 67.928 | 66.480 | |
| EIelec(KWh/Yuan) | 2.00 | 0.082 | 0.067 | 0.055 | |
| CIp(gce/KWh) | 1.38 | 291 | 272 | 266 | |
| S4 | Ic(Billion tons) | −0.37 | 10.731 | 10.300 | 9.218 |
| FMc(%) | 1.19 | 64.161 | 56.922 | 50.500 | |
| EIelec(KWh/Yuan) | 1.19 | 0.087 | 0.077 | 0.069 | |
| CIp(gce/KWh) | 1.19 | 295 | 273 | 267 | |
| Cases | Peak CO2 Emissions Level (Billion Tons) | Peak Level Year | Growth (%) | ||
|---|---|---|---|---|---|
| FMc | EIelec | CIp | |||
| Case 1 | 12.96 | 2029 | −0.8 | −1 | −0.8 |
| Case 2 | 13.36 | 2029 | −0.7 | −0.7 | −1 |
| Case 3 | 13.51 | 2029 | −1 | −0.7 | −0.7 |
5.2. Policy Implications


6. Conclusions
Acknowledgments
Author Contributions
Conflicts of Interest
References
- IEA. CO2 Emissions from Fuel Combustion Highlights 2014. Available online: http://www.iea.org/publications/freepublications/publication/co2-emissions-from-fuel-combustion-highlights-2014.html (accessed on 19 February 2015).
- Chandran Govindaraju, V.G.R.; Chor, F.T. The dynamic links between CO2 emissions, economic growth and coal consumption in China and India. Appl. Energy 2013, 104, 310–318. [Google Scholar] [CrossRef]
- Harry, B.; Shuddhasattwa, R.; Ruhul, S. Coal consumption, CO2 emission and economic growth in China: Empirical evidence and policy responses. Energy Econ. 2012, 34, 518–528. [Google Scholar]
- Xu, Y.; Yang, C.J.; Xuan, X.W. Engineering and optimization approaches to enhance the thermal efficiency of coal electricity generation in China. Energy Policy 2013, 60, 356–363. [Google Scholar] [CrossRef]
- Cai, W.J.; Wang, C.; Wang, K.; Zhang, Y.; Chen, J.N. Scenario analysis on CO2 emissions reduction potential in China’s electricity sector. Energy Policy 2007, 35, 6445–6456. [Google Scholar] [CrossRef]
- DES-NBSC (Department of Energy Statistics, National Bureau of Statistics, China). China Energy Statistical Yearbook, 1986; China Statistical Press: Beijing, China, 1987. [Google Scholar]
- DES-NBSC (Department of Energy Statistics, National Bureau of Statistics, China). China Energy Statistical Yearbook, 1988; China Statistical Press: Beijing, China, 1989. [Google Scholar]
- DES-NBSC (Department of Energy Statistics, National Bureau of Statistics, China). China Energy Statistical Yearbook, 1991; China Statistical Press: Beijing, China, 1992. [Google Scholar]
- DES-NBSC (Department of Energy Statistics, National Bureau of Statistics, China). China Energy Statistical Yearbook, 1996; China Statistical Press: Beijing, China, 1997. [Google Scholar]
- DES-NBSC (Department of Energy Statistics, National Bureau of Statistics, China). China Energy Statistical Yearbook, 1999; China Statistical Press: Beijing, China, 2000. [Google Scholar]
- DES-NBSC (Department of Energy Statistics, National Bureau of Statistics, China). China Energy Statistical Yearbook, 2004–2013; China Statistical Press: Beijing, China, 2005–2014. [Google Scholar]
- Wang, J.J.; Li, L. Empirical Analysis on Relation between Electricity Consumption and Carbon Emission Based on Stochastic Impacts by Regression on Population, Affluence and Technology Model. Power Syst. Technol. 2014, 38, 628–632. [Google Scholar]
- Özbuğday, F.C.; Erbas, B.C. How effective are energy efficiency and renewable energy in curbing CO2 emissions in the long run? A heterogeneous panel data analysis. Energy 2015, 82, 734–745. [Google Scholar] [CrossRef]
- Jorge, R.; Claudia, S.; David, M. The structure of household energy consumption and related CO2 emissions by income group in Mexico. Energy Sustain. Dev. 2010, 14, 127–133. [Google Scholar]
- Luciano, C.F.; Shinji, K. Decomposition of CO2 emissions change from energy consumption in Brazil: Challenges and policy implications. Energy Policy 2011, 39, 1495–1504. [Google Scholar]
- Geng, Y.; Zhao, H.Y.; Liu, Z.; Xue, B.; Fujita, T.; Xi, F.M. Exploring driving factors of energy-related CO2 emissions in Chinese provinces: A case of Liaoning. Energy Policy 2013, 60, 820–826. [Google Scholar] [CrossRef]
- Yuan, B.L.; Ren, S.G.; Chen, X.H. The effects of urbanization, consumption ratio and consumption structure on residential indirect CO2 emissions in China: A regional comparative analysis. Appl. Energy 2015, 140, 94–106. [Google Scholar] [CrossRef]
- Ouyang, X.L.; Lin, B.Q. An analysis of the driving forces of energy-related carbon dioxide emissions in China’s industrial sector. Renew. Sustain. Energy Rev. 2015, 45, 838–849. [Google Scholar] [CrossRef]
- Wang, P.; Wu, W.S.; Zhu, B.Z.; Wei, Y.M. Examining the impact factors of energy-related CO2 emissions using the STIRPAT model in Guangdong Province, China. Appl. Energy 2013, 106, 65–71. [Google Scholar] [CrossRef]
- Wang, Y.N.; Zhao, T. Impacts of energy-related CO2 emissions: Evidence from under developed, developing and highly developed regions in China. Ecol. Indic. 2015, 50, 186–195. [Google Scholar] [CrossRef]
- Lin, B.; Du, K. Energy and CO2 emissions performance in China’s regional economies: Do market-oriented reforms matter? Energy Policy 2015, 78, 113–124. [Google Scholar] [CrossRef]
- Sunil, M. CO2 emissions from electricity generation in seven Asia-Pacific and North American countries: A decomposition analysis. Energy Policy 2009, 37, 1–9. [Google Scholar]
- Robert, H.; Wina, G. How much CO2 emissions do we reduce by saving electricity? A focus on methods. Energy Policy 2013, 60, 803–812. [Google Scholar]
- Betül, Ö.; Erdem, G.; Selahattin, İ. The scenario analysis on CO2 emission mitigation potential in the Turkish electricity sector: 2006–2030. Energy 2013, 49, 395–403. [Google Scholar]
- Damien, C.; Toshko, Z. Emissions targeting and planning: An application of CO2 emissions pinch analysis (CEPA) to the Irish electricity generation sector. Energy 2008, 33, 1498–1507. [Google Scholar]
- Aparna, D.; Saikat, K.P. CO2 emissions from household consumption in India between 1993–94 and 2006–07: A decomposition analysis. Energy Econ. 2015, 41, 90–105. [Google Scholar]
- Zhou, G.H.; Chung, W.; Zhang, Y.X. Carbon dioxide emissions and energy efficiency analysis of China’s regional thermal electricity generation. J. Clean. Prod. 2014, 83, 173–184. [Google Scholar] [CrossRef]
- Zhang, M.; Liu, X.; Wang, W.W.; Zhou, M. Decomposition analysis of CO2 emissions from electricity generation in China. Energy Policy 2013, 52, 159–165. [Google Scholar] [CrossRef]
- Sahbi, F.; Muhammad, S. What role of renewable and non-renewable electricity consumption and output is needed to initially mitigate CO2 emissions in MENA region? Renew. Sustain. Energy Rev. 2014, 40, 80–90. [Google Scholar]
- Odenberger, M.; Johnsson, F. Achieving 60% CO2 reductions within the UK energy system—Implications for the electricity generation sector. Energy Policy 2007, 35, 2433–2452. [Google Scholar] [CrossRef]
- Yin, J.H.; Zheng, M.Z.; Chen, J. The effects of environmental regulation and technical progress on CO2 Kuznets curve: An evidence from China. Energy Policy 2015, 77, 97–108. [Google Scholar] [CrossRef]
- Chikaraishi, M.; Fujiwara, A.; Kaneko, S.; Poumanyvong, P.; Komatsu, S.; Kalugin, A. The moderating effects of urbanization on carbon dioxide emissions: A latent class modeling approach. Technol. Forecast. Soc. Chang. 2015, 90, 302–317. [Google Scholar] [CrossRef]
- Rogan, F.; Cahill, C.J.; Daly, H.E.; Dineen, D.; Deane, J.P.; Heaps, C.; Welsch, M.; Howells, M.; Bazilian, M.; Gallachóir, B.P.Ó. LEAPs and Bounds—An Energy Demand and Constraint Optimized Model of the Irish Energy System. Energy Effic. 2014, 7, 441–446. [Google Scholar] [CrossRef]
- Feng, Y.Y.; Chen, S.Q.; Zhang, L.X. System dynamics modeling for urban energy consumption and CO2 emissions: A case study of Beijing, China. Ecol. Model. 2013, 252, 44–52. [Google Scholar] [CrossRef]
- Andrés, R.L.; Ángel, M.N.; José-Enrique, G.R.; Antonio, A.G. Studying the relationship between economic growth, CO2 emissions, and the environmental Kuznets curve in Venezuela (1980–2025). Renew. Sustain. Energy Rev. 2015, 41, 602–614. [Google Scholar]
- Ehrlich, P.; Holdren, J. The impact of population growth. Science 1971, 171, 1212–1217. [Google Scholar] [CrossRef] [PubMed]
- Dietz, T.; Rosa, E. Effects of population and affluence on CO2 emissions. Proc. Natl. Acad. Sci. USA 1997, 94, 175–179. [Google Scholar] [CrossRef] [PubMed]
- Li, H.N.; Mu, H.L.; Zhang, M.; Gui, S.S. Analysis of regional difference on impact factors of China’s energy—Related CO2 emissions. Energy 2012, 39, 319–326. [Google Scholar] [CrossRef]
- Wang, Y.N.; Zhao, T. Impacts of energy-related CO2 emissions: Evidence from under developed, developing and highly developed regions in China. Ecol. Indic. 2015, 50, 186–195. [Google Scholar] [CrossRef]
- Salim, R.A.; Shafiei, S. Urbanization and renewable and non-renewable energy consumption in OECD countries: An empirical analysis. Econ. Model. 2014, 38, 581–591. [Google Scholar] [CrossRef]
- Shafiei, S.; Salim, R.A. Non-renewable and renewable energy consumption and CO2 emissions in OECD countries: A comparative analysis. Energy Policy 2013, 66, 547–556. [Google Scholar] [CrossRef]
- Meng, M.; Niu, D.X.; Shang, W. CO2 emissions and economic development: China’s 12th five-year plan. Energy Policy 2012, 42, 468–475. [Google Scholar] [CrossRef]
- Li, H.N.; Mu, H.L.; Zhang, M.; Li, N. Analysis on influence factors of China’s CO2 emissions based on Path–STIRPAT model. Energy Policy 2011, 39, 6906–6911. [Google Scholar] [CrossRef]
- Tan, Z.F.; Li, L.; Wang, J.J.; Wang, J.H. Examining the driving forces for improving China’s CO2 emission intensity using the decomposing method. Appl. Energy 2011, 88, 4496–4504. [Google Scholar] [CrossRef]
- Xu, J.H.; Fan, Y.; Yu, S.M. Energy conservation and CO2 emission reduction in China’s 11th Five-Year Plan: A performance evaluation. Energy Econ. 2014, 46, 348–359. [Google Scholar] [CrossRef]
- NBSC (National Bureau of Statistics, China). China Statistical Yearbook 2013; China Statistical Press: Beijing, China, 2014. [Google Scholar]
- Phillips, P.C.B.; Moon, H.R. Linear regression limit theory for nonstationary panel data. Econometrica 1999, 67, 1057–1112. [Google Scholar] [CrossRef]
- IEA. World Energy Outlook 2014. Available online: http://www.worldenergyoutlook.org/publications/weo-2014 (accessed on 30 March 2015).
- Jiang, K.J.; Hu, X.L.; Zhuang, X.; Liu, Q. The 2050 low carbon scenario of China and low carbon developing path. Sino-Glob. Energy 2009, 14, 1–7. [Google Scholar]
© 2015 by the authors; licensee MDPI, Basel, Switzerland. This article is an open access article distributed under the terms and conditions of the Creative Commons Attribution license (http://creativecommons.org/licenses/by/4.0/).
Share and Cite
Li, L.; Wang, J. The Effects of Coal Switching and Improvements in Electricity Production Efficiency and Consumption on CO2 Mitigation Goals in China. Sustainability 2015, 7, 9540-9559. https://0-doi-org.brum.beds.ac.uk/10.3390/su7079540
Li L, Wang J. The Effects of Coal Switching and Improvements in Electricity Production Efficiency and Consumption on CO2 Mitigation Goals in China. Sustainability. 2015; 7(7):9540-9559. https://0-doi-org.brum.beds.ac.uk/10.3390/su7079540
Chicago/Turabian StyleLi, Li, and Jianjun Wang. 2015. "The Effects of Coal Switching and Improvements in Electricity Production Efficiency and Consumption on CO2 Mitigation Goals in China" Sustainability 7, no. 7: 9540-9559. https://0-doi-org.brum.beds.ac.uk/10.3390/su7079540