Article

SDI and Markov Chains for Regional Drought Characteristics

1
Department of Resources Engineering, National Cheng Kung University, Tainan 70101, Taiwan
2
Three Gorges Research Center for Geo-hazard, China University of Geosciences, Wuhan 430074, China
*
Author to whom correspondence should be addressed.
Sustainability 2015, 7(8), 10789-10808; https://0-doi-org.brum.beds.ac.uk/10.3390/su70810789
Submission received: 22 May 2015 / Revised: 21 July 2015 / Accepted: 5 August 2015 / Published: 7 August 2015

Abstract

:
In recent years, global climate change has altered precipitation patterns, causing uneven spatial and temporal distribution of precipitation that gradually induces precipitation polarization phenomena. Taiwan is located in the subtropical climate zone, with distinct wet and dry seasons, which makes the polarization phenomenon more obvious; this has also led to a large difference between river flows during the wet and dry seasons, which is significantly influenced by precipitation, resulting in hydrological drought. Therefore, to effectively address the growing issue of water shortages, it is necessary to explore and assess the drought characteristics of river systems. In this study, the drought characteristics of northern Taiwan were studied using the streamflow drought index (SDI) and Markov chains. Analysis results showed that the year 2002 was a turning point for drought severity in both the Lanyang River and Yilan River basins; the severity of rain events in the Lanyang River basin increased after 2002, and the severity of drought events in the Yilan River basin exhibited a gradual upward trend. In the study of drought severity, analysis results from periods of three months (November to January) and six months (November to April) have shown significant drought characteristics. In addition, analysis of drought occurrence probabilities using the method of Markov chains has shown that the occurrence probabilities of drought events are higher in the Lanyang River basin than in the Yilan River basin; particularly for extreme events, the occurrence probability of an extreme drought event is 20.6% during the dry season (November to April) in the Lanyang River basin, and 3.4% in the Yilan River basin. This study shows that for analysis of drought/wet occurrence probabilities, the results obtained for the drought frequency and occurrence probability using short-term data with the method of Markov chains can be used to predict the long-term occurrence probability of drought/wet events.

1. Introduction

Climate change is the biggest threat to human society in the 21st century. A report of the Intergovernmental Panel on Climate Change (IPCC) has pointed out, based on temperature observations over the past 133 years, that from 1880 to 2012, the global mean surface temperature has increased by 0.85 °C, along with significant regional differences. The rate of temperature increase has quickened significantly over the past 62 years of observations; the rate of temperature increase from 1951 to 2012 was 0.12 °C per ten years. This accelerated warming situation intensifies changes in the global water cycle, giving rise to an upward trend in average global precipitation, evapotranspiration, and surface runoff [1]. The impact of global warming would not change the mean values of hydrological factors, but would increase the occurrence probability and frequency of extreme events. Among extreme events, droughts are the slowest to develop, but also the longest to last. In addition, among meteorological disasters, extreme droughts are the most predictable [2].
There are different definitions of drought based on different hydrological, meteorological, and socio-economic factors. Therefore, in studying drought characteristics, an appropriate definition of drought should be determined to match specific research goals [3]. Common definitions of drought include the following: (1) according to the World Meteorological Organization, drought is a phenomenon caused by a rainfall deficit in terms of duration and persistence [4]; (2) according to the UN Convention to Combat Desertification, drought is defined as a natural phenomenon that occurs when precipitation is significantly lower than the normally recorded value, causing a hydrological imbalance that affects land resources and the production system [5]; (3) according to the Food and Agriculture Organization of the UN, drought is defined as the percentage of crops that wither in a year because of insufficient soil water [6]. Different definitions of drought are selected mainly based on the use of different hydrological and meteorological variables for evaluation. Therefore, types of droughts can be categorized according to hydrological and meteorological variables.
Generally speaking, droughts can be divided into four types according to different hydrological and meteorological variables, and evaluation goals: (1) meteorological drought, referring to the phenomenon associated with deficient precipitation over a certain period in the same region; (2) hydrological drought, referring to deficient surface or subsurface water supply for the water management system; (3) agricultural drought, referring to reduced soil water for a period that results in reduced final crop yield; and (4) socioeconomic drought referring to insufficient water supply in water resource systems because of climate, equipment, or manual operation factors, causing socioeconomic problems [2]. In order to understand the process of hydrological drought and its impact, many variables need to be analyzed in detail, including the time of occurrence, severity, duration, and spatial distribution using different methods [2,7,8,9,10,11,12,13,14]. Many scholars have proposed drought-monitoring methods in different areas, aiming to explore these factors. Drought-monitoring methods for meteorological drought include the standardized precipitation index (SPI) [15] and reconnaissance drought index (RDI) [16]. In addition, methods for analyzing hydrological drought include the Palmer drought severity index (PDSI) [17], surface water supply index (SWSI) [18], streamflow drought index (SDI) [19], and standardized hydrologic indicator (SHI) [20]. Methods for analyzing agricultural drought include the crop moisture index (CMI) [21] and agricultural reference index for drought (ARID) [22].
Among the drought monitoring methods, Nalbantis (2008) proposed the method of SDI, which analyzes drought characteristics based on cumulative streamflow volumes. Advantages of this method include simplicity and high effectiveness. This method has been used to analyze the drought characteristics of many countries such as the United States [23], India [24], Iran [13,25,26], Iraq [13], and Greece [19,27,28]. In this study, the SDI method was employed to study the drought characteristics of Taiwan.
The average annual precipitation in Taiwan is about 2500 mm, which is about 2.6 times that of the world. Although the precipitation is heavy in the Taiwan area, the area has such a small territory with a large population, that the annual precipitation assigned per capita is only 1/7 of the world average [29]. Taiwan is ranked as the 18th most water-stressed among the 146 countries in the world being assessed by the environment sustainability index (ESI) [30]. In addition, the spatial and temporal distribution of rainy seasons is extreme in Taiwan, with rainfall mainly concentrated from May to October. A large amount of rainfall flows into the oceans by riverflow down the steep mountain slopes in Taiwan, making effective accumulation of water resources impossible. In recent years, because of climate change and increased temperatures, there has been increased precipitation during the wet season in Taiwan, while precipitation has decreased during the dry season, resulting in more extreme wet and dry seasons [31]. Because of this, the difference in streamflow volumes between wet and dry seasons has become larger, leading to drought occurrences.
Since northern Taiwan is densely populated, it has a high demand for water. However, in recent years there have been abrupt climate anomalies caused by climate changes, resulting in considerable lack of water during winter and spring, which used to be the rainy seasons [32]. Therefore, in order to lower the impact of climate change on water usage, effective study and management of the hydrological information in the northern region is necessary. Yeh et al. [33] used the Mann-Kendall test, Theil-Sen estimator, Mann-Whitney-Pettit test and the cumulative deviation test to investigate the streamflow trend characteristics in northern Taiwan. The Mann-Kendall test was used to analyze the streamflow trend [34,35,36,37,38,39], and the Theil-Sen estimator was used to calculate the trend slopes to obtain the extent of trend changes [40,41,42,43,44].The Mann-Whitney-Pettit test and the cumulative deviation test, two tests commonly used in hydrology analyses, are used to find the change points [43,45,46,47]. Yeh et al. [33] found from long-term streamflow data that the average annual streamflow in the Lanyang River basin had a significant downward trend. Therefore, in this study, SDI was used to study the long-term distribution of drought events in northern Taiwan. In addition, the drought occurrence probabilities were calculated using the Markov chain method.

2. Study Methods

2.1. Streamflow Drought Index (SDI)

The SDI method was proposed by Nalbantis [19], and is used to assess drought severity. Cumulative streamflow volumes from different time periods are used to study the distribution and variation of drought severity at different time durations, from which the drought severity of the study area, frequency of drought occurrence, and occurrence of cycles are obtained. In this method, it is first assumed that the time series of monthly streamflow volumes (Qij) are successive, which are then accumulated according to the time duration k. The cumulative streamflow volume for the i-th hydrological year for a duration k is obtained:
V i , k = j   =   1 3 k Q i j   i = 1, 2, …,   j = 1, 2, …, 12,   k = 1, 2, 3, 4
where i refers to the hydrological year, j refers to the month of that year, k refers to the time duration of the period, and Vi,k is the cumulative streamflow volume for the i-th hydrological year with a period duration of k. Next, the SDI for the i-th hydrological year with period duration k is defined using the cumulative streamflow volumes Vi,k as follows:
SDI i , k = V i , k V k ¯ s k   i = 1, 2, …,   k = 1, 2, 3, 4
where V k ¯ and sk are the long-term mean and standard deviation of cumulative streamflow volumes, respectively.
When assessing an SDI value, the data for analysis must follow a normal or log-normal distribution. However, in small basins, streamflows might follow a skewed probability distribution, whose distribution pattern is similar to that of the Gamma distribution. Therefore, when using SDI to analyze streamflow data, the first step is to transform the statistical distribution. In this study, the two-parameter log-normal distribution was used for transformation, and natural logarithms of the streamflow data were taken. The SDI index was redefined as [19]:
SDI i , k = y i , k y k ¯ s y ,   k   i = 1, 2, …,   k = 1, 2, 3, 4
y i , k = ln ( V i , k ) i = 1, 2, …,   k = 1, 2, 3, 4
where yj,k are the natural logarithms of cumulative streamflow with mean y k and standard deviation sy,k.
The calculated SDI values for each year are categorized based on the range for which different drought severities are defined. In this study, the major reference source was the range for different drought severities proposed by Al-Faraj et al. [13], based on which divisions of different dry and wet event severities were made (Table 1).
Table 1. SDI criteria for drought event severities [13].
StateDescriptionCriterion
3Extreme wetSDI     2.0
2Severe wet1.5   SDI 2.0
1Moderate wet1.0   SDI 1.5
0Near normal−1.0   SDI 1.0
−1Moderate drought−1.5   SDI −1.0
−2Severe drought−2.0   SDI −1.5
−3Extreme droughtSDI −2.0

2.2. Markov Chains Evaluation Method

Markov chains [48] are commonly used to assess drought occurrence probability, and to evaluate and predict the time of occurrence of a drought event [49,50,51,52]. In this study, this method was used to examine changes in drought severity at different time scales, and to predict the occurrence probability for each degree of severity.
First, the SDI value for each year was calculated according to Equation (3), and the event severity m of each year was obtained according to the criteria for severity ranges listed in Table 1. The result obtained can define the frequency of occurrence Fm,k of severity m with a duration of k:
F m , k = n m , k N
where nm,k is the number of occurrences of an event of severity m with time duration k within the sample N years. Next, the occurrence probability pm,k of severity m over duration k was defined as:
p m , k = P ( X i , k = m )   m [ 3 , 2 , 1 , 0 , 1 , 2 , 3 ]
where P(.) refers to the occurrence probability of an event of severity m when the time duration is k, and Xi,k refers to the event of severity m when the period duration is k. For each k, the probabilities pm,k for severities (m = 3, 2, 1, 0, −1, −2, −3) form a 7 × 1 matrix.
The equation above assesses the frequency and probability of occurrence within the same year. On the other hand, event severity changes with different durations of time. Therefore, we will next discuss the frequency and probability of transition for event severities when the time duration for analysis changes. When the time duration k transitions to k + 1, the frequency of severity transition Fm,m’,k for the respective severity m’ to m is:
F m , m , k = n m , m , k m n m , m , k
where nm,m’,k is the number of occurrences of severity m transitioning to m’ when the period duration k transitions to k + 1. The transition probability pm,m’,k for severity m to m’ when the duration k transitions to k + 1 is then defined as:
p m , m , k = P ( X i , k + 1 = m   |   X i , k = m ) m = m [ 3 , 2 , 1 , 0 , 1 , 2 , 3 ]
where P(.|.) refers to the probability for the transition of event severity m to m’ when the duration k transitions to k + 1. For each k, the transition probability Pk forms a 7 × 7 matrix.
p k + 1 = P k · p k
As can be seen from the descriptions above, the Markov chain method can be used to conduct the following evaluations: (1) to evaluate the frequency and probability of drought occurrence with different durations based on available historical data; (2) to observe the frequency and probability of event severity transition at different durations; and (3) to estimate the long-term occurrence probability of different events using short-term data. In this study, the method of Markov chains was used to evaluate the occurrence probability of drought/rain events at different analysis times in the study area.

3. Study Area

In this study, the northern water resource regions listed by the Water Resources Agency of the Ministry of Economic Affairs were selected as the study area. These regions include the following administrative areas: Yilan County, Keelung City, New Taipei City, Taipei City, Taoyuan County, and Hsinchu County. The regions contain five terrain types, namely, plains, hills, highlands, basins, and mountains. Regions featuring plains primarily comprise the Taoyuan alluvial fan, the Hsinchu Plains, and the Eastern Yilan delta; regions containing hills consist of the Keelung Hills and the Zhudong Hills; regions with highlands include the Linkou plateau; regions with basins include the Taipei basin; and regions featuring mountains primarily comprise the northernmost Tatun Mountains and the Central Backbone Range. These regions embody a variety of terrain characteristics; terrains ranging from those less than 100 m in elevation (plains), to less than 500 m in elevation (hills), and to more than 1000 m in elevation (mountains).
Rainfall in the northern regions of Taiwan during the summer and winter seasons primarily comes from typhoons and northeast monsoons, respectively. The northern Taiwan regions receive rainfall all year long. For example, the Yilan region can have up to 350 days of rainfall. The average annual rainfall in the northern regions of Taiwan is 2937 mm, which is higher than that in central, southern, and eastern Taiwan.
The main rivers in the northern Taiwan regions are the Tamsui River, the Lanyang River, the Fengshan River, and the Touqian River, which have drainage basin areas of 2726, 978, 250, and 566 km2, respectively. The historical overall average annual streamflow is approximately 15.1 × 10⁹ m3, which is lower than those of the central, southern, and eastern regions. Historical data show a significant difference in the Northern Taiwan region streamflow between the dry and wet seasons, where the overall streamflows are approximately 5.62 × 10⁹ m3 and 9.48 × 10⁹ m3 during the dry (November to April) and wet (May to October) seasons, respectively [53]. 
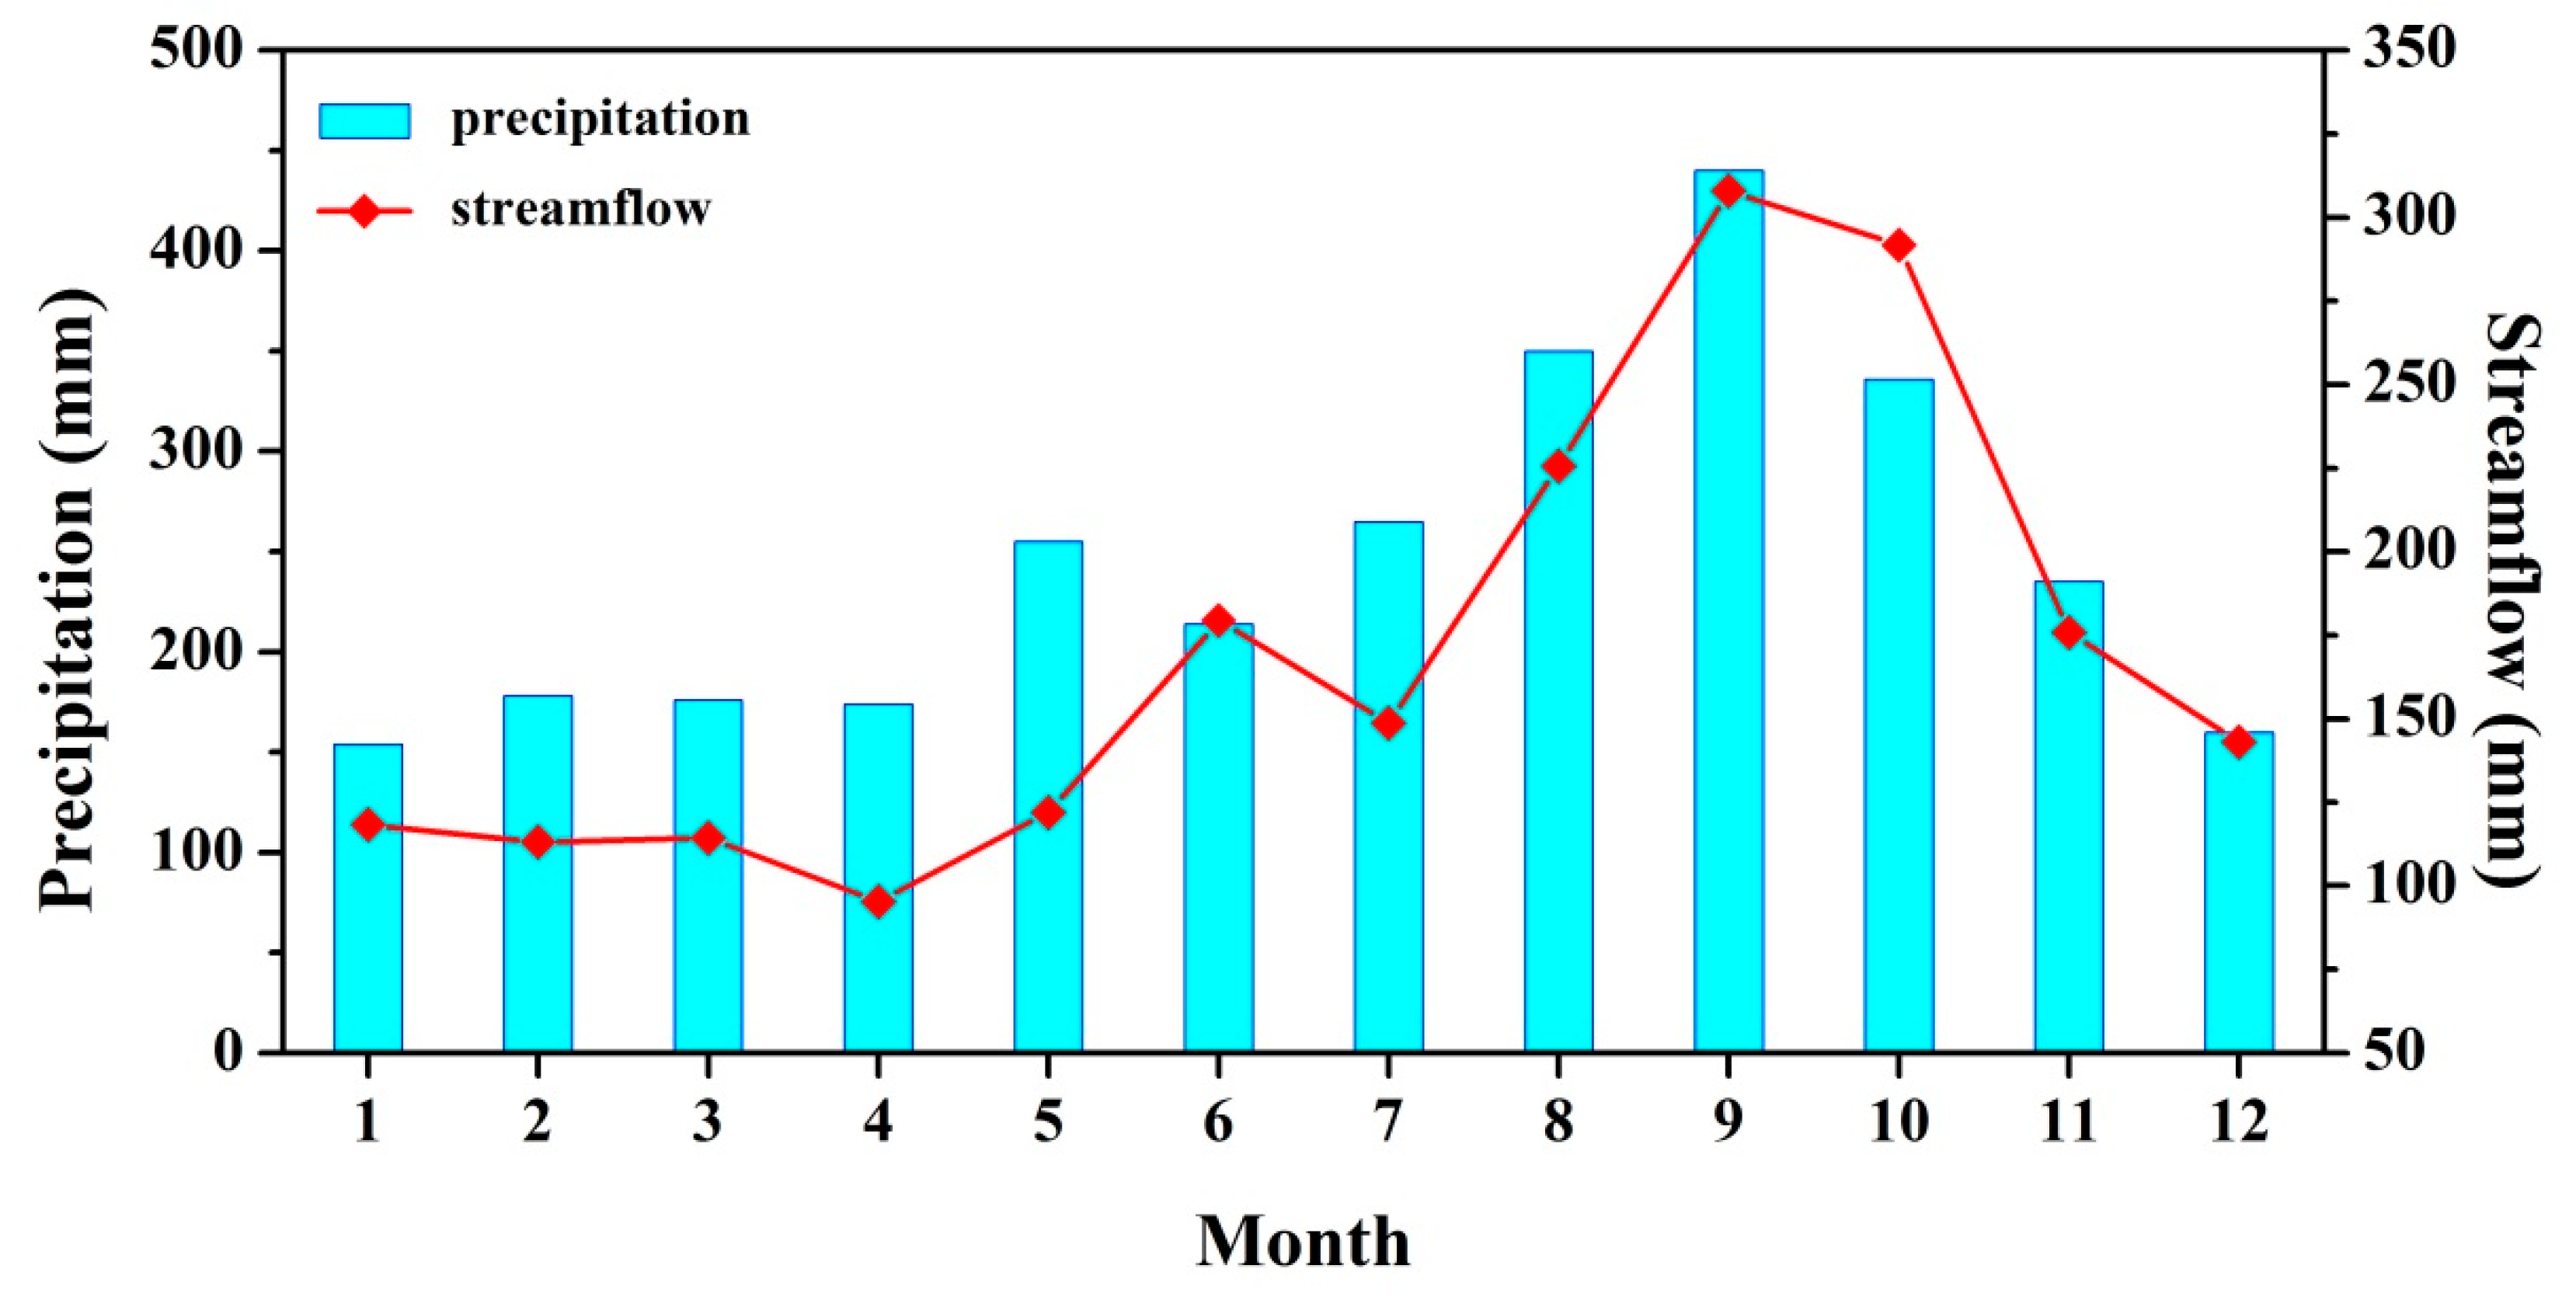
Figure 1 shows the distributions of streamflow volumes and precipitation in the northern region. It is shown that the distributions of streamflow and precipitation have similar trends in each month; in months with greater precipitation, there is also an increase in streamflow volume.
Figure 1. The distributions of streamflow volumes and precipitation in the northern region.
Sustainability 07 10789 g001
Yeh et al. [
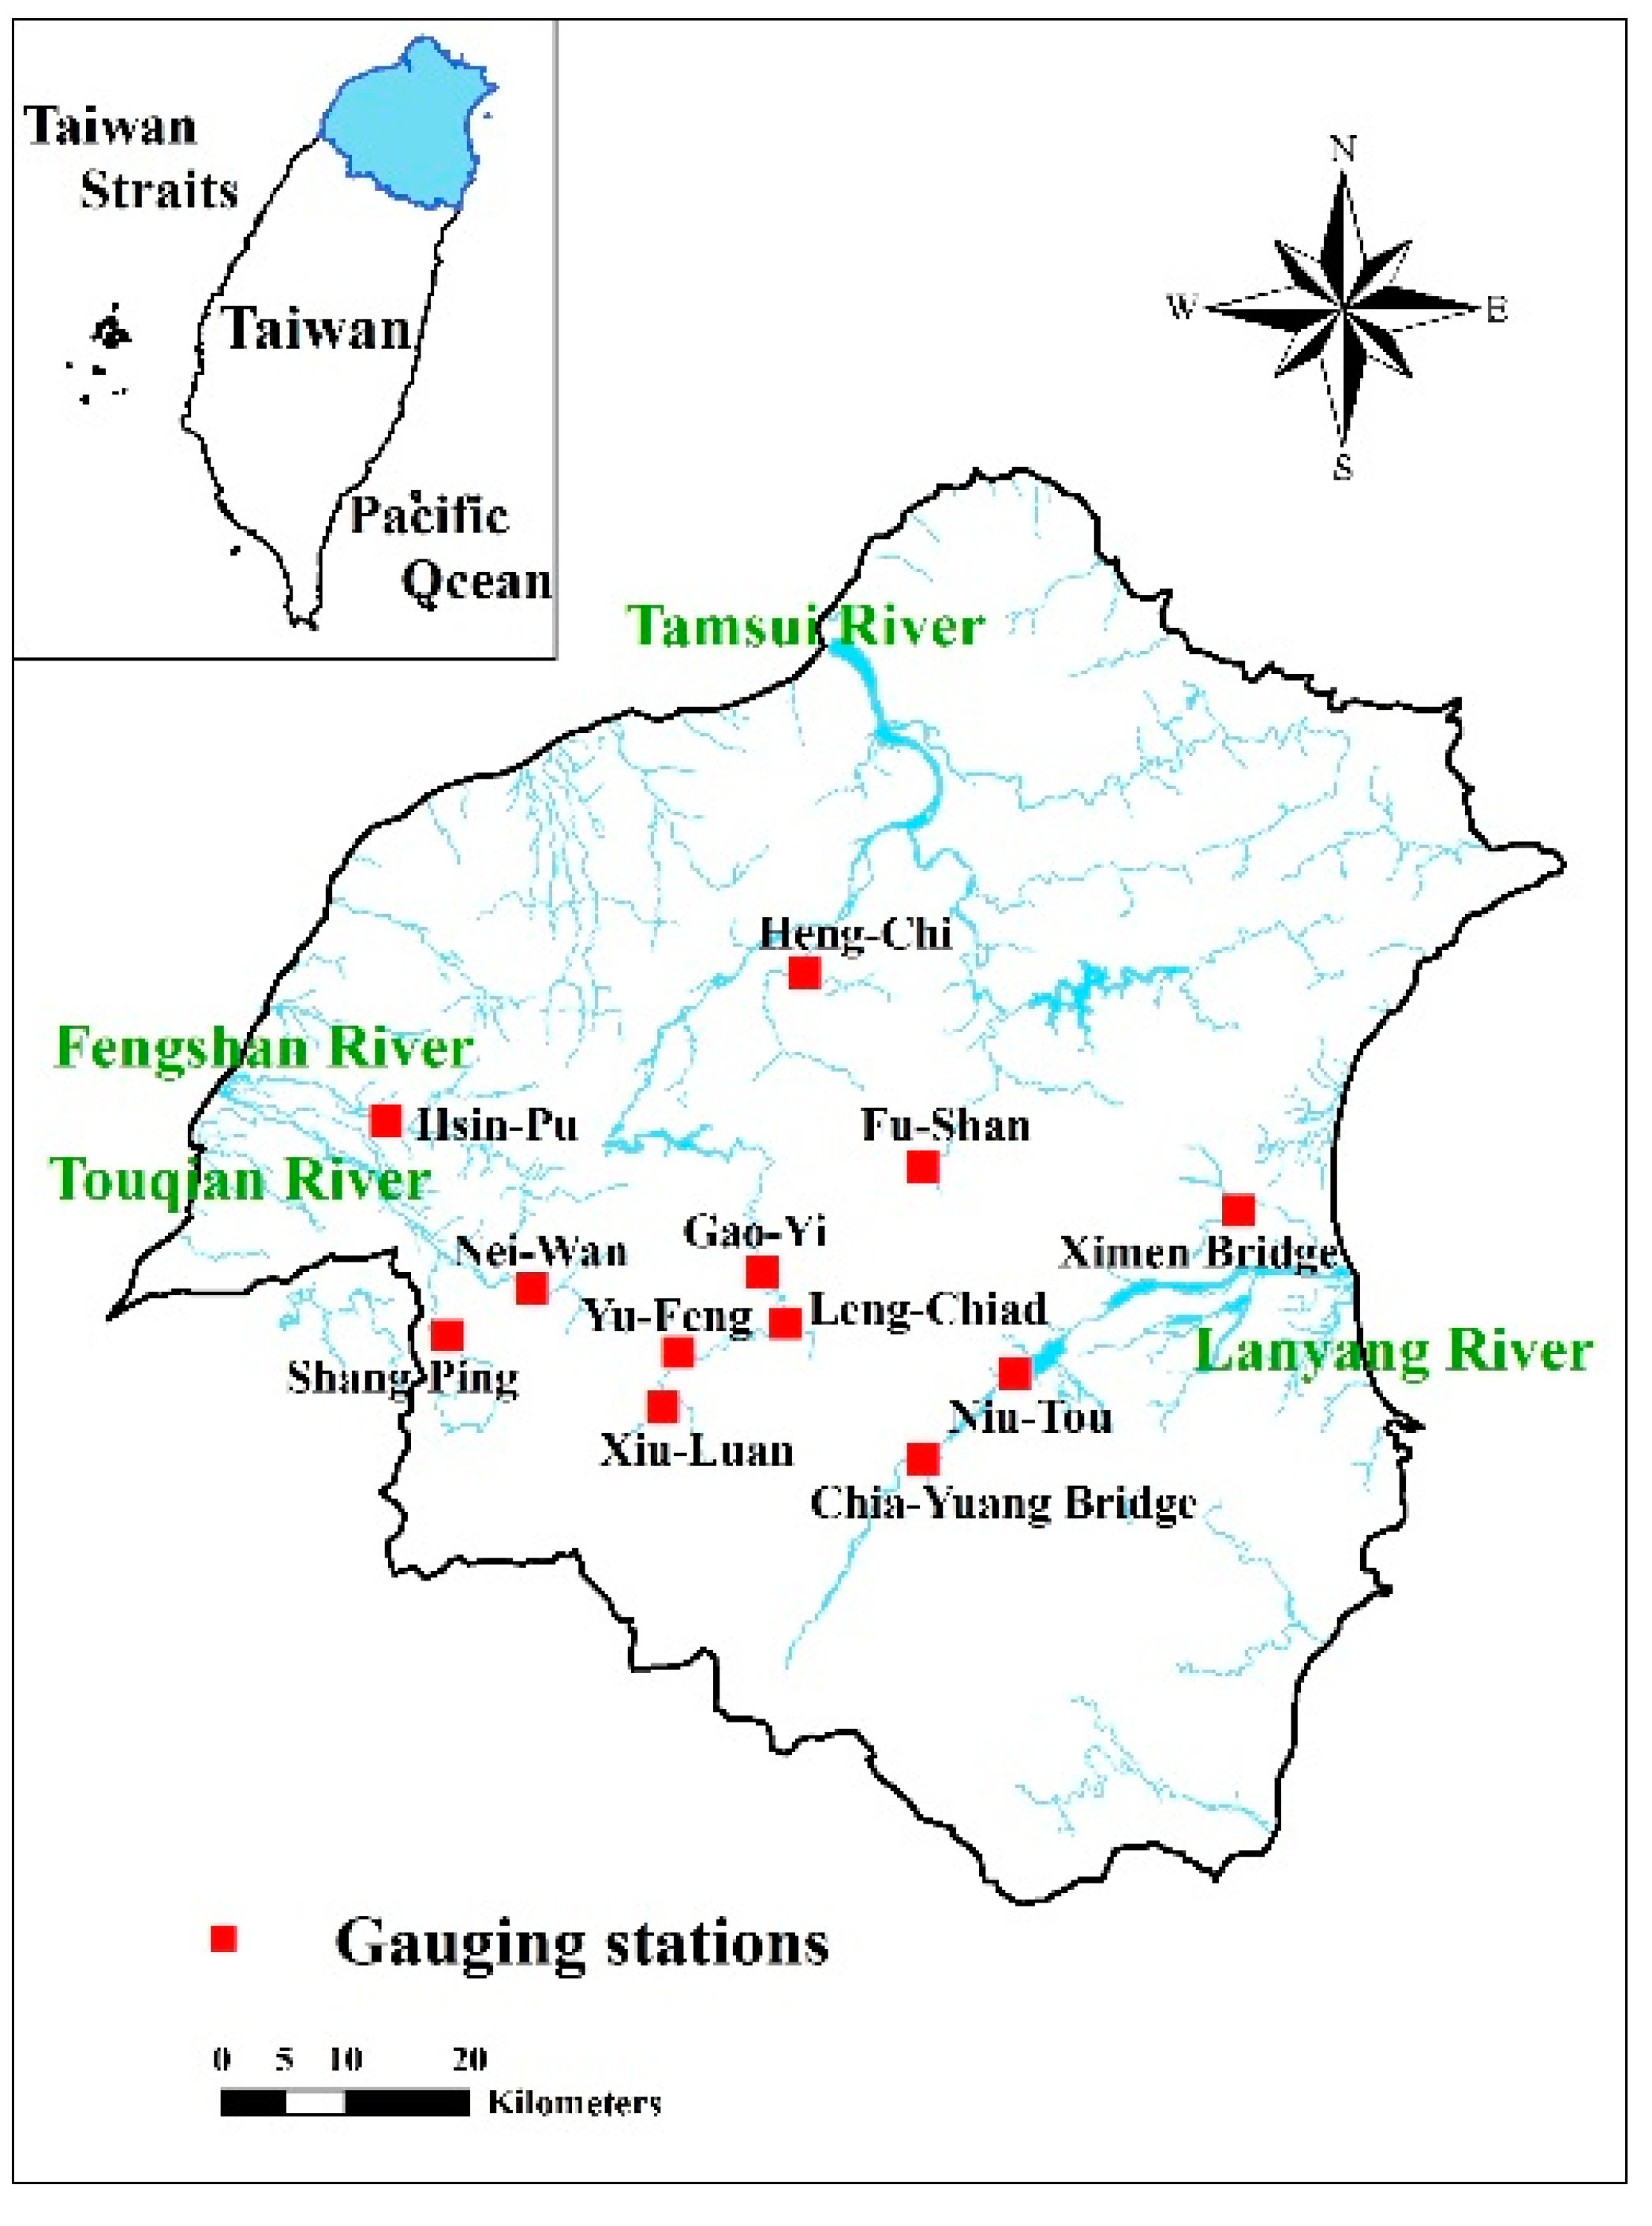
33] used the Mann-Kendall test to analyze the streamflow data recorded over 30 years from 12 gauge stations in the northern region, which are not affected by artificial water conservancy facilities, in order to explore the streamflow trend characteristics in the northern region. Table 2 and Figure 2 respectively show the details and spatial distribution of these stations. The results showed that only the Ximen bridge station in the Lanyang River basin exhibits a significant downward streamflow trend, with a test value of −3.51.
Figure 2. Spatial distribution of gauge stations in northern region.
Sustainability 07 10789 g002
Table 2. Information on gauge stations in northern region.
RiverGauging StationArea (km2)TMXTMYRecord Length
Lanyang RiverNiu-Tou446.7306,388.42,726,3211979–2013
Chia-Yuang Bridge273.5298,984.72,719,3621974–2012
Ximen Bridge101.4324,454.82,739,3771984–2013
Tamsui RiverYu-Feng335.3279,345.52,727,961.81957–2002
Leng-Chiad107.8288,011.12,730,3271957–2002
Fu-Shan160.4298,991.32,742,949.31953–2012
Xiu-Luan115.9278,064.92,723,555.81957–2002
Gao-Yi542.0286,029.32,734,394.21957–2002
Heng-Chi52.9289,452.42,758,619.31958–2012
Fengshan RiverHsin-Pu208.1255,810.32,746,6761970–2012
Touqian RiverNei-Wan139.1267,503.32,733,0841971–2012
Shang-Ping221.7260,738.52,729,3301971–2012
Note: TMX: Transverse Mercator X axis (horizontal east/west); TMY: Transverse Mercator Y axis (vertical north/south).
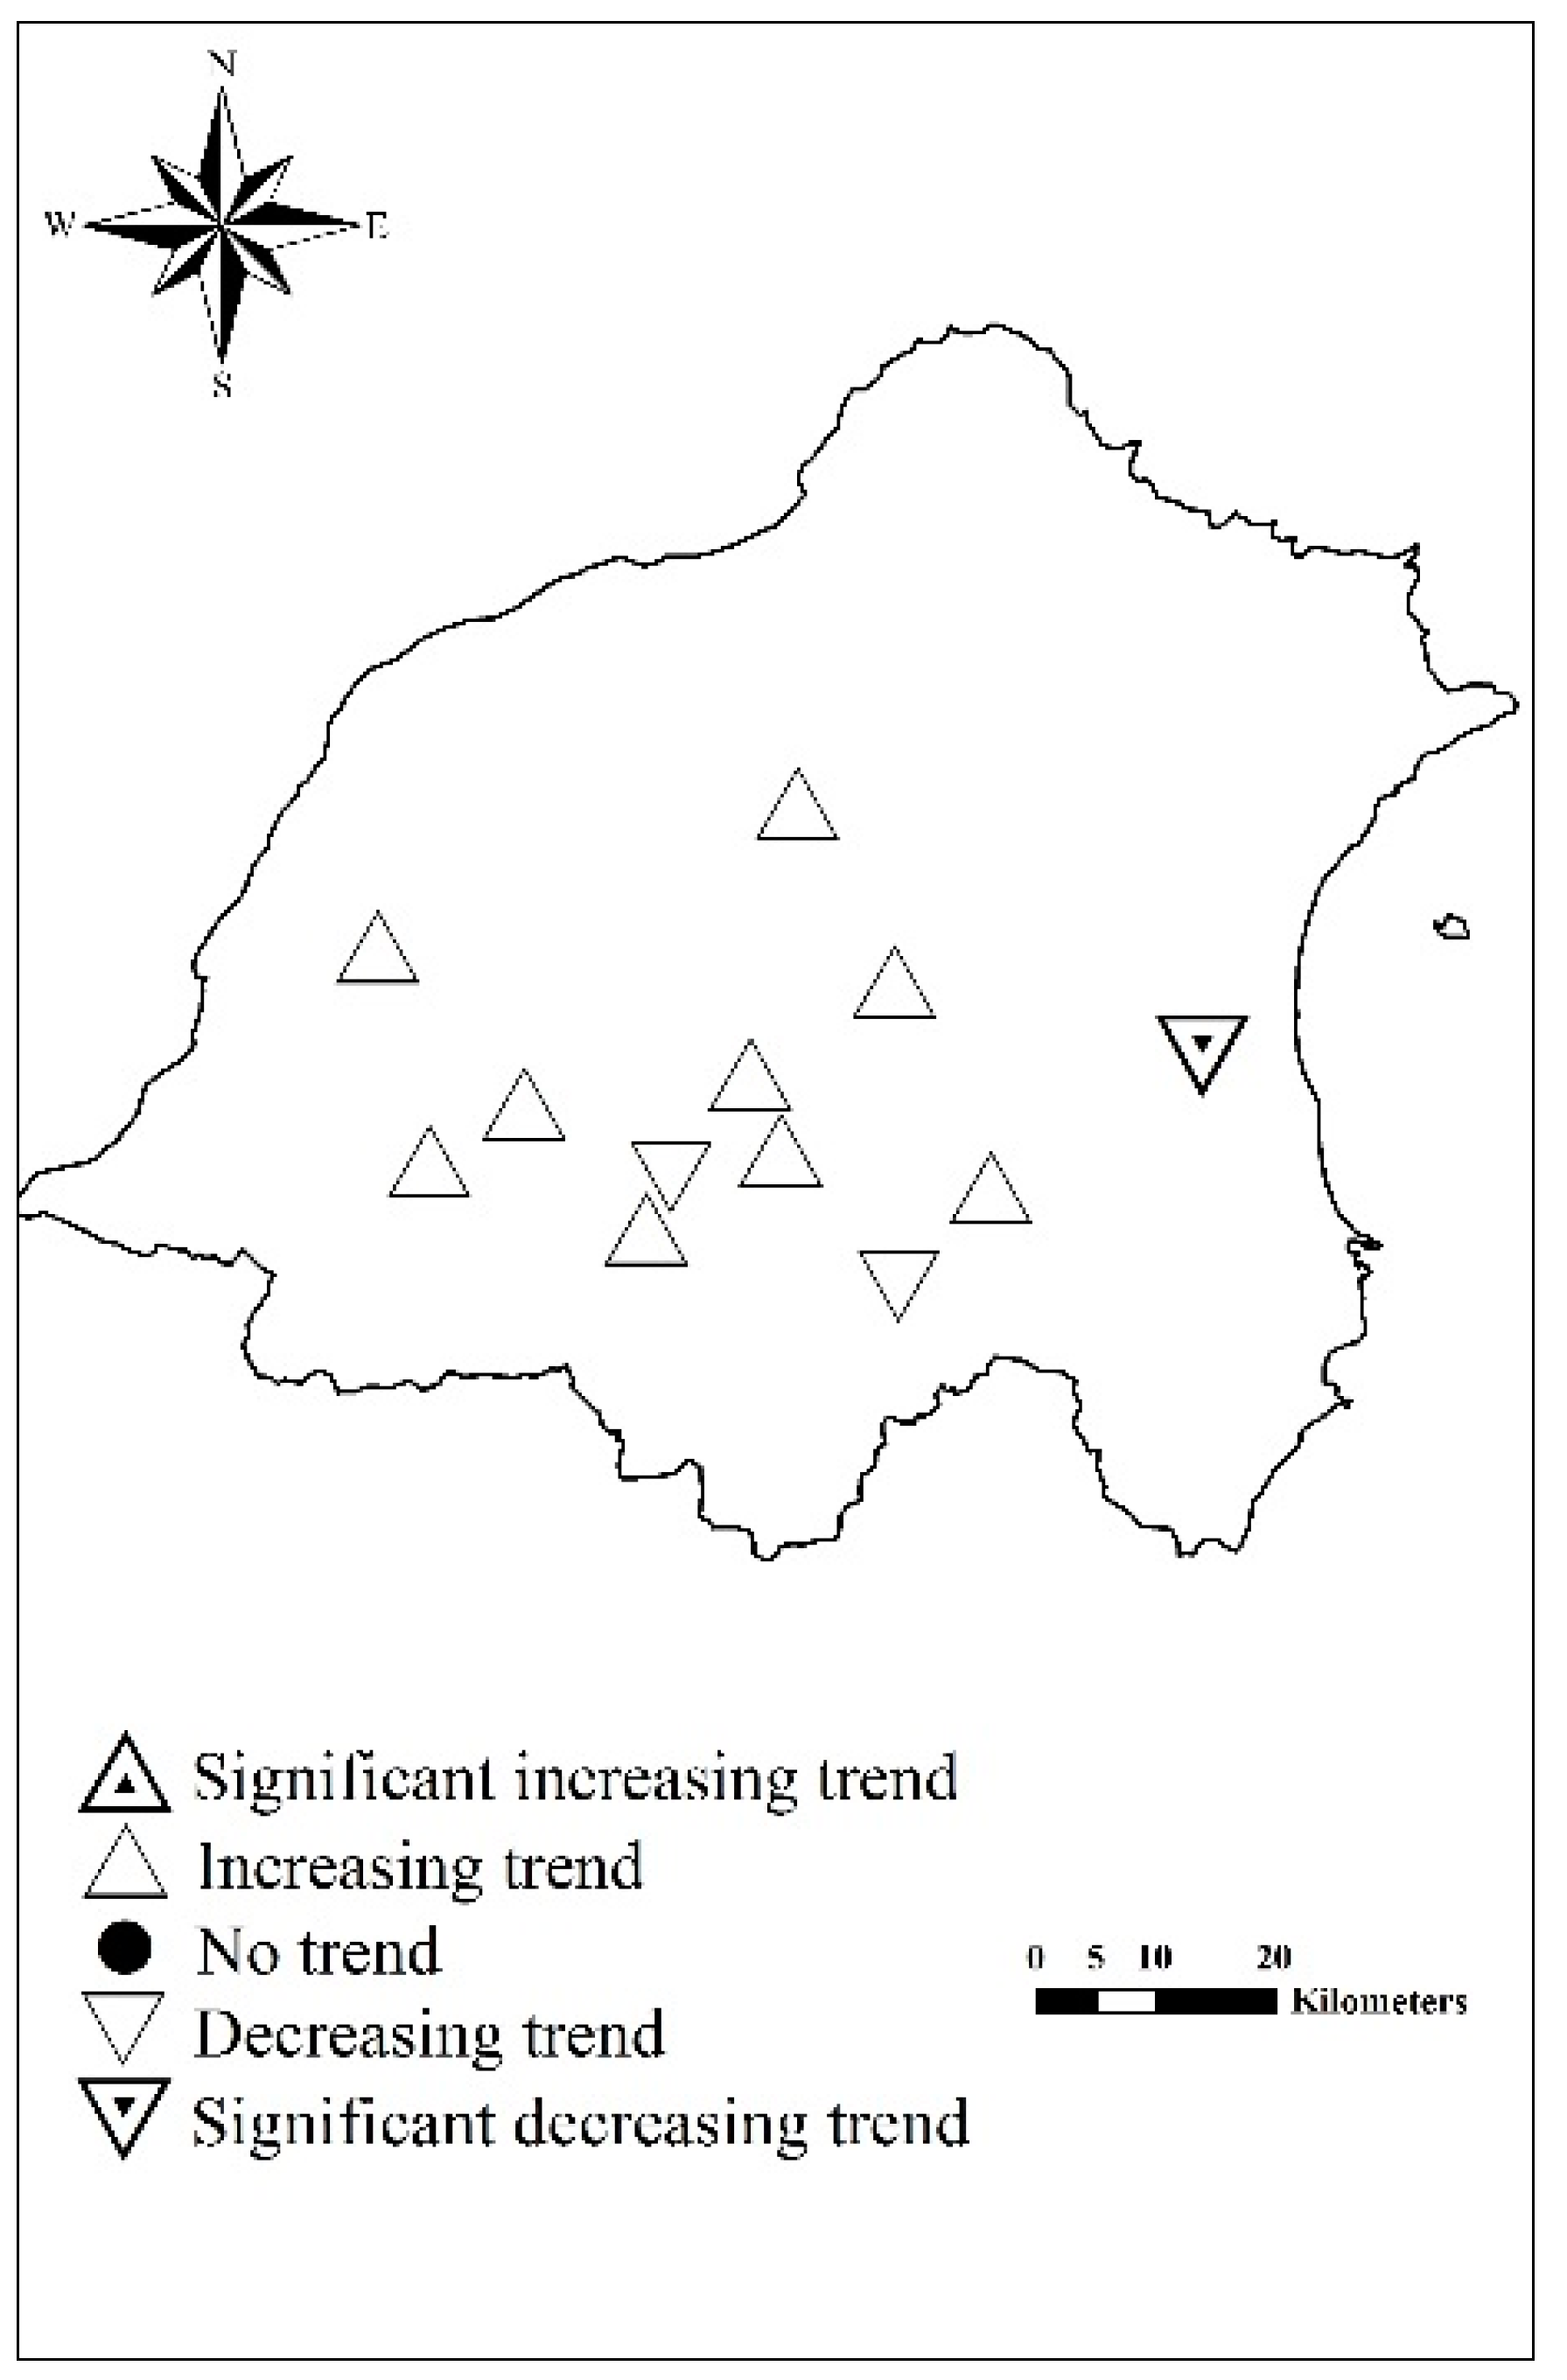
Figure 3 shows the trend of spatial distribution for each gauge station. They used the Theil-Sen estimator method, and the results showed that the amounts of change in the Tamsui River and Fengshan River basins were lesser than those of the Lanyang River and Touqian River basins, with both less than 17.0%. Among the three gauge stations in the Lanyang River basin, the changes at the Niu-Tou and Ximen bridge stations were significantly greater than that of the Chia-Yuang bridge station; the Niu-Tou station exhibited an increase of 30.3%, and the Ximen bridge station exhibited a decrease of 85.7%. Within the Touqian River basin, the Nei-Wan station exhibited an upward increase of 19.9%, and the Shang-Ping station showed an upward increase of 28.6% (Table 3).
Table 3. Information on gauge stations in northern region.
RiverGauging StationRecord LengthMann-Kendall Test ResultSlope EstimatorRelative Change Within the Records
Lanyang RiverNiu-Tou1979–20100.890.15830.3%
Chia-Yuang Bridge1974–2012−0.73−0.049−9.8%
Ximen Bridge1983–2012−3.51 *−0.294−85.7%
Tamsui RiverYu-Feng1957–2002−0.04−0.004−1.0%
Leng-Chiad1957–20020.830.0021.3%
Fu-Shan1953–20121.890.06316.7%
Xiu-Luan1957–20020.550.01410.7%
Gao-Yi1957–20020.150.0101.5%
Heng-Chi1958–20121.020.01011.2%
Fengshan RiverHsin-Pu1970–20120.570.02611.4%
Touqian RiverNei-Wan1971–20120.930.04719.9%
Shang-Ping1971–20121.280.00928.6%
Note: * indicates the significant trends. The positive values represent increasing trends, and the negative ones represent decreasing trends.
Figure 3. Map showing spatial variation in trends in annual mean flows [33].
Sustainability 07 10789 g003
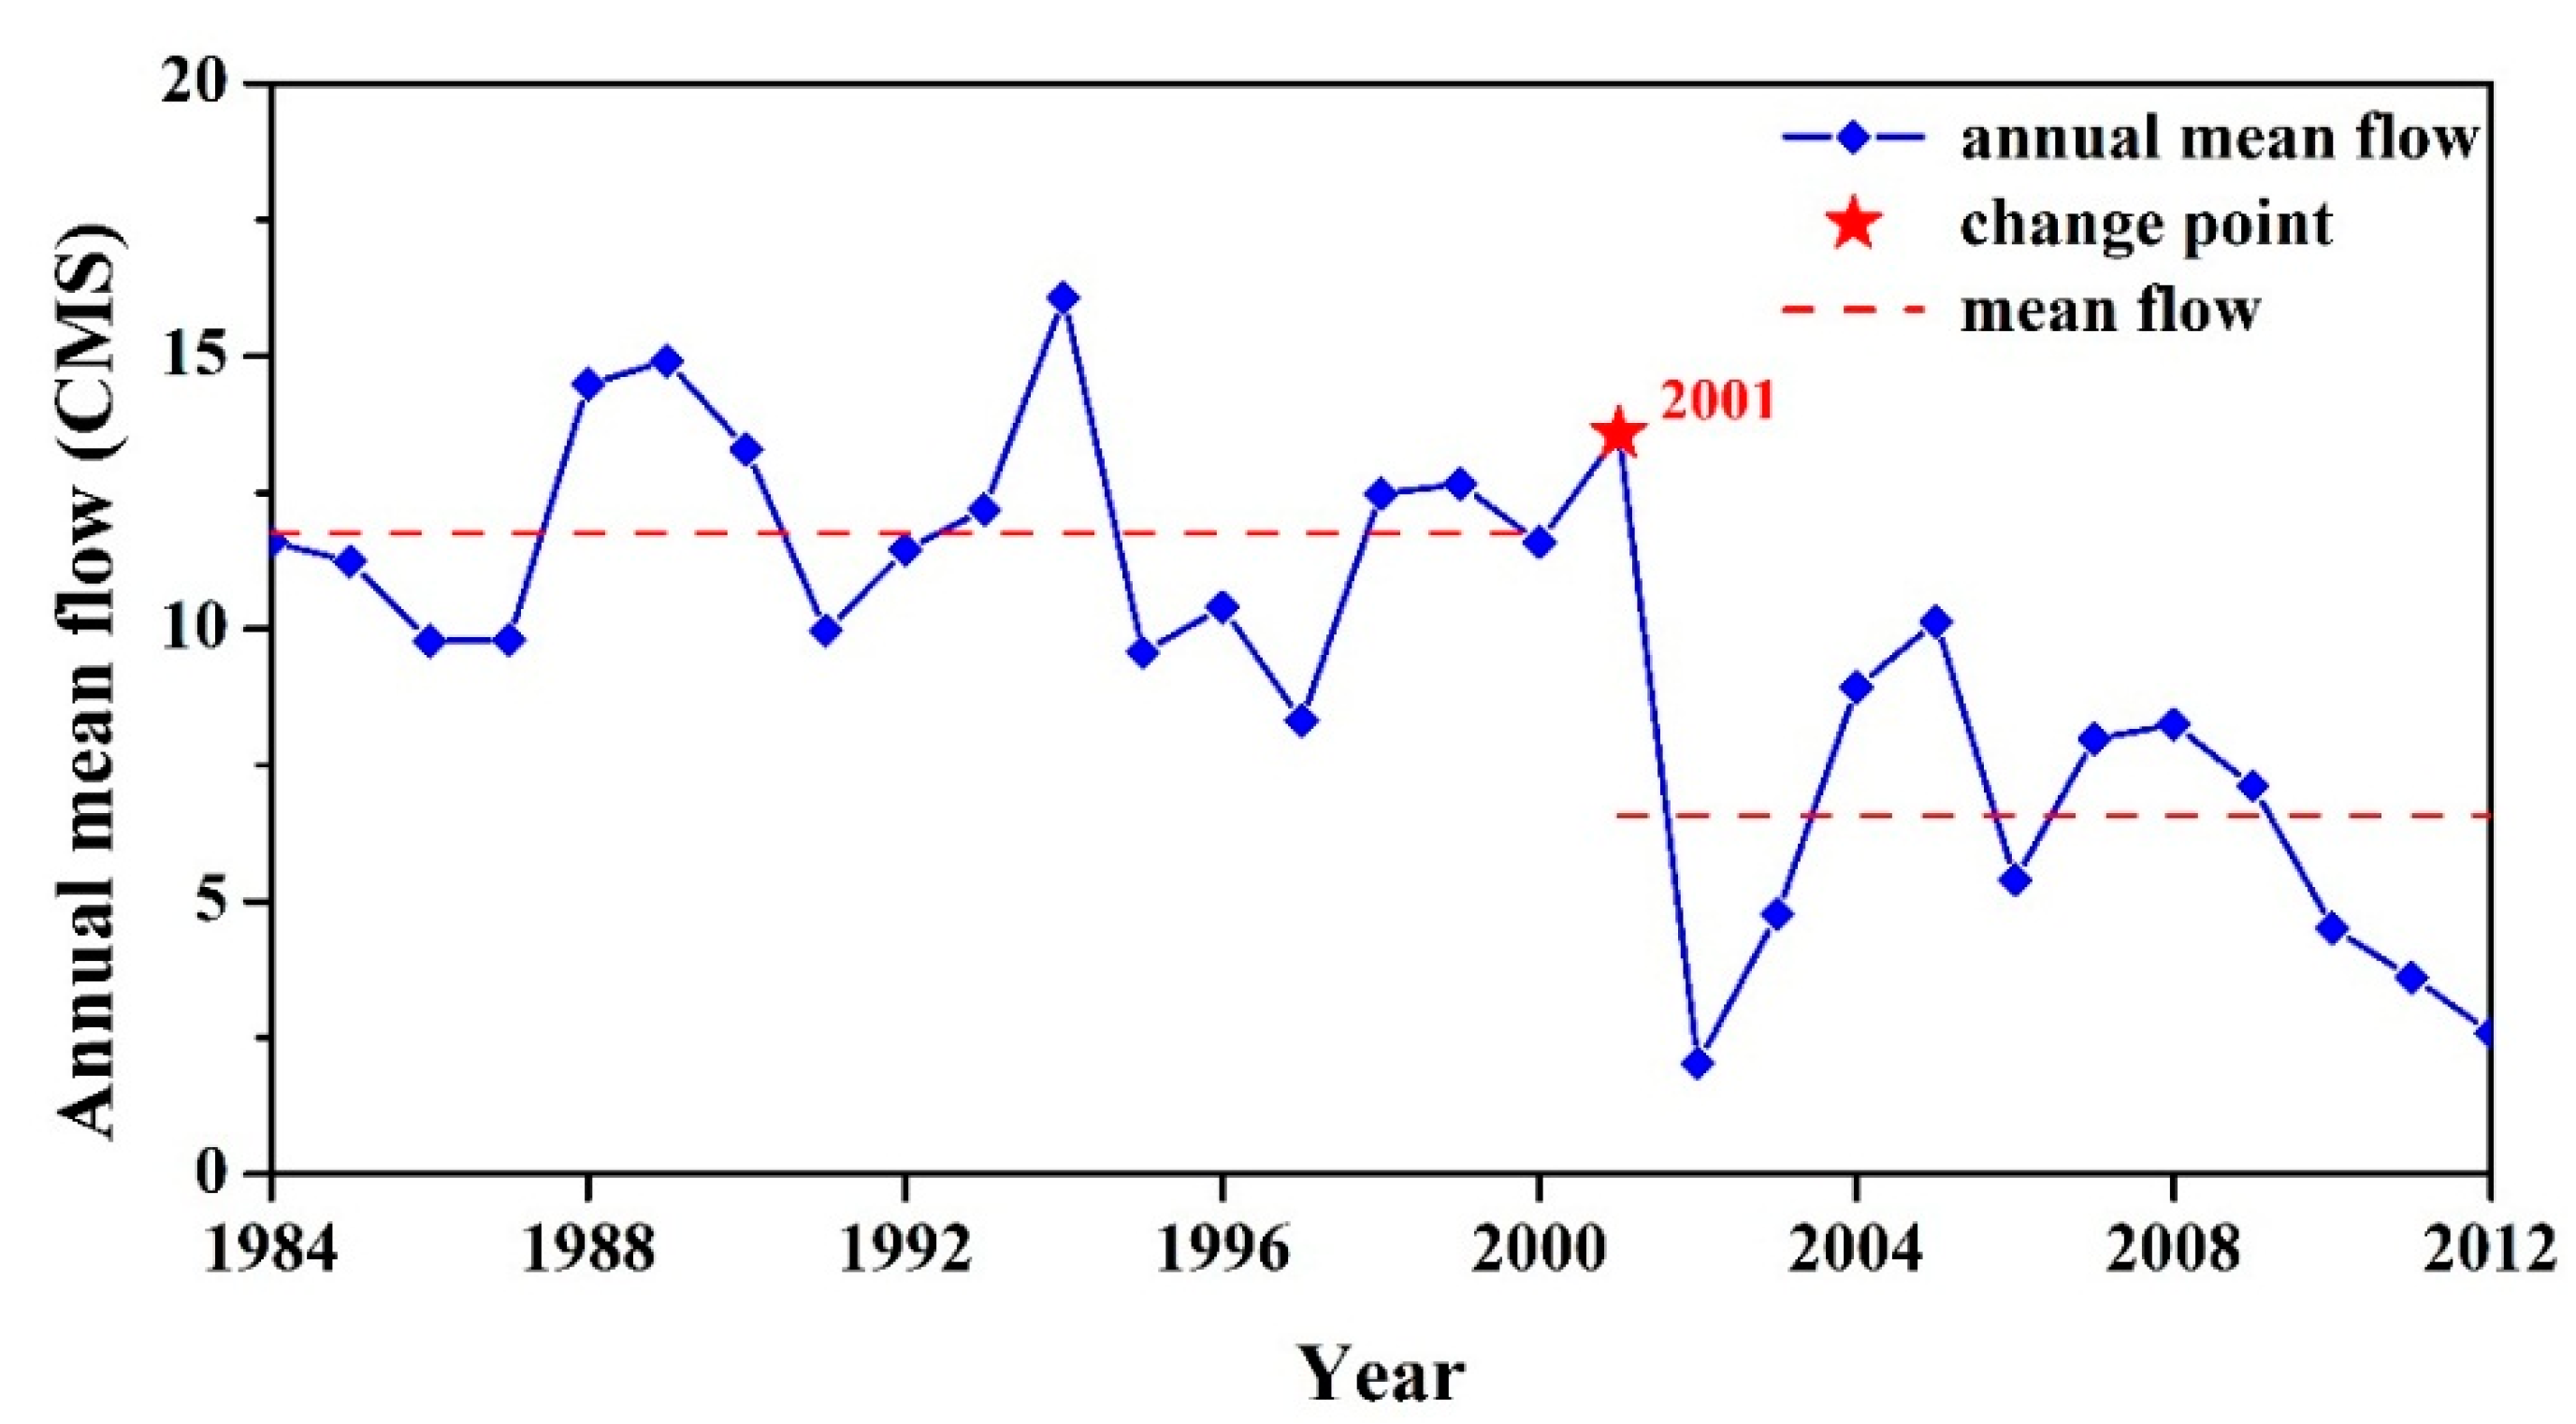
Table 4 shows the results of the change point test: among the 12 gauge stations within the study area, the change point was detected only at the Ximen bridge station. The change point of the Ximen bridge station occurred in 2001, and the average annual streamflow volumes before and after the change point were 11.8 CMS (cubic meter per second) and 6.6 CMS, respectively; the average annual streamflow volume exhibited a downward trend after 2001, and the magnitude of decrease reached 44.1%, as shown in Figure 4. According to the data of Hydrological Year Book of Taiwan [53], the precipitation during 2001 to 2003 was significant decreasing, especially in 2002 and 2003. The precipitation was less than the average precipitation in 2002 and 2003. Due to the decreasing precipitation, the streamflow was not supplied by rainfall which made the streamflow become shortly.
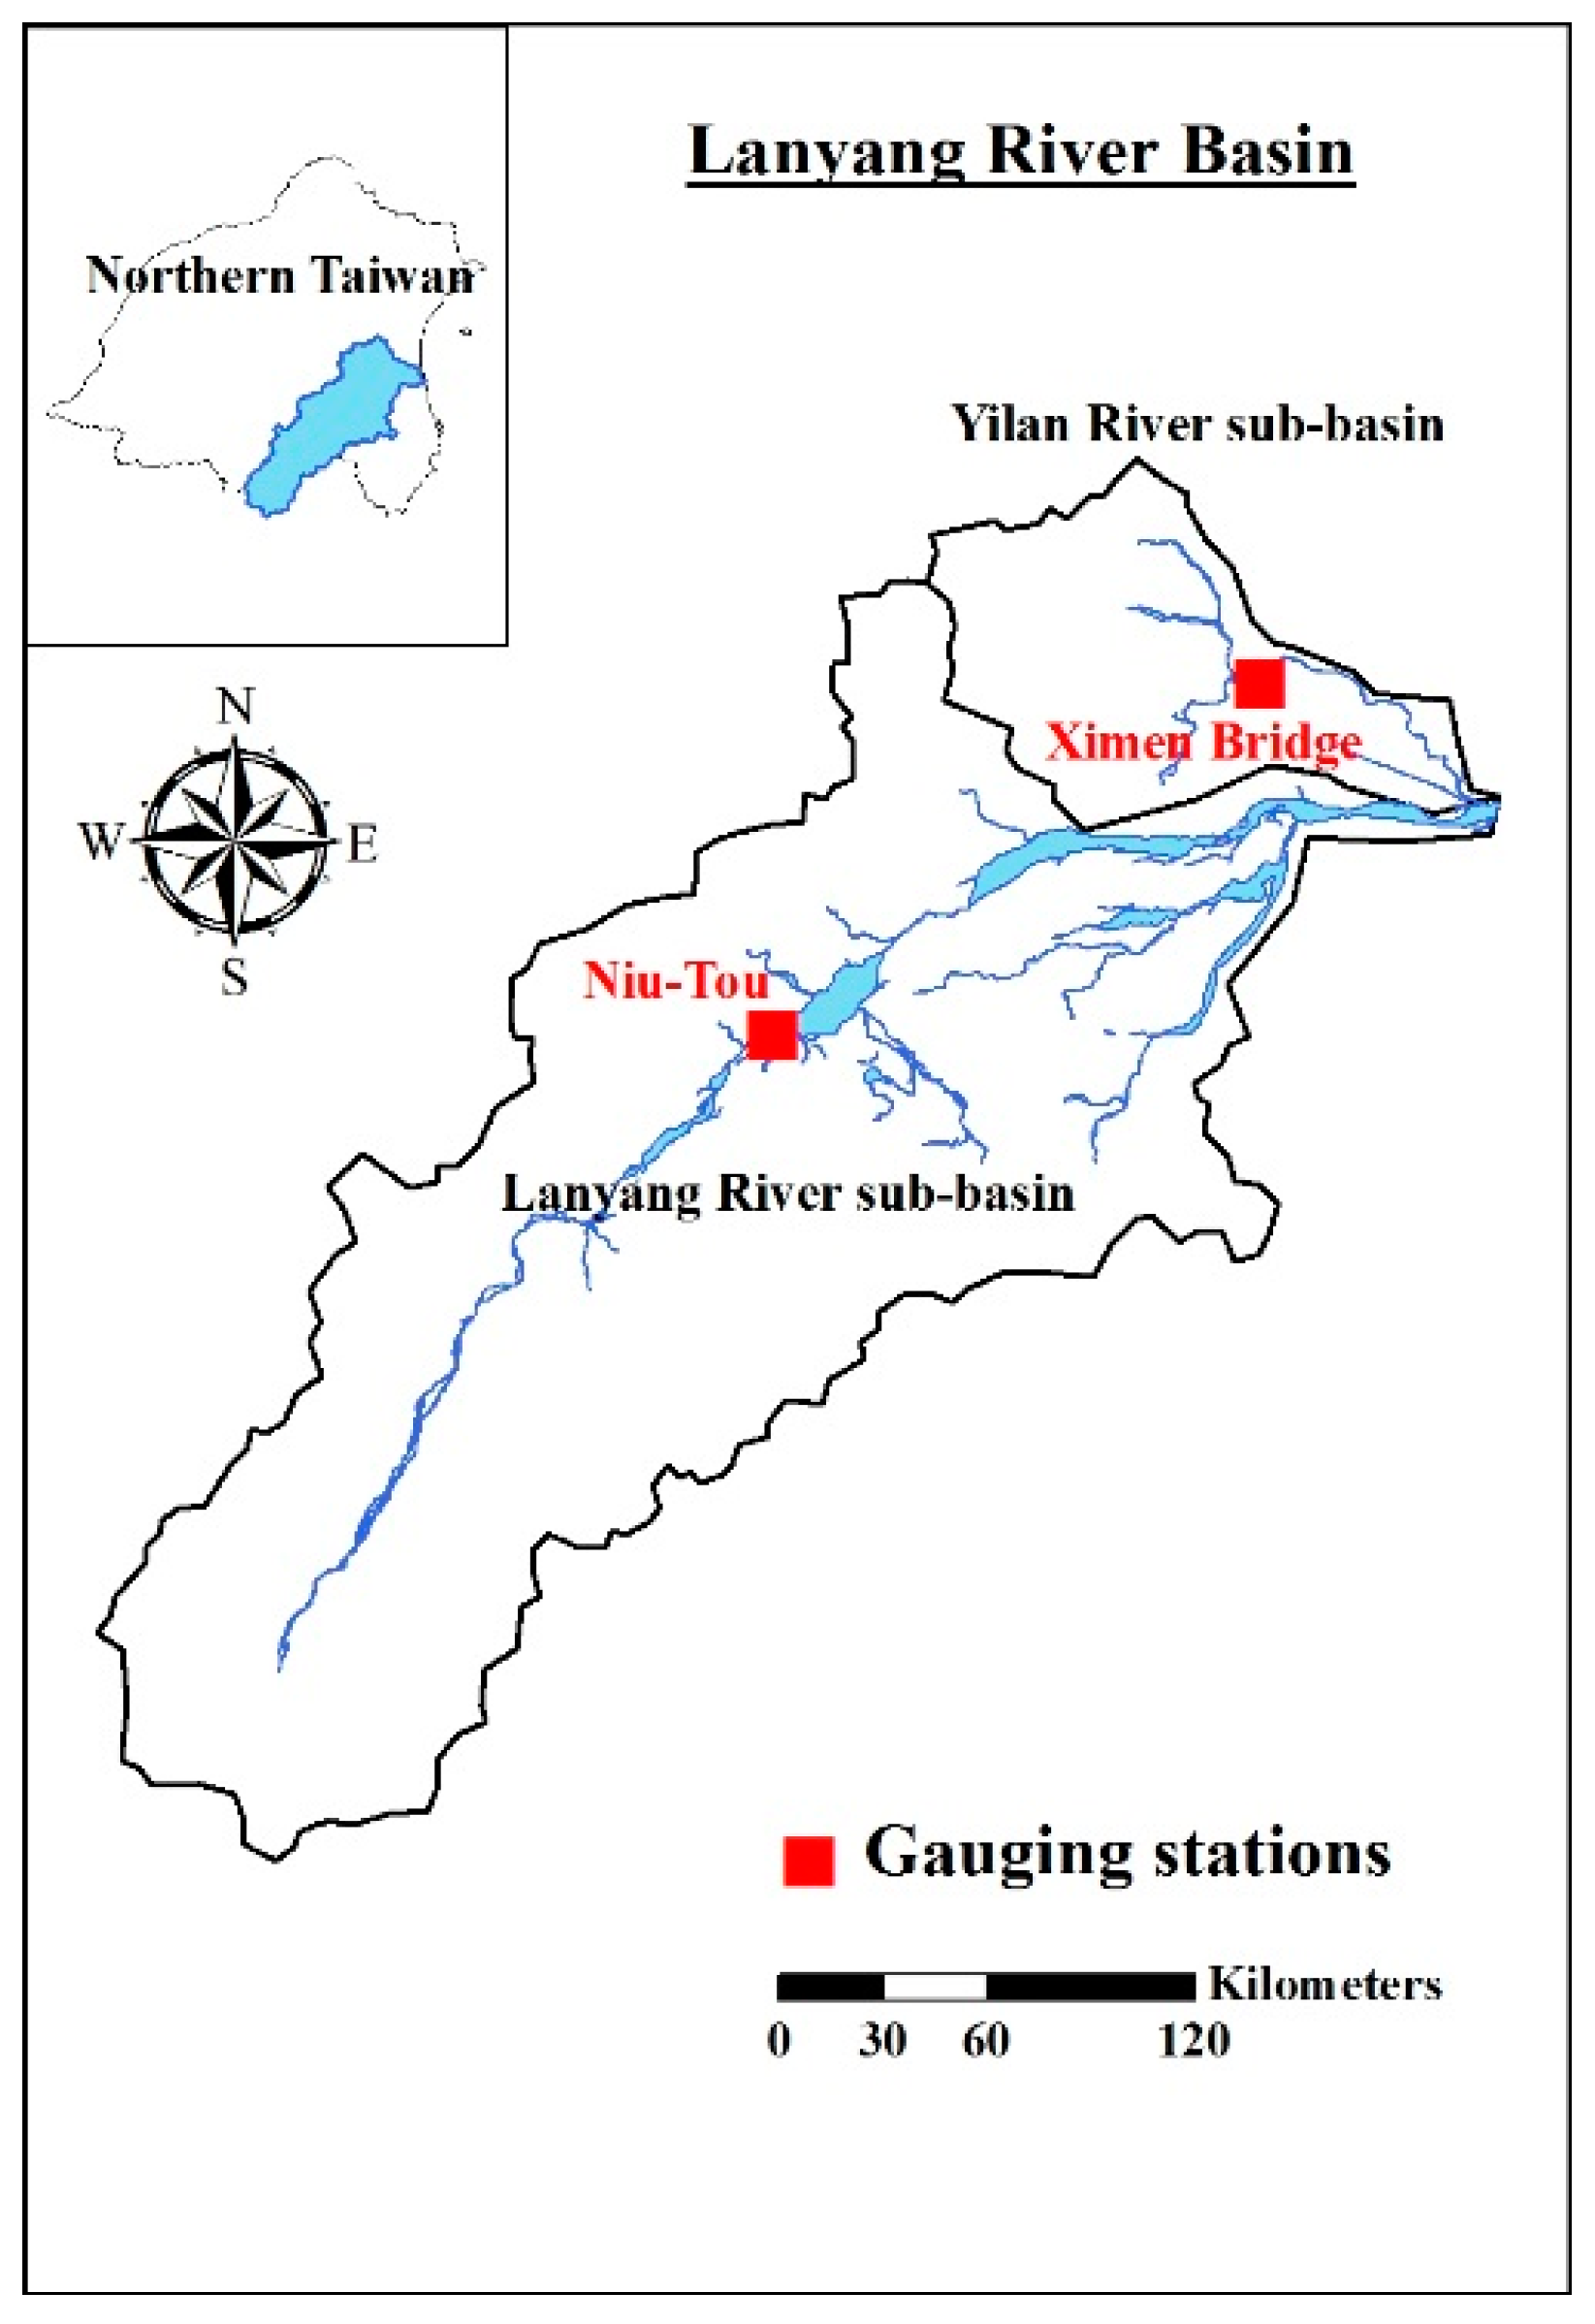
In this study, the Lanyang River basin, which has demonstrated a significant trend, was selected for analysis of drought characteristics. The Niu-Tou station along the Lanyang River mainstream and the Ximen bridge station downstream of the tributary Yilan River were selected as the gauge stations for the study of drought/wet events. The data for Lanyang River and Yilan River sub-basin are shown in Figure 5.
Table 4. Change points determined by using the cumulative deviations and Mann-Whiney-Pettitt methods [33].
RiverGauging StationChange Points (Year)Values of Q / n (Cumulative Deviations)Values of p (Mann-Whiney-Pettitt)The Annual Mean Flow (CMS)Relative Change at the Change Point
Before Change PointAfter Change Point
Lanyang RiverNiu-Tou-1.00450.8640---
Chia-Yuang Bridge-0.56330.5493---
Ximen Bridge20012.05860.999711.86.6−44.1%
Tamsui RiverYu-Feng-0.45050.3269---
Leng-Chiad-0.75750.7285---
Fu-Shan-0.89101.0634---
Xiu-Luan-0.58590.4132---
Gao-Yi-0.44960.3401---
Heng-Chi-0.83040.8108---
Fengshan RiverHsin-Pu-0.67790.5634---
Touqian RiverNei-Wan-1.06320.6614---
Shang-Ping-0.89070.7480---
Note: The number in bold indicates a statistically significant difference.
Figure 4. The results for the change points at the Ximen Bridge Station [33].
Sustainability 07 10789 g004
Figure 5. Spatial distribution of gauging stations and sub-basins in Lanyang River basin.
Sustainability 07 10789 g005

4. Results and Discussion

4.1. SDI Analysis Results

Figure 6 and Figure 7 show the SDI analysis results for periods of three months (November to January) and six months (November to April), respectively, in the Lanyang and Yilan Rivers. As shown in the figures, these two basins have similar drought characteristics. In the Lanyang River basin, successive severe droughts occurred before 2002. During the periods 1992–1995 and 2001–2003, there were successive occurrences of extreme droughts, while the 1998–2000 period witnessed the occurrence of extreme wet events. After 2002, the severity of drought events became milder. For the Yilan River basin, the year 2002 was the turning point, before which there were wet events of moderate severity. However, extreme drought events occurred in 2002 and 2003, and after 2002, the severity of wet events tended to decrease, while that of the drought events tended to increase. Therefore, analysis results of the past ten years have shown that the severity of drought events in the Lanyang River basin tends to decrease, while that in the Yilan River basin tends to increase gradually.
Figure 6. SDI results for November–January in Yilan River and Lanyang River basins.
Sustainability 07 10789 g006
Figure 7. SDI results for November–April in Yilan River and Lanyang River basins.
Sustainability 07 10789 g007
In addition to the analysis of drought event severities in the dry seasons (November to January and November to April), the SDI analysis results for the wet and dry seasons were addressed in this study. Figure 8 and Figure 9 show the SDI analysis results in the Lanyang River and the Yilan River basins for periods of nine months (November to July) and twelve months (November to October), respectively. As shown in the figures, drought events occur only in the Yilan River basin, and are concentrated after 2010. Analysis results of the 12-month period (November to October) for both the Lanyang River and Yilan River show that the year 2002 was a turning point. For the Yilan River; the severity of wet events decreased after 2002, while that of dry events gradually increased. For the Lanyang River basin, most wet events that occurred in 1984–2001 were moderate to severe, and extreme wet events occurred only in 1989, 1990, 1999, and 2000. However, extreme wet events occurred frequently after 2002, including in the 2003–2012 period, 2004, 2006, and 2007.
In this study, November was set as the onset month for analysis, dividing the wet season (May to October) from the dry season (November to October) in northern Taiwan [53]. Analysis results obtained in this study show that the analysis periods of three months (November to January) and six months (November to April) are within the dry season, and therefore, analysis results exhibit significant drought characteristics. The analysis results revealed that 2002 was the turning point for both the Lanyang River and Yilan River. Previous meteorological data show that with below-normal precipitation in the northern region in 2002, the streamflow volume decreased accordingly, and there was little effective precipitation in the rainy season in April, May, and June for the rivers, resulting in the occurrence of droughts in the northern region in 2002 [54].
Figure 8. SDI results for November–July in Yilan River and Lanyang River basins.
Sustainability 07 10789 g008
Figure 9. SDI results for November–October in Yilan River and Lanyang River basins.
Sustainability 07 10789 g009

4.2. Evaluation of Severity Transition and Frequency of Drought Occurrence Using Markov Chains

In this study, the method of Markov chains was used to evaluate the changes in drought severity over different time durations. Table 5 and Table 6 show the changes in drought severity in the Yilan River and Lanyang River basins, respectively, and values in the tables denote the frequency of severity transition from one time duration to another. As shown in Table 5 and Table 6, and Figure 6, Figure 7, Figure 8 and Figure 9 the severity of drought events decreased gradually with increasing analysis time. When the analysis period was 12 months (November to October), only moderate drought events were detected in the Yilan River basin. Results of wet event severities show that the severity of wet events in the Lanyang River and Yilan River basins increases with expanding time durations, with the severity being greater than moderate. Based on the results described above, as the duration of the analysis periods increases, the severity of drought events decreases; when the duration of a period reached 12 months, no severe drought event was detected. On the other hand, wet events were found in all the periods tested, while the severity also decreased with increasing time durations. Therefore, periods of three or six months are suitable for the study of drought event severity.
The occurrence probability for each severity at different time durations can be obtained by substituting the severity transition frequency at different time durations (as described above) into Equation (9). Table 7 shows the occurrence probability of each event severity for different time durations. In terms of drought severity, the occurrence probability of drought events is low in the Yilan River basin; probabilities in all four time periods were less than 10%. In addition, as the analysis time increases, the occurrence probability and severity of drought events also decrease. When the analysis time reached 12 months (November to October), only moderate drought events were found with an occurrence probability of 3.4%. The occurrence probability of drought events in the Lanyang River basin is higher than in the Yilan River basin, and the shorter the analysis time, the higher the chance of a drought event occurring there; particularly for periods of three months (November to January) and six months (November to April), the occurrence probabilities of an extreme drought event were 44.1% and 20.6%, respectively. As the analysis time increases, the probability decreases.
Table 5. Transition frequency of drought event severity at different time periods in Yilan River basin.
State for November–AprilState for November–January
3210−1−2−3
30.750.000.000.000.000.000.00
20.001.000.330.000.000.000.00
10.250.000.670.200.000.000.00
00.000.000.000.801.000.000.00
−10.000.000.000.000.000.000.00
−20.000.000.000.000.001.000.50
−30.000.000.000.000.000.000.50
State for November–JulyState for November-April
3210−1−2−3
31.000.250.000.000.000.000.00
20.000.500.000.000.000.000.00
10.000.251.000.000.000.000.00
00.000.000.001.000.001.000.00
−10.000.000.000.000.000.000.50
−20.000.000.000.000.000.000.00
−30.000.000.000.000.000.000.50
State for November–OctoberState for November–July
3210−1−2−3
30.400.500.000.000.000.000.00
20.600.250.290.000.000.000.00
10.000.250.570.450.000.000.00
00.000.000.140.550.000.001.00
−10.000.000.000.001.000.000.00
−20.000.000.000.000.000.000.00
−30.000.000.000.000.000.000.00
Table 6. Transition frequency of drought/rain event severities at different time periods in Lanyang River basin.
State for November–AprilState for November–January
3210−1−2−3
30.710.000.000.000.000.000.07
20.290.500.000.000.000.000.00
10.000.500.670.250.000.000.00
00.000.000.330.751.000.000.20
−10.000.000.000.000.000.000.27
−20.000.000.000.000.001.000.00
−30.000.000.000.000.000.000.47
State for November–JulyState for November–April
3210123
30.830.000.250.220.000.000.00
20.170.670.000.110.250.000.00
10.000.330.250.000.000.000.00
00.000.000.500.670.501.000.86
−10.000.000.000.000.250.000.00
−20.000.000.000.000.000.000.00
−30.000.000.000.000.000.000.14
State for November–OctoberState for November–July
3210123
30.630.200.000.060.000.000.00
20.250.200.000.350.000.000.00
10.130.401.000.410.000.000.00
00.000.200.000.181.000.001.00
−10.000.000.000.000.000.000.00
−20.000.000.000.000.000.000.00
−30.000.000.000.000.000.000.00
Table 7. Prediction of occurrence probability for dry and rain events in Lanyang River and Yilan River basins.
StateYilan River BasinLanyang River Basin
November–JanuaryNovember–AprilNovember–JulyNovember–OctoberNovember–JanuaryNovember–AprilNovember–JulyNovember–October
313.8%10.3%17.2%13.8%20.6%17.6%23.5%20.6%
224.1%27.6%13.8%20.7%5.9%8.8%14.7%26.5%
110.3%17.2%24.1%34.5%8.8%11.8%5.9%35.3%
034.5%34.5%41.4%27.6%11.8%26.5%50.0%17.6%
−16.9%0.0%1.7%3.4%5.9%11.8%2.9%0.0%
−23.4%6.9%0.0%0.0%2.9%2.9%0.0%0.0%
−36.9%3.4%1.7%0.0%44.1%20.6%2.9%0.0%
The probability results for wet events show that there is a low occurrence probability for extreme wet events in the Yilan River basin, which fell within the range of 10%–20%. The occurrence probability of a severe wet event was around 20.0%–30.0%, except for the period of nine months (November to October), in which the occurrence probability was 13.8%. There was a large variation in the occurrence probability of moderate wet events, but it was shown that as the analysis time increased, the probability increased; for the analysis period of 12 months (November to October), the occurrence probability of a moderate wet event was 34.5%. The probability results of wet events in the Lanyang River basin showed that the occurrence probability of extreme wet events was higher than in the Yilan River basin, and except for the analysis periods of six months (November to April), during which the occurrence probability was 17.6%, the occurrence probabilities for extreme wet events in other periods fell within the range of 20.0%–25.0%. The occurrence probabilities for severe and moderate wet events increased with analysis time, and respectively reached 26.5% and 35.3% when the analysis time was 12 months (November to October).
Analysis results for the drought occurrence described above show that the occurrence probability of drought events is higher in the Lanyang River basin than in the Yilan River basin; particularly for extreme drought events, the occurrence probabilities of an extreme drought event during the dry season (November to January and November to April) in the Lanyang River basin were 44.1% and 20.6%, respectively. Analysis results for the wet occurrence for a period of 12 months (November to October) showed that the occurrence probabilities of wet events were higher in the Lanyang River basin than in the Yilan River basin; particularly for extreme wet events, the occurrence probability was 20.6% in the Lanyang River basin, and 13.8% in the Yilan River basin. In studies of occurrence probabilities of drought and wet events, the method of Markov chains can be used to obtain the transition frequency of event severity at different time durations. In addition, calculations of occurrence probability using Equation (9) can predict the occurrence probability of the next event using short-term data. In addition, one can predict the short-term occurrence probability of a drought/rain event.

5. Conclusions

In this study, the SDI method was used to analyze the severities of drought and wet events in the Yilan River and the Lanyang River basins in northern Taiwan. In addition, the method of Markov chains was used to analyze the transition frequency of SDI values at different time durations, which enables the prediction of occurrence probability of an event severity. Several conclusions were reached as follows:
(1)
The year 2002 was the turning point for the severities of drought and wet events in the Lanyang River and Yilan River basins. Based on previous meteorological data, the precipitation is below normal in the northern region in 2002, resulting in decreased streamflow volumes. In addition, the rainy season in April and May did not produce sufficient precipitation for the rivers, leading to the drought event in 2002 in the northern region.
(2)
In the analysis of drought event severities, significant drought distributions can be found for periods of three months (November to January) and six months (November to April). In the SDI analysis in this study, November was set as the onset month for the analysis time, dividing the wet season (May to October) from the dry season (November to October) in northern Taiwan. Therefore, the SDI analysis results in this work show that significant drought characteristics can be found in analysis periods of three months (November to January) and six months (November to April).
(3)
Analysis results for the occurrence probability of drought and wet events showed that the occurrence probability of a drought event is higher in the Lanyang River basin than in the Yilan River basin. Particularly for extreme events, the occurrence probability of an extreme event during the dry season (November to April) was 20.6% and 3.4% in the Lanyang River and Yilan River basins, respectively. Analysis results for the occurrence probability of wet events for an analysis period of 12 months (November to October) show that the occurrence probability of a wet event was higher in the Lanyang River than in the Yilan River basin. Particularly for extreme wet events, the occurrence probability of an extreme wet event was 20.6% and 13.8% in the Lanyang River and Yilan River basins, respectively. Results obtained in this study show that in the study of the occurrence probability of drought and wet events, the Markov chain method can be used to predict the long-term occurrence probability and severity of drought and wet events using the short-term data of occurrence frequency and probability of the events.

Acknowledgments

The authors are grateful for the support of the Research Project of the Ministry of Science and Technology (MOST 103-2221-E-006-205-MY2).

Author Contributions

Chen-Feng Yeh conceived the subject of the article, literature review and contributed to the writing of the paper; Jinge Wang participated in data processing, elaborated the statistical analysis, and figures. Hsin-Fu Yeh and Cheng-Haw Lee participated in the composition of the manuscript in the method, results and conclusion sections. All authors have read and approved the final manuscript.

Conflicts of Interest

The authors declare no conflict of interest.

References

  1. Intergovernmental Panel on Climate Change (IPCC). Climate Change 2014: Synthesis Report; Cambridge University Press: Cambridge, UK, 2015. [Google Scholar]
  2. Mishra, A.K.; Singh, V.P. A review of drought concepts. J. Hydrol. 2010, 391, 202–216. [Google Scholar] [CrossRef]
  3. Yevjevich, V. An Objective Approach to Definitions and Investigations of Continental Hydrologic Drought; Hydrology Paper No. 23; Colorado State University: Fort Collins, CO, USA, 1967. [Google Scholar]
  4. World Meteorological Organization (WMO). Report on Drought and Countries Affected by Drought During 1974–1985; WMO: Geneva, Switzerland, 1986; p. 118. [Google Scholar]
  5. UN Secretariat General United Nations Convention to Combat Drought and Desertification in Countries Experiencing Serious Droughts and/or Desertification, Particularly in Africa. Available online: http://legal.un.org/avl/ha/unccd/unccd.html (accessed on 6 August 2015).
  6. Food and Agriculture Organization (FAO). Guidelines: Land evaluation for Rainfed Agriculture; FAO Soils Bulletin No. 52; FAO: Rome, Italy, 1983. [Google Scholar]
  7. Wilhite, D.A.; Glantz, M.H. Understanding the drought phenomenon: The role of definitions. Water Int. 1985, 10, 111–120. [Google Scholar] [CrossRef]
  8. Wilhite, D.A. Drought: A Global Assessment; Routledge Hazards and Disasters Series; Routledge: London, England, 2000. [Google Scholar]
  9. Panu, U.S.; Sharma, T.C. Challenges in drought research: Some perspectives and future directions. Hydrol. Sci. J. 2002, 47, S19–S30. [Google Scholar] [CrossRef]
  10. Mishra, A.K.; Singh, V.P.; Desai, V.R. Drought characterization: A probabilistic approach. Stoch. Environ. Res. Risk Assess. 2009, 23, 41–55. [Google Scholar] [CrossRef]
  11. Mishra, A.K.; Singh, V.P. Drought modeling—A review. J. Hydrol. 2011, 403, 157–175. [Google Scholar] [CrossRef]
  12. Chen, L.; Singh, V.P.; Guo, S.L.; Mishra, A.K.; Guo, J. Drought analysis using Copulas. J. Hydrol. Eng. 2013, 18, 797–808. [Google Scholar] [CrossRef]
  13. Al-Faraj, F.A.M.; Scholz, M.; Tigkas, D. Sensitivity of surface runoff to drought and climate change: Application for shared river basins. Water 2014, 6, 3033–3048. [Google Scholar] [CrossRef]
  14. Mishra, A.K.; Amor, I.V.M.; Das, N.N.; Khedun, C.P.; Singh, V.P.; Sivakumar, B.; Hansen, J.W. Anatomy of a localscale drought: Application of assimilated remote sensing products, crop model, and statistical methods to an agricultural drought. J. Hydrol. 2015, 526, 15–29. [Google Scholar] [CrossRef]
  15. McKee, T.B.; Doeskin, N.J.; Kleist, J. The Relationship of Drought Frequency and Duration to Time Scales. In Proceedings of the Eighth Conference on Applied Climatology, Anaheim, CA, USA, 17–23 January 1993; American Meteorological Society: Boston, MA, USA, 1993; pp. 179–184. [Google Scholar]
  16. Tsakiris, G.; Vangelis, H. Establishing a Drought Index Incorporating Evapotranspiration. Eur. Water 2005, 9, 3–11. [Google Scholar]
  17. Palmer, W.C. Meteorological Drought; Research Paper No. 45; U.S. Department of Commerce, Weather Bureau: Washington, DC, USA, 1965; p. 58. [Google Scholar]
  18. Shafer, B.A.; Dezman, L.E. Development of a Surface Water Supply Index (SWSI) to Assess the Severity of Drought Conditions in Snowpack Runoff Areas. In Proceedings of the Western Snow Conference, Fort Collins, CO, USA, 19–23 April 1982; pp. 164–175.
  19. Nalbantis, I. Evaluation of a Hydrological Drought Index. Eur. Water 2008, 23, 67–77. [Google Scholar]
  20. Sharma, T.C.; Panu, U.S. Analytical procedures for weekly hydrological droughts: A case of Canadian rivers. Hydrol. Sci. J. 2010, 55, 79–92. [Google Scholar] [CrossRef]
  21. Palmer, W.C. Keeping track of crop moisture conditions, nationwide: The new Crop Moisture Index. Weatherwise 1968, 21, 156–161. [Google Scholar] [CrossRef]
  22. Woli, P.; Jones, J.W.; Ingram, K.T.; Fraisse, C.W. Agricultural reference index for drought (ARID). Agron. J. 2012, 104, 287–300. [Google Scholar] [CrossRef]
  23. Madadgar, S.; Moradkhani, H. Drought Analysis under Climate Change Using Copula. J. Hydrol. Eng. 2013, 18, 746–759. [Google Scholar] [CrossRef]
  24. Manikandan, M.; Tamilmani, D. Assessing hydrological drought charactertics: A case study in a sub basin of Tamil Nadu, India. Agric. Eng. 2015, 1, 71–83. [Google Scholar]
  25. Tabari, H.; Nikbakht, J.; Talaee, P.H. Hydrological Drought Assessment in Northwestern Iran Based on Streamflow Drought Index (SDI). Water Resources Manag. 2013, 27, 137–151. [Google Scholar] [CrossRef]
  26. Zamani, R.; Tabari, H.; Willems, P. Extreme streamflow drought in the Karkheh river basin (Iran): Probabilistic and regional analyses. Nat. Hazards 2015, 76, 327–346. [Google Scholar] [CrossRef]
  27. Nalbantis, I.; Tsakiris, G. Assessment of hydrological drought revisited. Water Resources Manag. 2009, 23, 881–897. [Google Scholar] [CrossRef]
  28. Tigkas, D.; Vangelis, H.; Tsakiris, G. Drought and climatic change impact on streamflow in small watersheds. Sci. Total Environ. 2012, 440, 33–41. [Google Scholar] [CrossRef]
  29. Chung, Y.D.; Kuo, C.C.; Chen, C.S. The temporal variation of regional rainfall characteristics in Taiwan. J. Chin. Agric. Eng. 2009, 55, 1–18. [Google Scholar]
  30. Esty, D.; Srebotnjak, T.; Goodall, M.; Andonov, B.; Campbell, K.; Gregg, K.; Kim, C.; Li, Q.; Martinez, M.; Townsend, J.; et al. Environmental Sustainability Index: Benchmarking National Environmental Stewardship; Yale Center for Environmental Law & Policy: New Haven, CT, USA, 2005. [Google Scholar]
  31. Hsu, H.H.; Chen, C.T.; Lu, M.M.; Chen, Y.M.; Chou, C.; Wu, Y.C. Climate change in Taiwan: Scientific Report 2011; National Science and Technology Center for Disaster Reduction: New Taipei, Taiwan, 2011. [Google Scholar]
  32. Water Resources Agency (WRA). Master Plan of Water Resources Management for Northern Taiwan; Ministry of Economic Affairs, WRA: Taipei, Taiwan, 2009. [Google Scholar]
  33. Yeh, C.F.; Wang, J.; Yeh, H.F.; Lee, C.H. Spatial and Temporal Streamflow Trends in Northern Taiwan. Water 2015, 7, 634–651. [Google Scholar] [CrossRef]
  34. Lins, H.F.; Slack, J.R. Streamflow trends in the United States. Geophys. Res. Lett. 1999, 26, 227–230. [Google Scholar] [CrossRef]
  35. Zhang, X.; Harvey, K.D.; Hogg, W.D.; Yuzyk, T.R. Trends in Canadian streamflow. Water Resources Res. 2001, 37, 987–998. [Google Scholar] [CrossRef]
  36. Kahya, E.; Kalayci, S. Trend analysis of streamflow in Turkey. J. Hydrol. 2004, 289, 128–144. [Google Scholar] [CrossRef]
  37. Chen, Z.; Chen, Y.; Li, B. Quantifying the effects of climate variability and human activities on runoff for Kaidu River Basin in arid region of northwest China. Theor. Appl. Genet. 2013, 111, 537–545. [Google Scholar] [CrossRef]
  38. Dixon, H.; Lawler, D.M.; Shamseldin, A.Y. Streamflow trends in western Britain. Geophys. Res. Lett. 2006, 33, L19406. [Google Scholar] [CrossRef]
  39. Baggaley, N.J.; Langan, S.J.; Futter, M.N.; Potts, J.M.; Dunn, S.M. Long-term trends in hydro-climatology of a major Scottish mountain river. Sci. Total Environ. 2009, 407, 4633–4641. [Google Scholar] [CrossRef] [PubMed]
  40. Hannaford, J.; Buys, G. Trends in seasonal river flow regimes in the UK. J. Hydrol. 2012, 475, 158–174. [Google Scholar] [CrossRef] [Green Version]
  41. Bassiouni, M.; Oki, D.S. Trends and shifts in streamflow in Hawai’i, 1913–2008. Hydrol. Process. 2013, 27, 1484–1500. [Google Scholar] [CrossRef]
  42. De Martino, G.; Fontana, N.; Marini, G.; Singh, V.P. Variability and trend in seasonal precipitation in the continental United States. J. Hydrol. Eng. 2013, 18, 630–640. [Google Scholar] [CrossRef]
  43. Duhan, D.; Pandey, A. Statistical analysis of long term spatial and temporal trends of precipitation during 1901–2002 at Madhya Pradesh, India. Atmos. Res. 2013, 122, 136–149. [Google Scholar] [CrossRef]
  44. Pasquini, A.I.; Depetris, P.J. Discharge trends and flow dynamics of South American rivers draining the southern Atlantic seaboard: An overview. J. Hydrol. 2007, 333, 385–399. [Google Scholar] [CrossRef]
  45. Ngongondo, C.S. An analysis of long-term rainfall variability, trends and groundwater availability in the Mulunguzi river catchment area, Zomba Mountain, Southern Malawi. Quat. Int. 2006, 148, 45–50. [Google Scholar] [CrossRef]
  46. Rouge, C.; Ge, Y.; Cai, X. Detecting gradual and abrupt changes in hydrological records. Adv. Water Resources 2013, 53, 33–44. [Google Scholar] [CrossRef]
  47. Yu, P.S.; Yand, T.C.; Kuo, C.C. Evaluating long-term trends in annual and seasonal precipitation in Taiwan. Water Resources Manag. 2006, 20, 1007–2023. [Google Scholar] [CrossRef]
  48. Isaacson, D.L.; Madsen, R. Markov Chains: Theory and Applications; Wiley: New York, NY, USA, 1976; p. 267. [Google Scholar]
  49. Lohani, V.K.; Loganathan, G.V. An early warning system for drought management using the Palmer drought index. J. Am. Water Resources Assoc. 1997, 33, 1375–1386. [Google Scholar] [CrossRef]
  50. Lohani, V.K.; Loganathan, G.V.; Mostaghimi, S. Long-term analysis and short-term forecasting of dry spells by the Palmer drought severity index. Nord. Hydrol. 1998, 29, 21–40. [Google Scholar]
  51. Ochola, W.O.; Kerkides, P. A Markov chain simulation model for predicting critical wet and dry spells in Kenya: Analysing rainfall events in the Kano plains. Irrig. Drain. 2003, 52, 327–342. [Google Scholar] [CrossRef]
  52. Paulo, A.A.; Pereira, L.S. Prediction of SPI drought class transitions using Markov chains. Water Resources Manag. 2007, 21, 1813–1827. [Google Scholar] [CrossRef]
  53. Water Resources Agency (WRA). Hydrological Year Book of Taiwan; Ministry of Economic Affairs, WRA: Taipei, Taiwan, 2013. [Google Scholar]
  54. Chang, T.C. Investigation of water shortage and countermeasure of Taiwan in 2002. J. Kao Yuan Inst. Technol. 2004, 10, 17–36. [Google Scholar]

