Article

Residence and Job Location Change Choice Behavior under Flooding and Cyclone Impacts in Bangladesh

1
Key Laboratory of Ocean Engineering, School of Naval Architecture, Oceanic & Civil Engineering, Shanghai Jiao Tong University, No. 800 Dongchuan Rd., Shanghai 200240, China
2
Key Laboratory of Ocean Engineering Transportation Research Center, School of Naval Architecture, Oceanic & Civil Engineering, Shanghai Jiao Tong University, No. 800 Dongchuan Rd., Shanghai 200240, China
3
Roads and Highways Department, Bangladesh, No. 132/4 New Bailey Rd., Dhaka1000, Bangladesh
*
Author to whom correspondence should be addressed.
Sustainability 2015, 7(9), 11612-11631; https://0-doi-org.brum.beds.ac.uk/10.3390/su70911612
Submission received: 25 June 2015 / Revised: 1 August 2015 / Accepted: 12 August 2015 / Published: 25 August 2015

Abstract

:
Climate change enters significantly into and is shown to be a direct determinant of residence and job location change decisions. Understanding of how people’s residence and job location change choice behavior is affected and thus responds to the impacts of climate change is essential for transportation planners and adaptation decision makers. As an addition to the current literature, the main purposes of this paper are to investigate people’s residence and job location change choice behavior affected by factors at origin and look into the behavioral differences between coastal and inland people under flooding and cyclone scenarios in Bangladesh. Questionnaire data were surveyed in 14 coastal and inland cities of Bangladesh with an orthogonal design of three flooding/cyclone scenarios. The multinomial Logit model and cross-nested Logit model are proposed to address the above purposes. Results of this study indicate that flooding/cyclone factors and income, land owned, and number of family members significantly affects people’s location change choice. In addition, coastal people are also significantly affected by previous experience factors. Furthermore, road connection plays an important role when people choose to change residence locations in coastal areas. It is also found that if there are changes in flooding impacts, the inland people will first consider to change their job locations, while the coastal people would consider both job and residence location changes. Results of this work provide policy suggestions on transportation infrastructure investment, shelter planning and construction, and population migration under flood and cyclone impacts as a result of climate change.

1. Introduction

Climate changes characterized by flood, cyclone, sea-level rise, and so on are having serious impacts on many countries around the world. Bangladesh is one of the most vulnerable countries in the world threatened by floods and cyclones due to its geographical location and setting. As a country with a high population density, 10% of the Bengalese live along the coastal areas [1]. Floodplains of its three large rivers cover about 80% of the country’s land where three-quarters of the total population lives [2], and only 10% of Bangladesh is 1 meter above the global mean sea level and one-third is under tidal influence [3]. On average, 6000 people die from flooding and storms each year [4]. People’s everyday lives and daily travel are undergoing great challenges from flooding and cyclone impacts. Serious impacts have also been being placed on the transportation infrastructure and system in the country.
Research work focusing on climate change impacts are usually addressed from two aspects—mitigation and adaptation. Comparing with climate change mitigation efforts, however, climate change adaptation may be more urgent to prepare the society in aspects such as infrastructure systems and people’s travel behavior to adapt to the increasing impacts. As a result, climate change adaptation receives much more attention in terms of system performance analysis [5,6,7] and adaptation decision making [8,9,10,11]. Among all these impacts, climate change is also expected to have an impact on people’s activity behavior especially in seriously affected countries like Bangladesh. People’s behavior such as travel behavior and job and residence location choice behavior may also change with the climate, especially with the increase in intensity and frequency of climate change events.
Until recently, travel behavior adaptation to climate change attracts attention from scholars addressing behavioral changes to adapt to the impacts of climate change, especially adverse weather events in people’s daily travel [12,13,14,15]. It is important to understand people’s travel behavior changes under climate change impacts because transportation network performance is largely dependent on how travellers respond to traffic conditions [16]. The residence and job location change choice behavior under climate change is as important as travel behavior change, which changes the traffic generation and distribution and then the transportation network performance. In the network performance analysis literature, great contributions have been made to explore improved analysis methods under climate change disasters [17,18] or develop more efficient calculation techniques in the application [19,20]. However, people’s residence and job location choice behavior should be addressed in these network performance analyses, neglecting which might lead to inaccurate evaluation results. Residence and job locations might be changed because of frequent or serious flood or cyclone impacts, and thus the traffic demand and volume will change with the choice of residence and job locations. Actually, climate significantly enters into and is shown to be a direct determinant of location choice decisions [21]. As a result, it is of great importance to better understand people’s residence and job location change behavior under climate change impacts and include these behavioral changes in the transportation network performance analysis and adaptation decision making.
The residence or job location choice behavior is usually addressed with its relationship with public transport accessibility, travel costs, travel modes and departure time, and so on [22,23,24]. The influences of physiological factors and gender on residence location choice are also investigated in the literature [25,26,27]. The balance of residence and job location choices is found to be associated with the population pattern of a city and traditional residence and job location policy [28,29]. Arentze and Timmermans [30] find a less significant impact of congestion pricing on residence or job location change than travel behavior change. Mortreux and Barnett [31] conclude factors influencing residence or job location choice into three groups which are factors at the point of origin including environment, economic factors, and government policies, factors at the destination involving social network, economic factors, and government policies, and intervening obstacle factors such as distance and institutional constraints. These factors are proposed for normal location change decisions and may not be directly attributable to changes under climate change. Mcleman gives a review of the linkage between climate change and migration, confirms the relationship between climate variability and human migration pattern, and identifies developments in the modeling and datasets of climate change and migration [32]. With an agent-based simulation model, Kniveton et al. [33] find that the migration or residence location change is obviously affected by the environment, that is, dry or wet environment. They also suggest that rainfall’s impact on location change choice is expressed via its influence on other drivers such as differential employment opportunities, limited access to natural resources, national policies and incentives, ecological vulnerability, political instability, and infrastructure. With the same methodology, Hassani-Mahnooei and Parris explored people’s internal migration under climate change in Bangladesh [34]. After a review of empirical research on migration and climate change, Klaiber confirms that household location change arises due to changes in economic opportunities and climate amenities resulting from climate change [21]. Saldana-Zorrilla and Sandberg [35] find that declining incomes, higher educated individuals and increasing numbers of natural disasters lead to higher levels of out-migration under climate-related disasters in Mexico. Other studies also investigate factors or reasons affecting the migration or location change decision under climate change impacts, and the identified factors include lack of education, strong attachments to land, age, family size, the availability of transport infrastructure, and so on [31,36,37,38]. With evidence from two communities in Canada, Wolf et al. argue that values such as tradition, freedom, harmony, safety, and unity shape different interpretations and meaning of climate change impacts, and as a result lead to distinct adaptation decision including migration or location change choice [39]. Iqbal and Roy focus on the temperature and rainfall impact migration through agriculture, and predict that the net out-migration rate will be about 22% higher in 2030 than in 1990 as a result of changes in climate variables in Bangladesh [40]. Although factors influencing the residence or job location choice decision may vary among countries or observation, there is almost no doubt that people’s location choice behavior is affected by climate change impacts.
Most of the above literature focuses on the household or residence location choice under climate change scenarios. However, not only residence location choice but also job location choice will have impacts on the traffic distribution and transportation network performance. Furthermore, people may gradually consider changing the job location first and then the residence location under climate change impacts. It is agreed that because of the diversities of climate change regimes and culture/habituation in different countries people’s travel behavior and residence and job location choices behavior under climate change are different [13,15,41]. Thus, understanding people’s residence and job location choice behavior under climate change in different countries of the world is of great importance especially those developing countries which are more diverse in terms of people’s education, income, and family structure and becoming more vulnerable under the impacts of climate change. Given the uncertainties of climate change, people’s residence and job location change choice decision may also be different under different climate change scenarios and types such as rainfall, river or coastal flooding, and cyclone. These research gaps should be addressed with detailed investigation of people’s preference of location choices under different climate change and impact scenarios together with factors describing the household characteristics.
To address the above research gaps, this paper aims to identify flooding and cyclone factors such as frequency and intensity and impact factors that explain the joint choice of residence and job location while including personal and family socio-economic factors and previous experiences at the origin in Bangladesh. Particularly, residence and job location change behavior comparison is evaluated under flooding and cyclone impacts as well as coastal and inland areas of Bangladesh respectively. People may consider changing job or residence locations under long-lasted impacts, and thus the focus of this work will be on the gradual impacts from flood and cyclone. The design of the research including data collection and methodology development are presented in the next section.

2. Research Design

2.1. Data

In this regard, we conducted a stated preference questionnaire survey on residence and job location change choice under flooding and cyclone impacts. Personal information such as age, income, education degree, occupation, and so on is also investigated. Factors involved in the analyses are shown in Table 1, which could be classified into three groups, that is, socio-economic factors, previous experience factors, and flooding and cyclone factors. This study explores the factors at the origin, and assumes that people could find a location or job for their residence and job changes and afford the associated costs. Particularly, an orthogonal experiment with five flooding factors, which are flood frequency or cyclone frequency, flood intensity or cyclone intensity, permanent/frequent inundation, houses isolated by water, and road to destination cities are completely destroyed, was designed for the survey. Detailed level information of the above factors is also presented in Table 1. The factors and levels are proposed based on the common flooding and cyclone impacts that Bangladesh people are currently enduring. Based on the orthogonal experiment design results, four cards with four scenarios in each card were created (see the Appendix for details), which is to say that each respondent has to give choices under four flooding or cyclone scenarios. These scenarios are proposed based on the typical impacts posed by flooding and cyclones after consulting the local experts in Bangladesh. The four kinds of cards are distributed equally in the total survey samples, that is, if there are 1000 questionnaire survey forms, each scenario gets a quarter (250 survey forms) of the total sample. Each respondent was then asked to give his/her job and residence location choice under the given scenarios. The respondents have six choices under each scenario, which are same job, same location, and not reinforce the house (Choice 1: Job0_Res0_Hou0), same job, same location, but reinforce the house (Choice 2: Job0_Res0_Hou1), switch job, same location, and not reinforce the house (Choice 3: Job1_Res0_Hou0), switch job, same location, but reinforce the house (Choice 4: Job1_Res0_Hou1), same job, but shift house location (Choice 5: Job0_Res1), switch job and shift house location (Choice 6: Job1_Res1). Since the flooding and cyclone impacts in Bangladesh would be similar across a district, and people may not want to move to locations in the same district, as a result, we addressed inter-district location changes in this research. People from 14 cities of Bangladesh, among which nine are coastal cities and five are inland, participated in the survey. The survey was carried out from the end of January to beginning of March 2013. In total, 942 samples out of 1000 samples were collected including 580 samples from the coastal areas and 362 samples from the inland. As Bangladesh is more populated in the coastal area than the inland, the coastal area got a higher sample share. More than 90 percent of the respondents are 20–60 years old, and more than half belong to the 20–40 age group. Usually, male respondents are the head and decision maker of a family in Bangladesh and can give better answers to the questionnaire; as a result, males get about 60% sample share. Among the respondents, the poor people, such as farmers and fishermen, account for the largest sample share, as most of the people in Bangladesh suffering the impacts are poor households that are more vulnerable than rich households once affected. Other occupations of the participants include boatman, rickshaw driver, businessman, government staff, teacher, private job, and so on. People who have no job are not included in this observation.
Table 1. Factors included in the analyses.
Variable NameDescription
Age1: people under 18 years old; 2: people belong to 18 to 30 years old group; 3: people belong to 30–40 years old group; 4: people belong to 40–60 years old group; 5: people over 60 years old
Education1: secondary school or below; 2: high school; 3: college; 4: university and above; 5: no education
Family member1: no more than 2; 2: has 2 to 4 members; 3: has 4 to 10 members; 4: more than 10
Living year1: no more than 5 years; 2: 5 to 10 years; 3: 10 to 20 years; 4: 20 to 30 years; 5: more than 30 years
Own land1: no land owned; 2: 0 to 100m2 land; 3: 100 to 500m2 land; 4: 500 to 1000 m2 land; 5: more than 1000m2 land
Annual incomeAnnual income is divided by 12, 36, 60, 84, 120 thousands Bangladesh Taka (BDT) based on the wage levels in Bangladesh
Quality of life (QOL) affected in the past1: completely; 2: seriously; 3: slightly; 4: not at all
Recover independently in the past1: completely disagree; 2: slightly disagree; 3: Neural; 4: slightly agree; 5: completely agree
Move or not before disaster comes in the past1: no action; 2: move temporally; 3: move permanently; 4: other actions
Consider flooding/cyclone impact in new job1: yes; 2: probably yes; 3: no; 4: probably no
Flood frequency (levels 1–3)Level 1: once each year; Level 2: once every 2 years; Level 3: once every 3 years
Flood intensity (levels 1–3)Level 1: reach knees; Level 2: reach waist; level 3: reach chest and above
Cyclone frequency (levels 1–3)Level 1: once every 2 years; Level 2: once every year; Level 3: twice a year
Cyclone intensity (levels 1–3)Level 1: some structural damage to house; Level 2: some complete house structure failure; Level 3: complete failure on may houses
Frequent inundationLevel 1 = Yes (1); Level 2 = No (0)
Salinity intrusion Level 1 = Yes (1); Level 2 = No (0)
Isolated by waterLevel 1 = Yes (1); Level 2 = No (0)
Roads are destroyedLevel 1 = Yes (1); Level 2 = No (0)

2.2. Methodology

Based on the microeconomic random utility theory, the discrete location choice model shows its advantage in the ability to include a variety of location choice factors in a single utility function. Within the discrete choice models, the multinomial logit (MNL) model has been the most widely used model structure because of its straightforward mathematical structure and ease estimation. In this work, the MNL model is proposed to investigate people’s behavioral responses in residence and job location change choice under different flooding and cyclone scenarios. The utility function of the MNL model is adopted as the most widely used linear form, and the utility of a decision maker n selecting alternative i under a flooding or cyclone scenario, Uin* is assumed to be a latent variable. Uin* is constructed as follows:
U i n * = β 0 + j = 1 J β j x i n j + ε i n
where Xinj are the explanatory variables including frequency and intensity of a flood or cyclone, previous experiences responding to the impacts, and the socioeconomic characteristics of the decision maker. β0 and βj are coefficients to be estimated. The random component εin captures all other unobserved factors and is assumed to follow the Gumble distribution across the observation.
As mentioned above, Uin* is a latent variable and could not be observed and we can only observe whether the travel choice of a decision maker is “1” or “2” in the MNL model. Based on the random utility maximization hypothesis, a decision maker n will select alternative i if and only if the utility provided by alternative i is the largest utility, i.e., Uin > Ujn (∀j ≠ i). As a result, the observed dummy variable of residence and job location change choice is denoted as:
U i n = { 1 , i f U 1 n * > U 2 n * , U 3 n * , U 4 n * , U 5 n * , U 6 n * 2 , i f U 2 n * > U 1 n * , U 3 n * , U 4 n * , U 5 n * , U 6 n * 6 , i f U 6 n * > U 1 n * , U 2 n * , U 3 n * , U 4 n * , U 5 n *
where Uin denotes choice 1 (i takes value “1”) , choice 2 (i takes value “2”), choice 3 (i takes value “3”), choice 4 (i takes value “4”), choice 5 (i takes value “5”), choice 6 (i takes value “6”), and U1n*, U2n* , U3n*, U4n*, U5n*, and U6n* are the utility of decision maker n when there choice 1, choice 2, choice 3, choice 4, choice 5, and choice 6 are selected, respectively.
With the estimation results of the MNL model, significant factors in terms of flood or cyclone impacts, previous flooding or cyclone experiences, and socio-economic attributes are identified with estimated coefficients. However, the representation of choice behavior results in biased estimations and incorrect predictions in the MNL model when the restriction of independent and identical distribution of the random error terms over alternatives is violated. Although the relaxation of the MNL model such as the nested logit (NL) model has greatly improved the discrete choice modeling technique, the NL model shows limitations in dealing with joint choice problem. The introduction of generalized extra value (GEV) class of models is an important development of the discrete choice modeling. The GEV class of models allows flexible substitution patterns between different choice alternatives, while maintaining a simple closed form structure for the choice probabilities. The cross nested logit (CNL) model is one such kind of model proposed under the GEV theory. In order to relax the restriction of the MNL model, a cross nested logit (CNL) model structure for the joint choices of residence, job, and house reinforce under flooding or cyclone is proposed. The CNL model allows for flexible correlations among the error terms and, as a result, the correlation between the choice nests of residence, job, and house reinforce will be captured. As shown in Figure 1, the CNL mode structure includes six nests and six alternative choices. The joint choice of multiple nests results in one choice of the alternatives. In the CNL model, the dissimilarity parameter μm (0 < μm ≤1) describes the correlation between alternatives sharing the same nest m, and the correlation will decrease with the increase of the parameter. The allocation parameter αim (0 ≤ αim ≤1) indicates the proportion of alternative i belonging to nest m, and all the allocation parameters of an alternative i sum to 1 over nests. In the model structure, each alternative belongs to exactly one kind of residence nest, one kind of job nest, and one kind of house reinforce nest except for alternative choices five and six. In this two choices, residence location change is selected and thus there is no need to choose reinforce house or not.
Figure 1. Structure of the CNL model.
Sustainability 07 11612 g001
As a member of GEV models, the CNL model has closed-form expressions for the choice probabilities. Let εi represent the random element for alternative i, εi follows Gumbel distribution, and the following function gives a cumulative extreme-value distribution.
F ( ε i ) = exp { m ( i N m ( α i m e ε i ) 1 / μ m ) μ m }
Based on McFadden [42], the probability of alternative i to be chosen in the CNL model is formulated as:
P i = m P m . P i | m = m ( ( i N m ( α i m e V i ) 1 / μ m ) μ m m ( i N m ( α i m e V i ) 1 / μ m ) μ m . ( α i m e V i ) 1 / μ m i N m ( e V i ) 1 / μ m )
As shown in Equation (4), parameters to be estimated include the nest dissimilarity parameter μm, the allocation parameter αim, and the coefficients of the utility function. Based on Bierlaire [43], the CNL model is estimated with a maximum likelihood approach.
Significant factors identified from the MNL model analysis are used as the explanatory variables of the utility function of the CNL model, and, based on the proposed model structure, CNL models are estimated with BIOGEME [44]. To compare with the estimation results of the CNL model, MNL model results under the significant factors identified above are also estimated. Results of the MNL and CNL models and model comparison are presented in the next section.

3. Results and Discussions

3.1. Descriptive Analysis Results

Results of the descriptive analysis of people’s residence and job location change choices in Bangladesh are presented in Figure 2. Percentages of the six residence and job location change choices are counted for inland flooding, coastal flooding, and coastal cyclone separately. Among the results of location change choices of coastal and inland people, more people would choose changing house location (31% for inland flooding, and 39% and 45% for coastal flooding and cyclones, respectively) than changing job location (21% for inland flooding, and 20% and 18% for coastal flooding and cyclone respectively) to respond, which underlines the serious impacts that people’s houses are enduring. Under the proposed flooding scenarios, more people from inland regions choose no response or just reinforce the house, and people selecting the two choices almost reach 50% of the total inland observation. However, 39% of the coastal people would choose changing residence location in response to flooding impacts. This indicates that coastal people suffer more from flooding impact than the inland people, and changing residence location may be their best choice to adapt to coastal floods. Inland people might experience less flooding events and not need to worry about or just reinforce their houses to respond. In the coastal area, people’s location change choices are much more similar under flooding and cyclone impacts. However, more people choose to change residence location under cyclone impacts than those under flooding. This is the truth considering the more serious disruptive damage of cyclones than floods, and that reinforcing the house to respond to cyclones may be less effective.
Figure 2. Descriptive of residence and job location change choices under flooding and cyclones.
Sustainability 07 11612 g002
The Pearson Chi-square test is applied to the questionnaire data to figure out whether the above choices are statistically different between coastal and inland people under flooding and cyclone. As shown in Table 2, the Chi-square tests are significant (p = 0.00) for the choices under flooding between inland and coastal people, and as a result the null hypothesis of this test, that people’s location choices under flooding impacts in the inland area are not different from those of the coastal area in Bangladesh, should be rejected. The Chi-square analysis also gets a high value of 149.67, and this indicates that the location choices under flooding are statistically different between inland and coastal areas. The choices of coastal people under flooding and cyclone make no difference as the significance value equals to 1.000 and the Chi-square value is 0.00.
Table 2. Chi-square tests of the difference of choices from coastal and inland people.
TestDFChi2Sig.
Choices are different or not between coastal and inland people under flood?5149.670.000
Choices are different or not for coastal people between flooding and cyclone impacts.50.001.000
DF = Degree of freedom; Sig. = Significance level; Number of coastal observations = 2320; Number of inland observations = 1448.

3.2. Logistic Regression Analyses

3.2.1. MNL Model Estimation Results

As disclosed by the descriptive analysis and Chi-square test results, people’s choice behavior under flooding and cyclone impacts is statistically different in coastal and inland regions. These differences might be related to the characteristics of flooding or cyclone and socio-economic attributes of the respondents. The MNL models are developed for the three groups of observation to explore factors that affect the different choice behavior. Beta values with significance levels and standard errors of the factors in Table 1 are calculated for samples of inland flooding, coastal flooding, and coastal cyclone respectively.
Results of the coastal flooding case are shown in Table 3, and only significant factors are presented. It can be seen that socio-economic factors such as income and amount of land owned, family factor of number of family members, previous flooding experiences of quality of life (QOL) affected, and flooding factors have significant impacts on people’s residence and job location change choice. Number of family members, amount of land owned, and QOL affected all shows negative coefficient values, which indicates that the more member or land a household has, the lower the probability for it to make changes in job and residence locations. The most absolute values of these coefficients could be observed under Choice 6, and it makes sense that people are more conservative under Choice 6, that is changing both job and residence locations. Negative impacts are also reported for previous flooding and cyclone experiences, that is, people who think that his or her QOL is seriously affected would be more likely to change job or residence location or reinforce the house. The income factor shows a positive correlation with all the choices, disclosing that rich families would be more likely to make changes to their job or residence location under flooding. The biggest coefficient value 0.222 could be found under Choice 6, which shows that the rich households prefer to change both job and residence location under flooding impacts. However, there is no significant effect of income on Choice 2 (only house reinforcement) showing that most of the people in coastal Bangladesh could afford the house reinforcement whatever the income level. Flooding variables such as frequency, intensity, and salinity intrusion are almost significant at the 1% level for all the choice alternatives. Positive coefficient values of the flooding factors show that with the increase of flood frequency and intensity, significant impacts of people’s location change behavior could be observed, and people would like to change job location followed by residence location and then both job and house locations, as bigger coefficient values are calculated for Choices 5 and 6. Generally, coefficients of flood frequency are bigger than those of flood intensity, and it could be concluded that flood frequency is more important for affecting people’s choice. Under salinity intrusion, people would also like to change job or residence location as demonstrated by the negative coefficients. If connecting roads are destroyed, people may also want to change job and residence locations, which could be learnt from the negative significant coefficients of the road destruction variable for Choices 5 and 6. It is demonstrated by the biggest absolute coefficient values for most of the factors under Choices 6 that people would probably choose to move both job and residence locations when flooding impacts become more serious.
Table 3. Model estimation of coastal people’s location choice under flooding impacts (reference = choice 1).
Choice 2Choice 3Choice 4Choice 5Choice 6
Income-0.195 **0.189 **0.199 ***0.222 ***
Family member--–0.402 **–0.367 **–0.476 **
Land owned–0.200 **–0.212 *–0.407 ***–0.218 **–0.310 **
QOL affected–0.462 ***–0.267 *-–0.336 **–0.439 **
Flood frequency0.712 ***0.577 ***0.949 ***1.316 ***1.237 ***
Flood intensity0.392 ***-0.465 ***0.912 ***0.956 ***
Salinity intrusion–0.470 **–0.600 **–0.695 ***–0.636 ***–1.086 ***
Road destroy---–0.651 ***–0.450 **
Constant12.894 ***13.691 ***14.032 ***13.405 ***13.138 ***
Log likelihood–3485
Adjusted ρ20.287
Number of observation 2320
“-”denotes the factors are not significant; * significant at 10% level; ** significant at 5% level; *** significant at 1% level.
Similar to the coastal flooding observation, the location change choice of inland people under flooding is also most significantly affected by flood frequency and intensity. This means that responses to flooding factors such as frequency and intensity are similar between coastal and inland people. Income and amount of land owned are also among the significant factors affecting inland peoples’ location choice decisions. However, previous experience of QOL affected is almost insignificant for all of the choices. It could be interpreted that, different from the coastal observation, the inland households experience less flooding events and have less knowledge about how their QOL could be affected. Significant factors and significance levels of the location change choices of coastal people under cyclones are the same as those of coastal flooding observations. Cyclone frequency, intensity, and salinity intrusion are the most significant factors in people’s location choice, and income, land owned, and number of family member are significant socio-economic factors. The QOL affected in previous cyclone experience is also shown as a significant factor influencing people’s location choice. Road destruction appears as a significant factor only under Choices 5 and 6, both of which include residence location change. As a result, a conclusion could be drawn that road connection under flooding and cyclones is important for people’s residence location change decision in coastal areas.

3.2.2. CNL Model Estimation Results

With the above MNL model results, significant factors for inland flooding, coastal flooding, and coastal cyclone are selected for the CNL analysis based on the structure of Figure 1. Factors included in the analysis are shown in Table 4. The CNL model estimation results are also presented in Table 4 with a comparison with outputs of the MNL model. Overall, the CNL model outperforms the MNL model with lower absolute log likelihood values and higher adjusted ρ2 values in both inland and coastal observations, for example, the log likelihood and adjusted ρ2 values under inland flooding are −556.698 and 0.394 in the CNL model comparing those of −610.155 and 0.341 in the MNL model. Comparing with the MNL estimation results, there is not too much change in the significance levels of the proposed factors in the CNL model results, but most absolute values of the coefficients in the CNL model are smaller. For example, the coefficients of flood/cyclone frequency dropped from 0.043, 0.163, and 0.153 in the MNL model to 0.012, 0.104, and 0.059 in the CNL model for inland flooding, coastal flooding, and coastal cyclone respectively. Other factors such as flood intensity, land owned, income, and so on also received drops in coefficient values. The biggest drop in coefficient values could be found for the income factor under coastal cyclones, which is 0.3. This shows that the influences of factors on location choice behavior of the three groups of observations decrease in the CNL model. In the CNL model results, flood/cyclone frequency and intensity, number of family members, income, and QOL affected are all significant factors with significance levels of 1% and 5% under coastal flooding and cyclone impacts. Among the significant factors, QOL affected, flood/cyclone frequency, and flood/cyclone intensity are the ones that more importantly affect the choices since these factors have relatively bigger absolute coefficient values, such as 0.252 and 0.271 of QOL affected under coastal flooding and cyclones. The inland flooding observations have less significant factors than the coastal samples, that is, QOL affected, land owned, family members, flood/cyclone frequency, and salinity intrusion all become insignificant, demonstrating that the inland people are experiencing less or non-obvious flooding events compared to the coastal people and are sensitive to less influencing factors. The salinity intrusion turns out to be an insignificant factor in the CNL model under coastal flooding cases. As a result, it is concluded that flooding or cyclone frequency and intensity, family attributes, and previous experiences significantly affect people’s job and residence location choice behavior in the coastal areas, while inland people only significantly consider more about flooding and economic factors when making location choice decisions.
Table 4. Cross nested logit (CNL) model estimation results and comparison with the multinomial logit (MNL) model results.
Model TypeCNLMNL
Inland FloodingCoastal FloodingCoastal CycloneInland FloodingCoastal FloodingCoastal Cyclone
Income0.020 **0.017 **0.0210.024 **0.031 ***0.100 ***
QOL affected-−0.252 ***−0.271 ***-−0.408 ***−0.572 ***
Land owned−0.023−0.022−0.020−0.020−0.058−0.061
Family member0.0030.107 ***0.084 ***0.0280.082 **0.115 ***
Flood/cyclone frequency0.0120.104 ***0.059 **0.0430.163 ***0.153 ***
Flood/cyclone intensity 0.124 ***0.089 **0.103 ***0.230 ***0.075 *0.200 ***
Salinity intrusion-−0.028−0.037 *-−0.076 *−0.045 **
Constant1.75 *1.43 **2.01 *1.64 *1.03 ***1.79 *
Log likelihood–556.698–878.497–1026.281–610.155–924.860–1035.653
Adjusted ρ20.3940.2950.3050.3410.2830.299
“-” denotes that the factor is not included in the analysis; * significant at 10% level; ** significant at 5% level; *** significant at 1% level.
The allocation parameters of the six nests are estimated in Table 5. Under the inland flooding observation, people who choose changing job and residence locations assign almost the same weight on changing job and residence since αA6 (0.531) almost equals to αC6 (0.469) with high significance levels. However, other alternatives with significant allocation parameters assign small portions to the nests, for example, αA3, αA4, αD1, and αD2 equal to 0.125, 0.201, 0.001, and 0.005 respectively. As for the location change choice under coastal flooding, most parameters in nest D (no change in residence location) are significant, and αD4 is 0.929 and almost reaches one, showing that people choose Choice 4, that is, changing job location and reinforcing the house, mainly because that they do not want to change their residence locations. Similarly, from the values of αD1 (0.877) and αD3 (0.757), Choice 1 and Choice 3 have major impacts on nest D, which represents that people would not like to change their house locations. The allocation parameters of Choice 4 under coastal cyclones are all statistically significant, and values of the parameters demonstrate that people that select this choice assign the most weight to changing job location (αA4 = 0.630), followed by not changing residence location (αD4 = 0.370). The differences of choice behavior could be observed that people under coastal flooding who choose Choices 1, 3, and 4 mainly consider that they would not like to change their residence locations, while inland people may depend more on that they do not want to change their jobs when choosing Choice 1. When choosing Choice 3, coastal people under threat of cyclones depend more on not reinforcing houses, compared to inland people under threat of floods just because they are willing to change job locations. Table 5 also presents the dissimilarity parameters for each nest of the CNL model structure. Nest B gets significant values under the three observations, Nest D has significant value only under the coastal flooding observation, and Nest E receives dissimilarity parameters under the inland flooding observations with the highest significance level. In the case of inland flooding, Nest B has a bigger dissimilarity parameter (0.164) but lower significance level (5%) than Nest E (dissimilarity parameter is 0.032, and significance level is 5%), which means that alternatives in Nest B have low correlation and low substitutability. When the utility variable changes, for example, flooding impacts deteriorating, the inland people are willing to change the not changing job location decision first. Both Nests B and D have big dissimilarity parameters (0.853 and 0.911, respectively) under the coastal flooding observation, denoting the nest of not changing job location and not changing residence location have low substitutability. When the utility variables alter, people would change the not changing job or residence location first.
Table 5. Estimation results of CNL allocation and dissimilarity parameters.
Inland FloodingCoastal FloodingCoastal Cyclone
ValueT ValueValueT ValueValueT Value
Estimated allocation parameters
αA30.125 ***−11.680.004-0.229−0.76
αA40.201 ***−4.930.017-0.630 ***−3.12
αA60.531 **−2.310-1.00−0.00
αB10.990−0.020.123 ***−36.740.977−0.44
αB20.992−0.040.048−0.000.020−0.00
αB50.994-1.00−0.011.00−0.00
αC50.006--−50.56-−0.00
αC60.469 ***−2.621.00−0.00-−0.00
αD10.001 *−1.920.877 ***−5.160.023 ***−18.52
αD20.005 ***−7.720.011−0.000.002 ***−7.33
αD30.703−0.160.757 ***−5.610.001 ***−4.81
αD40.767-0.929 ***−2.970.370 ***−5.23
αE20.003 ***−71.670.941−0.020.978−0.00
αE40.032-0.054--−34.48
αF10.009 ***−9.420--−0.00
αF30.172−0.460.239-0.770−0.22
Estimated dissimilarity parameters
Nest A0.4580.350.001-0.6631.38
Nest B0.164 **1.700.853 **1.440.126 *1.88
Nest C0.078-0.001-0.0410.01
Nest D0.0010.030.911 **1.570.053-
Nest E0.032 ***5.420.001-0.001-
Nest F0.001-0.0020.050.011-
“-” means no T value available; * significant at 10% level; ** significant at 5% level; *** significant at 1% level.
In general, the above results confirm the higher frequency of people’s job or residence location change in Bangladesh if the climate changes in a more serious way, which was also reported in other research work in Bangladesh [34,40] and other parts of the world [33,35,38]. The economic factors such as income have proved to have an important impact on the location change behavior, which conforms to previous research results [21,35,40]. This study also identified factors such as land owned, family size, and transportation infrastructure as significant factors in people’s job and residence location choice decision in the MNL model, and similar results are also reported in previous works [31,33,36,37]. However, in the CNL model, only the family member factor significantly affects people’s choice decisions. The CNL model result may make better sense since the land owned is correlated with income when making location change decision, and, in the MNL model, the two variables are treated independently, and the results would be biased. Unlike daily commuting travel, the conditions of transportation infrastructure might not be people’s top factors when making location change decision. As a result, proper models such as the GEV class of models would produce more accurate results. Besides, the above factors also have significant effects on people’s job location change, but the coefficients are smaller than those of residence location change, which is rarely reported in the literature.

4. Conclusions

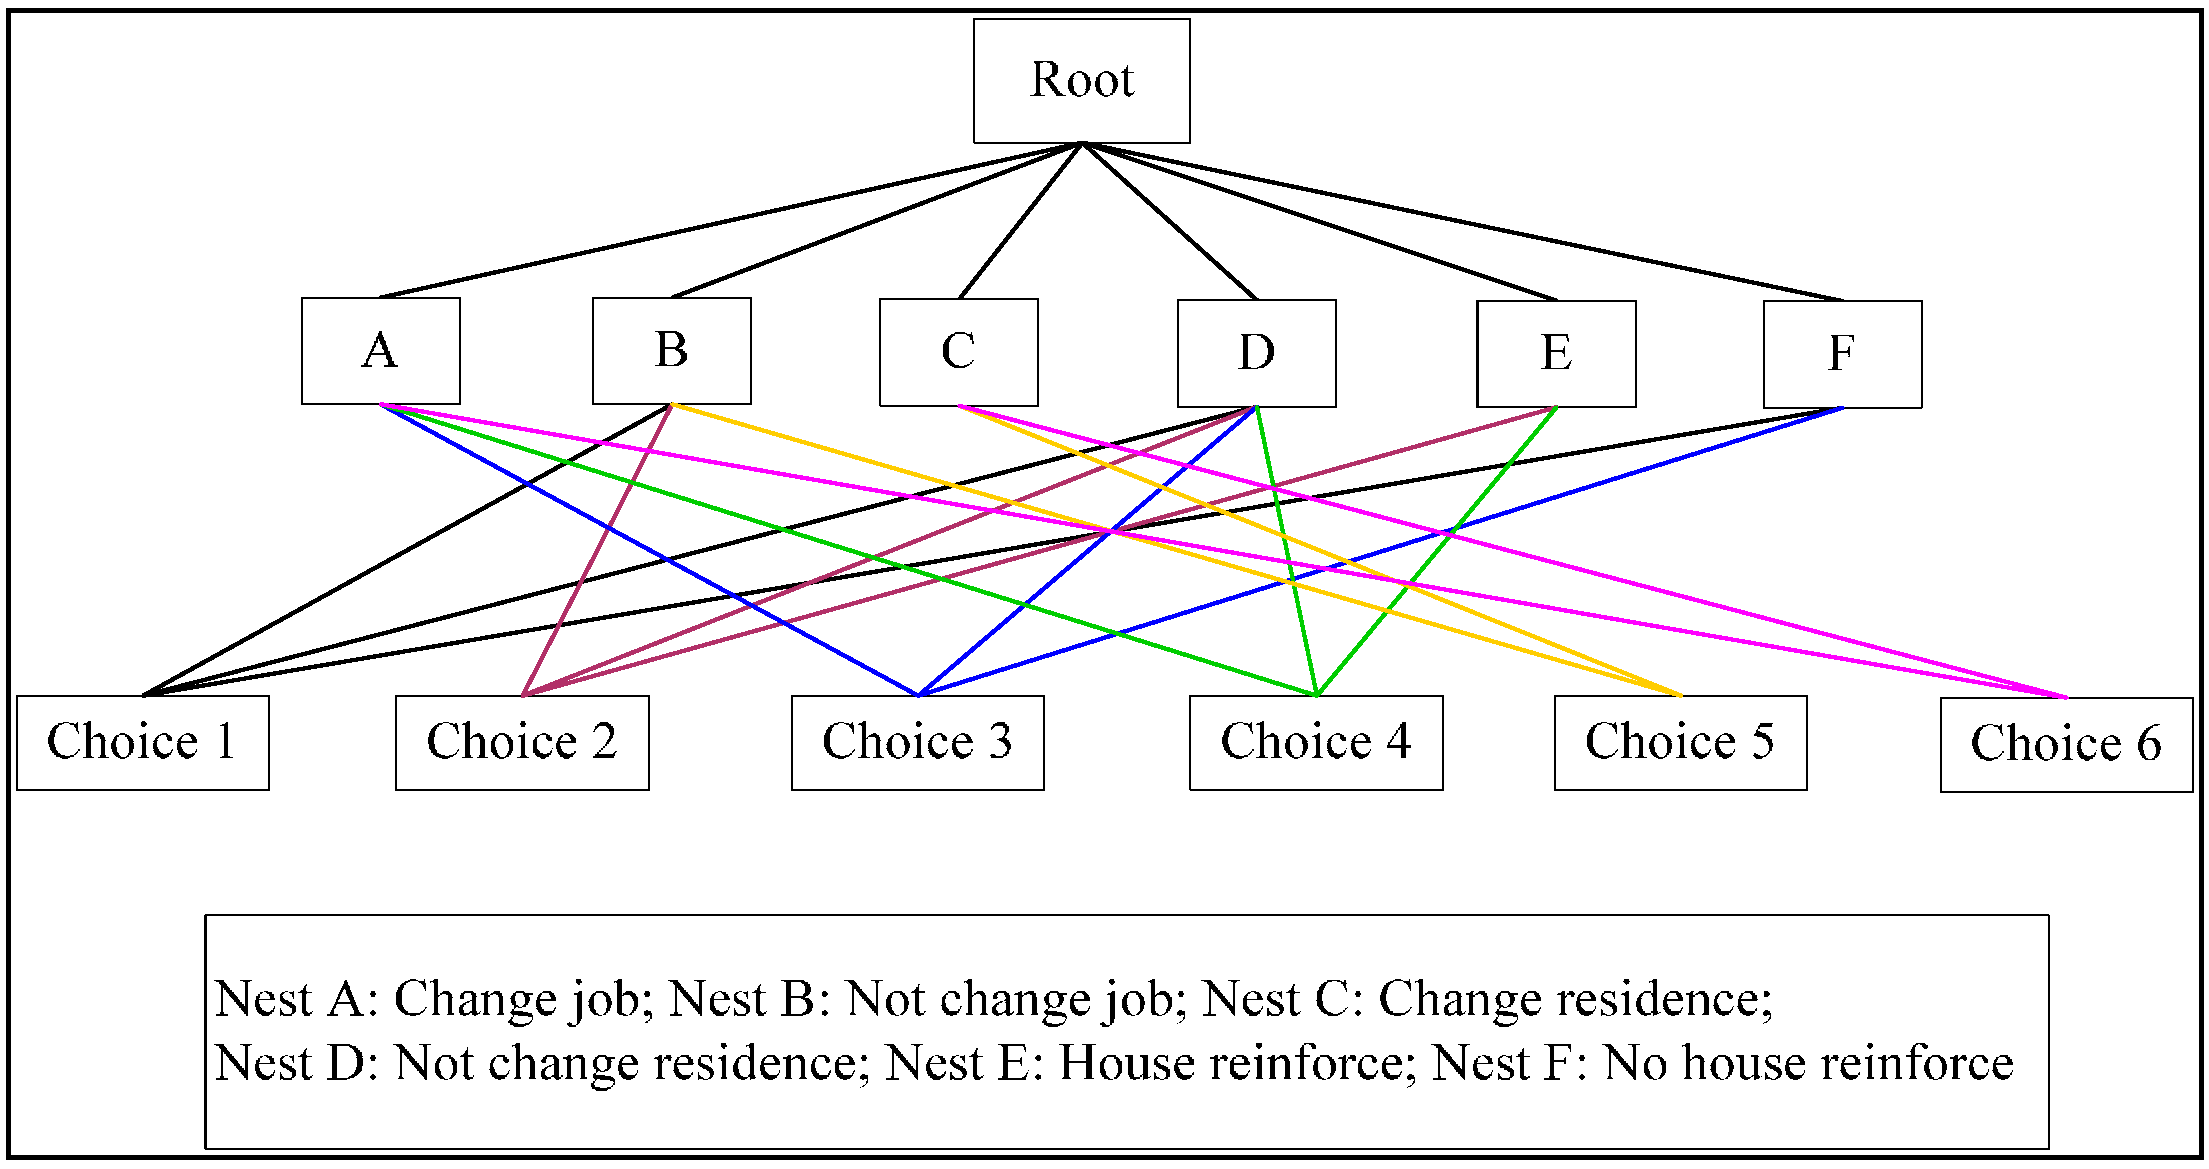
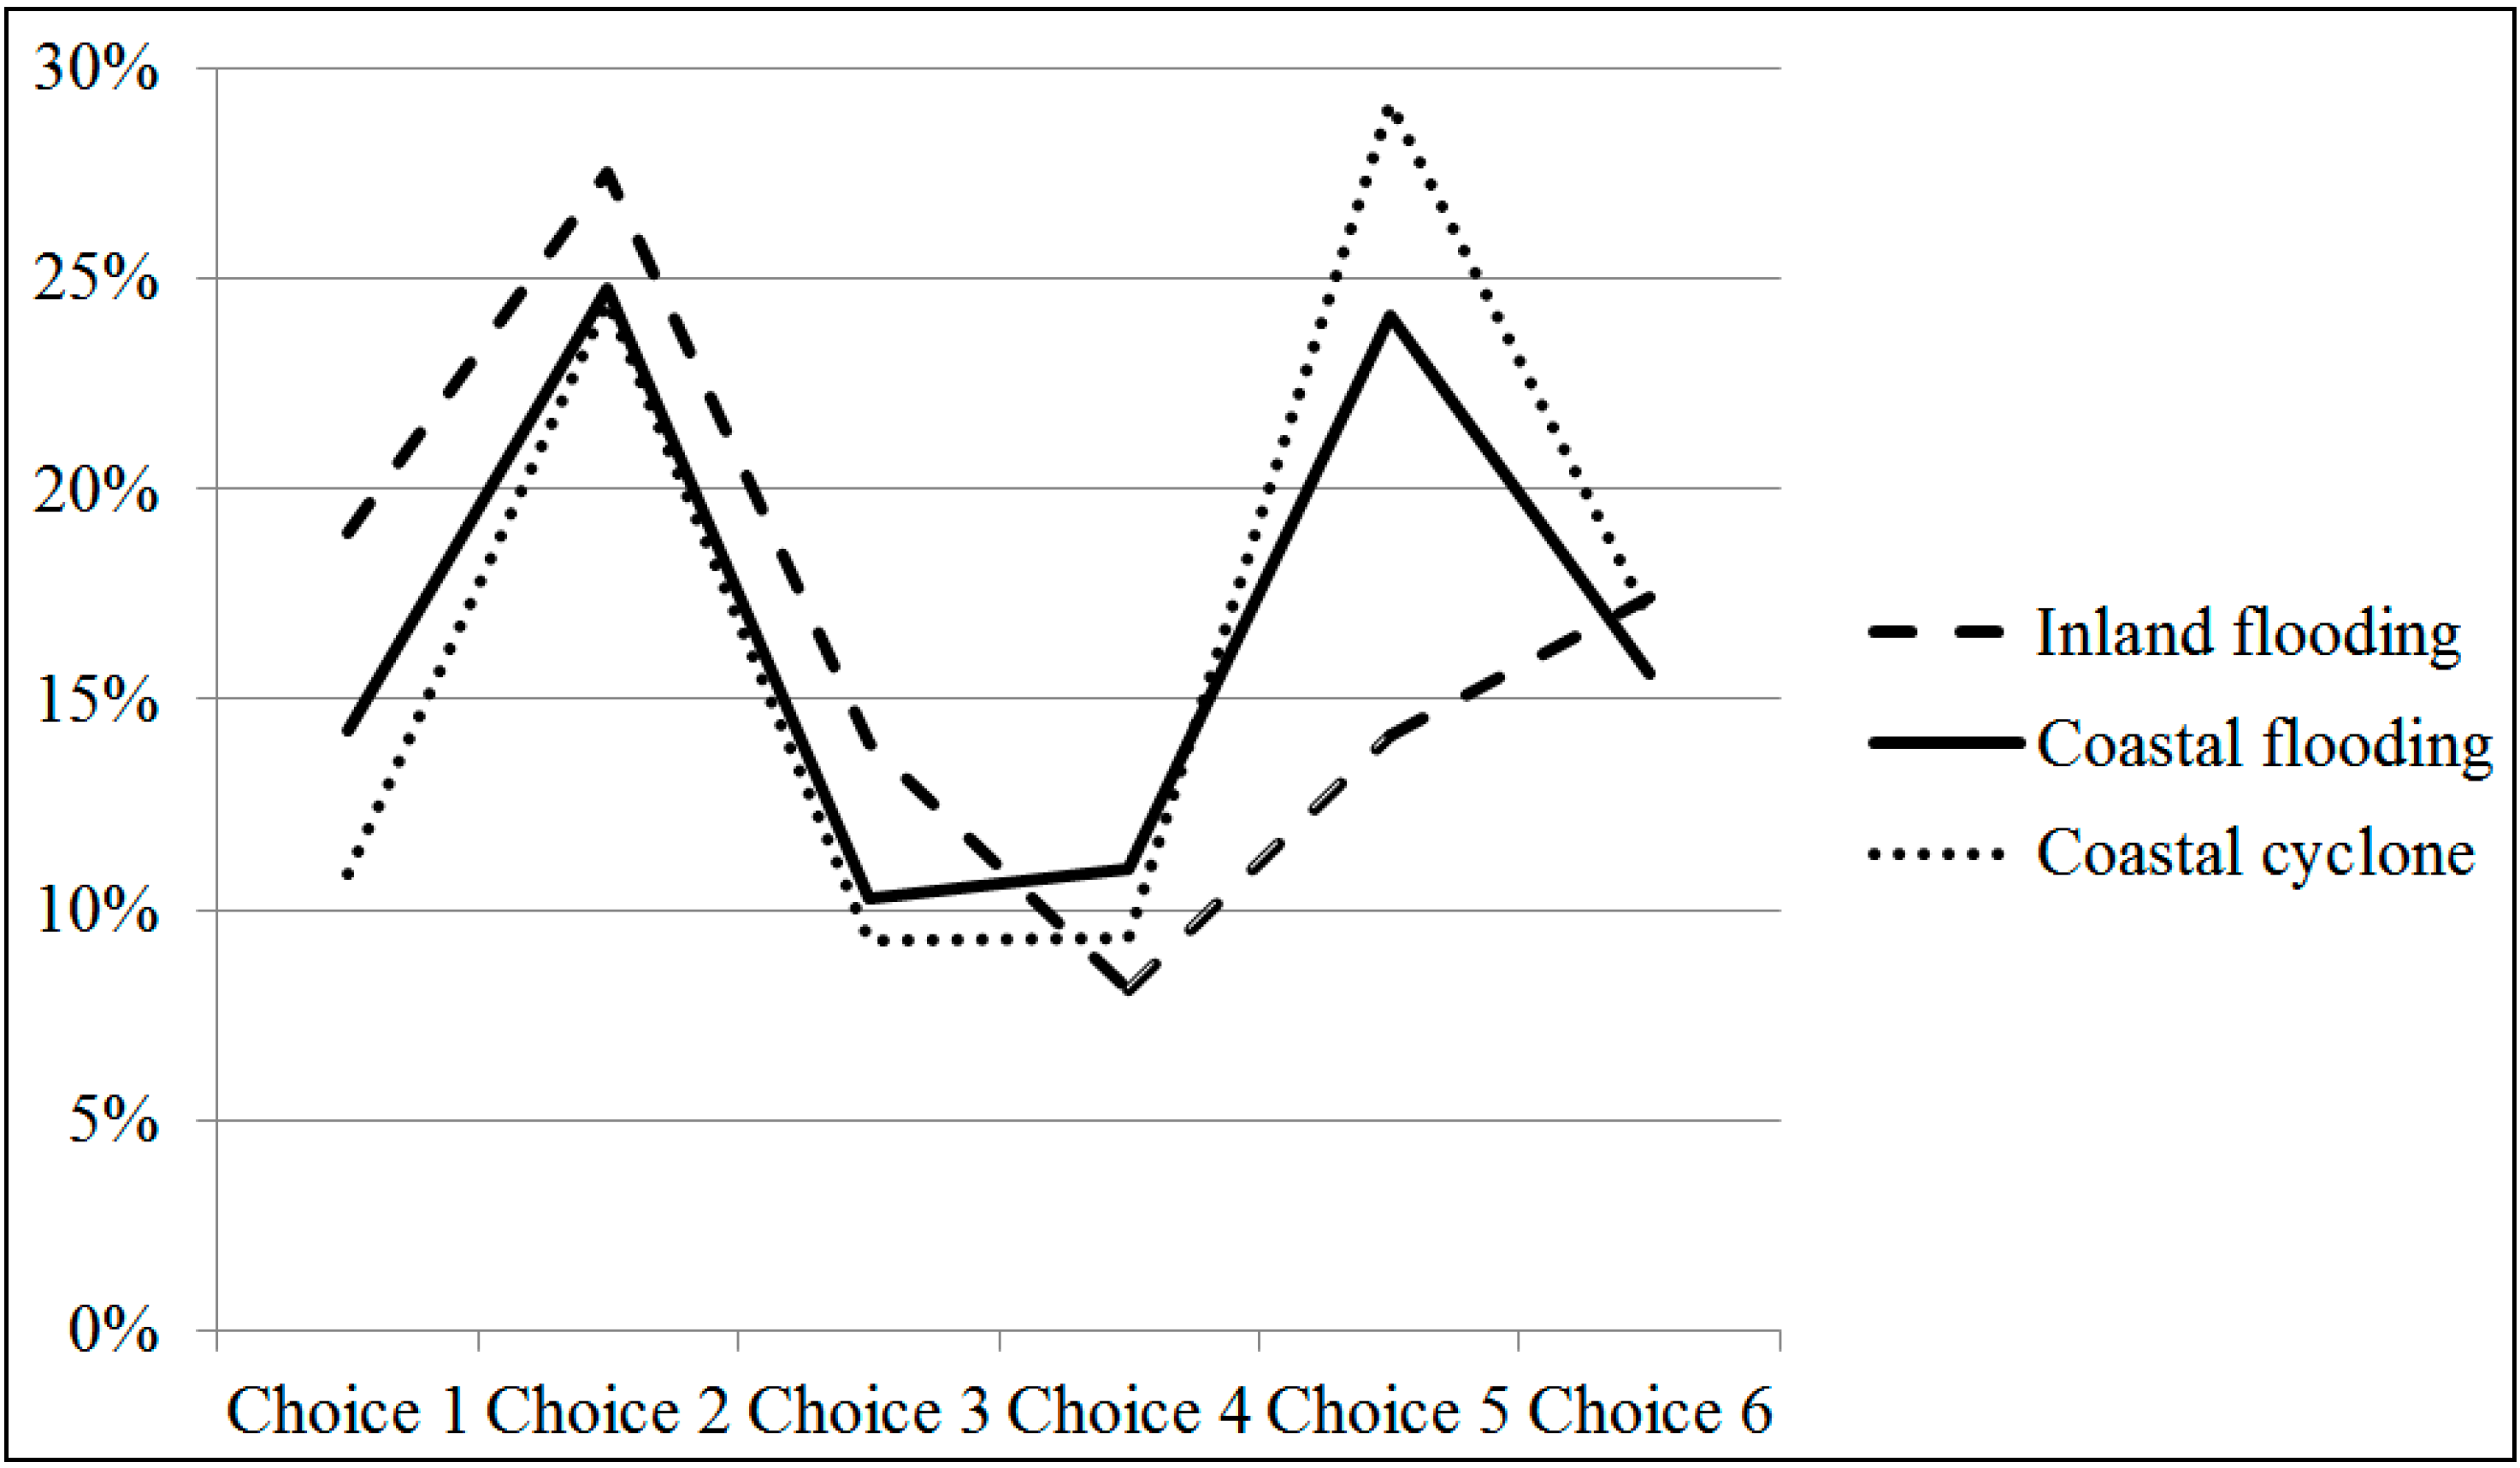
Efforts of this work were made on investigating significant factors influencing people’s location choice behavior at the origin in coastal and inland areas of Bangladesh, and exploring the joint choice behavior among residence, job locations, and house reinforcement through a proposed CNL model structure. Results of this study confirm the serious impacts that floods and cyclones are imposing on Bengalese people, and more than 80 percent of the respondents would like to make changes to their houses or jobs. Flooding and cyclone attributes such as frequency and intensity turn out to be the most significant factors affecting people’s choice behavior, and income, number of family members, and amount of land owned also show significant effects on the location change choice, which confirms the results of previous studies. Different from coastal observations, the inland people may be less affected by floods, and thus previous experiences such as QOL shows insignificant influences. Road connections play an important and significant role when people choose to change residence locations in coastal areas. The CNL model shows better model fitting results than the MNL model and could give more insights on people’s location choice behavior. Under flooding or cyclone impacts, people would like to change their job locations and then residence locations. It is also found that if there are changes in flooding impacts, the inland people will consider changing their job locations, while the coastal people would consider both job and residence location changes.
Results of this work add to the understanding of location change choice behavior adapting to flood and cyclone impacts in a developing and seriously affected country. As disclosed by the study, there is an obvious change of residence or job location in both coastal and inland areas under flooding and cyclone scenarios. This location change behavior should be addressed in transportation network performance analysis, and failing to include these changes might neglect the differences in travel demand, travel attraction, and route choice resulting in inaccurate analysis results. The study also sheds light on policy suggestions for local governments and families adapting to flooding and cyclone impacts. People with high income, less land, and fewer family members are encouraged to migrate to safety places, and coastal households are suggested to go to shelters or change job and residence locations under cyclone threats, since reinforcing the house is not a significant factor in the analysis. It is important to guarantee accessible road infrastructure under flooding or cyclone failing of which might significantly lead to people’s residence location change. The above conclusions could be learnt by the government to be included in migration and land use planning policies, shelter planning and construction, transportation infrastructure investment, and so on, so as to help people safely evacuate or avoid being affected in flooding and cyclone events.
However, this research is not without its limitations. Factors at the job or residence locations to be moved, socio-economic connections with the target locations, and the moving costs are not included in the model. It is incomplete to only address the mentioned flooding/cyclone scenarios and factors, and more flooding and cyclone scenarios, socio-economic factors, family attributes, and choice alternatives such as going to shelters are expected to be addressed. More detailed and accurate behavioral characteristics of people’s choice behaviors should be explored under climate change. People’s behavioral changes are not only affected by flooding and cyclone impacts, combined impacts resulted from heavy rainfall, extremely hot or cold weather, and sea-level rise, together with floods and cyclones are not addressed in this work. Finally, findings and conclusions of this research may better fit situations in Bangladesh, and comparative analyses of people’s residence and job location change choice behavior response between regions or nations with different climates, flooding and cyclone impacts, living traditions, and adaptive capacity are also preferable.

Acknowledgments

This research is financially supported by Ministry of Education, Culture, Sports, Science, and Technology (MEXT) in Japan under the Special Coordination Funds for Promotion of Science and Technology at Hiroshima University. The authors would also like to acknowledge the support of the National Natural Science Foundation of China (51408356) for this research. Any opinions, findings and conclusions or recommendations expressed in this paper are those of the authors and do not necessarily reflect the views of the sponsors.

Author Contributions

Qing-Chang Lu and Linjun Lu conceived and designed the whole research; Qing-Chang Lu analyzed the data and wrote the paper, Linjun Lu proposed the research framework, and ABM Sertajur Rahman carried out the survey and did the preliminary analysis of the survey data. All authors have read and approved the final manuscript.

Conflicts of Interest

The authors declare no conflict of interest.
The founding sponsors had no role in the design of the study; in the collection, analyses, or interpretation of data; in the writing of the manuscript, and in the decision to publish the results.

Appendix

Table A1. Coastal flooding scenario cards.
ScenariosFlood Frequency LevelFlood Intensity Level
(Reference: average adult body)
Permanent/Frequent Inundation Your Area is Isolated by WaterRoads to Other Cities Destroyed Permanently
Scenario card (I)
1every yearreaches waistNoNoNo
2every yearreaches waistYesYesNo
3once every 2 yearsreaches waistYesNoYes
4once every 3 yearsreaches waistNoYesYes
Scenario card (II)
1once every 2 yearsreaches chest or aboveNoYesYes
2every yearreaches kneesYesYesYes
3every year reaches kneesYesYesYes
4once every 3 yearsreaches chest or aboveYesNoYes
Scenario card (III)
1once every 3 yearsreaches kneesNoYesNo
2once every 2 yearsreaches kneesYesNoNo
3once every 2 yearsreaches kneesNoYesNo
4every yearreaches kneesNoNoYes
Scenario card (IV)
1every yearreaches kneesNoNoYes
2once every 3 yearsreaches kneesYesNoNo
3every yearreaches chest or aboveNoNoNo
4every yearreaches chest or aboveYesYesNo
Table A2. Coastal cyclone scenario cards.
ScenariosCyclone Frequency LevelCyclone Intensity LevelPermanent/Frequent Inundation Your Area is Isolated by WaterRoads to Other Cities Destroyed Permanently
Scenario card (I)
1twice a yearSome complete house structure failureNoNoNo
2twice a yearYesYesNo
3once a yearYesNoYes
4once every 2 yearsNoYesYes
Scenario card (II)
1twice a yearSome structural damage to housesYesYesYes
2twice a yearYesYesYes
3once every 2 yearsComplete failure on many housesYesNoYes
4once a yearNoYesYes
Scenario card (III)
1once every 2 yearsSome structural damage to housesNoYesNo
2once a yearYesNoNo
3once a yearNoYesNo
4twice a yearNoNoYes
Scenario card (IV)
1twice a yearSome structural damage to housesNoNoYes
2once every 2 yearsYesNoNo
3twice a yearComplete failure on many housesNoNoNo
4twice a yearYesYesNo
Table A3. Inland flooding scenario cards.
ScenariosFlood Frequency LevelFlood Intensity Level
(Reference: average adult body)
Frequent Inundation Your Area is Isolated by WaterRoads to Other Cities Destroyed Permanently
Scenario card (I)
1once every 3 yearsreaches kneesYesNoNo
2every yearreaches waistNoNoNo
3once every 2 yearsreaches kneesNoNoYes
4once every 3 yearsreaches waistYesNoYes
Scenario card (II)
1every yearreaches kneesYesYesYes
2every yearreaches chest or aboveYesNoYes
3once every 2 yearsreaches waistYesYesNo
4every yearreaches kneesYesNoNo
Scenario card (III)
1once every 2 yearsreaches kneesYesYesYes
2once every 3 yearsreaches kneesNoYesNo
3every yearreaches waistNoYesYes
4once every 3 yearsreaches chest or aboveNoYesYes
Scenario card (IV)
1every yearreaches kneesNoYesNo
2every yearreaches kneesNoNoYes
3every yearreaches chest or aboveYesYesNo
4once every 2 yearsreaches chest or aboveNoNoNo

References

  1. Bangladesh Bureau of Statistics. Bangladesh Bureau of Statistics; Statistical Yearbook of Bangladesh: Dhaka, Bangladesh, 2005.
  2. Alam, M.J.B.; Alamgir, M.; Hoque, M.M. Assessment of Economic Loss Caused by Flood Damaged Transportation Network in Engineering Concerns of Floods a 1998 Perspective; Extension and Research Services: Dhaka, Bangladesh, 2002. [Google Scholar]
  3. Karim, M.F.; Mimura, N. Impacts of Climate Change and Sea-Level Rise on Cyclonic Storm Surge Floods in Bangladesh. Glob. Environ. Change 2008, 18, 490–500. [Google Scholar] [CrossRef]
  4. Schiermeier, Q. Holding Back the Tide. Nature 2014, 508, 164–166. [Google Scholar] [CrossRef] [PubMed]
  5. Taylor, M.A.P.; Sekhar, S.V.C.; D’Este, G.M. Application of accessibility based methods for vulnerability analysis of strategic road networks. Netw. Spat. Econ. 2006, 3, 267–291. [Google Scholar] [CrossRef]
  6. Seyedshohadaie, S.R.; Damnjanovic, I.; Butenko, S. Risk-based maintenance and rehabilitation decisions for transportation infrastructure networks. Transp. Res. Part A 2010, 44, 236–248. [Google Scholar] [CrossRef]
  7. Lu, Q.-C.; Peng, Z.-R. Vulnerability analysis of transportation network under scenarios of sea level rise. Transp. Res. Rec. 2011, 2263, 174–181. [Google Scholar] [CrossRef]
  8. Scott, D.M.; Novak, D.C.; Aultman-Hall, L.; Guo, F. Network robustness index: a new method for identifying critical links and evaluating the performance of transportation networks. J. Transp. Geogr. 2006, 14, 215–227. [Google Scholar] [CrossRef]
  9. Sullivan, J.L.; Novak, D.C.; Aultman-Hall, L.; Scott, D.M. Identifying critical road segments and measuring system-wide robustness in transportation networks with isolating links. Transp. Res. Part A 2010, 44, 323–336. [Google Scholar]
  10. Lu, Q.-C.; Peng, Z.-R.; Du, R. Economic analysis of sea-level rise impacts and adaptation strategies in transportation. Transp. Res. Rec. 2012, 2273, 54–61. [Google Scholar] [CrossRef]
  11. Lu, Q.-C.; Peng, Z.-R.; Zhang, L.; Wang, Z. Economic analyses of sea-level rise adaptation strategies in transportation considering spatial autocorrelation. Transp. Res. Part D 2014, 33, 87–94. [Google Scholar] [CrossRef]
  12. Koetse, M.J.; Rietveld, P. The impact of climate change and weather on transport: An overview of empirical findings. Transp. Res. Part D 2009, 14, 205–221. [Google Scholar] [CrossRef]
  13. Cools, M.; Moons, E.; Creemers, L.; Wets, G. Changes in travel behavior response to weather conditions. Transp. Res. Rec. 2010, 2157, 22–28. [Google Scholar] [CrossRef]
  14. Saneinejad, S.; Roorda, M.J.; Kennedy, C. Modeling the impact of weather conditions on active transportation travel behavior. Transp. Res. Part D 2012, 17, 129–137. [Google Scholar] [CrossRef]
  15. Böcker, L.; Prillwitz, J.; Dijst, M. Climate change impacts on mode choice and traveled distances: A comparison of present with 2050 weather conditions for the Randstad Holland. J. Transp. Geogr. 2013, 28, 176–185. [Google Scholar] [CrossRef]
  16. Khattak, A.; Palma, A. The impact of adverse weather conditions on the propensity to change travel decisions: A survey of Brussels commuters. Transp. Res. Part A 1997, 31, 181–203. [Google Scholar] [CrossRef]
  17. Sohn, J. Evaluating the significance of highway network links under the flood damage: An accessibility approach. Transp. Res. Part A 2006, 40, 491–506. [Google Scholar] [CrossRef]
  18. Jenelius, E. Network structure and travel patterns: Explaining the geographical disparities of road network vulnerability. J. Transp. Geogr. 2009, 17, 234–244. [Google Scholar] [CrossRef]
  19. Chen, B.Y.; Lam, W.H.K.; Sumalee, A.; Li, Q.; Li, Z.-C. Vulnerability analysis for large-scale and congested road networks with demand uncertainty. Transp. Res. Part A 2012, 46, 501–516. [Google Scholar] [CrossRef]
  20. Jenelius, E.; Mattsson, L.-G. Road network vulnerability analysis of area-covering disruptions: A grid-based approach with case study. Transp. Res. Part A 2012, 46, 746–760. [Google Scholar] [CrossRef]
  21. Klaiber, H.A. Migration and household adaptation to climate: A review of empirical research. Energy Econ. 2014, 46, 539–547. [Google Scholar] [CrossRef]
  22. Nurlaela, S.; Curtis, C. Modeling household residential location choice and travel behavior and its relationship with public transport accessibility. Procedia Soc. Behav. Sci. 2012, 54, 56–64. [Google Scholar] [CrossRef]
  23. Balica, S.F.; Wright, N.G.; Meulen, V. A flood vulnerability index for coastal cities and its use in assessing climate change impacts. Nat. Hazards 2012, 64, 73–105. [Google Scholar] [CrossRef]
  24. Yang, L.; Zheng, G.; Zhu, X. Cross-nested logit model for the joint choice of residential location, travel mode, and departure time. Habitat Int. 2013, 38, 157–166. [Google Scholar] [CrossRef]
  25. Sermons, M.W.; Koppelman, F.S. Representing the differences between female and male commuting behavior in residential location choice models. J. Transp. Geogr. 2001, 9, 101–110. [Google Scholar] [CrossRef]
  26. Choocharukul, K.; Van, H.T.; Fujii, S. Psychological effects of travel behavior on preference of residential location choice. Transp. Res. Part A 2008, 42, 116–124. [Google Scholar] [CrossRef]
  27. Birkmann, J.; Cardona, O.D.; Carreño, M.L.; Barbat, A.H.; Pelling, M.; Schneiderbauer, S.; Kienberger, S.; Keiler, M.; Alexander, D.; Zeil, P.; et al. Framing vulnerability, risk and societal responses: the MOVE framework. Nat. Hazards 2013, 67, 193–211. [Google Scholar] [CrossRef]
  28. Wang, D.; Chai, Y. The jobs-housing relationship and commuting in Beijing, China: the legacy of Danwei. J. Transp. Geogr. 2009, 17, 30–38. [Google Scholar] [CrossRef]
  29. Loo, B.P.Y.; Chow, A.S.Y. Jobs-housing balance in an era of population decentralization: An analytical framework and a case study. J. Transp. Geogr. 2011, 19, 552–562. [Google Scholar] [CrossRef]
  30. Arentze, T.; Timmermans, H. Congestion pricing scenarios and change of job or residential location: Results of a stated adaptation experiment. J. Transp. Geogr. 2007, 15, 56–61. [Google Scholar] [CrossRef]
  31. Mortreux, C.; Barnett, J. Climate change, migration and adaptation in Funafuti, Tuvalu. Glob. Environ. Change 2009, 19, 105–112. [Google Scholar] [CrossRef]
  32. McLeman, R. Developments in modelling of climate change-related migration. Climatic Change 2013, 117, 599–611. [Google Scholar] [CrossRef]
  33. Kniveton, D.; Smith, C.; Wood, S. Agent-based model simulations of future changes in migration flows for Burkina Faso. Glob. Environ. Change 2011, 215, s34–s40. [Google Scholar] [CrossRef]
  34. Hassani-Mahmooei, B.; Parris, B.W. Climate change and internal migration patterns in Bangladesh: an agent-based model. Environ. Dev. Econ. 2012, 17, 763–780. [Google Scholar] [CrossRef]
  35. Saldana-Zorrilla, S.O.; Sandberg, K. Impacts of climate-related disasters on human migration in Mexico: A spatial model. Clim. Change 2009, 96, 97–118. [Google Scholar] [CrossRef]
  36. Doevenspeck, M. The thin line between choice and flight: environment and migration in rural Benin. Int. Migr. 2011, 49, e50–e68. [Google Scholar] [CrossRef]
  37. Gray, C. Soil quality and human migration in Kenya and Uganda. Glob. Environ. Change 2011, 21, 421–430. [Google Scholar] [CrossRef] [PubMed]
  38. Kavi Kumar, K.S.; Viswanathan, B. Influence of weather on temporary and permanent migration in rural India. Clim. Change Econ. 2013, 4, 1350007. [Google Scholar] [CrossRef]
  39. Wolf, J.; Allice, I.; Bell, T. Values, climate change, and implications for adaptation: Evidence from two communities in Labrador, Canada. Glob. Environ. Change 2013, 43, 548–562. [Google Scholar] [CrossRef]
  40. Iqbal, K.; Roy, P.K. Climate Change, Agriculture and Migration: Evidence from Bangladesh. Clim. Change Econ. 2015, 6, 1550006. [Google Scholar] [CrossRef]
  41. Lu, Q.-C.; Zhang, J.; Peng, Z.-R.; Rahman, S.A.B.M. Inter-city travel behaviour adaptation to extreme weather events. J. Transp. Geogr. 2014, 41, 148–153. [Google Scholar] [CrossRef]
  42. MacFadden, D. Modeling the choice of residential location. Transp. Res. Rec. 1978, 672, 72–77. [Google Scholar]
  43. Bierlaire, M.A. Theoretical analysis of the cross-nested logit model. Ann. Oper. Res. 2006, 144, 287–300. [Google Scholar] [CrossRef]
  44. Bierlaire, M.A. BIOGEME: A free package for the estimation of discrete choice models. In Proceedings of the 3rd Swiss Transportation Research Conference, Ascona, Switzerland, 19–21 March 2003.

