
A Novel Forecasting Methodology for Sustainable Management of Defense Technology

Abstract
:1. Introduction
2. Related Work
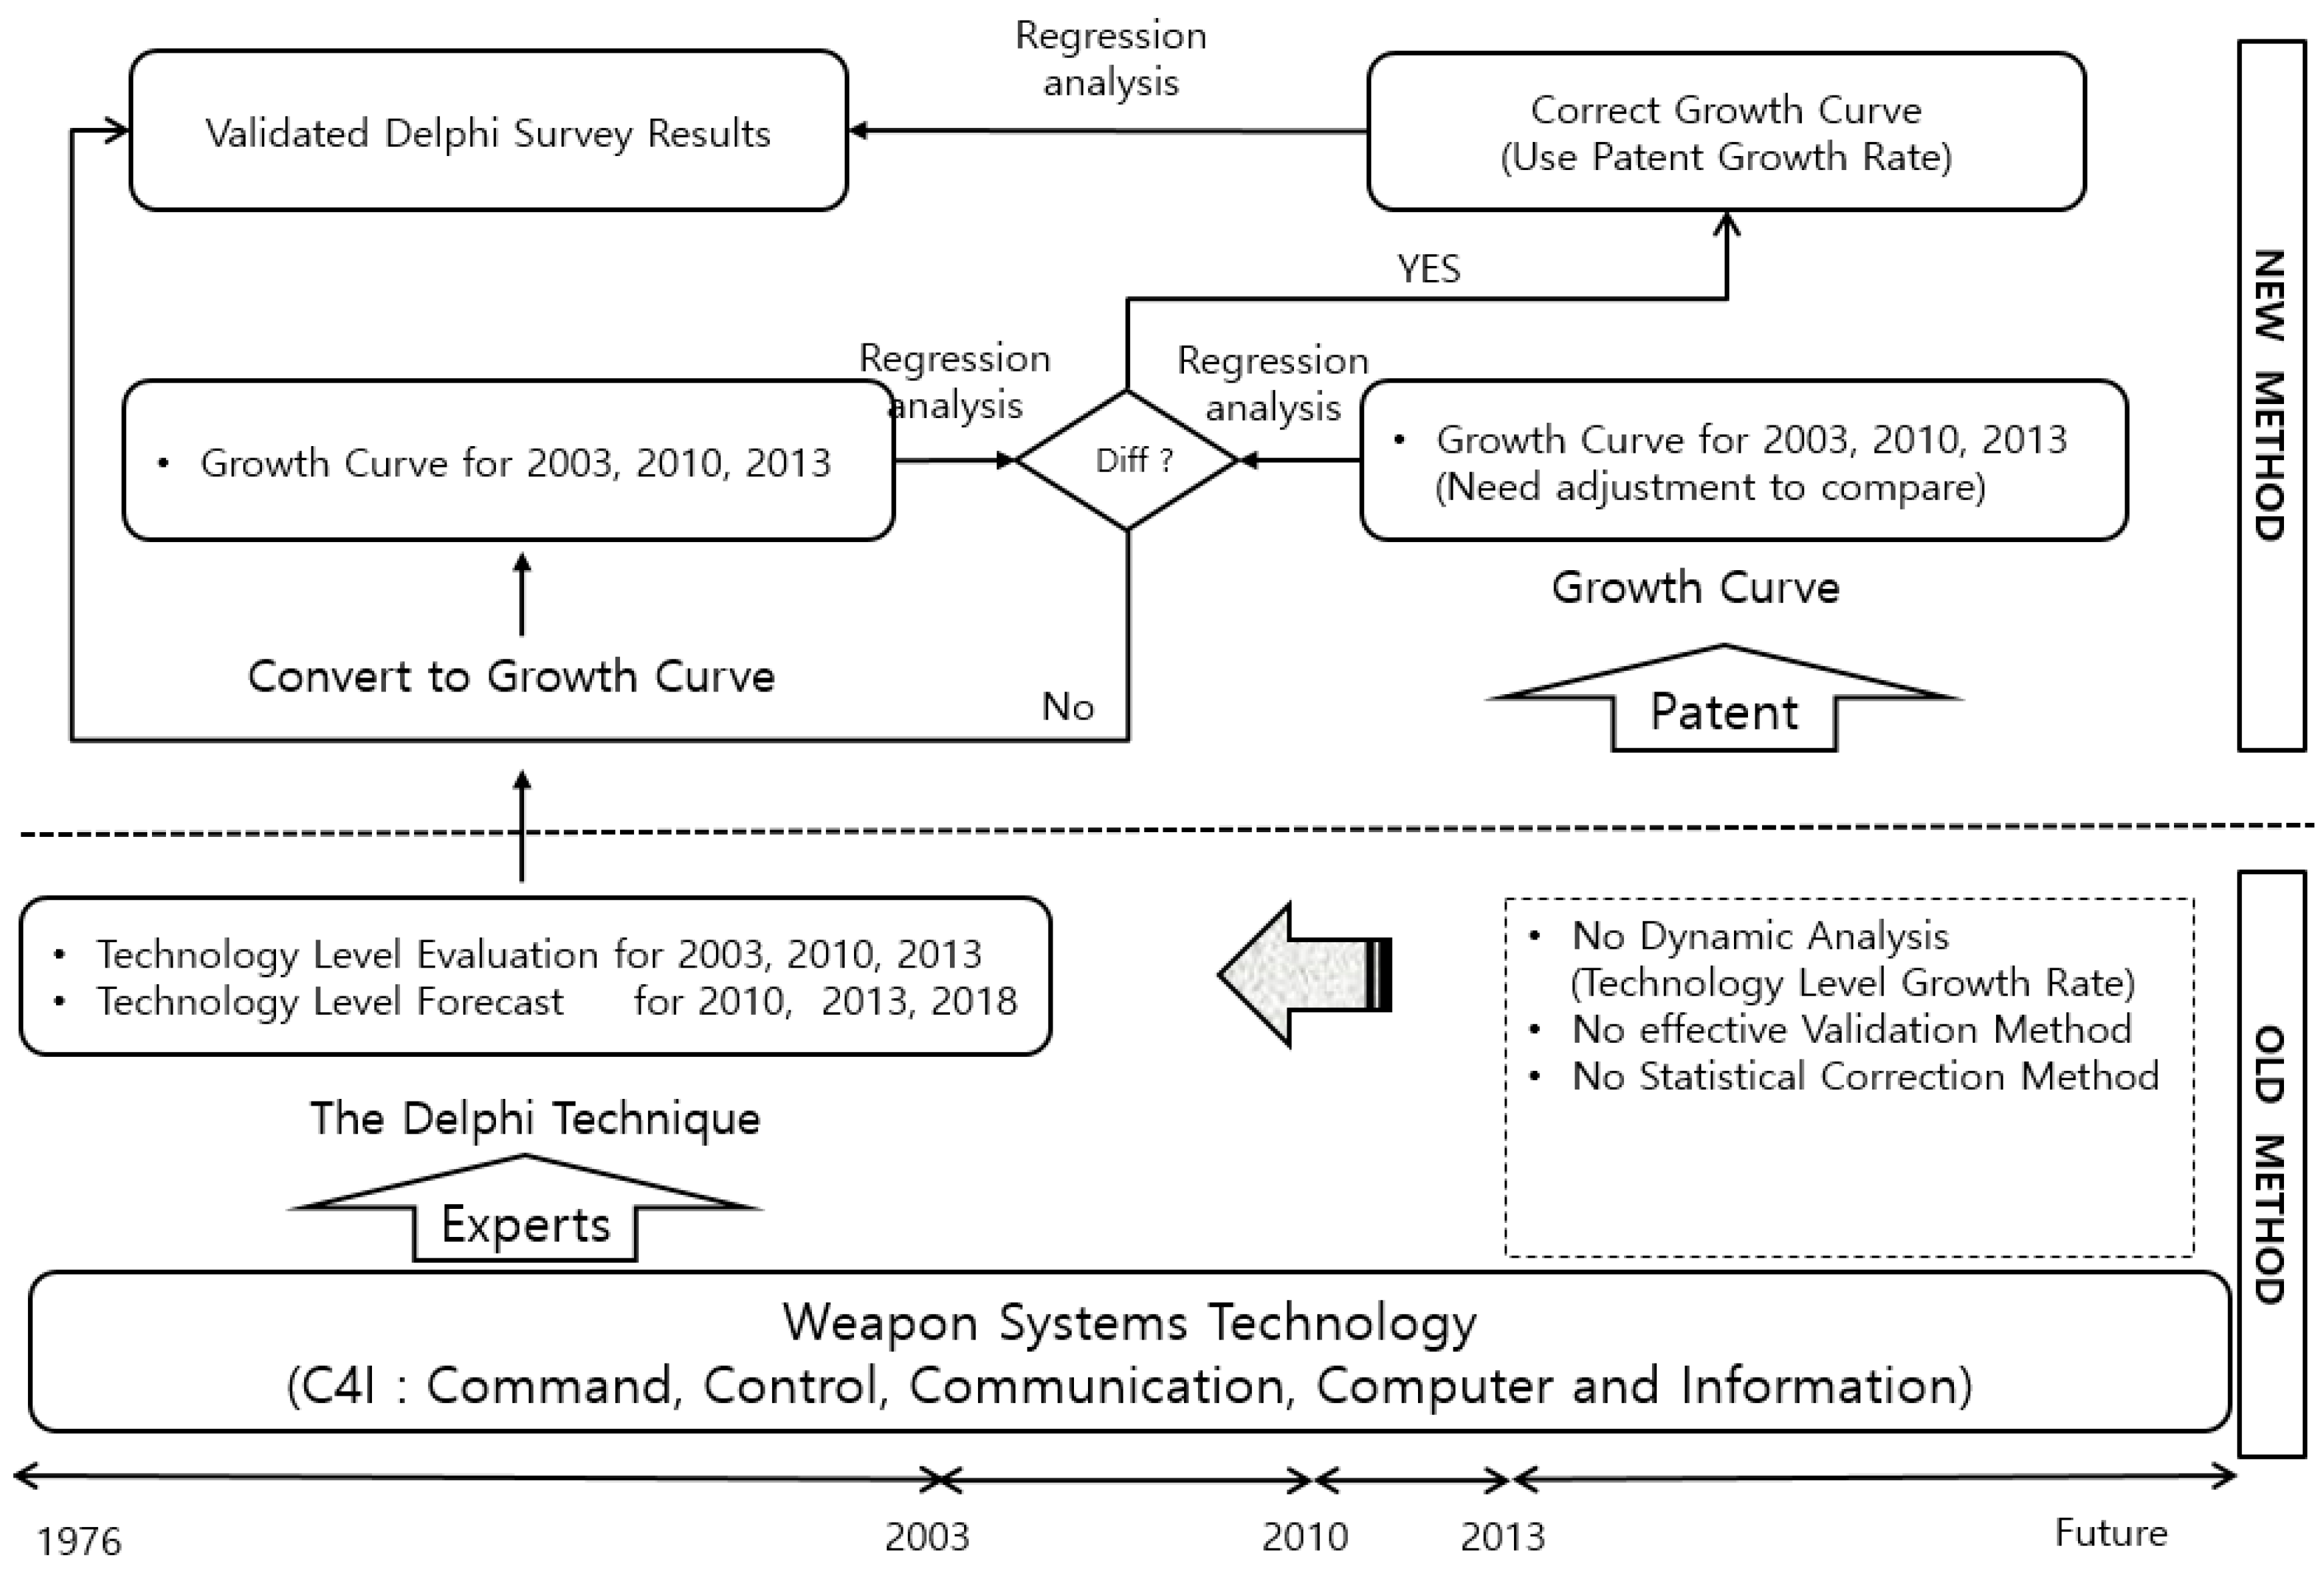
3. Proposed Method

3.1. Derivation of the Survey-Based Growth Curve
3.2. Derivation of the Patent-Based Growth Curve
3.3. Verification of the Derived Growth Curves
- Step 1: Identify the regression analysis result of the survey-based growth model.
- Step 2: Identify the regression analysis result of the patent-based growth model.
- Step 3: Identify whether the confidence intervals of the two growth curves overlap.
3.4. Correctly Derived Growth Curves
- A: Rate of increase in the patent-based growth curve in the base year
- α1, β1: Parameters of the survey-based growth curve
- α2, β2: Parameters of the patent-based growth curve
- (1)
- The old method is focused on static analysis, which makes a comparison in the present with the country of the highest technology level as the criterion. It makes time series analysis impossible to conduct. On the other hand, the proposed method uses the Delphi result for the growth curve, which allows for conducting time series analysis to understand the technology development stages.
- (2)
- There are no verification and adjustment processes with patent in old method.


| Method | Survey | Static Analysis | Dynamic Analysis | Verification | Correlation |
|---|---|---|---|---|---|
| Old Method |
|
| N/A | N/A | N/A |
| Proposed New Method |
|
|
|
|
|
4. Experimental Results and Analysis
4.1. Survey-Based Growth Curve
| Weapon Systems | Technology Name | 2003 Survey | 2010 Survey | 2013 Survey | |||
|---|---|---|---|---|---|---|---|
| 2003 | 2010 | 2010 | 2013 | 2013 | 2018 | ||
| C4I | Common Operational Picture Tech. | 70 | 80 | 75 | 85 | 80 | 90 |
| Systems Surveillance and Control Tech. | 60 | 80 | 77 | 84 | 79 | 88 | |
| Data Fusion Tech. | 52 | 63 | 75 | 86 | 77 | 87 | |
| Situation and Threat Evaluation Tech. | 65 | 75 | 69 | 80 | 73 | 80 | |
| Information Management and Analysis Tech. | 75 | 82 | 79 | 86 | 81 | 92 | |
| Systems Interoperability Tech. | 66 | 83 | 78 | 86 | 81 | 92 | |
| Technology Name | Survey Year | Technology Occurrence Year | Parameter α | Parameter β | Inflection Point (lnβ/α) | Sum of Squared Errors (SSE) |
|---|---|---|---|---|---|---|
| Common Operational Picture Tech. | 2003 | 1964 | 0.07 | 1.78 | 1988 | 2.07568 × 10⁻¹⁰ |
| 2010 | 1994 | 0.19 | 105.00 | 2003 | 1.53091 × 10⁻⁶ | |
| 2013 | 1991 | 0.15 | 36.69 | 2003 | 4.64809 × 10⁻⁷ | |
| Systems Surveillance and Control Tech. | 2003 | 1983 | 0.12 | 8.74 | 1998 | 1.71566 × 10⁻⁷ |
| 2010 | 1987 | 0.13 | 17.14 | 2000 | 8.36200 × 10⁻⁸ | |
| 2013 | 1987 | 0.12 | 15.07 | 2001 | 2.27701 × 10⁻⁵ | |
| Data Fusion Tech. | 2003 | 1960 | 0.05 | 2.15 | 1995 | 1.99857 × 10⁻⁷ |
| 2010 | 1996 | 0.22 | 227.02 | 2004 | 3.51160 × 10⁻⁶ | |
| 2013 | 1989 | 0.13 | 18.87 | 2002 | 4.11392 × 10⁻⁶ | |
| Situation and Threat Evaluation Tech. | 2003 | 1959 | 0.06 | 1.72 | 1989 | 5.81908 × 10⁻⁹ |
| 2010 | 1994 | 0.17 | 70.93 | 2004 | 4.23032 × 10⁻⁵ | |
| 2013 | 1971 | 0.07 | 3.26 | 1996 | 2.22658 × 10⁻⁸ | |
| Information Management and Analysis Tech. | 2003 | 1948 | 0.05 | 1.03 | 1979 | 1.62091 × 10⁻⁸ |
| 2010 | 1989 | 0.15 | 23.78 | 2000 | 2.47212 × 10⁻⁶ | |
| 2013 | 1995 | 0.19 | 114.73 | 2005 | 2.04372 × 10⁻⁵ | |
| Systems Interoperability Tech. | 2003 | 1980 | 0.11 | 6.50 | 1996 | 4.25663 × 10⁻⁸ |
| 2010 | 1991 | 0.17 | 42.97 | 2002 | 2.88339 × 10⁻⁵ | |
| 2013 | 1995 | 0.19 | 114.73 | 2005 | 2.04372 × 10⁻⁵ |
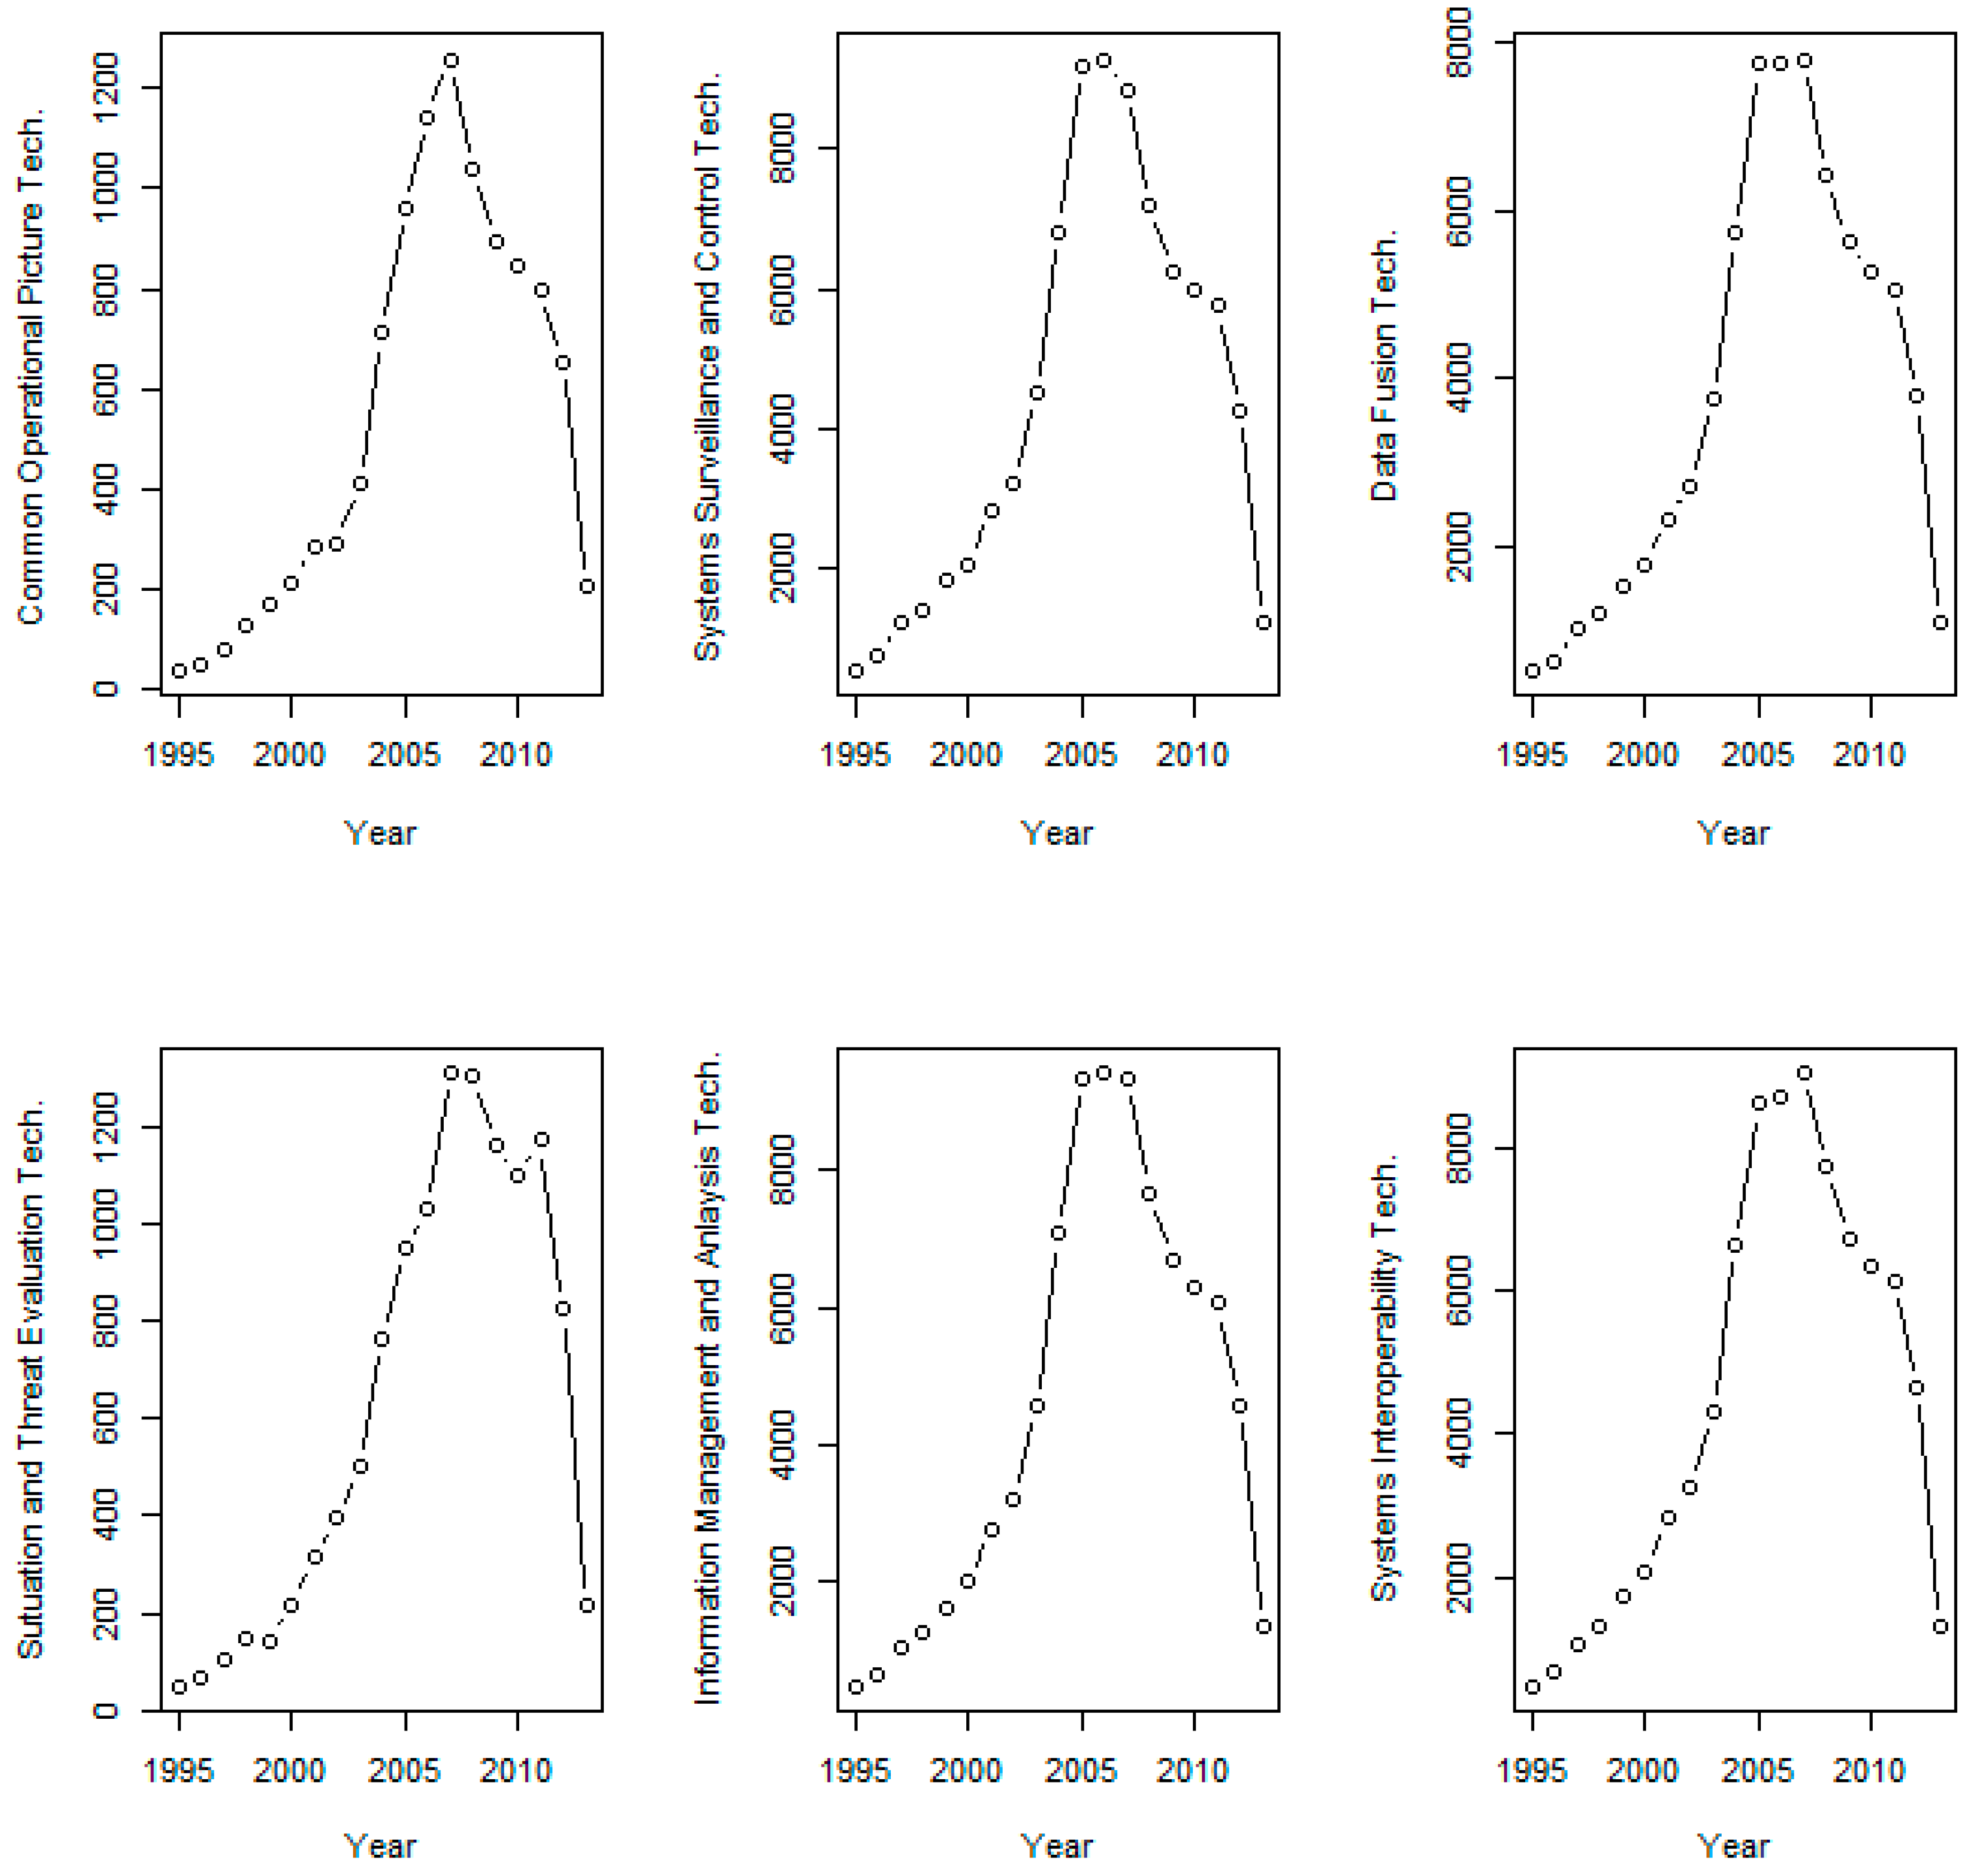
4.2. Patent-Based Growth Curve
| Target Technology | Definition | Search Query |
|---|---|---|
| Common Operational Picture Tech. | Digital information network system. Real-time convergence and automation of all intelligence sources, including international information management system and joint command information system. Shows battlefield at a glance. | (COP + (common × operational × picture) + map) × (draw + drawing + graphic + show + showing + display + illustrate) |
| Systems Surveillance and Control Tech. | System management technology, conducts monitoring and controlling to satisfy user’s needs. | (C4I + system + computer) × (surveillance + control + management) |
| Data Fusion Tech. | Credible and implicative information production based on comparison, evaluation, and integration of each system’s various sensors | (data + information + sensor + knowledge) × (fusion + comparison + evaluation + convert) |
| Situation and Threat Evaluation Tech. | Risk evaluation technology based on current battlefield situation with data convergence | (situation + threat) × (evaluation + algorithm + order) |
| Information Management and Analysis Tech. | Classification, categorization, disposal of technology by distinguishing important data from useless information. Collection of various data such as weather, topography, target information, and location per a second. | (data + information + sensor + knowledge) × (store + storage + manage + management + analysis + classification + categorize + discard) |
| Systems Interoperability Tech. | Communication between program and application support technology. Enables connection among distributed system; computing environment; and other hardware, protocol, or communication network. | (hardware + protocol + system) × (interoperability + standard + communication + share + sharing + exchange + operation) |
| Year | Common Operational Picture Tech. | Systems Surveillance and Control Tech. | Data Fusion Tech. | Situation and Threat Evaluation Tech. | Information Management and Analysis Tech. | Systems Interoperability Tech. |
|---|---|---|---|---|---|---|
| 1994 | 18 | 245 | 196 | 14 | 188 | 185 |
| 1995 | 37 | 538 | 504 | 50 | 462 | 470 |
| 1996 | 52 | 777 | 629 | 65 | 629 | 685 |
| 1997 | 80 | 1235 | 1031 | 103 | 1045 | 1042 |
| 1998 | 128 | 1422 | 1214 | 147 | 1265 | 1318 |
| 1999 | 170 | 1853 | 1509 | 144 | 1624 | 1724 |
| 2000 | 214 | 2046 | 1783 | 216 | 1983 | 2083 |
| 2001 | 287 | 2855 | 2324 | 314 | 2771 | 2818 |
| 2002 | 289 | 3231 | 2709 | 394 | 3191 | 3249 |
| 2003 | 413 | 4515 | 3750 | 501 | 4576 | 4303 |
| 2004 | 711 | 6820 | 5717 | 764 | 7077 | 6631 |
| 2005 | 961 | 9171 | 7738 | 947 | 9339 | 8607 |
| 2006 | 1141 | 9285 | 7754 | 1029 | 9432 | 8712 |
| 2007 | 1258 | 8824 | 7798 | 1309 | 9348 | 9042 |
| 2008 | 1039 | 7203 | 6401 | 1305 | 7682 | 7743 |
| 2009 | 893 | 6245 | 5641 | 1162 | 6693 | 6704 |
| 2010 | 846 | 6006 | 5259 | 1098 | 6304 | 6333 |
| 2011 | 795 | 5757 | 5048 | 1171 | 6057 | 6124 |
| 2012 | 655 | 4259 | 3772 | 823 | 4584 | 4652 |
| 2013 | 205 | 1228 | 1072 | 215 | 1335 | 1293 |

| Technology Name | Survey Year | Technology Level | α | β | Inclination | |||
|---|---|---|---|---|---|---|---|---|
| Survey | Patents | Survey | Patents | Survey | Patents | |||
| Common Operational Picture Tech. | 2003 | 70 | 0.07 | 0.14 | 1.78 | 47.11 | 3.11 | 164.67 |
| 2010 | 75 | 0.19 | 0.08 | 105 | 28.13 | 430.44 | 48.55 | |
| 2013 | 80 | 0.15 | 0.17 | 36.69 | 121.1 | 98.25 | 367.51 | |
| Systems Surveillance and Control Tech. | 2003 | 60 | 0.12 | 0.14 | 8.74 | 47.06 | 32.15 | 201.93 |
| 2010 | 77 | 0.13 | 0.08 | 17.14 | 28.41 | 44.84 | 45.74 | |
| 2013 | 79 | 0.12 | 0.17 | 15.07 | 121.13 | 33.68 | 383.47 | |
| Data Fusion Tech. | 2003 | 52 | 0.05 | 0.18 | 2.15 | 66.14 | 3.66 | 398.67 |
| 2010 | 75 | 0.22 | 0.09 | 227.02 | 28.56 | 1077.61 | 55.46 | |
| 2013 | 77 | 0.13 | 0.16 | 18.87 | 83.4 | 49.37 | 268.55 | |
| Situation and Threat Evaluation Tech. | 2003 | 65 | 0.06 | 0.09 | 1.72 | 25.34 | 2.89 | 63.86 |
| 2010 | 69 | 0.17 | 0.13 | 70.93 | 58.64 | 308.73 | 195.18 | |
| 2013 | 73 | 0.07 | 0.1 | 3.26 | 32.84 | 5.24 | 75.45 | |
| Information Management and Analysis Tech. | 2003 | 75 | 0.05 | 0.15 | 1.03 | 48.4 | 1.11 | 155.15 |
| 2010 | 79 | 0.15 | 0.13 | 23.78 | 59.03 | 66.42 | 142.9 | |
| 2013 | 81 | 0.19 | 0.17 | 114.73 | 118.75 | 372.07 | 344.57 | |
| Systems Interoperability Tech. | 2003 | 66 | 0.11 | 0.14 | 6.5 | 43.48 | 19.61 | 166.94 |
| 2010 | 78 | 0.17 | 0.1 | 42.97 | 30.38 | 141.57 | 58.88 | |
| 2013 | 81 | 0.19 | 0.16 | 114.73 | 83.13 | 372.07 | 227.02 | |
4.3. Verification of Growth Curves
| Technology Name | Survey Year | Survey-Based Growth Curve Regression Coefficients | Patent-Based Growth Curve Regression Coefficients | Confidence Interval | ||
|---|---|---|---|---|---|---|
| 95% Confidence Interval | 95% Confidence Interval | Overlap | ||||
| Lower | Upper | Lower | Upper | (Yes/No) | ||
| Common Operational Picture Tech. | 2003 | 0.83024 | 1.01808 | 1.12528 | 1.48076 | N |
| 2010 | 1.4075 | 1.78188 | 1.08785 | 1.33166 | N | |
| 2013 | 1.4065 | 1.74371 | 1.42143 | 1.77499 | Y | |
| Systems Surveillance and Control Tech. | 2003 | 1.20453 | 1.5255 | 1.21419 | 1.56421 | Y |
| 2010 | 1.307 | 1.64241 | 1.03883 | 1.28447 | N | |
| 2013 | 1.35198 | 1.66048 | 1.45262 | 1.80009 | Y | |
| Data Fusion Tech. | 2003 | 1.00648 | 1.13655 | 1.31166 | 1.69054 | N |
| 2010 | 1.4246 | 1.81283 | 1.20777 | 1.47808 | Y | |
| 2013 | 1.39038 | 1.698 | 1.46498 | 1.79974 | Y | |
| Situation and Threat Evaluation Tech. | 2003 | 0.86127 | 1.0216 | 1.05844 | 1.31829 | N |
| 2010 | 1.43861 | 1.79015 | 1.39459 | 1.7073 | Y | |
| 2013 | 1.12966 | 1.32869 | 1.36189 | 1.62798 | N | |
| Information Management and Analysis Tech. | 2003 | 0.63017 | 0.75559 | 1.08663 | 1.45505 | N |
| 2010 | 1.31092 | 1.66297 | 1.27867 | 1.6154 | Y | |
| 2013 | 1.44633 | 1.80931 | 1.44932 | 1.80252 | Y | |
| Systems Interoperability Tech. | 2003 | 1.11871 | 1.43656 | 1.17763 | 1.53158 | Y |
| 2010 | 1.35227 | 1.71637 | 1.15153 | 1.43342 | Y | |
| 2013 | 1.44633 | 1.80931 | 1.40929 | 1.75456 | Y | |
| Technology Name | Survey Year | Survey-Based Growth Curve Regression Coefficients | Patent-Based Growth Curve Regression Coefficients | Confidence Interval | ||
|---|---|---|---|---|---|---|
| 95% Confidence Interval | 95% Confidence Interval | Overlap | ||||
| Lower | Upper | Lower | Upper | (Yes/No) | ||
| Common Operational Picture Tech. | 2003 | 0.79962 | 1.0487 | 1.06732 | 1.53872 | N |
| 2010 | 1.34646 | 1.84292 | 1.0481 | 1.37141 | Y | |
| 2013 | 1.35152 | 1.79869 | 1.36379 | 1.83263 | Y | |
| Systems Surveillance and Control Tech. | 2003 | 1.1522 | 1.57783 | 1.15713 | 1.62127 | Y |
| 2010 | 1.25231 | 1.69709 | 0.99877 | 1.32452 | Y | |
| 2013 | 1.30168 | 1.71078 | 1.39596 | 1.85674 | Y | |
| Data Fusion Tech. | 2003 | 0.98528 | 1.15776 | 1.24989 | 1.75232 | N |
| 2010 | 1.3613 | 1.87613 | 1.1637 | 1.52216 | Y | |
| 2013 | 1.34023 | 1.74816 | 1.4104 | 1.85432 | Y | |
| Situation and Threat Evaluation Tech. | 2003 | 0.83513 | 1.04774 | 1.01608 | 1.36065 | Y |
| 2010 | 1.3813 | 1.84747 | 1.3436 | 1.75828 | Y | |
| 2013 | 1.09721 | 1.36114 | 1.31851 | 1.67137 | Y | |
| Information Management and Analysis Tech. | 2003 | 0.60972 | 0.77604 | 1.02656 | 1.51512 | N |
| 2010 | 1.25352 | 1.72037 | 1.22377 | 1.6703 | Y | |
| 2013 | 1.38715 | 1.86849 | 1.39174 | 1.86011 | Y | |
| Systems Interoperability Tech. | 2003 | 1.06689 | 1.48839 | 1.11992 | 1.58928 | Y |
| 2010 | 1.29291 | 1.77573 | 1.10557 | 1.47938 | Y | |
| 2013 | 1.38715 | 1.86849 | 1.353 | 1.81086 | Y | |
4.4. Correction of the Growth Curves
| Year | Common Operational Picture Tech. | Systems Surveillance and Control Tech. | Data Fusion Tech. | Situation and Threat Evaluation Tech. | Information Management and Analysis Tech. | Systems Interoperability Tech. |
|---|---|---|---|---|---|---|
| 1994 | - | - | - | - | - | - |
| 1995 | 2.055556 | 2.195918 | 2.571429 | 3.571429 | 2.457447 | 2.540541 |
| 1996 | 0.945455 | 0.992337 | 0.898571 | 1.015625 | 0.967692 | 1.045802 |
| 1997 | 0.747664 | 0.791667 | 0.775771 | 0.79845 | 0.817045 | 0.777612 |
| 1998 | 0.684492 | 0.508766 | 0.514407 | 0.633621 | 0.54432 | 0.553317 |
| 1999 | 0.539683 | 0.439412 | 0.422216 | 0.379947 | 0.452494 | 0.465946 |
| 2000 | 0.441237 | 0.337068 | 0.350777 | 0.413002 | 0.380395 | 0.384034 |
| 2001 | 0.410587 | 0.351774 | 0.338479 | 0.424899 | 0.385075 | 0.375383 |
| 2002 | 0.293103 | 0.294504 | 0.294777 | 0.374169 | 0.320157 | 0.314673 |
| 2003 | 0.323922 | 0.317913 | 0.315153 | 0.346234 | 0.347773 | 0.317003 |
| 2004 | 0.421209 | 0.364375 | 0.365327 | 0.392197 | 0.399064 | 0.370924 |
| 2005 | 0.400584 | 0.359126 | 0.362164 | 0.349189 | 0.376406 | 0.351191 |
| 2006 | 0.339583 | 0.267518 | 0.266424 | 0.281224 | 0.276193 | 0.263083 |
| 2007 | 0.279493 | 0.200577 | 0.211569 | 0.279224 | 0.214492 | 0.216176 |
| 2008 | 0.180413 | 0.136377 | 0.14334 | 0.217609 | 0.145135 | 0.152215 |
| 2009 | 0.131362 | 0.104049 | 0.110484 | 0.159134 | 0.110424 | 0.114379 |
| 2010 | 0.109999 | 0.090636 | 0.092755 | 0.129726 | 0.093663 | 0.096959 |
| 2011 | 0.093124 | 0.079659 | 0.081476 | 0.122464 | 0.082286 | 0.085472 |

| Technology Name | Survey Year | Survey-Based Growth Curve Regression Coefficients | Patent-Based Growth Curve Regression Coefficients | Proposed Growth Curve Regression Coefficients | Confidence Interval | |||
|---|---|---|---|---|---|---|---|---|
| 95% Confidence Interval | 95% Confidence Interval | 95% Confidence Interval | Overlap | |||||
| Lower | Upper | Lower | (Yes/No) | Lower | Upper | (Yes/No) | ||
| Common Operational Picture Tech. | 2003 | 0.83024 | 1.01808 | 1.12528 | 1.48076 | 0.93152 | 1.17398 | Y |
| 2010 | 1.40750 | 1.78188 | 1.08785 | 1.33166 | 1.23202 | 1.51885 | Y | |
| 2013 | 1.40650 | 1.74371 | 1.42143 | 1.77499 | 1.41641 | 1.76416 | Y | |
| Systems Surveillance and Control Tech. | 2003 | 1.20453 | 1.52550 | 1.21419 | 1.56421 | 1.20789 | 1.53856 | Y |
| 2010 | 1.30700 | 1.64241 | 1.03883 | 1.28447 | 1.15687 | 1.43591 | Y | |
| 2013 | 1.35198 | 1.66048 | 1.45262 | 1.80009 | 1.44388 | 1.78645 | Y | |
| Data Fusion Tech. | 2003 | 1.00648 | 1.13655 | 1.41756 | 1.73126 | 1.13448 | 1.36212 | N |
| 2010 | 1.42460 | 1.81283 | 1.20777 | 1.47808 | 1.24914 | 1.65367 | Y | |
| 2013 | 1.39038 | 1.69800 | 1.46498 | 1.79974 | 1.40514 | 1.84521 | Y | |
| Situation and Threat Evaluation Tech. | 2003 | 0.86127 | 1.02160 | 1.05844 | 1.31829 | 0.89413 | 1.14930 | Y |
| 2010 | 1.43861 | 1.79015 | 1.39459 | 1.70730 | 1.36207 | 1.79914 | Y | |
| 2013 | 1.12966 | 1.32869 | 1.36189 | 1.62798 | 1.29215 | 1.63263 | Y | |
| Information Management and Analysis Tech. | 2003 | 0.63017 | 0.75559 | 1.08663 | 1.45505 | 0.79789 | 1.00969 | N |
| 2010 | 1.31092 | 1.66297 | 1.27867 | 1.61540 | 1.23572 | 1.68989 | Y | |
| 2013 | 1.44633 | 1.80931 | 1.44932 | 1.80252 | 1.39136 | 1.86079 | Y | |
| Systems Interoperability Tech. | 2003 | 1.11871 | 1.43656 | 1.17763 | 1.53158 | 1.08710 | 1.52584 | Y |
| 2010 | 1.35227 | 1.71637 | 1.15153 | 1.43342 | 1.18527 | 1.59423 | Y | |
| 2013 | 1.44633 | 1.80931 | 1.40929 | 1.75456 | 1.35612 | 1.81559 | Y | |
| Technology Name | Survey Year | Survey-Based Growth Curve Regression Coefficients | Patent-Based Growth Curve Regression Coefficients | Proposed Growth Curve Regression Coefficients | Confidence Interval | |||
|---|---|---|---|---|---|---|---|---|
| 95% Confidence Interval | 95% Confidence Interval | 95% Confidence Interval | Overlap | |||||
| Lower | Upper | Lower | Upper | Lower | Upper | (Yes/No) | ||
| Common Operational Picture Tech. | 2003 | 0.79962 | 1.04870 | 1.06732 | 1.53872 | 0.89199 | 1.21351 | Y |
| 2010 | 1.34646 | 1.84292 | 1.04810 | 1.37141 | 1.18525 | 1.56562 | Y | |
| 2013 | 1.35152 | 1.79869 | 1.36379 | 1.83263 | 1.35971 | 1.82086 | Y | |
| Systems Surveillance and Control Tech. | 2003 | 1.15220 | 1.57783 | 1.15713 | 1.62127 | 1.15398 | 1.59247 | Y |
| 2010 | 1.25231 | 1.69709 | 0.99877 | 1.32452 | 1.11137 | 1.48141 | Y | |
| 2013 | 1.30168 | 1.71078 | 1.39596 | 1.85674 | 1.38803 | 1.84230 | Y | |
| Data Fusion Tech. | 2003 | 0.98528 | 1.15776 | 1.36641 | 1.78241 | 1.09737 | 1.39923 | Y |
| 2010 | 1.36130 | 1.87613 | 1.16370 | 1.52216 | 1.24914 | 1.65367 | Y | |
| 2013 | 1.34023 | 1.74816 | 1.41040 | 1.85432 | 1.40514 | 1.84521 | Y | |
| Situation and Threat Evaluation Tech. | 2003 | 0.83513 | 1.04774 | 1.01608 | 1.36065 | 0.89413 | 1.14930 | Y |
| 2010 | 1.38130 | 1.84747 | 1.34360 | 1.75828 | 1.36207 | 1.79914 | Y | |
| 2013 | 1.09721 | 1.36114 | 1.31851 | 1.67137 | 1.29215 | 1.63263 | Y | |
| Information Management and Analysis Tech. | 2003 | 0.60972 | 0.77604 | 1.02656 | 1.51512 | 0.76336 | 1.04423 | Y |
| 2010 | 1.25352 | 1.72037 | 1.22377 | 1.67030 | 1.23572 | 1.68989 | Y | |
| 2013 | 1.38715 | 1.86849 | 1.39174 | 1.86011 | 1.39136 | 1.86079 | Y | |
| Systems Interoperability Tech. | 2003 | 1.06689 | 1.48839 | 1.11992 | 1.58928 | 1.08710 | 1.52584 | Y |
| 2010 | 1.29291 | 1.77573 | 1.10557 | 1.47938 | 1.18527 | 1.59423 | Y | |
| 2013 | 1.38715 | 1.86849 | 1.35300 | 1.81086 | 1.35612 | 1.81559 | Y | |
5. Conclusions
Acknowledgments
Author Contributions
Conflicts of Interest
References
- Coates, V.; Farooque, M.; Klavans, R.; Lapid, K.; Linstone, H.A.; Pistorius, C.; Porter, A.L. On the Future of Technological Forecasting. Technol. Forecast. Soc. Chang. 2001, 67, 1–17. [Google Scholar]
- Roper, A.T.; Cunningham, S.W.; Porter, A.L.; Mason, T.W.; Rossini, F.A.; Banks, J. Forecasting and Management of Technology, 2nd ed.; John Wiley & Sons: Hoboken, NJ, USA, 2011; pp. 15–23. [Google Scholar]
- Wang, X.; Qiu, P.; Zhu, D.; Mitkova, L.; Lei, M.; Porter, A.L. Identification of technology development trends based on subject-action-object analysis: The case of dye-sensitized solar cells. Technol. Forecast. Soc. Chang. 2015, 98, 24–46. [Google Scholar]
- Huang, L.; Zhang, Y.; Guo, Y.; Zhu, D.; Porter, A.L. Four dimensional Science and Technology planning: A new approach based on bibliometrics and technology roadmapping. Technol. Forecast. Soc. Chang. 2014, 81, 39–48. [Google Scholar] [CrossRef]
- Daim, T.; Kocaoglu, D.; Anderson, T. Emerging frameworks describing technological innovation: Review of multiple perspectives. Technol. Forecast. Soc. Chang. 2013, 80, 1033–1034. [Google Scholar] [CrossRef]
- Ouyang, K.; Weng, C.S. A New Comprehensive Patent Analysis Approach for New Product Design in Mechanical Engineering. Technol. Forecast. Soc. Chang. 2011, 78, 1183–1199. [Google Scholar] [CrossRef]
- Jun, S.; Park, S.; Jang, D. Technology forecasting using matrix map and patent clustering. Ind. Manag. Data Syst. 2012, 112, 786–807. [Google Scholar] [CrossRef]
- Robinson, D.K.R.; Huang, L.; Guo, Y.; Porter, A.L. Forecasting Innovation Pathways (FIP) for new and emerging science and technologies. Technol. Forecast. Soc. Chang. 2013, 80, 267–285. [Google Scholar] [CrossRef]
- Daim, T.U.; Kocaoglu, D.F.; Anderson, T.R. Using technological intelligence for strategic decision making in high technology environments. Technol. Forecast. Soc. Chang. 2011, 78, 197–198. [Google Scholar] [CrossRef]
- Sakata, I.; Sasaki, H.; Akiyama, M.; Sawatani, Y.; Shibata, N.; Kajikawa, Y. Bibliometric analysis of service innovation research: Identifying knowledge domain and global network of knowledge. Technol. Forecast. Soc. Chang. 2013, 80, 1085–1093. [Google Scholar] [CrossRef]
- Cunningham, S.W.; Kwakkel, J. Innovation forecasting: A case study of the management of engineering and technology literature. Technol. Forecast. Soc. Chang. 2011, 78, 346–357. [Google Scholar] [CrossRef]
- Choi, S.; Jun, S. Vacant technology forecasting using new Bayesian patent clustering. Technol. Anal. Strateg. Manag. 2014, 26, 241–251. [Google Scholar] [CrossRef]
- Dalkey, N.; Helmer, O. An experimental application of the Delphi method to the use of experts. Manag. Sci. 1963, 9, 458–467. [Google Scholar] [CrossRef]
- Thoma, G. Composite value index of patent indicators: Factor analysis combining bibliographic and survey datasets. World Pat. Inf. 2014, 38, 19–26. [Google Scholar] [CrossRef]
- Martino, J. Technology Forecasting for Decision Making, 3rd ed.; McGraw-Hill: New York, NY, USA, 1993; pp. 93–96. [Google Scholar]
- Mogee, M. Using patent data for technology analysis and planning. Res. Tech. Manag. 1991, 34, 43–49. [Google Scholar]
- Jun, S.; Park, S.; Jang, D. A technology valuation model using quantitative patent analysis: A case study of technology transfer in big data marketing. Emerg. Mark. Financ. Trade 2015, 51, 963–974. [Google Scholar] [CrossRef]
- Chang, S.; Fan, C. Telematics Technology Development Forecasting: The Patent Analysis and Technology Life Cycle Perspective. Ind. Eng. Manag. Sci. Appl. 2015, 349, 149–158. [Google Scholar]
- Hung, C.; Lee, W.; Wang, D. Strategic foresight using a modified Delphi with end-user participation: A case study of the iPad’s impact on Taiwan’s PC ecosystem. Technol. Forecast. Soc. Chang. 2012, 80, 485–497. [Google Scholar] [CrossRef]
- Keller, J.; Gracht, H.A.V.D. The influence of information and communication technology (ICT) on future foresight processes-Results from a Delphi survey. Technol. Forecast. Soc. Chang. 2014, 85, 81–92. [Google Scholar] [CrossRef]
- Liimatainen, H.; Kallionpää, E.; Pöllänen, M.; Stenholm, P.; Tapio, P.; McKinnon, A. Decarbonizing road freight in the future—Detailed scenarios of the carbon emissions of Finnish road freight transport in 2030 using a Delphi method approach. Technol. Forecast. Soc. Chang. 2014, 81, 177–191. [Google Scholar] [CrossRef]
- Mitchell, V.W. Using Delphi to Forecast in New Technology Industries. Mark. Intell. Plan. 1992, 10, 4–9. [Google Scholar] [CrossRef]
- Rikkonen, P.; Tapio, P. Future prospects of alternative agro-based bioenergy use in Finland—Constructing scenarios with quantitative and qualitative Delphi data. Technol. Forecast. Soc. Chang. 2009, 76, 978–990. [Google Scholar] [CrossRef]
- Rowe, G.; Wright, G. Expert Opinions in Forecasting: Role of the Delphi Technique. Princ. Forecast. 2001, 30, 125–144. [Google Scholar]
- Choi, J.; Jang, D.; Jun, S.; Park, S. A Predictive Model of Technology Transfer Using Patent Analysis. Sustainability 2015, 7, 16175–16195. [Google Scholar] [CrossRef]
- Yun, Y.C.; Jeong, G.H.; Kim, S.H. A Delphi technology forecasting approach using a semi-Markov concept. Technol. Forecast. Soc. Chang. 1991, 40, 273–287. [Google Scholar]
- Guo, Y.; Zhou, X.; Porter, A.L.; Robinson, D.K.R. Tech mining to generate indicators of future national technological competitiveness: Nano-Enhanced Drug Delivery (NEDD) in the US and China. Technol. Forecast. Soc. Chang. 2015, 97, 168–180. [Google Scholar]
- Gao, L.; Porter, A.L.; Wang, J.; Fang, S.; Zhang, X.; Ma, T.; Wang, W.; Huang, L. Technology life cycle analysis method based on patent documents. Technol. Forecast. Soc. Chang. 2013, 80, 398–407. [Google Scholar]
- Kwakkel, J.H.; Carley, S.; Chase, J.; Cunningham, S.W. Visualizing geo-spatial data in science, technology and innovation. Technol. Forecast. Soc. Chang. 2014, 81, 67–81. [Google Scholar] [CrossRef]
- Tseng, Y.; Lin, C.; Lin, Y. Text mining techniques for patent analysis. Inf. Process. Manag. 2007, 43, 1216–1247. [Google Scholar] [CrossRef]
- Solow, R. Technical change and the aggregate production function. Rev. Econ. Stat. 1957, 39, 312–320. [Google Scholar] [CrossRef]
- Schmookler, J. Invention and Economic Growth; Harvard University Press: Cambridge, MA, USA, 1966; pp. 105–109. [Google Scholar]
- Daim, T.; Pizarro, M.; Talla, R. Planning and Roadmapping Technological Innovations: Case and Tools; Springer: Cham, Switzerland, 2014; pp. 111–129. [Google Scholar]
- Chu, C.; Pan, J. The forecasting of the mobile internet in Taiwan by diffusion model. Technol. Forecast. Soc. Chang. 2008, 75, 1054–1067. [Google Scholar] [CrossRef]
- Han, M. Technology level evaluation based on technology growth model and its implication. J. Korea Technol. Innov. Soc. 2010, 13, 252–281. [Google Scholar]
- Byeon, S.; Ryu, J.; Son, S.; Hwang, K.; Kim, B.; Kim, Y. Research on the Technology Level Evaluation Methodology Using a Technology Growth Model. In Proceedings of the Technology Management for Global Economic Growth (PICMET), Phuket, Thailand, 18–22 July 2010; pp. 1–7.
- Kim, B. A Study on the Dynamic Method of Estimating Technology Levels Based on the Technology Growth Model; Korea Institute of S & T Evaluation and Planning: Seoul, Korea, 2009. [Google Scholar]
- Freeman, C.; Soete, L. The Economics of Industrial Innovations, 3rd ed.; The MIT Press: Cambridge, MA, USA, 1997; pp. 353–361. [Google Scholar]
- Potthoff, R.; Roy, S. A generalized multivariate analysis of variance model useful especially for growth curve problems. BIOM 1964, 51, 313–326. [Google Scholar]
- Bark, P. A theoretical approach and its application for a dynamic method of estimating and analyzing science and technology levels. J. Korea Technol. Innov. Soc. 2007, 10, 654–686. [Google Scholar]
- Korea Institute of S & T Evaluation and Planning. Technology Level Evaluation Report of 2014–120 National Strategic Technology; Korea Institute of S & T Evaluation and Planning: Seoul, Korea, 2015. [Google Scholar]
- Ryu, J.; Byeon, S. Technology level evaluation methodology based on the technology growth curve. Technol. Forecast. Soc. Chang. 2011, 78, 1049–1059. [Google Scholar] [CrossRef]
- Green, K.; Armstrong, J.; Graefe, A. Methods to elicit forecasts from groups: Delphi and prediction markets compared. Foresight 2007, 8, 17–20. [Google Scholar]
- Ernst, H. Patent information for strategic technology management. World Pat. Inf. 2003, 25, 233–242. [Google Scholar] [CrossRef]
- Yoon, B.; Park, Y. A text-mining-based patent network: Analytical tool for high-technology trend. J. High Technol. Manag. Res. 2004, 15, 37–50. [Google Scholar] [CrossRef]
- Hall, B.; Jaffe, A.; Trajtenberg, M. Market value and patent citations. RAND J. Econ. 2005, 36, 16–38. [Google Scholar]
- Choi, J.; Jeong, S.; Kim, K. A study on diffusion pattern of technology convergence: Patent analysis for Korea. Sustainibity 2015, 7, 11546–11569. [Google Scholar] [CrossRef]
- Anderson, B. The hunt for S-shaped growth paths in technological innovation: A patent study. J. Evol. Econ. 1999, 9, 487–526. [Google Scholar] [CrossRef]
- Bengisu, M.; Nekhili, R. Forecasting emerging technologies with the aid of science and technology databases. Technol. Forecast. Soc. Chang. 2006, 73, 835–844. [Google Scholar] [CrossRef]
- Wu, J.; Wu, G.; Zhou, Q.; Li, M. Spatial variation of regional sustainable development and its relationship to the allocation of science and technology resources. Sustainibity 2014, 6, 6400–6417. [Google Scholar] [CrossRef]
- Rosen, M. Engineering and sustainability: Attitudes and actions. Sustainibity 2013, 5, 372–386. [Google Scholar] [CrossRef]
- Nguimkeu, P. A simple selection test between the Gompertz and Logistic growth models. Technol. Forecast. Soc. Chang. 2014, 88, 98–105. [Google Scholar] [CrossRef]
- Tsai, B.H. Predicting the diffusion of LCD TVs by incorporating price in the extended Gompertz model. Technol. Forecast. Soc. Chang. 2013, 80, 106–131. [Google Scholar] [CrossRef]
- Franses, P.H. A method to select between Gompertz and logistic trend curves. Technol. Forecast. Soc. Chang. 1994, 46, 45–49. [Google Scholar] [CrossRef]
- Franses, P.H. Gompertz curves with seasonality. Technol. Forecast. Soc. Chang. 1994, 45, 287–297. [Google Scholar] [CrossRef]
- Lenart, A.; Missov, T. Goodness-of-fit tests for the Gompertz distribution. Commun. Stat. Theory Methods 2014, 44. [Google Scholar] [CrossRef] [Green Version]
- Fang, C.; Liu, H.; Li, G.; Sun, D.; Miao, Z. Estimating the Impact of Urbanization on Air Quality in China Using Spatial Regression Models. Sustainability 2015, 7, 15570–15592. [Google Scholar] [CrossRef]
- Park, S.; Lee, S.; Jun, S. A Network Analysis Model for Selecting Sustainable Technology. Sustainability 2015, 7, 13126–13141. [Google Scholar] [CrossRef]
- Salancik, J.R. Assimilation of aggregated inputs into Delphi forecasts: A regression analysis. Technol. Forecast. Soc. Chang. 1973, 5, 243–247. [Google Scholar] [CrossRef]
- Gordon, T.J. Notes on forecasting a chaotic series using regression. Technol. Forecast. Soc. Chang. 1991, 39, 337–348. [Google Scholar]
- Blohmke, J.; Kemp, R.; Türkeli, S. Disentangling the causal structure behind environmental regulation. Technol. Forecast. Soc. Chang. 2016, 103, 174–190. [Google Scholar] [CrossRef]
- Bowerman, B.L.; O’Connell, R.T.; Koehler, A.B. Forecasting, Time Series, and Regression, An Applied Approach; Thomson Brooks/Cole: Pacific Grove, CA, USA, 2005. [Google Scholar]
- Myers, R.H. Classical and Modern Regression with Applications; Duxbury Press: Duxbury, MS, USA, 1996. [Google Scholar]
- KIPRIS. Korea Intellectual Property Rights Information Service. 2015. Available online: http://www.kipris.or.kr (accessed on 3 May 2015).
© 2015 by the authors; licensee MDPI, Basel, Switzerland. This article is an open access article distributed under the terms and conditions of the Creative Commons by Attribution (CC-BY) license (http://creativecommons.org/licenses/by/4.0/).
Share and Cite
Kim, S.; Jang, D.; Jun, S.; Park, S. A Novel Forecasting Methodology for Sustainable Management of Defense Technology. Sustainability 2015, 7, 16720-16736. https://0-doi-org.brum.beds.ac.uk/10.3390/su71215844
Kim S, Jang D, Jun S, Park S. A Novel Forecasting Methodology for Sustainable Management of Defense Technology. Sustainability. 2015; 7(12):16720-16736. https://0-doi-org.brum.beds.ac.uk/10.3390/su71215844
Chicago/Turabian StyleKim, Sungchul, Dongsik Jang, Sunghae Jun, and Sangsung Park. 2015. "A Novel Forecasting Methodology for Sustainable Management of Defense Technology" Sustainability 7, no. 12: 16720-16736. https://0-doi-org.brum.beds.ac.uk/10.3390/su71215844