Article

Towards an Assessment Methodology to Support Decision Making for Sustainable Electronic Waste Management Systems: Automatic Sorting Technology

1
Department of Product and Production Development, Chalmers University of Technology, Gothenburg SE-41296, Sweden
2
Dakota Consulting Inc., Silver Spring, MD 20910, USA
*
Author to whom correspondence should be addressed.
Submission received: 31 October 2015 / Revised: 8 December 2015 / Accepted: 21 December 2015 / Published: 15 January 2016

Abstract

:
There is a lack of structured methodologies to support stakeholders in accessing the sustainability aspects for e-waste management. Moreover, the increasing volume of electronic waste (e-waste) and the availability of automated e-waste treatment solutions demand frequent reconfigurations of facilities for efficient e-waste management. To fill this gap and guide such ongoing developments, this paper proposes a novel methodological framework to enable the assessing, visualizing and comparing of sustainability impacts (economic, environmental and social) resulting from changes applied to a facility for e-waste treatment. The methodology encompasses several methods, such as discrete event simulation, life cycle assessment and stakeholder mapping. A newly-developed demonstrator for sorting e-waste is presented to illustrate the application of the framework. Not only did the methodology generate useful information for decision making, but it has also helped identify requirements for further assessing the broader impacts on the social landscape in which e-waste management systems operate. These results differ from those of previous studies, which have lacked a holistic approach to addressing sustainability. Such an approach is important to truly measure the efficacy of sustainable e-waste management. Potential future applications of the framework are envisioned in production systems handling other waste streams, besides electronics.

Graphical Abstract

1. Introduction

The management of used electronics raises serious concerns as global electronic waste (e-waste) is expected to reach 65.4 million tonnes in 2017, according to forecasts by Solving the E-Waste Problem (StEP) Initiative [1]. In this paper, e-waste has been defined as used electrical and electronic equipment regulated by the EU Waste Electrical Electronic Equipment (WEEE) Directive 2002/96/EC [2]: this kind of equipment uses a voltage of less than 1000 V for AC and less than 1500 V for DC (including battery powered) and falls into one of the ten categories indicated by [2], ranging from large household appliances to automatic dispensers. In this paper, WEEE and e-waste will be considered as synonymous, and the handling and treatment of it along the electronics’ supply chain will be defined as e-waste management.
The goals of this paper are:
  • to highlight the need to assess the impacts that reconfigurations of e-waste treatment facilities can have on economic, environmental and social sustainability performances,
  • to provide the companies working within e-waste management with a decision support methodology to assess reconfigured e-waste management systems (EMS), specifically pertaining to the sorting of e-waste, against sustainability criteria.
First, the need to assess the sustainability performances of e-waste treatment facilities arises from the knowledge that there are manifold factors that may prevent e-waste management from being truly sustainable, considering the triple-bottom line i.e., economic, environmental and social aspects [3]. Examples of such factors include the design of certain electronic devices that are not suitable for disassembly and the difficulty in managing feedstock collection [4]. Not limited to these, Huisman et al. [5] (while focusing on regulations within the European territory) compiled the challenges of the WEEE Directive in addressing sustainability. They advocated a pan-EU legislative framework embedding standards and formats, which reports all stakeholder responsibilities. Ongondo et al. [6], critically reviewed the current state of WEEE management practices in various countries around the globe, and identified four focus areas consisting of take-back strategies, health and environment, resource depletion and ethical concerns.
Proper intervention to solve these kinds of problems within e-waste treatment facilities and within the electronics supply chain would result in more sustainable WEEE management strategies. These factors clearly highlight the need for companies to change the way in which e-waste is handled, recycled and disposed. Consequently, from a production system point of view, there is a need to assess whether and how changes should be applied to an e-waste treatment facility at both a facility planning and operations management level. Most importantly, there is need to gauge whether these implementations produce positive effects for the companies’ overall sustainability performances.
It follows then, that the methodologies which effectively assess and present the outcomes of such reconfigured e-waste management systems, to the key decision makers, qualify as some of the most promising ways to tackle the e-waste problem.
To this end, this paper proposes a decision support methodology to assess reconfigured e-waste management systems.
The paper is structured as follows: Section 2 presents the relevant works on sustainable EMS and related challenges. Section 3 introduces the research approach, including the research question, the scope and the research methodology. Section 4 presents the assessment methodology to support decision making for sustainable EMS. Section 5 applies the methodology to a case study. Section 6 discusses the results, and Section 7 provides the conclusions and the future developments of this study.

2. Sustainable E-Waste Management Systems

An effective e-waste treatment strategy determines the cost and environmental savings potential from recovering valuable materials (e.g., gold, copper) and reusing of spare parts (e.g., cellular components). These strategies help prevent the release of hazardous substances into the environment [7,8].
Researchers have looked at this challenge both from a product and a production system perspective and, as a result, have recommended different solutions. Cui and Forssberg [9] have suggested the characterization of e-waste streams as one of the solutions to handle the non-homogeneity and complexity of materials and components. In their study, they stated that characterization provides a solid baseline for developing cost-effective and environmentally-friendly separation techniques.
Vongbunyong et al. [10] presented disassembly as the key solution for an efficient treatment of end-of-life products. They recommended the development of robotic systems as a low-cost fully-automated solution to overcome today’s economic challenges of disassembly solutions (mostly due to the size of labor cost in developed countries). To further validate this concept, they utilized the case-study of a liquid crystal display (LCD) screen being automatically disassembled by cognitive robotics. Schluep et al. [11] focused on the current innovative technologies for the development of a sustainable recycling sector and distinguished them from technologies not suited to supporting sustainable recycling in developing countries.
The above-mentioned studies suggest the existence of a trend to address the e-waste problem through change-oriented approaches, take-back schemes and automated treatment solutions. The underlying hypothesis of this study is that this trend is going to result in changes to the configuration of EMS, both in assets and operations. According to this hypothesis, there is a need for key decision makers to ensure that the reconfigurations being adopted in e-waste treatment facilities will positively affect the triple-bottom line performances of sustainability.
In a related study focussing on the sustainable design of e-waste treatment processes (e.g., disassembly, recycling), Barletta et al. [12] illustrated how the literature reviewed did not completely address the sustainability triple-bottom line within their proposed evaluation framework. They however observed that the research focusing on evaluating the design of the e-waste supply chain was moving towards a more holistic framework for sustainability assessment. A further review made within this study showed that:
  • e-waste recycling programs and take-back schemes have been assessed against more than one bottom line of sustainability, such as [13,14]
  • sustainability-related assessments on e-waste treatment processes found in the literature focused on environmental assessments or alternatively on social sustainability assessments; the former have been primarily delivered through a life-cycle assessment methodology, as in [15,16], whereas the latter, which focused primarily on health conditions of workers, have been made through in-depth interviews [17] and reporting of health-related indicators related to human toxicity [18].
The authors reiterate the findings presented in [12] and the need to develop a comprehensive sustainability assessment framework to be applied to EMS. The authors agree that the research overall made no attempts to evaluate impacts from reconfigured EMS against the triple-bottom line. However, note that the realization of sustainable EMS demands a decision-oriented approach to vet and select proposals of reconfigured EMS that can ultimately bring about positive impacts from a triple-bottom line perspective.

3. Research Approach

3.1. Research Scope and Question

To fulfil the gap reported in Section 2, this paper proposes an assessment and decision support methodology to support such stakeholders as production and environmental engineers and managers in the evaluation of proposals on e-waste treatment facility reconfigurations. These proposals are referred to as “change proposals” in this study. The scope of the decision support methodology has two dimensions, as illustrated in Table 1.
Table 1. Scope of the decision support methodology. EMS, e-waste management system.
DimensionDescription and Examples
EMSFacilities and equipment within the whole e-waste supply chain [19], which are made up of sorting centers, disassembly facilities and recycling facilities.
Change proposals within the EMSMiddle or long-term changes to EMS configurations, which are likely to affect company performances of sustainability. They may consist of new disassembly technologies or new ICT tools for e-waste statistics recording.
Based on the research scope presented, the leading research question of this study is as follows: which framework, steps and methods should the decision support methodology be constituted of in order to ensure sustainable reconfigurations of EMS?

3.2. Research Methodology

The research methodology followed in this paper is based on the case study approach as described by Yin [20]. The proposed decision support methodology was arrived at from a compilation of established methods to assess the triple-bottom line performances of sustainability and their adaptation to a new framework for EMS. The decision support methodology is based on a problem-solving approach.
Figure 1 presents the five steps of the proposed problem-solving model.
Figure 1. The problem-solving model adopted in this study and the contributive role of the decision support methodology within it.
Sustainability 08 00084 g001
This framework was partially inspired by the multi-step problem solving model (reported in [21], as well as many other publically-available online sources) and by the decision-making framework for the selection of manufacturing automation technologies from Almannai et al. [22]. Figure 1 shows how each of the steps might be undertaken recursively by decision-making stakeholders and methodology users.
The methodology was applied to a demonstrator for e-waste sorting, to evaluate the impacts of introducing automated sorting equipment within a current sorting facility.
The reason for this choice of case study is that e-waste items are very different from each other. To illustrate, batteries can contain different chemicals and materials that demand different types of sorting.
Private end-users cannot recognize all of these differences and are usually required to deposit used batteries in one general bin for batteries, which then needs to be sorted later by collectors and recyclers.
High volumes and diversity make the sorting process challenging and yet important: evinced by the increasing number of bins of e-waste items that collectors receive and the obvious difficulties for them in sorting products (e.g., batteries) according to the desired sorting criteria.
One of the keys for efficient reuse and recycling of e-waste is constituted by well-sorted waste streams [23]. Consequently, collectors and recyclers could benefit from efficient and high-quality automatic sorting [9].
The results from the initial implementation of the decision support methodology in the demonstrator for e-waste sorting was vetted through a feedback questionnaire to company representatives of the e-waste management market. Inputs from them were intended to help fine-tune the decision support methodology and the implementation of it in future case studies.

4. Decision Support Methodology for Sustainable E-Waste Management Systems

This section presents the decision support methodology in terms of framework, steps and methods. Figure 2 shows the framework of the decision support methodology for sustainable EMS.
Figure 2. Framework of the decision support methodology.
Sustainability 08 00084 g002
The framework depicts the process for analyzing and evaluating different change proposals of EMS and compares them in accordance with the triple-bottom line performances of sustainability.
As the legend in Figure 2 shows, the building blocks of decision support methodology are grouped into two different categories:
  • the primary sub-steps, which are the “analysis of the alternatives”, “evaluation of the alternatives” and “selection of the solution”
  • actions to be undertaken within the assessment are “selection of sustainability criteria and assessment tools”, “comparison of sustainability performances among the alternatives” and “discussion of the trade-offs”.
The loop-arrow in Figure 2 points out that the sub-steps of the decision support methodology could be repeated until the stakeholders can agree on a final solution. It is important to note that the use of this framework relies on the assumption of stakeholders having already selected the reconfiguration alternatives of the EMS (problem-solving step of Figure 1). Santoyo-Castelazo and Azapagic [24] have also proposed a relevant decision support framework for integrated sustainability assessment of energy systems. This research additionally proposes a range of existing ways to undertake the evaluation of alternatives related to EMS.
The following sub-sections report the methods and tools that constitute the sub-steps of “analysis of the alternatives” and “evaluation of the alternatives”. Note that a discussion of the alternatives and selection of the solution is outside the scope of this case study, as such solutions are entirely dependent on the specific needs and goals of the decision makers and specific company strategy.

4.1. Analysis of the Alternatives

The analysis of alternatives is a sub-step of the decision support methodology that supports the problem analysis step within the problem-solving model; see Figure 1.
Table 2 presents the indicators and the tools proposed in this study to carry out the analysis of alternative reconfigurations of EMS in a sustainability-oriented approach.
Table 2. Indicators and tools to analyze alternative reconfigurations of EMS with respect to the triple-bottom line of sustainability.
Sustainability PerformanceSustainability IndicatorsSustainability Assessment Tools
Selection Performed by
Decision MakersDecision Support Methodology’s Users
Economic sustainabilityProfit margin, revenues, Return of investment (ROI) Break-even point (BEP) Net present value (NPV) Payback timeEconomic assessments of present and future e-waste streams [25], material flow analysis to forecast e-waste streams [26], break-even analyses, profitability analyses, analyses of operations-management performances through discrete event simulation (DES)
Environmental sustainabilityTotal energy consumption, Global warming potential Terrestrial ecotoxicity Freshwater ecotoxicity Metal depletionSubstance flow analysis (SFA), e.g., [27], life cycle assessment (LCA) [28] and environmental risk assessment (ERA), e.g., [15]
Social sustainabilityHuman ecotoxicity, Global reporting initiative (GRI) social sustainability indicators [29] KPIs of socially-sustainable operations [30]Social LCA [31], assessment of implications on social sustainability from the introduction of a new technology into an EMS [30]
Table 2’s second column illustrates a range of possible sustainability indicators suitable to assess the economic, environmental and social performances of the alternatives. These indicators reflect the criteria of analysis that are meant to be selected by decision stakeholders. Table 2’s third column illustrates the sustainability assessment tools useful for evaluating EMS against the selected criteria.
The assessment tools suitable for the analysis of a specific problem need to be selected by the users of the decision support methodology, from company engineers and analysts to external consultants and research fellows. The selection of the criteria of analysis and assessment tools provided by Table 2 depends on several factors characterizing the case of each company and facility; for instance, data availability, goal of the study, company strategy, resources and skills at hand. Nevertheless, it is still possible to provide an overall recommendation on the use of the decision support methodology. Users and decision makers must select at least one criteria and assessment tool for each of the three dimensions of sustainability: economic, environmental and social. This guarantees that sustainability is being addressed more holistically within the decision-making process. Assessments to be carried out by the decision support methodology can embrace different system boundaries (which do not necessarily coincide with the boundaries of the e-waste treatment facility).
The decision makers decide on the criteria and the system boundaries of the analysis that they deem most suitable for the EMS. To that end, Zijp et al. [32] offer an identification key for selecting methods for sustainability assessments. From the contents of Table 2, it follows that a decision of this nature has to be done in agreement with the users of the decision support methodology.
The framework assesses the EMS either by carrying out economic, environmental and social sustainability assessments and eventually combining the results or by carrying out an assessment that holistically embraces the triple-bottom line. Examples of these kinds of assessments are cost-benefit analysis, risk analysis, vulnerability analysis and multi-criteria analysis, which are presented by Ness et al. [33] as integrated assessments. In their study, Ness et al. have claimed that they can not only address sustainability issues, but also cover several other problem areas of a multi-disciplinary nature. When adopting an integrated assessment for EMS, the sustainability criteria to be used may, in some cases, coincide with a sub-set of the criteria presented by Table 2.

4.2. Evaluation of the Alternatives

The evaluation of the alternatives is the sub-step of the decision support methodology that supports the decision-making step within the problem-solving model (see Figure 1). Here, the results from the sustainability assessment made within the prior sub-step are presented to the decision makers.
Alenka and Jurij [34] have shown how different qualities and quantities of information visualization affected decision making in various situations. Consequently, results from the decision support methodology should be shown in a way that allows a straightforward comparison of the different change proposals under a sustainability-oriented perspective. This would facilitate discussions on possible trade-offs and enable the selection of the most sustainable EMS at hand (which might coincide with the as-is system in some cases).
If the results from the decision support methodology are of a quantitative nature, they can be presented through:
  • plots of break-even analysis (suitable for both economic and environmental assessments) [35],
  • Key Performance Indicator (KPI) dashboards showcasing the value of each of the triple-bottom line performances of sustainability [36], or alternatively
  • a unique sustainability index summarizing impacts on profit, planet and people (Salvado et al. [37] proposed this for the case of the automotive industry),
  • visualization techniques (scatter plots and spider-web charts, among others) being reviewed by Miettinen [38].
The choice of stakeholder mapping might be considered when proposing assessments of a qualitative nature. This kind of mapping does not convey a holistic comparison among sustainability criteria (as do the methods previously listed), but does support decision making, as it offers a panorama of influence relationships among the stakeholders. A comparison of different stakeholder analysis techniques has been discussed by Bryson [39].
Dynamic data visualization can increase understanding of the evolution of trends and behaviors over time better than a static display. An example is the dynamic infographics presentation byH. Rosling, which argues over issues of demographics and public health [40]. Dynamic visualizations of the modelled EMS can show how operations within a facility or supply chain might look when a specific scenario is set and provide a picture of the evolution of its performances.

5. Application of Decision Support Methodology to Reconfiguration of Automated Sorting Equipment for E-Waste

The EMS demonstrator analyzed as a case study consisted of a sorting system for e-waste to be reconfigured by adding an automated, conveyor-based sorter to the system. Direct observations of e-waste sorting operations during a study visit and semi-structured interviews of a group of project partners and experts provided data inputs for the economic and social assessment of the reconfigured sorting system.
The methods adopted by the authors for demonstrator development have been grouped according to the specific assessment being performed:
  • static calculation sheets and discrete event simulation (DES) from AnyLogic software (Version 7.1.2–University) were applied to calculate the economic impacts of the new sorting technology on the e-waste sorting facility,
  • a life cycle assessment (LCA) following the standard ISO14044:2006 [28] analysis was applied to calculate the environmental impact from the building of the sorting technology; to this end, the OpenLCA software (Version 1.4.1) was adopted, which used data from the EcoInvent database (Version 3) as life cycle inventory (LCI) database.

5.1. Demonstrator Setting

The aim of reconfiguring the e-waste system is to develop an intelligent, automated piece of sorting equipment for used electronics’ segregation and grading. The research project “WEEE ID” (WEEE Identification) [41] put together knowledge and competencies from industries and academia in order to develop a sorting unit essential for small- and medium-sized recycling plants. This sorting unit aims to prevent operators from being exposed to hazardous substances from segregation processes and enables higher recycling rates within downstream processes, thanks to increased sorting efficiency and accuracy. The piece of automated sorting and grading equipment for e-waste puts the development into reality in a small-scale demonstrator called e-grader. The CAD representation of the e-grader demonstrator is represented in Figure 3.
Figure 3. The e-grader: an automated piece of sorting equipment for e-waste being developed as a demonstrator (courtesy of ReFind technologies AB).
Sustainability 08 00084 g003
The demonstrator uses sensors and intelligent data processing to detect in real time whether used electronic products are good for reuse, refurbishment or recycling and sorts them accordingly. One of the criteria driving this functionality is based on the knowledge that it is possible to obtain reusable spare parts from a particular model. A whole set of criteria for sorting cellular phones per optimal downstream use are currently being developed. The demonstrator is programmed to list the products in optimal fractions by making them instantly available for trading, either directly with customers or through digital marketplaces.

5.2. Application of Decision Support Methodology in the E-Grader Demonstrator

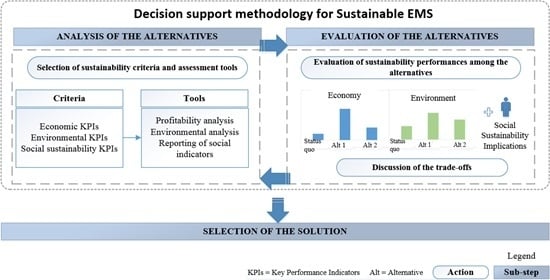
The decision support methodology served to support the decision of whether and how to integrate the new, automated sorting unit (represented by the e-grader demonstrator) within the current e-waste sorting plants, which normally have a high manual, human work content. To that end, the decision support methodology assessed the economic, environmental and social impacts that the demonstrator is expected to bring within an existing facility for e-waste sorting and recording adopted as a baseline for the case study.
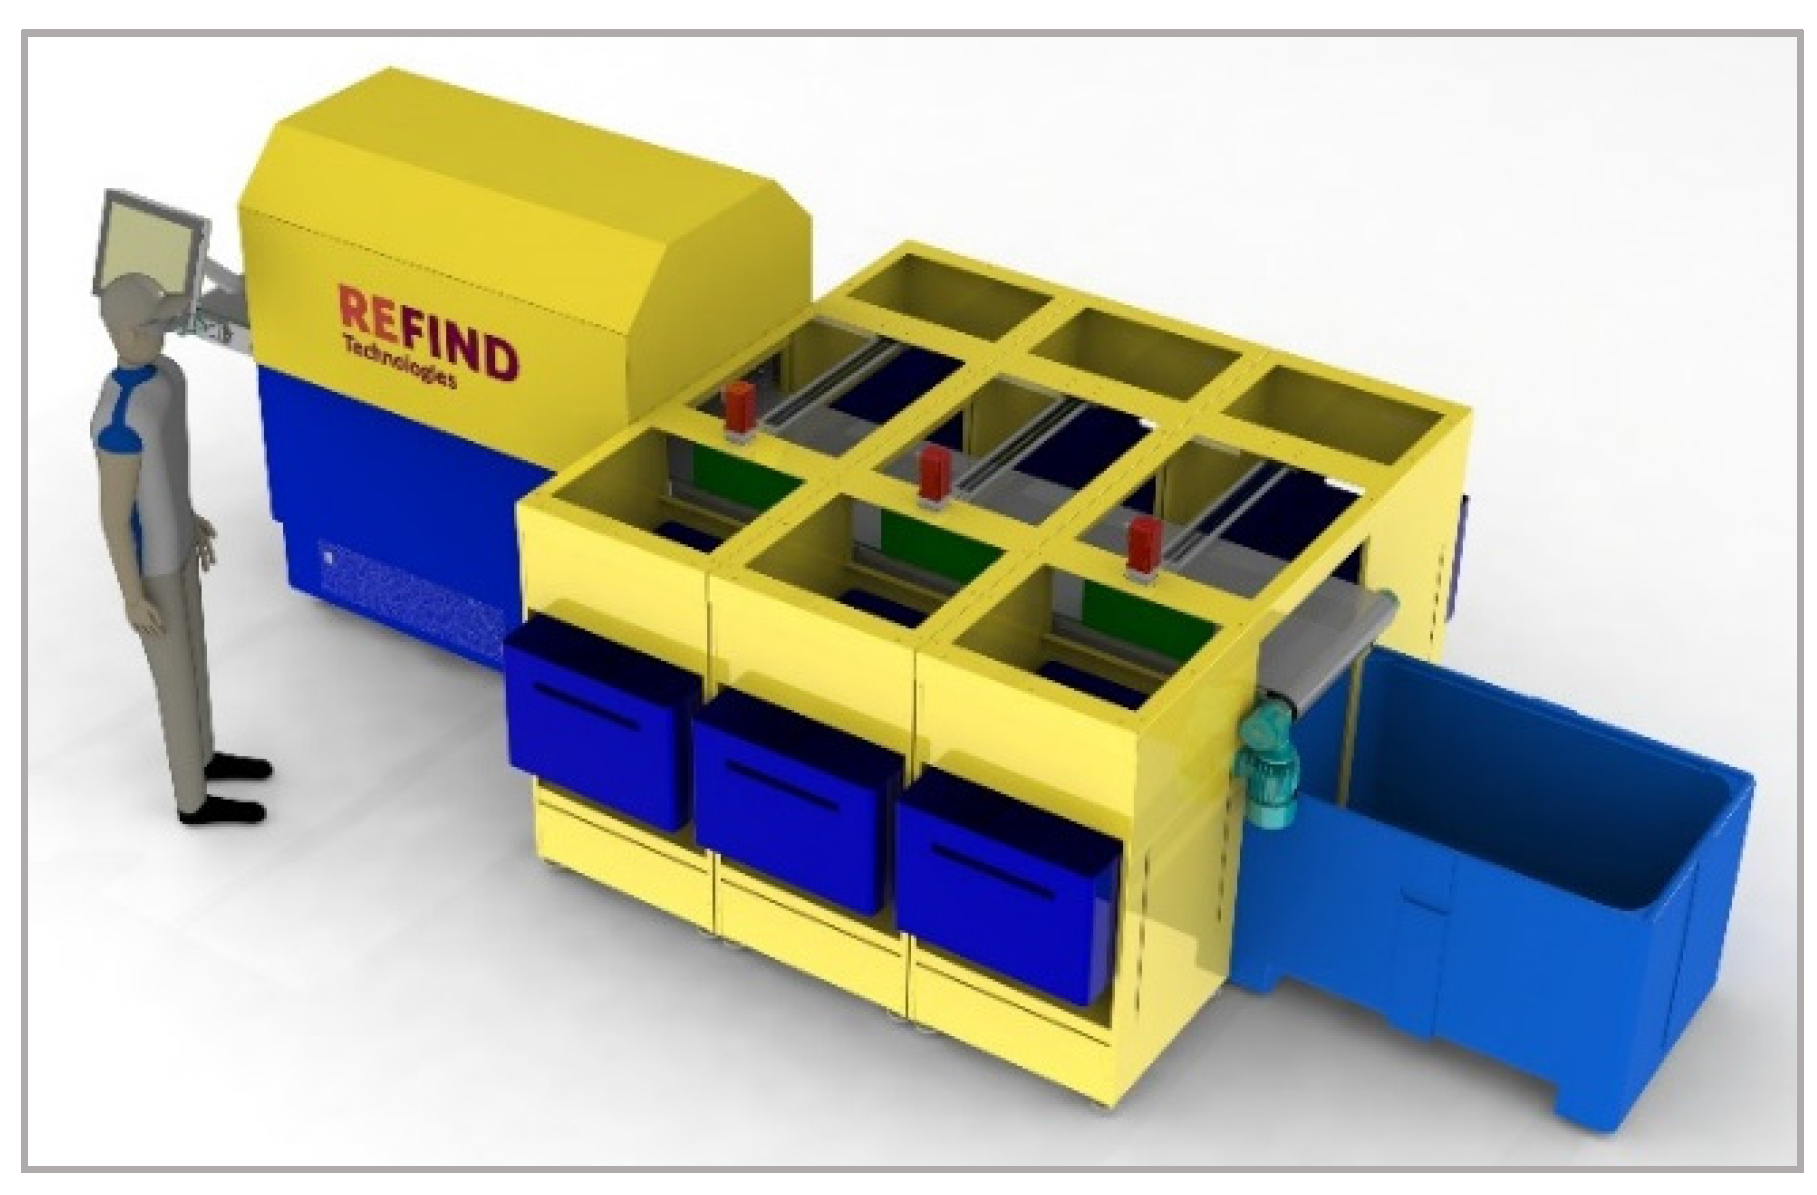
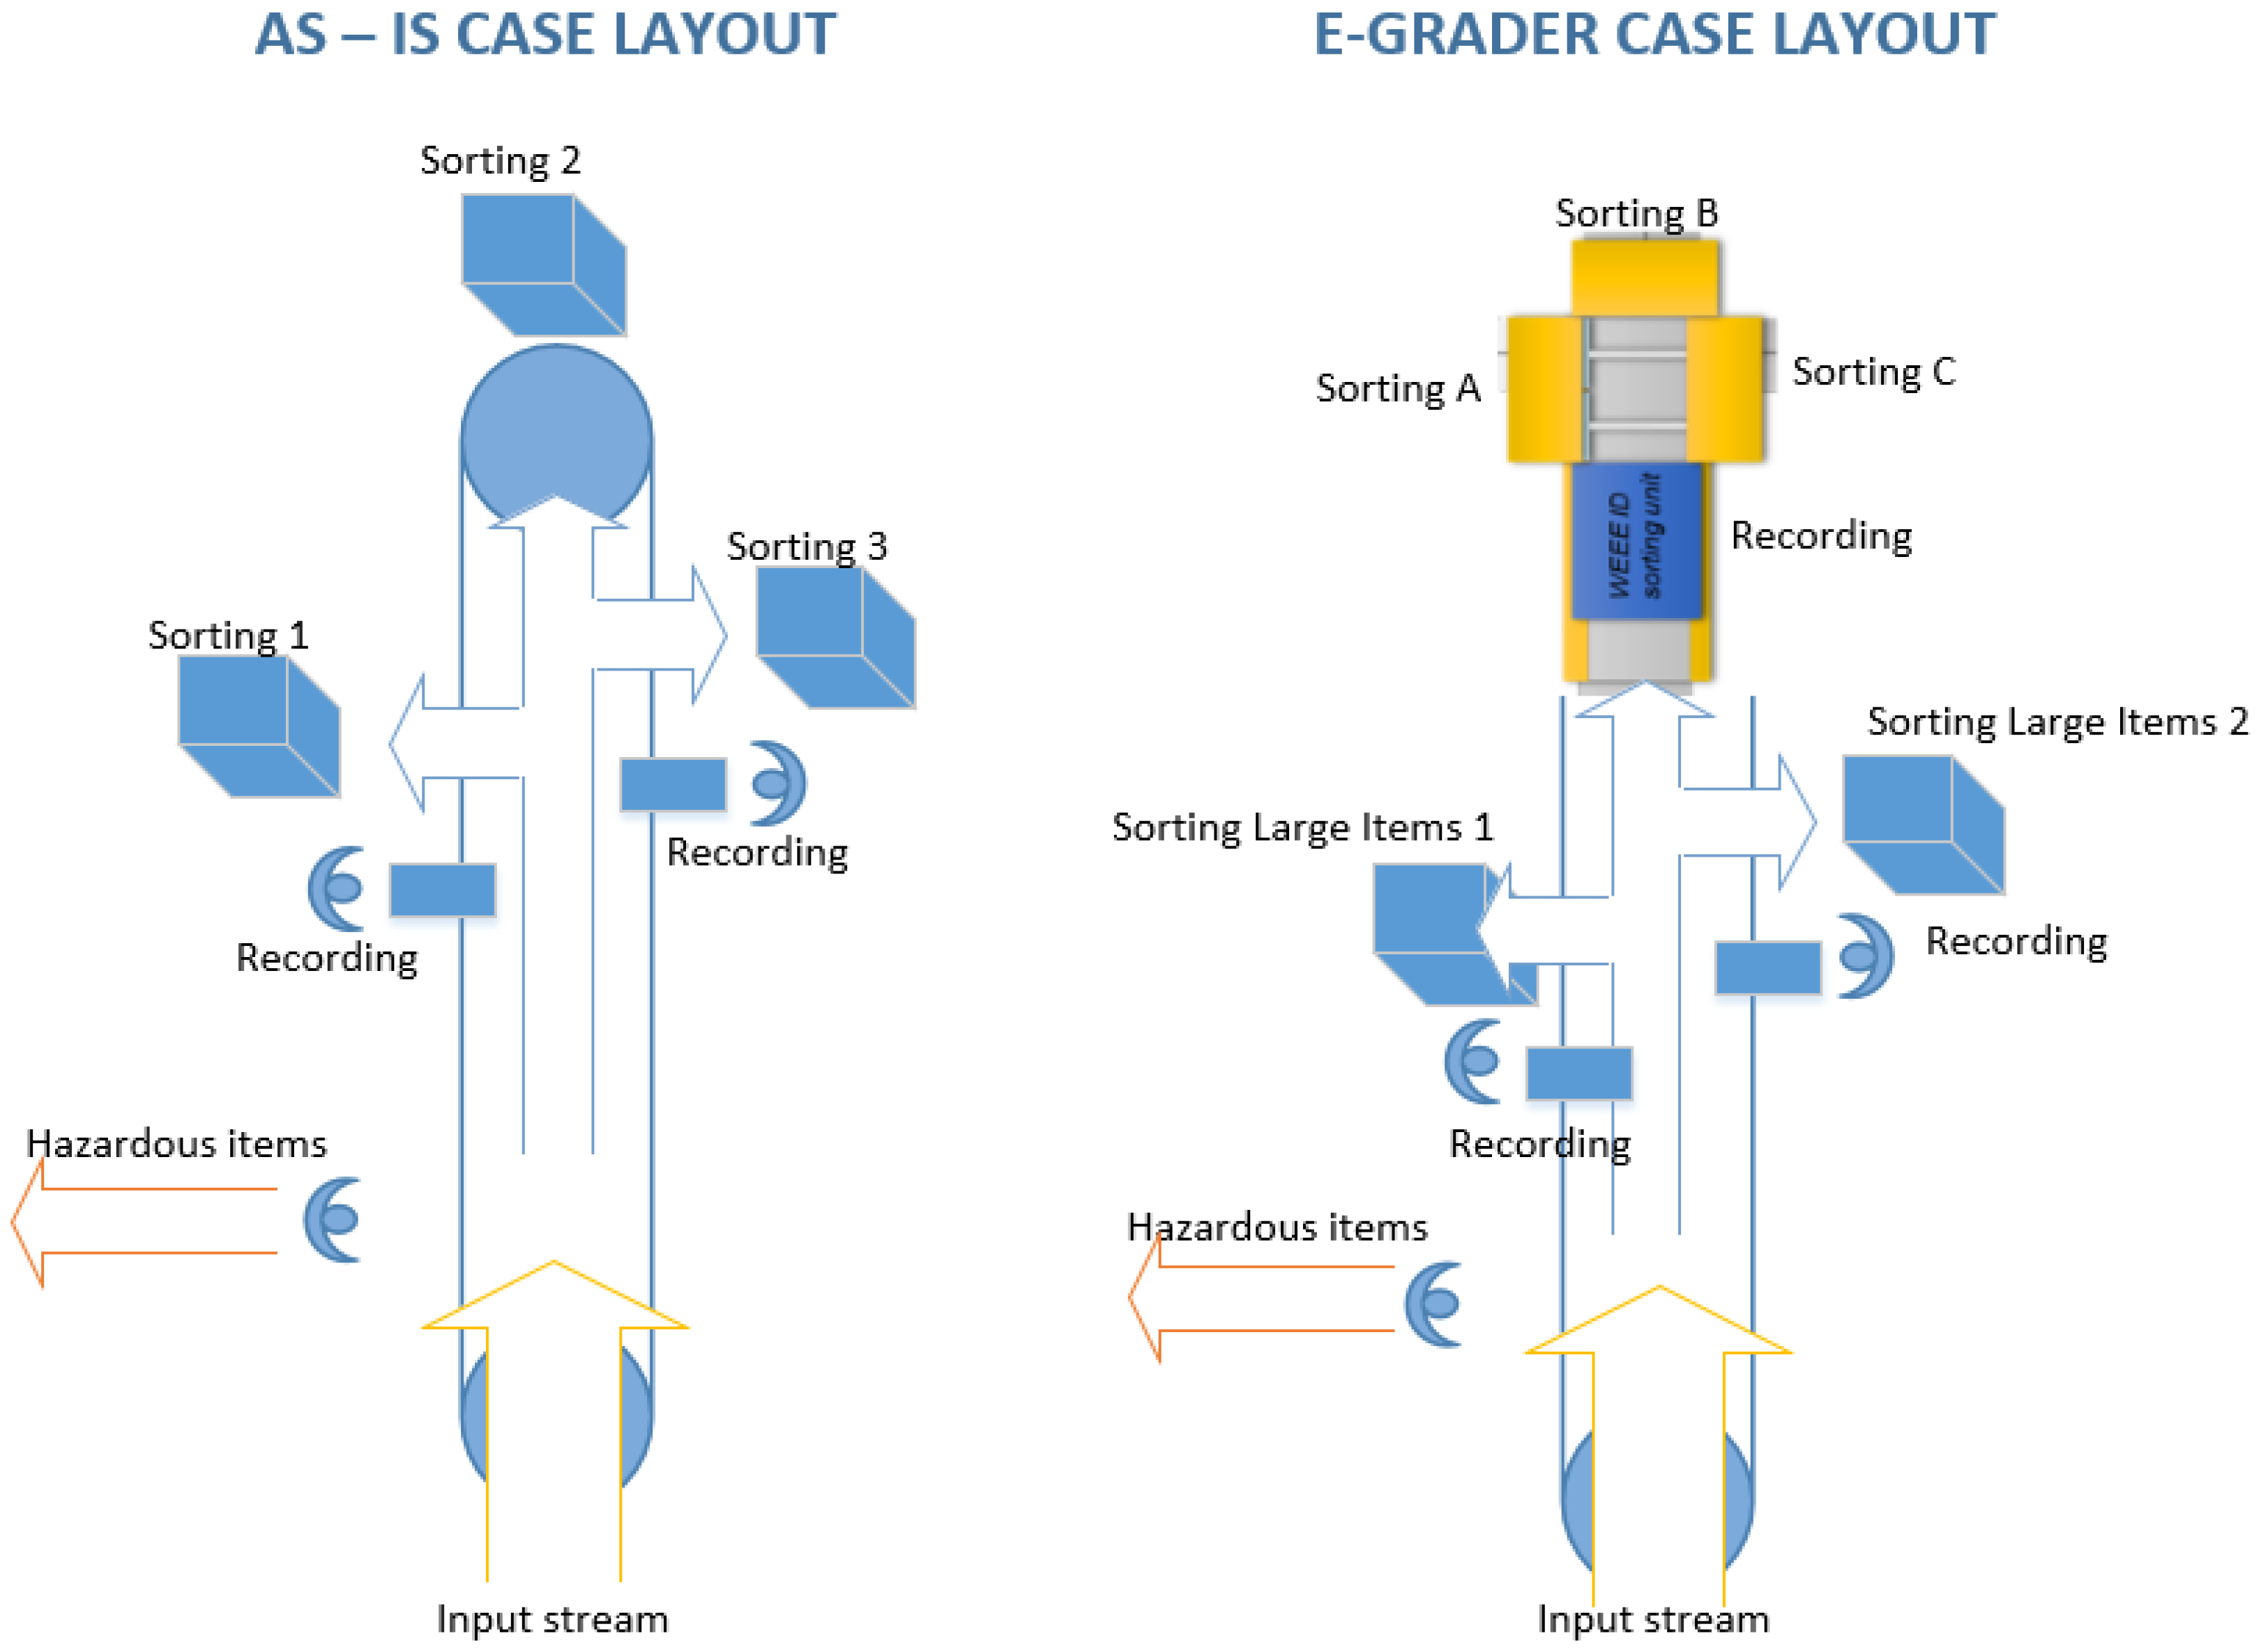
In this case, the problem to be assessed consisted of making e-waste sorting more sustainable, from a triple-bottom-line perspective, than it is in its present state. The analysis started with the identification of the stakeholders operating within the system boundaries of the e-waste management supply chain, who are:
  • employees working in the facility, from workers to top managers; employees of the company owning the facility could also be taken into account,
  • owners of businesses within end-of-life of electronics: producers of electronics, collectors, recycling companies,
  • future vendors of the sorting unit,
  • national and international policy makers,
  • local communities affected by the life cycle stages of electronics, from raw material mining activities to both formal and informal recycling of e-waste spare parts.
The alternatives being evaluated in this case consisted of the adoption of the sorting unit versus maintaining the status quo of the facility with manual sorting. Figure 4 shows both the as-is layout and the layout being reconfigured by means of the implementation of the e-grader.
Figure 4. As-is sorting system versus the automated solution being proposed.
Sustainability 08 00084 g004
As can be deduced from Figure 4, the demonstrator is currently capable of handling a subset of all possible WEEE items in terms of size and shape constraints. Therefore, from an economic point of view, it is fundamental to determine if and in what conditions the sorting unit can be integrated into a facility that handles e-waste manually, in order to generate positive value. It is reasonable to assume that when managers of a certain facility evaluate the option of adopting the sorting unit, they would like to know when and under what conditions the additional costs generated will be offset by the benefits brought about by the sorting unit. The following three sections will utilize some of the criteria shown in Table 2 considering the triple-bottom line, i.e., economic, environmental and social metrics instantiated in the e-grader solution versus the as-is facility today.

5.2.1. Setting Economic Criteria of the Demonstrator

Measurements to be employed in the economic assessment should be selected according to the metrics and the time horizon that the stakeholders deem reasonable to evaluate, and these can vary in different scenarios. The set of indicators used for the analysis of the demonstrator evaluates the impacts of the new technology adoption at two levels that are tightly connected: facility operations performances and economic performances. The operational indicators deemed suitable for the analysis are:
  • throughput (rate of items being processed),
  • lead time (from input storage to the end of the line),
  • utilization of the sorting unit.
The economic indicators deemed suitable for the analysis are:
  • income (revenues),
  • gross profit margin, which is the percentage of revenue remaining after the cost of goods sold,
  • return of investment (ROI), which measures the amount of return on an investment relative to the investment’s cost.
Among the operations management performances by which the facility can be economically evaluated, throughput is one of the most preferred indicators among top management. It is reasonable to assume that introducing the automatic sorting unit leads to higher overall system throughput, if this is properly utilized and placed within the facility. From the total input of WEEE items into the facility, the higher percentage of WEEE items suitable for processing by the sorting unit, the higher the total system throughput will be, which matches the throughput of items being sorted manually and the items being sorted by the equipment. Capturing the dynamic behavior of the system through DES gives an understanding of the variability embedded within any production system and helps decision makers visualize possible system behaviors. Figure 5 shows a snapshot of the DES model being used in the case study.
Figure 5. Snapshot of the DES model of the e-grader demonstrator in AnyLogic.
Sustainability 08 00084 g005
A trend describing how system throughput increases when the percentage of input to the sorting unit increases can be drawn through interpolation techniques applied to the “experiment points”.
Interpolation functionalities are available in Microsoft Excel and MATLAB [42], among other software packages.
In this case, the higher the throughput, the higher the possibility to sell the items straight away, resulting in higher revenue within a given time. The orange bars in Figure 6 represent the possible increases of income from the adoption of the sorting unit when compared to the as-is case.
However, several sources of variability can affect the final throughput. When considering a constant input rate to the facility, the resulting average throughput will vary within a certain range because of the variabilityin operating conditions. For instance, average throughput of the as-is system varies according to the variability of the service time of operators and their available work time. Average throughput of the sole sorting unit varies according to the availability of the equipment.
Such variability is expressed by the dotted lines in Figure 6 and should always be a matter for discussion when evaluating the robustness of the results from the economic assessment. Because the income is the result of the amount of product types multiplied by the selling price, the variability of the income reflects the same sources of variability depicted in Figure 6 plus the variability of sellingprices themselves. This is an important aspect to be considered within a sensitivity analysis of the income.
Figure 6. Graphical representation of an estimation of the trend of income from the e-grader demonstrator as the percentage of WEEE items being processed by the sorting unit increases.
Sustainability 08 00084 g006
Not only can the prices of metals contained in the WEEE vary significantly over time, but also the prices for the same items processed on the same shift might vary according to their condition: in fact, an item suitable for reuse purposes has a higher value than the same item sorted for recycling.
The authors have proposed a way to argue and value sorting unit impacts on throughput and income. Nevertheless, due to the use of confidential data, Figure 6 will not be numerically fully solved in this study. The application on the demonstrator occurred at a specific percentage of input of WEEE items to the sorting unit and aimed at comparing the economic performance gained when this input “feeds” the as-is system (orange line in Figure 6) with the e-grader system (blue line in Figure 6).
As a result, the value of the three KPIs referring to operations management within the facility have been calculated and presented in Table 3.
Table 3. Economic assessment: operational outputs.
IndicatorUnitMeanStandard Deviation
As-IsE-GraderAs-IsE-Grader
Throughputitems/h205497NA40.2
Lead timeworkdays53.4NA0.31
Utilization of e-grader-NA83%NA6%
Table 3 presents values of the as-is system from data collection and personal communications in the sorting facility and shall be used as an indication. Values of the e-grader system in Table 3 stem from five DES runs of the factory model shown in Figure 5, and each refers to one year of production time.
It can be seen that the throughput of the e-grader case numbers more than doubles the as-is case.
From this result, the question becomes: “is a higher throughput worthwhile when compared to the additional costs of acquisition and operation?” To reply accurately, benefits and costs need to be considered in parallel. In this application on the demonstrator, cost-benefit analysis must capture the differences in performance figuring when comparing the e-grader and as-is systems, because the latter represents a baseline. The gross-profit-margin KPI [43] has been selected to this end. The formula is given by (1):
G r o s s   p r o f i t   m a r g i n =   R e v e n u e   C o s t   o f   g o o d s   s o l d R e v e n u e
Revenue is the total amount of income generated by primary operations, which in this case coincides with recording and sorting, and the cost of goods sold (COGS) includes all expenses of purchasing and processing goods to be sold. Gross profit margin is used to compare a company’s current state to its past performance or with competitor performance, especially in markets where the price of goods can fluctuate significantly. This was therefore considered suitable for the demonstrator in this case. Equation (1) shows the gross profit margin is the percentage of revenue remaining after the COGS, as defined in [44].
COGS for this demonstrator is expressed by Equation (2):
C o s t   o f   g o o d s   s o l d = L a b o r   c o s t +   E l e c t r i c i t y   c o s t +   S o r t i n g   s e r v i c e   c o s t + I n v e n t o r y   h o l d i n g   c o s t s
For the application on this demonstrator, the four costs eligible to be calculated by Equation (2) are those spent solely on operational activities and directly linkable to the processing of WEEE items (storing included). Under the hypothesis of using the e-grader as a product service, the sorting service cost in Equation (2) refers to the fee to be paid for its use. Table 4 shows results from the simulation experiments.
Table 4. Economic assessment: economic outputs. Components of the gross profit margin. Values are averaged over one year of production time.
IndicatorUnitMean
As-isE-Grader
Electricity costsUSD/year314
Labor costUSD/year138,847138,847
Inventory holding costUSD/year2065588
Sorting service costUSD/year 27,769
Cost of goods soldUSD/year140,915167,219
RevenuesUSD/year885,0619,790,113
Gross profit marginUSD/item0.840.98
Table 3 and Table 4 report how the modelled e-grader system presented a 19% increase of COGS counterbalanced by more than a double throughput rate, when compared to the as-is case. Ultimately, the case demonstrated represented an increase of the gross profit margin by 17%.
Revenues were calculated on the basis of the yearly throughput, the selling prices of each WEEE item within the input mix and the percentages of each WEEE item within the input mix. These percentages were retrieved from Swedish recycling of WEEE data and were normalized afterwards.
Moreover, a 35% selling price free of hazardous items was considered within the WEEE input mix. Note that this case was simplified, and many hidden costs were not captured by the evaluation illustrated above. This could make the gross profit margin lower within a short timeframe.
In addition to this, evaluating the economic impact from a new technology or piece of equipment requires more than calculating variations of profit margins. Investment evaluation methods help stakeholders see the bigger picture and analyze impacts with a longer perspective. The ROI was proposed for such a purpose [44]. The ROI formula is given by Equation (3):
R O I =   G a i n   ( o r   l o s s )   f r o m   t h e   i n v e s t m e n t C o s t   o f   t h e   i n v e s t m e n t
Gain from the investment results from additional revenues and from the value of the benefits brought by the sorting unit. These benefits can be of a tangible or intangible nature. The following benefits have been identified in the case of the e-grader demonstrator:
  • improved facility scheduling thanks to the analysis of statistics,
  • social benefits for operators (reduced health hazards, more fulfilling work tasks),
  • economic and environmental benefits for downstream operations due to more accurate sorting,
  • improvement of product knowledge leading to a fairer price for the WEEE items.
Losses from the investment are the result of avoidable costs. Avoidable costs are expenses that can be avoided if a decision is made to alter the course of a project or business. They can also be calculated from Table 4. Nevertheless, other monetary losses have to be estimated and considered. The following additional losses have been identified:
  • installation and maintenance costs of the equipment,
  • training costs for operators,
  • productivity losses for the start-up phase.
An arbitrary estimation of the value of benefits and costs being listed above is reported in Table 5 over a horizon of five years. This estimation has been reached in accordance with a life-cycle thinking approach. This means that the values of this estimation represent the value of the economic, natural and social capital affected by the introduction of the e-grader. They refer not only to the facility being analyzed, but to the whole electronics supply chain.
Table 5. Estimated benefits and additional costs from the installation and use of the e-grader. Values are in million US dollars (MUSD).
Estimated Value (MUSD)Worst Case (WC)ExpectedBest Case (BC)
Benefits6915
Additional costs421
By coupling the values from Table 5 with the revenues and costs from Table 4, the values of ROI over a five-year evaluation period have been calculated for each scenario. The results are the following:
  • the estimated ROI is equal to 96%,
  • the worst case (WC)-ROI is equal to 91%,
  • the best case (BC)-ROI is equal to 98%.
Another increasingly common KPI, often due to increased kWh price, is the electricity cost. This cost is uniquely linkable to the usage of the e-grader and other equipment for WEEE sorting.
Electricity cost also correlates with environmental KPIs for the e-grader demonstrator due to the environmental impact from electricity usage.

5.2.2. Setting Environmental Criteria on the Demonstrator

Following a life-cycle thinking approach, two different components of environmental impact can be considered for a facility using the proposed e-grader:
(1)
the impact from the production of the sorting unit (including the sorting unit’s bill of materials),
(2)
the impact from the use phase of the sorter within the facility.
The second component does not have any particular relevance in the big picture of the environmental impact, which is mostly determined by its first component. In fact, the energy consumption from the use of the new sorting unit is produced by the electricity spent to run the electronic equipment and the conveyor belt. They demand low power in comparison to the power demanded by the technical building services (TBS) of a facility, such as cooling and ventilation.
With a hypothesis of 50% utilization of the conveyor for the as-is case and considering the 83% utilization for the e-grader demonstrator, average values of electricity consumption per item and CO2 emissions per item are calculated and presented in Table 6.
Table 6. Electric energy consumptions and emissions per item being sorted.
ValueUnitAs-IsE-Grader
Electricity consumption per itemkWh/item0.0010.950
CO2 emissions per itemkg/item0.00000650.009
The energy consumption for the e-grader demonstrator is 1333-times larger than the as-is case.
Nevertheless, the absolute amount of energy and emissions caused by sorting activities is relatively small if compared to the energy spent by TBS. An energy consumption of 250 MWh/month from TBS can be speculated and compared to an energy consumption of 45 MWh/month from the e-grader’s use phase (at the production rate being calculated).
An LCA analysis as defined from the standard ISO14044:2006 [28] has been selected, because it fits well with the purpose of the decision support methodology in the evaluation of the environmental sustainability’s impact. The functional unit of the LCA is one unit of e-grader, and the goal of the LCA is to assess the environmental impact caused by the building of each component constituting the bill of material of the e-grader. The stages included in the analysis are raw material extraction and manufacturing of components (cradle-to-gate scope). The geographical system boundaries are global, and impacts from transportation have been included.
The LCA has been performed according to the impact assessment method of ReCiPe midpoint according to the hierarchist (H) perspective [45]. Table 7 shows the main outputs from the LCA analysis.
Table 7. LCIA ReCiPe midpoint (H) applied to the demonstrator. Characterization factors related to toxicity are expressed through the reference unit kg 1.4-dichlorobenzene equivalent (kg 1.4-DB eq).
Life Cycle Impact Assessment (LCIA) CategoryReference UnitValue
Climate changekg CO2 eq9,039.502
Fossil depletionkg oil eq2,182.532
Freshwater ecotoxicitykg 1.4-DB eq0.193
Freshwater eutrophicationkg P eq10,095.415
Human toxicitykg 1.4-DB eq706.066
Metal depletionkg Fe eq6,296.526
Terrestrial ecotoxicitykg 1.4-DB eq0.893
Water depletionm343,988.726
The indicators shown in Table 7 represent a sub-set of the whole set of the impact categories included by the ReCiPe midpoint (H). The authors selected those indicators that were deemed most interesting for assessment with respect to the type of functional unit at issue. This choice also comes from discussions with the engineers of the company using the demonstrator. At this stage, these figures cannot be compared to any other type of technology for e-waste sorting, but can still be used as a baseline for future environmental analyses, which may be orientated toward reducing the impact in specific areas. Comments on the implications of the absolute values of Table 6 and Table 7 are to be performed by environmental engineers, as this exceeds the scope of this study. It is possible to argue that at this stage of the technology development, a reduction in environmental burdens or an increase in environmental benefits from the e-grader life cycle can be pursued. First, the e-grader might cause less environmental impact than that reported in the LCA analysis by two means: the use of materials that cause less “embedded” resource consumptions and emissions or less component weight. Moreover, if the components are acquired from local suppliers, then the impact from transporting this equipment from the vendor to the user will be reduced.
In conclusion, the more the WEEE input stream, that is sorted by the sorting unit, contains reusable items, the more the benefits from using the sorting unit for grading purposes increase when compared to the value provided by grading performed by operators (because in this case, uniformity of grading criteria is not guaranteed).

5.2.3. Reporting Social Considerations on the Demonstrator

The results from the social sustainability assessment within the system boundaries of the sorting facility have been reported by Taghavi et al. in [30], to which the authors of this paper contributed.
Taghavi et al. used an established framework based on social sustainability indicators in order to assess the social implications for facility operators from the introduction of the e-grader within the sorting facility. These indicators range from labor codes of conduct (e.g., occupational health and safety), personal development, work design (e.g., participation), work-life balance, employee turnover and job security. Literature studies, on-site observations, semi- and un-structured interviews were used in order to collect initial data for the study. A structured interview with a company representative was carried out using the framework as a question guide. The results from [30] showed that an overall benefit from the use of the e-grader exists for operators, because it may support some proactive aspects of social sustainability, such as competence development. Some additional conditions, which the sorting technology itself does not provide, need to be secured by the organization in order to ensure a socially-sustainable implementation:
  • Education and training must be provided to employees,
  • Workers must be made aware that they have new responsibilities.
These two conditions have been recognized as key to having employees willing to use the e-grader and an important contribution to a positive work environment.
Nevertheless, trade-offs between the number of job opportunities and meaningful work content must be managed by companies.
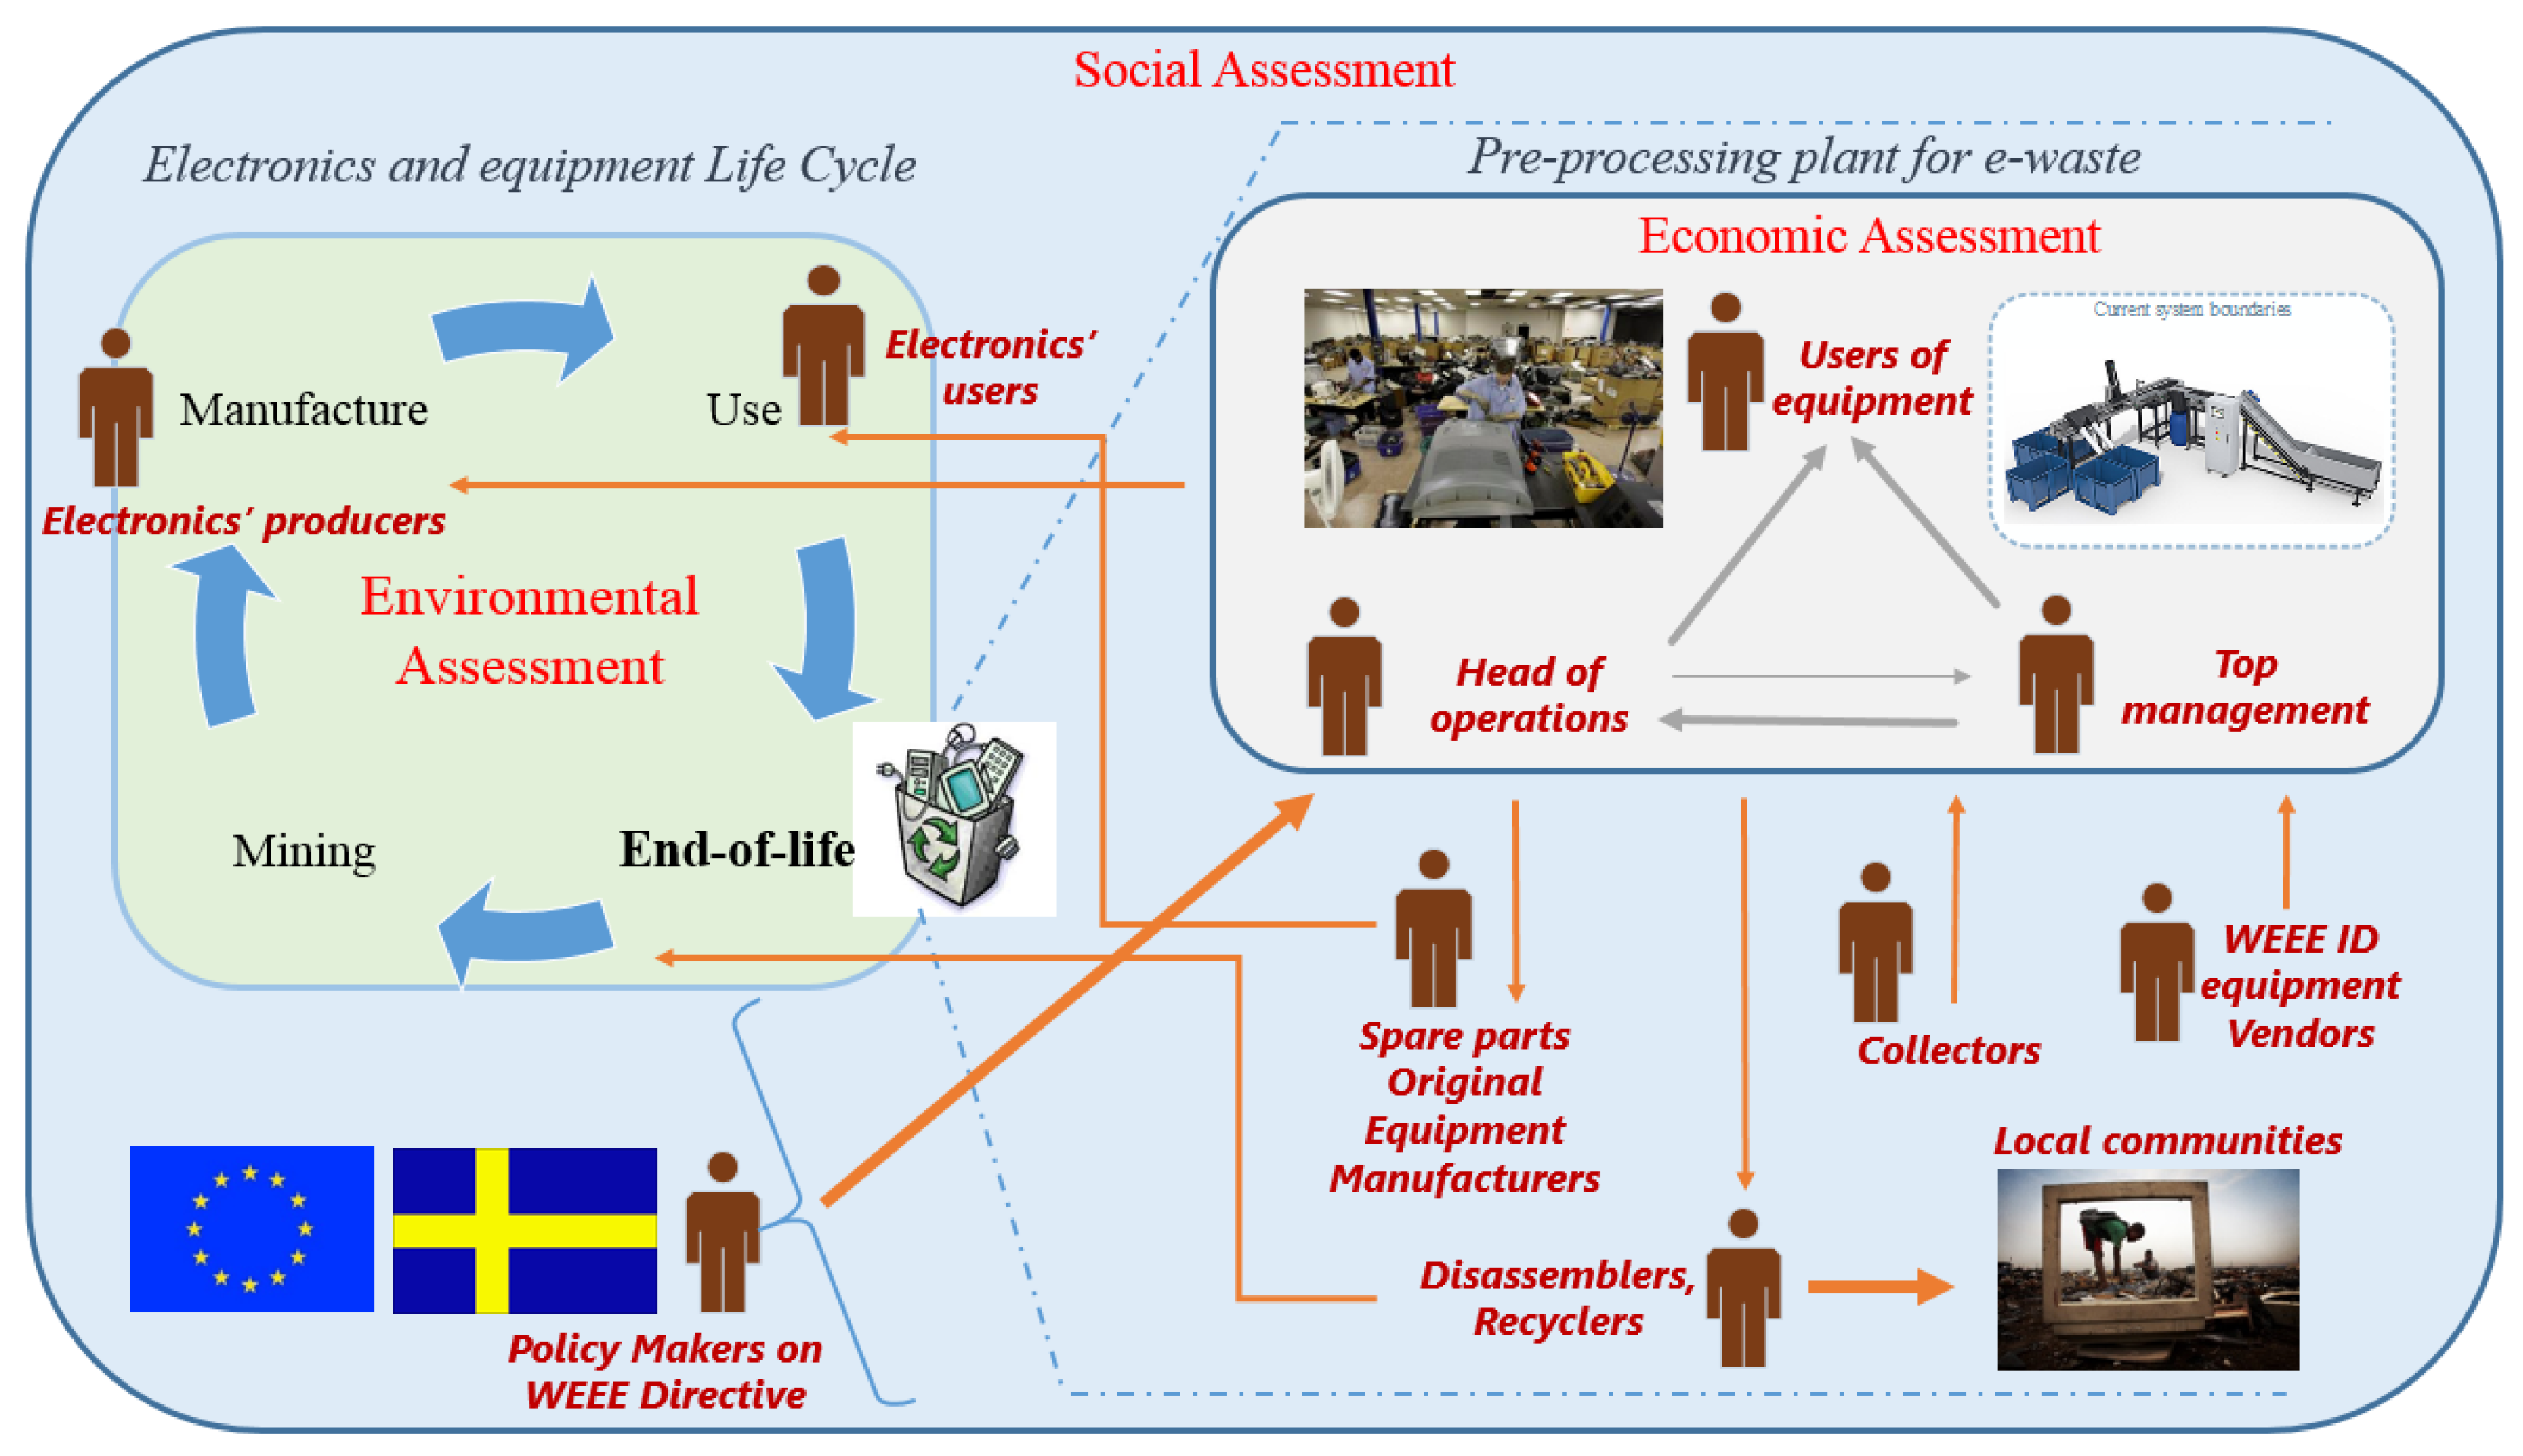
A stakeholder map was drawn to capture the three sustainability assessments from a life-cycle perspective. The influences occurring amongst the stakeholders of the electronics life cycle following the introduction of the e-grader are shown in Figure 7. It summarizes the relationships between system boundaries of the different assessments being performed and the main stakeholders whose activities affect the use or will be affected by the use of the e-grader demonstrator.
Figure 7. Stakeholder map: influences among stakeholders.
Sustainability 08 00084 g007
In Figure 7, connections represented by arrows were drawn according to the expertise of the authors and the outcome from discussions held with experts over the CIRP (College International pour la Recherche en Productique) Life Cycle Engineering Conference 2015 [12]. Grey arrows represent influences acting within the e-waste facility, whereas orange arrows represent influences acting outside the e-waste facility, which may or may not affect its activities. The width of the arrows aims at qualitatively representing the strength of the influence from one actor towards another. From Figure 7, two findings are extracted:
  • Operations carried out by recyclers, if connected to informal e-waste treatment activities, cause huge damage to the communities of developing countries affected by illegal e-waste dumping. More accurate sorting and higher reuse initiatives can indirectly reduce the amount of e-waste otherwise intended for informal e-waste recycling.
  • Policy makers can incentivize the adoption of the e-grader unit within sorting and recycling centers through several means, for instance monetary incentives (e.g., tax reductions).
From the results of the economic, environmental and social assessment and from the considerations being drawn from the stakeholder map, it can be concluded that the adoption of the e-grader in the facility used for the demonstrator will make it more economic and socially sustainable in comparison with the current state of the facility. Environmental sustainability performances of the facility grow worse when compared to the as-is state, when considering the system boundaries of the sorting facility.
However, this does not hold anymore when the system boundaries of the analysis are expanded and embrace the whole electronics supply chain, as the cost-benefit analysis showed. Therefore, it can be argued that with the introduction of the e-grader, to that facility, and later on within the market, positive impacts on sustainability’s triple-bottom line will ripple throughout the electronics supply chain.

6. Discussion

Having identified the need for developing a decision support methodology for sustainable EMS, a research question was formulated to address the framework needs to ensure effective sustainability-oriented reconfigurations of EMS.
The proposed decision support methodology consists of the following steps:
  • a novel framework containing the steps to be undertaken by decision-making stakeholders and users of the methodology, in order to evaluate the proposals of reconfigurations of EMS;
  • a set of sustainability criteria and sustainability assessment tools suitable for applications to EMS that the authors have retrieved from separated studies; this is one of the first studies to report a compilation of such a nature;
  • a set of data visualization techniques retrieved from the literature to showcase assessment results.
To validate the first setting of the decision support methodology, the authors briefly presented it to five company representatives of e-waste management facilities via email. These company representatives operate at a top-tier management level within their own organization and represent a small, though valuable, sample of decision stakeholders, which the decision support methodology aims to support.
Within the emails, the authors have asked for feedback on the projected value that the decision support methodology would bring to their own company. This feedback was unanimously positive and encouraged further developments and applications of the decision support methodology.
The decision support methodology was applied to a case study on the implementation of an automated piece of sorting equipment for e-waste. This application revealed new knowledge on the sustainability impacts of adding an automated sorting equipment to an existing sorting facility. The analyses were made specifically on the e-grader demonstrator (e.g., through excel-sheets, DES model, documentation).
The results from the case study were validated and approved by the WEEE-ID research project partners. These results will contribute to new knowledge about the impacts of adding a new e-grader to an existing sorting facility.
The following limitations of the decision support methodology were identified:
  • The decision support methodology needs to be tested in other cases in order to validate its constituent framework and include additional criteria and tools for sustainability assessments of EMS that might not have been considered within this paper.
  • The decision support methodology needs to integrate further sustainability assessment tools, which can include the impacts caused by reconfigurations of EMS throughout the natural and social landscapes in which the e-waste management company operates. Maxwell [46] illustrated case studies of companies that integrated the monetary value of the natural and social capital they depend on within their traditional decision-making tools. The authors believe that adopting such an approach within the decision support methodology will guide the decision makers towards choices reflecting a truly sustainable, life-cycle thinking perspective. This kind of approach could be tested in one of the future case studies.
  • The decision support methodology is not applicable to companies that do not collect the data necessary for the kind of assessments being proposed (see Table 2). Most of the companies working within the e-waste management sector are small- and medium-sized enterprises that might not be able to afford the expense of data monitoring and data gathering activities for the implementation of sustainability assessments.
Visualization of results from the assessments are presently not considered in the case study. In the future, the authors intend to collect quantitative measurements as inputs for social sustainability assessment once the sorting unit is implemented in a real company. This will provide opportunites for the companies to measure the results from the different assessments and pave the way for improvements in terms of economic, environmental and social sustainability.
From the discussions with the business experts involved in this study, it can be seen that the profitability of a specific reconfiguration of an EMS is strongly dependent on the type of e-waste streams that the facility is likely to process. Therefore, the authors recommend that users of the decision support methodology invest effort in forecasting the volume and mix characteristics of e-waste streams and include the sources of variability of this forecast within the risk analysis advised by the framework.
With respect to the case study of this research, the authors noted that previous studies that compiled different sorting techniques for solid waste (such as Huang [47], Goodship and Stevels [48], which focused on e-waste specifically) addressed the suitability of each technique to the specific nature of items to be sorted, but did not envision a comparison of the same in terms of sustainability criteria.
This paper conducts a performance evaluation of technological or operational alternatives against sustainability criteria, whereas previous studies focusing on the processing stages of e-waste treatment (such as disassembly and recycling) used different kinds of criteria: for example, eco-efficiency-related criteria were used by Wath et al. [49] and corporate sustainability performance was used by Yeh and Xu [50].
To conclude, the novelty of this research lies in:
  • the holistic nature of the assessment indicators and tools to evaluate EMS, which refer to the triple-bottom line of sustainability. The authors demonstrated that this approach has not been pursued by previous studies, which looked at only one aspect of the triple-bottom line of sustainability. Addressing sustainability partially prevents EMS from being truly sustainable within the natural and social landscape in which they operate.
  • the foundation of the decision support methodology on a problem-solving model. Such a foundation contextualizes the use of the methodology for its users and for the key stakeholders of the EMS.
  • the application of the decision support methodology to the case study of an innovative piece of equipment for automatic sorting of e-waste. The results from such a case study pave the way for discussions about the benefits and drawbacks of introducing automation and artificial intelligence in processes that are traditionally performed by humans.

7. Conclusions

To maintain competitiveness, e-waste management companies cannot neglect the need to promptly assess possible reconfigurations of EMS and making sure they cause positive impacts on the triple-bottom line of sustainability. Research and development supporting e-waste management decision makers for the assessment of reconfiguration proposals in accordance with sustainability criteria are needed. The authors have developed a decision support framework and methodology with clearly-defined steps and analysis tools to evaluate and visualize the impacts caused by changes applied at a production system level. The decision support methodology was tested in a case study involving the introduction of an automated piece of sorting equipment for e-waste into an existing sorting facility, which uses human labor to deliver sorting activities. Not only did the methodology generate useful information for decision making, but also helped identify requirements to further assess the broader impacts on the social landscape in which EMS operate.
Potential future applications of the framework are envisioned in production systems handling other waste streams, besides electronics.
According to the experiences gained from this study, the decision support methodology turned out to be a suitable tool to foster sustainable e-waste management. In the future, collaborative and multidisciplinary approaches encompassing product design, production development and sustainable consumption are needed in order to achieve fully-integrated sustainable e-waste management.

Acknowledgments

This work is funded by VINNOVA (Swedish Agency for Innovation Systems) through the WEEE ID project. The work has been carried out within the Sustainable Production Initiative and the Production Area of Advance at Chalmers. The support is gratefully acknowledged. The authors thank the five company representatives who contributed to this study by providing specific feedback on their perceived usefulness of the decision support methodology: Björn Hall, Göran Lundholm, Magnus Nilsson, Johanna Reimers and Martin Seeger.

Author Contributions

Ilaria Barletta designed the study, conducted the analyses and wrote the manuscript. Jon Larborn developed the simulation model and its visualization. Mahesh Mani advised on the research methodology of the study and improved the quality of the written manuscript. Björn Johansson established the research direction and contributed to the writing of the manuscript.

Conflicts of Interest

The authors declare no conflict of interest.

References

  1. United Nations University. World E-Waste Map Reveals National Volumes, International Flows. Available online: http://unu.edu/media-relations/releases/step-launches-interactive-world-e-waste-map.html#info (accessed on 30 October 2015).
  2. European Commission (EC). Waste Electrical and Electronic Equipment Directive 2012/19/EU; European Commission: Strasbourg, 2003. [Google Scholar]
  3. Slaper, T.F.; Hall, T.J. The triple bottom line: What is it and how does it work? Indiana Bus. Rev. 2011, 86, 4–8. [Google Scholar]
  4. The University of Illinois at Urbana-Champaign Sustainable Technology Center. Strategies for Improving the Sustainability of E-Waste Management Systems. 2009. Available online: http://www.sustainelectronics.illinois.edu/concept_paper.pdf (accessed on 5 December 2015).
  5. Huisman, J.; Stevels, A.; Marinelli, T.; Magalini, F. Where did WEEE go wrong in europe? Practical and academic lessons for the US. In Proceedings of the 2006 IEEE International Symposium on Electronics and the Environment, Scottsdale, AZ, USA, 8–11 May 2006; IEEE: Scottsdale, AZ, USA, 2006; pp. 83–88. [Google Scholar]
  6. Ongondo, F.O.; Williams, I.D.; Cherrett, T.J. How are weee doing? A global review of the management of electrical and electronic wastes. Waste Manag. 2011, 31, 714–730. [Google Scholar] [CrossRef] [PubMed]
  7. Chancerel, P.; Meskers, C.E.; Hagelüken, C.; Rotter, V.S. Assessment of precious metal flows during preprocessing of waste electrical and electronic equipment. J. Ind. Ecol. 2009, 13, 791–810. [Google Scholar] [CrossRef]
  8. Tsydenova, O.; Bengtsson, M. Chemical hazards associated with treatment of waste electrical and electronic equipment. Waste Manag. 2011, 31, 45–58. [Google Scholar] [CrossRef] [PubMed]
  9. Cui, J.; Forssberg, E. Mechanical recycling of waste electric and electronic equipment: A review. J. Hazard. Mater. 2003, 99, 243–263. [Google Scholar] [CrossRef]
  10. Vongbunyong, S.; Kara, S.; Pagnucco, M. Learning and revision in cognitive robotics disassembly automation. Robot. Comput. Integr. Manuf. 2015, 34, 79–94. [Google Scholar] [CrossRef]
  11. Schluep, M.; Hagelüken, C.; Meskers, C.; Magalini, F.; Wang, F.; Müller, E.; Kuehr, R.; Maurer, C.; Sonnemann, G. Market potential of innovative e-waste recycling technologies in developing countries. In Proceedings of the R’09 Twin World Congress & World Resources Forum, Davos, Switzerland, 14–16 September 2009.
  12. Barletta, I.; Johansson, B.; Reimers, J.; Stahre, J.; Berlin, C. Prerequisites for a high-level framework to design sustainable plants in the e-waste supply chain. In Proceedings of the 22nd CIRP Conference on Life Cycle Engineering, Sydney, Australia, 7–9 April 2015.
  13. Wibowo, S.; Deng, H.; Zhang, X. Evaluating the performance of e-waste recycling programs using fuzzy multiattribute group decision making model. In Proceedings of the 2014 9th IEEE Conference on Industrial Electronics and Applications ICIEA, Hangzhou, China, 9–11 June 2014; pp. 1989–1994.
  14. Wibowo, S.; Deng, H. Multi-criteria group decision making for evaluating the performance of e-waste recycling programs under uncertainty. Waste Manag. 2015, 40, 127–135. [Google Scholar] [CrossRef] [PubMed]
  15. Song, Q.; Wang, Z.; Li, J. Sustainability evaluation of e-waste treatment based on emergy analysis and the lca method: A case study of a trial project in macau. Ecol. Indic. 2013, 30, 138–147. [Google Scholar] [CrossRef]
  16. Hong, J.; Shi, W.; Wang, Y.; Chen, W.; Li, X. Life cycle assessment of electronic waste treatment. Waste Manag. 2015, 38, 357–365. [Google Scholar] [CrossRef] [PubMed]
  17. Asampong, E.; Dwuma-Badu, K.; Stephens, J.; Srigboh, R.; Neitzel, R.; Basu, N.; Fobil, J.N. Health seeking behaviours among electronic waste workers in ghana environmental health. BMC Public Health 2015, 15, 1065. [Google Scholar] [CrossRef] [PubMed]
  18. Wittsiepe, J.; Fobil, J.N.; Till, H.; Burchard, G.D.; Wilhelm, M.; Feldt, T. Levels of polychlorinated dibenzo-p-dioxins, dibenzofurans (pcdd/fs) and biphenyls (pcbs) in blood of informal e-waste recycling workers from agbogbloshie, ghana, and controls. Environ. Int. 2015, 79, 65–73. [Google Scholar] [CrossRef] [PubMed]
  19. Walther, G.; Spengler, T. Impact of WEEE-directive on reverse logistics in Germany. Int. J. Phys. Distrib. Logist. Manag. 2005, 35, 337–361. [Google Scholar] [CrossRef]
  20. Yin, R. Case Study Research: Design and Methods; Sage publications: Los Angeles, CA, USA, 2013. [Google Scholar]
  21. Restructuring Associates Inc.©. Six-Step Problem Solving Model. 2008. Available online: http://www.yale.edu/bestpractices/resources/docs/problemsolvingmodel.pdf (accessed on 30 October 2015).
  22. Almannai, B.; Greenough, R.; Kay, J. A decision support tool based on qfd and fmea for the selection of manufacturing automation technologies. Robot. Comput. Integr. Manuf. 2008, 24, 501–507. [Google Scholar] [CrossRef] [Green Version]
  23. Al-Salem, S.M.; Lettieri, P.; Baeyens, J. Recycling and recovery routes of plastic solid waste (psw): A review. Waste Manag. 2009, 29, 2625–2643. [Google Scholar] [CrossRef] [PubMed]
  24. Santoyo-Castelazo, E.; Azapagic, A. Sustainability assessment of energy systems: Integrating environmental, economic and social aspects. J. Clean. Prod. 2014, 80, 119–138. [Google Scholar] [CrossRef]
  25. Cucchiella, F.; D’Adamo, I.; Lenny Koh, S.C.; Rosa, P. Recycling of weees: An economic assessment of present and future e-waste streams. Renew. Sustain. Energy Rev. 2015, 51, 263–272. [Google Scholar] [CrossRef]
  26. Andarani, P.; Goto, N. Potential e-waste generated from households in indonesia using material flow analysis. J. Mater. Cycles Waste Manag. 2014, 16, 306–320. [Google Scholar] [CrossRef]
  27. Babayemi, J.; Sindiku, O.; Osibanjo, O.; Weber, R. Substance flow analysis of polybrominated diphenyl ethers in plastic from EEE/WEEE in nigeria in the frame of Stockholm convention as a basis for policy advice. Environ. Sci. Pollut. Res. 2015, 22, 14502–14514. [Google Scholar] [CrossRef] [PubMed]
  28. ISO. ISO14044:2006: Environmental Management—life Cycle Assessment—Requirements and Guidelines. Available online: http://www.iso.org/iso/catalogue_detail?csnumber=38498 (accessed on 24 December 2015).
  29. Global Reporting Initiative (GRI). Sustainability Reporting Guidelines. Available online: https://www.globalreporting.org/resourcelibrary/G3-Guidelines-Incl-Technical-Protocol.pdf (accessed on 24 December 2015).
  30. Taghavi, N.; Barletta, I.; Berlin, C. Social implications of introducing innovative technology into a product-service system: The case of a waste-grading machine in electronic waste management. In Proceedings of the APMS International Conference Advances in Production Management System, Tokyo, Japan, 5–9 September 2015.
  31. Jørgensen, A.; Le Bocq, A.; Nazarkina, L.; Hauschild, M. Methodologies for social life cycle assessment. Int. J. Life Cycle Assess. 2008, 13, 96–103. [Google Scholar] [CrossRef]
  32. Zijp, M.; Heijungs, R.; van der Voet, E.; van de Meent, D.; Huijbregts, M.; Hollander, A.; Posthuma, L. An identification key for selecting methods for sustainability assessments. Sustainability 2015, 7, 2490–2512. [Google Scholar] [CrossRef] [Green Version]
  33. Ness, B.; Urbel-Piirsalu, E.; Anderberg, S.; Olsson, L. Categorising tools for sustainability assessment. Ecol. Econ. 2007, 60, 498–508. [Google Scholar] [CrossRef]
  34. Alenka, Z.; Jurij, J. The impact of information visualisation on the quality of information in business decision-making. Int. J. Technol. Hum. Interact. 2015, 11, 61–79. [Google Scholar]
  35. Blanchard, B.S.; Fabrycky, W.J. Systems Engineering and Analysis, 5th ed.; Prentice Hall: Upper Saddle River, NJ, USA, 2010; pp. 227–231. [Google Scholar]
  36. Finkbeiner, M.; Schau, E.M.; Lehmann, A.; Traverso, M. Towards life cycle sustainability assessment. Sustainability 2010, 2, 3309–3322. [Google Scholar] [CrossRef]
  37. Salvado, M.; Azevedo, S.; Matias, J.; Ferreira, L. Proposal of a sustainability index for the automotive industry. Sustainability 2015, 7, 2113–2144. [Google Scholar] [CrossRef]
  38. Miettinen, K. Survey of methods to visualize alternatives in multiple criteria decision making problems. OR Spectr. 2014, 36, 3–37. [Google Scholar] [CrossRef]
  39. Bryson, J.M. What to do when stakeholders matter: Stakeholder identification and analysis techniques. Public Manag. Rev. 2004, 6, 21–53. [Google Scholar] [CrossRef]
  40. Hans Rosling’s Greatest Hits. The Economist Online 2010. Available online: http://www.economist.com/blogs/babbage/2010/12/data_visualisation (accessed on 30 October 2015).
  41. VINNOVA. WEEE ID—Kunskap Och Teknik för Mer Hållbar Återvinning av Elektronikskrot. Available online: http://www.vinnova.se/sv/Resultat/Projekt/Effekta/2013-00117/WEEE-ID---kunskap-och-teknik-for-mer-hallbar-atervinning-av-elektronikskrot/ (accessed on 30 October 2015).
  42. Hanselman, D.; Littlefield, B. Mastering Matlab 5: A Comprehensive Tutorial and Reference; Englewood Cliffs: Upper Saddle River, NJ, USA, 1998. [Google Scholar]
  43. InvestingAnswers. Gross Profit Margin. Available online: http://www.investinganswers.com/financial-dictionary/ratio-analysis/gross-profit-margin-2076 (accessed on 30 October 2015).
  44. Heisinger, K. Essentials of Managerial Accounting; Cengage Learning: Boston, MA, USA, 2009. [Google Scholar]
  45. ReCiPe. Recipe. Available online: http://www.lcia-recipe.net/ (accessed on 30 October 2015).
  46. Maxwell, D. Valuing Natural Capital: Future Proofing Business and Finance; DōShorts: London, UK, 2015. [Google Scholar]
  47. Jiu, H.; Pretz, T.; Zhengfu, B. Intelligent solid waste processing using optical sensor based sorting technology. In Proceedings of the 2010 3rd International Congress on Image and Signal Processing (CISP), Yantai, China, 16–18 October 2010; pp. 1657–1661.
  48. Goodship, V.; Stevels, A. Waste Electrical and Electronic Equipment (WEEE) Handbook; Woodhead Publishing: Sawston, Cambridge, United Kingdom, 2012; pp. 216–228. [Google Scholar]
  49. Wath, S.B.; Katariya, M.N.; Singh, S.K.; Kanade, G.S.; Vaidya, A.N. Separation of wpcbs by dissolution of brominated epoxy resins using dmso and nmp: A comparative study. Chem. Eng. J. 2015, 280, 391–398. [Google Scholar] [CrossRef]
  50. Yeh, C.-H.; Xu, Y. Sustainable planning of e-waste recyclin g activities using fuzzy multicriteria decision making. J. Clean. Prod. 2013, 52, 194–204. [Google Scholar] [CrossRef]

