Article

Assessment of Trace Metals Contamination of Surface Water and Sediment: A Case Study of Mvudi River, South Africa

by
Joshua N. Edokpayi
1,*,
John O. Odiyo
1,
Oluwaseun E. Popoola
2 and
Titus A. M. Msagati
3
1
Department of Hydrology and Water Resources, University of Venda, Private Bag X5050, Thohoyandou 0950, South Africa
2
Department of Chemical Sciences, Yaba College of Technology, P. M. B. 2011 Yaba, Lagos 101212, Nigeria
3
College of Science, Engineering and Technology, Nanotechnology and Water Sustainability Research Unit, Florida Science Campus, University of South Africa, 1710 Roodepoort, Johannesburg 2000, South Africa
*
Author to whom correspondence should be addressed.
Sustainability 2016, 8(2), 135; https://0-doi-org.brum.beds.ac.uk/10.3390/su8020135
Submission received: 25 October 2015 / Revised: 23 January 2016 / Accepted: 25 January 2016 / Published: 2 February 2016

Abstract

:
Trace metals contamination of rivers and sediments remains a global threat to biodiversity and humans. This study was carried out to assess the variation pattern in trace metals contamination in Mvudi River water and sediments for the period of January–June 2014. Metal concentrations were analyzed using an inductively-coupled plasma optical emission spectrometer after nitric acid digestion. Compliance studies for the water samples were performed using the guidelines of the Department of Water Affairs and Forestry (DWAF) of South Africa and the World Health Organization (WHO). The National Oceanic and Atmospheric Administration (NOAA) sediment quality guidelines for marine and estuarine sediments and the Canadian Council of Ministers of the Environment sediment guidelines (CCME) for freshwater sediments were used to determine the possible toxic effects of the metals on aquatic organisms. pH (7.2–7.7) and conductivity (10.5–16.1 mS/m) values complied with DWAF and WHO standards for domestic water use. Turbidity values in nephelometric turbidity units (NTU) were in the range of 1.9–429 and exceeded the guideline values. The monthly average levels of trace metals in the water and sediments of Mvudi River were in the range of: Al (1.01–9.644 mg/L and 4296–5557 mg/kg), Cd (0.0003–0.002 mg/L and from below the detection limit to 2.19 mg/kg), Cr (0.015–0.357 mg/L and 44.23–149.52 mg/kg), Cu (0.024–0.185 mg/L and 13.22–1027 mg/kg), Fe (0.702–2.645 mg/L and 3840–6982 mg/kg), Mn (0.081–0.521 mg/L and 279–1638 mg/kg), Pb (0.002–0.042 mg/L and 1.775-4.157 mg/kg) and Zn (0.031–0.261 mg/L and 14.481–39.88 mg/kg). The average concentrations of Al, Cr, Fe, Mn and Pb in the water samples exceeded the recommended guidelines of DWAF and WHO for domestic water use. High concentrations of Al and Fe were determined in the sediment samples. Generally, the concentrations of Cd, Cr and Cu in the sediments exceeded the corresponding effect range low (ERL) values in the sediment quality guidelines and could have adverse effects on aquatic organisms in Mvudi River.

1. Introduction

Surface water has been and is still being used for many purposes, which include drinking, irrigation, animal farming, recreation and serves as habitat to numerous organisms. The aesthetic properties of most rivers and streams have made them sites for tourist attraction and recreation. It have also served as sources of employment, particularly for the fishing industry. Generally, in most countries of the world, surface water is used as the main source of water for the provision of potable water after necessary treatment. The treatment costs for potable water production are reduced greatly when water of a desirable quality is used as a source. Therefore, freshwater sources like rivers and streams, need to be protected from contamination with benefits not limited to humans alone, but also to prevent environmental deterioration and reduction in biodiversity. Access to safe water is entrenched in South Africa’s constitution as a basic human right [1]; yet, it has been estimated that 3.5 million people in South Africa do not have access to safe drinking water, and this problem is more pronounced in rural areas [2]. Thus, many residents of the affected rural or disadvantaged communities depend largely on surface water for their domestic water needs.
One of the issues of concern is that the quality of surface water has been plagued by several natural and anthropogenic activities with the contribution of humans outweighing those of natural origin [3]. Unplanned urbanization and population growth are some of the factors that may be responsible for the pollution of water bodies [4]. The easy accessibility of rivers for the disposal of domestic and industrial wastes has made them very susceptible to pollution, especially by anthropogenic activities [5]. Among the most notorious water pollutants are heavy metals, which are a group of contaminants long detected as a threat to aquatic organisms and humans, even at trace concentrations [6,7]. They are known for their toxicity and persistence in the environment [8,9]. They also have the tendency to bio-accumulate in living tissues, such as fish, to concentrations that can compromise the normal physiological processes of these organisms, and this provides an introductory pathway into the human food chain [10]. Poor river water and sediment quality can lead to stress and mortality of invertebrates and fish present in rivers [11,12]. The use of metals polluted water for irrigation can cause the death of crops or interfere with the uptake of essential nutrients [3,13,14].
Iqbal and Gupta [15] have identified dumping of municipal wastes into water bodies as a very important source of water pollution by metals. They noted that water already present in the waste or the water generated by biodegradation together with rainwater can cause leachate to leave the dumping sites into water bodies, including groundwater. The leachate formed by biochemical reactions is rich in organic content and solubilizes many metals, like Pb, Cu, Zn, Cd and Mn, and some of these metals can be toxic, even at trace levels [4]. Heavy metals are easily adsorbed to sediments, which can act as a sink and secondary source of these contaminants in water and aquatic biota [16]. Such accumulation of metals is dependent on a number of factors, which include the pH of the river water, the concentration of metals, anthropogenic inputs and other chemistry parameters of the river itself. Under favorable conditions, metals can solubilize back to the aqueous phase. Contaminated sediments do have several adverse effects on the aquatic ecosystem.
Exposure to heavy metals is still a huge problem, especially in developing countries, despite the knowledge of the threats they pose to human health [17]. This study aimed at assessing the level of heavy metal contamination of Mvudi River, which is often used without prior treatment by residents of villages that surround its course to meet their domestic, agricultural and recreational needs. The possible risk of the metals determined in the sediments on aquatic organisms is also reported. This study is the first attempt to assess the sediment quality of Mvudi River, and it is among the few studies that have so far been conducted on sediments in river systems of South Africa.

2. Experimental Section

2.1. Study Area

Mvudi River in Thohoyandou (30°28’28’’E and 23°0’13’’S) is a tributary of the Luvuvhu River, located in the northeastern part of South Africa (Figure 1). It falls in the Lowveld of Limpopo Province, which forms part of the greater Limpopo River Basin with an elevation of 546 m above sea level [18,19]. It has a semi-arid climate, which is classified as humid subtropical with a subtropical dry forest biozone. Daily temperature in the catchment varies between 20–40 °C (wet season) and 12–22 °C (dry season), respectively. Rainfall distribution is greatly influenced by the Soutpansberg Mountain [20]. The catchment average annual rainfall is about 800 mm, but it often varies between 340 mm and 2000 mm [18]. The river is majorly used for domestic, recreational and agricultural purposes. Several land use activities in the river catchment that could constitute possible sources of pollution include agriculture, human settlements, schools, hospitals, solid waste disposal sites and effluents from wastewater treatment plant. Mvudi River is a major source of water to Nandoni dam, which is treated for potable water supply around Thohoyandou.
Figure 1. Map of the study area.
Sustainability 08 00135 g001

2.2. Sample Collection

Thirty six water samples were randomly collected from different points in Mvudi River. Sampling was carried out across the two major seasons in the study area from January–June 2014. Prior to this, 500-mL polyethylene sample containers were cleaned using livid detergent, followed by rinsing with tap water until they were free of detergent. In the field, the containers were rinsed three times with water at the sampling point before collection. Each sample was collected by submerging the sample container into the river at about 100–300 mm below the surface with an open end facing against the current flow direction [21]. Field measurements of pH and conductivity were determined using a 340i multimeter (WTW, Weilheim, Germany). A TB 200 turbidimeter (Orbeco Hellige, Sarasota, FL, USA) was used to measure the turbidity of the river water. Samples for total metal concentrations were acidified with concentrated nitric acid and transported on ice chest to the Hydrology and Water Resource Laboratory at the University of Venda. Similarly, thirty sediment samples (0–5 cm) were randomly collected (at an interval of 500–1000 m) from different points along Mvudi River by means of stainless steel. The samples were placed into polyethylene plastic bags and transported on ice chest to the laboratory. The samples were stored at 4 °C in a refrigerator between 7 and 90 days before analysis.

2.3. Sample Pre-Treatment

Water samples were digested as reported by Edokpayi et al. [22]. Sediment samples were air dried, homogenized, ground gently with an agate pestle and mortar and sieved with 500-µm analytical sieves prior to digestion. The method developed by the United States Environmental Protection Agency for heavy metals in soils, sediments and sludge was employed in the preparation of the sediment samples for the determination of total metal content in this study [23]. Five grams of the sample were accurately weighed into a 125-mL conical flask. Ten milliliters of 1:1 HNO3 were added, and the slurry was mixed and covered with a watch glass. The mixture was heated on a water bath for 2 hours. The digest was allowed to cool, and an additional 5 mL of concentrated HNO3 were again added with continued heating for 1 hour. The last step was repeated. The sample was again allowed to cool, and 2 cm3 of de-ionized H2O along with 3 mL of 30% H2O2 were added. The addition of 30% H2O2 in 1-mL increments was performed continuously followed by gentle heating until the reaction with peroxide became minimal (or effervescence subsided). Five milliliters of concentrated HCl along with 10 mL of de-ionized H2O were subsequently added with the beaker covered, and reflux was repeated for an additional 30 minutes. The sample was allowed to cool and filtered through a Whatman No. 1 filter paper into a 100-mL volumetric flask. The conical flask and filter paper were rinsed with small volumes of 1:100 HCl and the filtrate made up to the 100-mL mark with distilled water. The concentrations of trace metals in the digested samples were analyzed with an inductively-coupled plasma optical emission spectrometer (ICP-OES).

2.4. Validation of Analytical Methodology and Statistical Analyses

Spike recovery method was employed in triplicate to validate the analytical method used for both the water and sediment samples. U.S. EPA Method 200.7 [24] was used to determine the detection limit (MDL) of the analytical instrument (ICP-OES). The percentage recoveries for the metals were in the range of 95 ± 4–105 ± 5% and 85 ± 5–110 ± 4, respectively, for water and sediment samples. MDL for the metals in both types of samples varied between 1 and 25 µg/L. The obtained data were analyzed with SPSS Version 20.0 statistical software. Good linearity was obtained from the calibration curves prepared from a multi-element (100 mg/L) standard solution supplied by Merck (pty) Ltd (South Africa).

3. Results and Discussion

3.1. Physico-Chemical Parameters

Speciation and bio-availability of metals in aquatic ecosystems are strongly dependent on pH. Low pH values <4 usually increase the toxicity of most metals. The average pH values determined in this study varied between 7.2 and 7.7 (Table 1) and complied with DWAF and WHO guidelines for domestic water use.
Table 1. Average levels of physico-chemical parameters in Mvudi River [19]. DWAF, Department of Water Affairs and Forestry.
MonthspHConductivity (mS/m)Turbidity (NTU)
January7.4 ± 0.0410.5 ± 0.08429 ± 31
February7.3 ± 0.0415.9 ± 0.6620.4 ± 4.3
March 7.7 ± 0.1613.6 ± 1.817.6 ± 8.2
April7.2 ± 0.2212.8 ± 0.628.0 ± 0.67
May7.6 ± 0.0516.1 ± 2.137.8 ± 3.5
June7.6 ± 0.0513.8 ± 1.671.9 ± 1.16
DWAF guidelines6–9<70<1
WHO guidelines6.5–9.5600<1
NTU = nephelometric turbidity units.
Table 1 shows mean values of conductivity determined in this study (10.5–16.1 mS/m), which were below the DWAF and WHO guidelines of 70 mS/m and 600 mS/m, respectively [25,26]. The clarity of water is determined by its turbidity value, and highly turbid water is an indicator of the presence of suspended solids, colloidal substances and microorganisms. The highest turbidity value was determined in January (429 NTU), and this can be attributed to runoffs of sediments and other materials into the river due to rainfall events. As expected, higher turbidity values were determined in the wet season (17.6–429 NTU) than in the dry season (1.79–8.0 NTU) (Table 1). The threshold value of 1 NTU by DWAF and WHO for domestic water use was exceeded throughout the sampling period.

3.2. Trace Metals Concentration of Mvudi River Water

Al is a non-critical metal when present in neutral to basic pH; however, there is a growing concern when it is present in relatively high concentrations [25]. The concentration of Al in the water samples varied between 1.01 and 9.644 mg/L. The average concentration of Al in each of the sampling month is presented in Table 2. A very high concentration of Al was observed in January compared to other sampling months. This could be attributed to high surface runoff due to heavy rainfall events recorded in January 2014. The concentration of Al exceeds the threshold value by DWAF for domestic water use (0.15 mg/L) and the protection of aquatic ecosystem (0.005 mg/L) [27]. It also exceeds the health-based value of 0.9 mg/L established by WHO for Al [26]. However, the DWAF guideline of 5 mg/L for water use in irrigation was only exceeded in January [27]. A high concentration of Al is known to be neurotoxic and plays a considerable role in Alzheimer’s disease [28,29].
Table 2. Trace metal contamination of Mvudi River.
Trace Metals Concentration (mg/L)Sampling Months
JanuaryFebruaryMarchAprilMayJune
Al9.644 ± 41.492 ± 1.31.010 ± 0.241.566 ± 0.452.811 ± 0.782.083 ± 1.19
Cd0.0003 ± 0.0030.002 ± 0.00010.001 ± 0.00010.0004 ± 0.0020.0012 ± 0.0030.001 ± 0.001
Cr0.357 ± 0.080.281 ± 0.050.246 ± 0.040.259 ± 0.010.344 ± 0.090.015 ± 0.02
Cu0.185 ± 0.260.068 ± 0.060.024 ± 0.010.039 ± 0.010.043 ± 0.010.0463 ± 0.03
Fe2.161 ± 0.850.807 ± 0.330.9197 ± 0.960.755 ± 0.202.645 ± 1.360.702 ± 0.23
Mn0.107 ± 0.020.081 ± 0.080.2133 ± 0.040.281 ± 0.090.5207 ± 0.120.256 ± 0.21
Pb0.014 ± 0.020.023 ± 0.050.002 ± 00.011 ± 0.010.042 ± 0.030.01 ± 0.01
Zn0.261 ± 0.210.1012 ± 0.070.052 ± 0.030.065 ± 0.020.179 ± 0.10.031 ± 0.03
* Cd* 0.142 ± 0.04* 2.189 ± 0.89* 0.17 ± 0.01bdlbdlbdl
* Cd is the concentration of cadmium (mg/kg) determined in the sediment samples; bdl refers to below the detection limit.
Cd is a non-essential element and is highly toxic to marine and freshwater aquatic life. The experimental data of Cd obtained in this study (Table 2) did not comply with the DWAF standard for the protection of aquatic life (1.5 × 10⁻⁴ mg/L), but complied with WHO (0.003 mg/L) and DWAF (0.005 mg/L) value for Cd in drinking and domestic water, respectively [26,27]. The DWAF and WHO both have the same guideline value of 0.05 mg/L for Cr in drinking and domestic water [26,27]. Cr concentrations in the river water (Table 2) failed to comply with the set guideline for all of the sampling months, except in March (0.015 mg/L). The DWAF guideline for the protection of aquatic life (0.007 mg/L) was also exceeded throughout the sampling months. Cu is only potentially hazardous when present at elevated levels in environmental media [28]. The levels of Cu determined only exceeded the DWAF guideline for the protection of aquatic life in freshwater sources (3 × 10⁻⁴ mg/L), but complied with both DWAF (1 mg/L) and WHO (2 mg/L) guidelines for domestic water use.
Fe is an essential metal for most living organisms and humans. It is a constituent of proteins and many enzymes, including hemoglobin and myoglobin [30,31]. It is usually more abundant in freshwater environment than other metals, due to its high occurrence on Earth [32]. Fe deficiency can lead to anemia and fatigue, which are usually common among children under the age of five, pregnant women and immunocompromised individuals, thus making them vulnerable to numerous infections [33]. The use of Fe-rich water for domestic purposes, such as drinking and washing, is usually associated with unpleasant metallic taste and staining of clothes. Hemochromatosis, a genetic disorder, has been reported to be the consequence of consuming large amounts of Fe. The United States Environmental Protection Agency (U.S. EPA) argued that the consumption of water with a high Fe concentration does not necessarily lead to any negative health effect, because the acquisition of elevated concentration of Fe in humans is basically through the consumption of Fe-rich foods [34]. WHO do not have a guideline for Fe in drinking water, but the guideline value of DWAF is 0.1 mg/L, and that of the U.S. EPA is 0.3 mg/L [27,34]. These guidelines were exceeded throughout the sampling period. Vuori [35] reported that Fe has both direct and indirect effects on river ecosystems, as it affects lotic organisms by interfering with their normal metabolism and osmoregulation. He also noted that combined effects of Fe contamination can reduce the occurrence and diversity of several aquatic organisms, including fish. High Fe concentration together with its precipitate in aquatic ecosystems do have negative effects on the behavior, reproduction and survival of aquatic animals [36,37].
Mn plays several roles in physiological processes in living organisms, including humans. It is a major component of enzymes [38]. In domestic water, Mn can constitute a nuisance if present in a high concentration with a characteristic metallic taste and staining properties [39]. The concentration of Mn varied between 0.081 and 0.5207 mg/L. These concentrations did not comply with the DWAF recommended limit of 0.05 mg/L and 0.02 mg/L for domestic and irrigation water uses; also, the DWAF guideline for the protection of aquatic life (0.18 mg/L) was exceeded for all of the sampling months, except February [27]. The levels of Mn determined in this study exceeded those reported by He et al. [40]. Mn concentrations in the range of 0.24–0.35 mg/L can lead to memory lapses in children. Similar findings have also reported decreased concentration and attentiveness in classes by children who drink water with a high Mn concentration [41,42]. Neurotoxicity has been implicated for adults over 50 years who drink Mn-rich water [43]. Mn usually affects the brain and the central nervous system, causing impaired neurological and neuromuscular control, among other symptoms [44].
Pb is both a toxic and non-essential metal having no nutritional value to living organisms. No amount of Pb is considered safe in drinking water. The concentrations of Pb in the river water exceeded DWAF guidelines for the protection of aquatic ecosystem (2 × 10⁻⁴ mg/L) and the DWAF and WHO guideline of 0.01 mg/L for domestic water use [26,28] in January (0.014 mg/L), February (0.023 mg/L), April (0.011 mg/L) and May (0.042 mg/L), but complied in March (0.002 mg/L). The value obtained in June was the same as the benchmark value (0.01 mg/L). A high concentration of Pb is known to impair the proper functioning of the reproductive and nervous systems of humans. Kidney damage, high blood pressure and anemia are consequences of Pb poisoning [26,45]. Even at very low concentrations, Pb is a threat to public health, because it usually builds up in the body. It is essentially harmful to children under the age of six and causes mental and physical retardation [46,47].
Zn is of biological importance having many physiological functions in living organisms [48]. It has an adverse effect on man and other organisms when deficient or present in an excessive amount and thus affects most metabolic processes [48]. The levels of Zn found (Table 2) throughout the sampling period complied with the DWAF recommended limit of 3 mg/L for domestic water use [27], but exceeded the guideline on the protection of aquatic life (0.002 mg/L). Comparisons between the levels of trace metals determined in this study and those reported for other rivers in South Africa are presented in Table 3.
Table 3. Comparisons of trace metals contamination of some rivers in South Africa.
Trace Metals (mg/L)Dzindi River [3]Umtata River, [49]Plankenburg River [50]Diep River, [50]Mvudi River
(This Study)
Fe0.80–1.700.10–4.470.3–480.2–5130.425–5.07
Al0.20–0.400.22–0.360.3–13.6bdl–40.393–13.81
Mn0.05–0.200.16–2.04bdl–0.4bdl–1.30.029–0.675
Zn0.05–0.230.07–0.12bdl–1.10.1–4.40.001–0.548
Cr0.03–0.10nanana0.012–0.593
Cu0.03–0.070.1–0.530.3–2.20.1–0.60.011–0.567
Pb0.01–0.050.24–1.11nanabdl–0.046
Cdna0.01–0.26nana0.0002–0.0043
na = no available data; bdl = below detection limit.

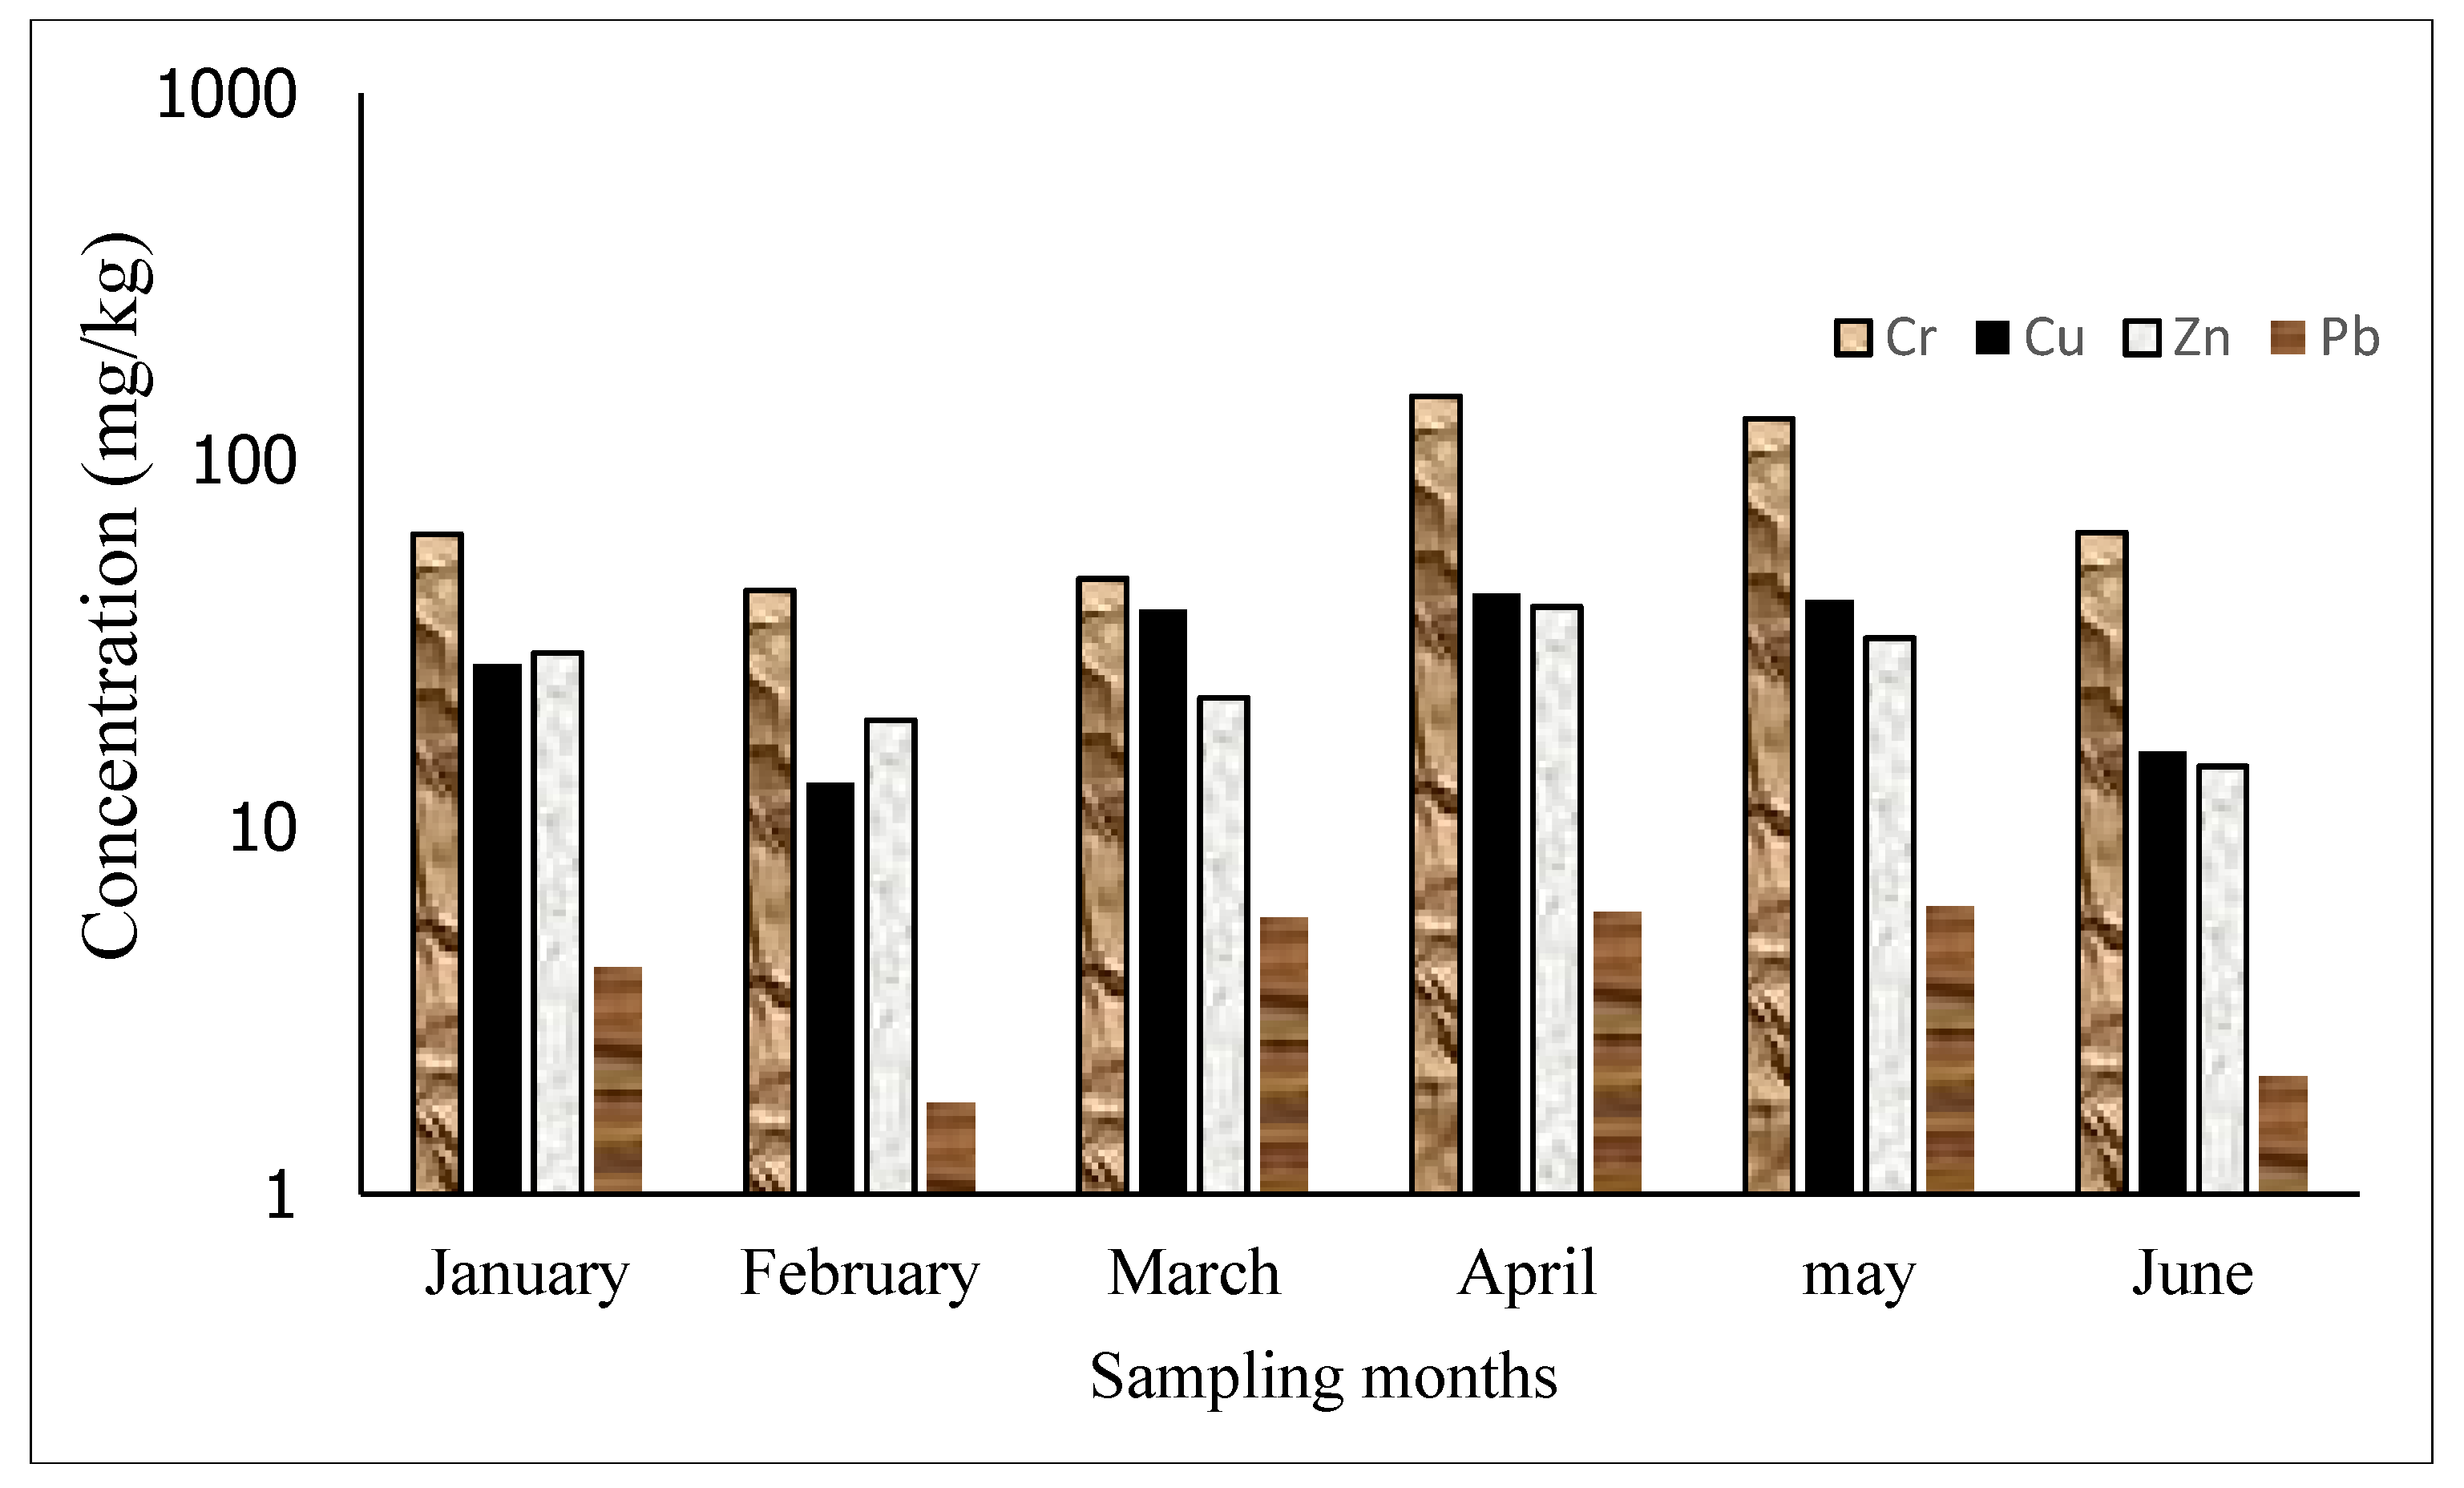
3.3. Trace Metals in Sediments of Mvudi River

Two sediment quality guidelines (SQGs) (Table 4) reported by Long et al. [51] for marine water and estuarine sediments and that of the Canadian Council of Ministers of the Environment (CCME) [52] for freshwater sediments were used to describe the possible toxicity levels of heavy metals in this study.
Table 4. Sediment quality guidelines. CCME, Canadian Council of Ministers of the Environment.
Trace Metals (mg/kg, Dry Weight)Long et al. [51]CCME [52]
ERLERMTELPEL
Alnananana
Cd1.29.60.63.5
Cr8137037.390
Cu3427035.7197
Fenananana
Mnnananana
Pb46.72183591.3
Zn150410123315
where na = no available data; ERL= effect range low; ERM = effect range medium; TEL = threshold effect level; PEL = probable effect level.
ERL (effect range low) and TEL (threshold effect level) represent concentrations below which a toxic effect on aquatic organisms will rarely occur, while ERM (effect range medium) and PEL (probable effect level) refer to concentration levels above which adverse effects frequently occur [51,53]. The concentrations in between ERL and ERM and TEL and PEL, represent values within which adverse effects will likely occur [51,53]. The average monthly concentrations of Al, Fe and Mn varied between 4296 and 5557 mg/kg, 3840 and 6982 mg/kg and 279 and 1638 mg/kg, respectively (Figure 2), and differ significantly (p < 0.01) with their levels in the river water. They are often not considered to have adverse effects on marine organisms, hence their exclusion from the SQGs.
Figure 2. Average trace metals concentration of Al, Fe and Mn in the sediments of Mvudi River.
Sustainability 08 00135 g002
The average monthly concentrations of Cd varied between non-detectable limit to 2.189 mg/kg (Table 2). The ERL and TEL SQGs were only exceeded in February and indicate an occasional toxic effect on aquatic organisms. A high concentration of Cd was only observed during the wet season, which could be attributed to high runoffs from agricultural and semi-industrial lands, landfill sites and the discharge of ill-treated wastewater effluents, which are characteristic of the study area, into the river [31]. The levels of Cd in sediments did not vary significantly (p > 0.05) with its level in the river waters.
The average monthly concentrations of Cr in the sediments ranged between 44.227 and 149.52 mg/kg (Figure 3). These values exceeded the threshold effect level of CCME SQGs for freshwater sediments [52] throughout the sampling period. They also exceeded the probable effect level of the same guideline in April (149.5 mg/kg) and May (130 mg/kg). Conversely, the determined data were lower than the effect range medium reported by Long et al. [51] for the sampling period, but only exceeded it in April and May, implying that Cr could possibly have adverse effects on aquatic organisms present in this ecosystem. Cu average monthly concentrations in the sediments of Mvudi River were lower than ERL and TEL values for the months of January (27.9 mg/kg), February (13.22 mg/kg) and June (16.06 mg/kg). In April (42.32 mg/kg) and May (41.44 mg/kg), the concentrations of Cu determined lie between the ERL and ERM values. An unusually high concentration of Cu was determined in March (1027 mg/kg), which exceeded both ERM and PEL values. These results indicate the possibility of occasional adverse effects on aquatic organisms. Pb (1.775–4.157 mg/kg) and Zn (14.481–39.88 mg/kg) average monthly concentrations were lower than ERL and TEL of both SQGs, which strongly suggest that no toxic effects on aquatic organisms is likely to occur.
Figure 3. Average trace metals concentration of Cr, Cu, Zn and Pb in the sediments of Mvudi River.
Sustainability 08 00135 g003

3.4. Possible Sources of Pollution to Mvudi River

Odiyo et al. [21] implicated emissions from cars and poor waste disposal practices as major sources of trace metals contamination to Mvudi River and other rivers around Thohoyandou. Edokpayi et al. [22] reported that Thohoyandou wastewater treatment plant is currently inefficient in reducing the levels of trace metals in wastewater it receives to the recommended discharge guidelines and therefore, discharges metal rich effluents into Mvudi River. The studies of Makhera et al. [54], Chimuka et al. [55] and Okonkwo et al. [56] also established that runoffs from agricultural lands, waste disposal sites, untreated wastewater and wastewater effluents contribute immensely to the pollution load of Mvudi River. The distribution ranges of trace metals in water and sediments of Mvudi River within six months of sampling is presented in Table 5.
Table 5. Distribution of trace metals’ concentrations along the water (mg/L) and sediments (mg/kg) of Mvudi River from January–June 2014.
AlCdCrCuFeMnPbZn
January5.943–13.810.0012–0.00540.175–0.5930.038–0.5671.281–2.7400.091–0.1330.002–0.0460.090–0.548
(4860–9090)(bdl–0.142)(54.96–69.28)(18.83–35.46)(4900–5480)(353–740)(2.12–8.37)(16.10–39.46)
February0.093–4.0180.0014–0.00430.202–0.3400.020–0.1670.539–1.4160.029–0.213bdl–0.1320.037–0.230
(3960–4900)(bdl–2.189)(31.96–52.48)(7.68–18.05)(2900–4540)(160–535)(1.25–2.27)(9.81–32.16)
March0.625–1.1330.0009–0.00110.177–0.2900.019–0.0320.831–1.0890.164–0.263bdl–0.0090.041–0.06
(4080–5860)(bdl–0.233)(35.70–65.06)(9.49–5690)(2960–4740)(166–408)(1.17–4.16)(9.78–1524)
April0.976–2.2490.0003–0.00060.013–0.0360.019–0.0480.536–1.0160.163–0.4350.0074–0.0170.017–0.086
(4120–5180)(bdl)(121–175)(23.50–73.66)(6200–7460)(558–2140)(3.83–7.24)(19.61–50.12)
May2.105–4.1340.0003–0.0019 0.250–0.4620.027–0.0571.168–5.0680.391–0.6750.006–0.0140.108–0.375
(4320–4600)(bdl)(109–173)(33.38–48.90)(6000–6540)(1352–2160)(5.50–7.95)(22.54–16.72)
June1.227–4.3880.0002–0.00140.012–0.0180.011–0.1000.425–1.0010.087–0.6710.0012–0.0180.01–0.085
(4120–4480)(bdl)(57.86–70.16)(14.54–17.37)(4900–5160)(578–1300)(1.78–2.24)(12.17–18.34)
The values in parenthesis are for the sediment concentrations; bdl represents below detection limit.

3.5. Effect of Seasonal Variation on Trace Metals Level in Mvudi River

Trace metals level in water bodies can be influenced by changes in the weather condition of a river catchment and the water chemistry. During the wet season, the two important weather-related factors that can lead to variations in trace metals levels in rivers are surface runoffs from various land use activities in the catchment, such as settlements, dumpsites, agriculture and dilution due to high precipitation. In the dry season, the major factor is evaporation from water bodies, which can lead to an increase in the concentrations of contaminants as the dilution factor is removed. In the sediments of Mvudi Rivers, higher levels of trace metals were determined in the dry season, except for Al (Table 6), and can be attributed to evaporation effects. However, there is no significant difference (p > 0.05) in the levels of trace metals determined in both seasons, except for Fe and Mn (p < 0.05). A different trend was observed for the water samples; the concentrations of trace metals were higher in the wet season than in the dry season with the exception of Fe, Mn and Pb. The difference in the means of the trace metals did not vary significantly (p > 0.05) in both seasons.
Table 6. Mean and p-values of trace metals’ concentration in water (mg/L) and sediments (mg/kg) of Mvudi River in the wet and the dry seasons.
AlCdCrCuFeMnPbZn
Wet4.0490.00110.2950.0921.2960.1340.0130.138
(4697)(51.59)(26.80)(4371)(405)(3.87)(24.01)
Dry2.1530.00090.2060.0411.3670.3230.0220.085
(4533)(144)(33.68)(6117)(1369)(4.69)(29.11)
p-value0.6020.4990.4060.4260.9470.2020.2870.601
(0.132)(0.115)(0.701)(0.036)(0.044)(0.757)(0.518)
The values in parenthesis are for the sediments’ concentrations.

4. Conclusions

The average monthly concentration of trace metals in Mvudi River decreased in the order Fe > Al > Mn > Cu > Cr > Zn > Pb > Cd. The concentrations of Fe and Al were the highest determined in both water and sediments of Mvudi River and this could be due to their relative abundance in the Earth’s crust. The sources of pollution for this river could be due to the release of partially-treated wastewater effluents from Thohoyandou wastewater treatment plant, runoffs from agricultural soil, landfill sites very close to the river and other non-point sources, like atmospheric deposition. Cd, Cr and Cu concentrations in the sediments could possibly lead to toxic effects on aquatic organisms in the river, while the concentrations of Pb and Zn are not likely to pose any adverse effects on them. The levels of metals in the river water differ significantly from their levels in the sediments, except for Cd.

Acknowledgments

The authors acknowledge the financial support received from the Research and Publication Committee (RPC) of the University of Venda.

Author Contributions

All of the authors conceptualize the research idea. Joshua Edokpayi did the sampling, analytical and statistical analyses. John Odiyo, Elizabeth Popoola and Titus Msagati contributed immensely to the final write up and editing of the manuscript

Conflicts of Interest

The authors declare no conflict of interest.

References

  1. Fobosi, S. Rural Areas in the Eastern Cape Province, South Africa: The Right to Access Safe Drinking Water and Sanitation Denied? 2013. Available online: http://www.consultancyafrica.com/index.php?option=com_content&view=article&id=1198:rural-areas-in-the-eastern-cape-province-south-africa-the-right-to-access-safe-drinking-water-and-sanitation-denied-&catid=91:rights-in-focus&Itemid=296 (accessed on 20 April 2015).
  2. Heleba, S. Access to sufficient water in South Africa: How far have we come? Law, Dev. Democracy 2012, 15, 244–278. [Google Scholar] [CrossRef]
  3. Edokpayi, J.N.; Odiyo, J.O.; Olasoji, S.O. Assessment of heavy metal contamination of Dzindi River, in Limpopo Province, South Africa. Int. J. Nat. Sci. Res. 2014, 2, 185–194. [Google Scholar]
  4. Mohiuddin, K.M.; Ogawa, Y.; Zakir, H.M.; Otomo, K.; Shikazono, N. Heavy metals contamination in water and sediments of an urban river in a developing country. Int. J. Environ. Sci. Technol. 2011, 4, 723–736. [Google Scholar] [CrossRef]
  5. Samarghandi, M.; Nouri, J.; Mesdaghinia, A.R.; Mahvi, A.H.; Nasseri, S.; Vaezi, F. Efficiency Removal of Phenol, Lead and Cadmium by Means of UV/TiO2/H2O2 Processes. Int. J. Environ. Sci. Technol. 2007, 4, 19–26. [Google Scholar] [CrossRef]
  6. Song, M.; Chu, S.; Letcher, R.J.; Seth, R. Fate, partitioning, and mass loading of polybrominated diphenyl ethers (PBDEs) during the treatment processing of municipal sewage. Environ. Sci. Technol. 2006, 40, 6241–6246. [Google Scholar] [CrossRef] [PubMed]
  7. Vergas, V.M.F.; Migliavacca, S.B.; De Melo, A.C.; Horn, R.C.; Guidobono, R.R.; De Sa Ferreira, I.C.F.; Pestana, M.H.D. Genotoxicity assessment in aquatic environments under the influence of heavy metals and organic contaminants. Mutat. Res. 2001, 490, 141–158. [Google Scholar] [CrossRef]
  8. Ahmad, J.U.; Goni, M.A. Heavy metal contamination in water, soil, and vegetables of the industrial areas in Dhaka, Bangladesh. Environ. Monit. Assess. 2010, 166, 347–357. [Google Scholar] [CrossRef] [PubMed]
  9. Duruibe, J.O.; Ogwuegbu, M.O.C.; Egwurugwu, J.N. Heavy metal pollution and human biotoxic effects. Int. J. Phys. Sci. 2007, 2, 112–118. [Google Scholar]
  10. du Preez, H.H.; Steyn, G.J. A preliminary investigation of the concentration of selected metals in the tissues and organs of the tigerfish (Hydrocynus vittatus) from the Olifants River, Kruger National Park, South Africa. Water SA. 1992, 18, 131–136. [Google Scholar]
  11. Wepener, V.; van Vuren, J.H.J.; du Preez, H.H. Uptake and distribution of a copper, iron and zinc mixture in gill, liver and plasma of a freshwater teleost, Tilapia sparrmanii. Water SA. 2001, 27, 99–108. [Google Scholar] [CrossRef]
  12. Water Research Commission. Water and the environment. Water Wheel 2014, 13, 8–14. [Google Scholar]
  13. Jadia, C.D.; Fulekar, M.H. Phytoremediation of heavy metals: Recent techniques. Afr. J. Biotechnol. 2009, 8, 921–928. [Google Scholar]
  14. Sardar, K.; Ali, S.; Hameed, S.; Afzal, S.; Fatima, S.; Shakoor, M.B.; Bharwana, S.A.; Tauqeer, H.M. Heavy Metals Contamination and what are the Impacts on Living Organisms. Greener J. Environ. Manage. Public Safety 2013, 2, 172–179. [Google Scholar]
  15. Iqbal, M.A.; Gupta, S.G. Studies on Heavy Metal Ion Pollution of Ground Water Sources as an Effect of Municipal Solid Waste Dumping. Afr. J. Basic Appl. Sci. 2009, 1, 117–122. [Google Scholar]
  16. Varol, M.; Sen, B. Assessment of nutrient and heavy metal contamination in surface water and sediments of the upper Tigris River, Turkey. Catena 2012, 92, 1–12. [Google Scholar] [CrossRef]
  17. Jarup, L. Hazards of heavy metal contamination. Br. Med. Bull. 2003, 68, 67–182. [Google Scholar] [CrossRef]
  18. Mzezewa, J.; Misi, T.; van Rensburg, L.D. Characterisation of rainfall at a semi-arid ecotope in the Limpopo Province (South Africa) and its implications for sustainable crop production. Water SA 2010, 36, 19–26. [Google Scholar] [CrossRef]
  19. Edokpayi, J.N.; Odiyo, J.O.; Msagati, T.A.; Potgieter, N. Temporal Variations in Physico-Chemical and Microbiological Characteristics of Mvudi River, South Africa. Int. J. Environ. Res. Public Health 2015, 12, 4128–4140. [Google Scholar] [CrossRef] [PubMed]
  20. Odiyo, J.O.; Phangisa, J.I.; Makungo, R. Rainfall–runoff modelling for estimating Latonyanda River flow contributions to Luvuvhu River downstream of Albasini Dam. Phys. Chem. Earth 2012, 50–52, 5–13. [Google Scholar] [CrossRef]
  21. Odiyo, J.O.; Bapela, H.M.; Mugwedi, R.; Chimuka, L. Metals in environmental media: A study of trace and platinum group metals in Thohoyandou, South Africa. Water SA 2005, 31, 581–588. [Google Scholar]
  22. Edokpayi, J.N.; Odiyo, J.O.; Msagati, T.A.M.; Popoola, E.O. Removal Efficiency of Faecal Indicator Organisms, Nutrients and Heavy Metals from a Peri-Urban Wastewater Treatment Plant in Thohoyandou, Limpopo Province, South Africa. Int. J. Environ. Res. Public Health 2015, 12, 7300–7320. [Google Scholar] [CrossRef] [PubMed]
  23. US EPA. Acid Digestion of Sediments, Sludges, and Soils Method 3050B. Available online: http://www.epa.gov/osw/hazard/testmethods/sw846/pdfs/3050b.pdf (accessed on 21 March 2013).
  24. US EPA. Method 200.7. Determination of Metals and Trace Elements in Water and Wastes by Inductively Coupled Plasma-Atomic Emission Spectrometry Revision 4.4. Methods for the Determination of Metals in Environmental Samples Supplement 1. EPA 600-R-94-111; US Environmental Protection Agency: Cincinnati, OH, USA, 1994; pp. 1–58. [Google Scholar]
  25. DWAF. South African Water Quality Guidelines, vol. 7: Aquatic Ecosystems, 2nd ed.; Department of Water Affairs and Forestry: Pretoria, South Africa, 1996. [Google Scholar]
  26. WHO. Guidelines for Drinking-Water Quality, 4th ed.; WHO: Geneva, Switzerland, 2011; pp. 155–202. [Google Scholar]
  27. DWAF. South African Water Quality Guidelines, vol. 8: Field Guide, 1st ed.; DWAF: Pretoria, South Africa, 1996. [Google Scholar]
  28. Gupta, V.B.; Anitha, S.; Hegde, M.L.; Zecca, L.; Garruto, R.M.; Ravid, R.; Shankar, S.K.; Stein, R.; Shanmugavelu, P.; Jagannatha Rao, K.S. Aluminium in Alzheimer’s disease: are we still at a crossroad? Cell. Mol. Life Sci. 2005, 62, 143–158. [Google Scholar] [CrossRef] [PubMed]
  29. Kawahara, M.; Kato-Negishi, M. Link between Aluminum and the Pathogenesis of Alzheimer’s disease: The Integration of the Aluminum and Amyloid Cascade Hypotheses. Int. J. Alzheimers Dis. 2011. [CrossRef] [PubMed]
  30. Yip, R.; Dallman, P.R. Iron. In Present Knowledge in Nutrition, 7th ed.; Ziegler, E.E., Filer, L.J., Eds.; ILSI Press: Washington DC., USA, 1996; pp. 277–292. [Google Scholar]
  31. Brody, T. Nutritional Biochemistry, 2nd ed.; Academic Press: San Diego, CA, USA, 1999; pp. 697–730. [Google Scholar]
  32. Forstner, U.; Wittmann, G.T.W. Metal Pollution in the Aquatic Environment; Springer-Verlag: Berlin, Germany, 1979. [Google Scholar]
  33. Garvin, K.S. Health Effects of Fe in Drinking Water. Available online: http://www.livestrong.com/article/155098-health-effects-of-iron-in-drinking-water (accessed on 24 November 2015).
  34. American Ground Water Trust. The American Well Owner, 2002. Available online: http://www.agwt.org/content/iron-problems (accessed on 24 November 2015).
  35. Vuori, K.M. Direct and indirect effects of iron on river ecosystems. Ann. Zool. Fennici. 1995, 32, 317–329. [Google Scholar]
  36. Gerhardt, A. Subacute effects of iron (Fe) on Leptophlebia marginata (Insecta: Ephemeroptera). Freshwater Biol. 1992, 27, 79–84. [Google Scholar] [CrossRef]
  37. Smith, E.J.; Sykora, J.L. Early developmental effects of lime-neutralized iron-hydroxide suspensions on brook trout and coho salmon. Trans. Amer. Fish. Soc. 1976, 105, 308–312. [Google Scholar] [CrossRef]
  38. Crossgrove, J.; Zheng, W. Manganese toxicity upon overexposure. NMR Biomed. 2004, 17, 544–553. [Google Scholar] [CrossRef] [PubMed]
  39. Ljung, K.; Vahter, M. Time to Re-evaluate the Guideline Value for Manganese in Drinking Water? Environ. Health Perspect 2007, 115, 1533–1538. [Google Scholar] [CrossRef] [PubMed]
  40. He, P.; Liu, D.H.; Zhang, G.Q. Effects of high-level-manganese sewage irrigation on children’s neurobehavior. Chi. J. Prev. Med. 1994, 28, 216–218. [Google Scholar]
  41. Wasserman, G.A.; Liu, X.; Parvez, F.; Ahsan, H.; Levy, D.; Factor-Litvak, P.; Kline, J.; van Geen, A.; Slavkovich, V.; LoIacono, N.J.; et al. Water manganese exposure and children’s intellectual function in Araihazar, Bangladesh. Environ. Health Perspect. 2006, 114, 124–129. [Google Scholar] [CrossRef] [PubMed]
  42. Woolf, A.; Wright, R.; Amarasiriwardena, C.; Bellinger, D. A child with chronic manganese exposure from drinking water. Environ. Health Perspect. 2002, 110, 613–616. [Google Scholar] [CrossRef] [PubMed]
  43. Kondakis, X.G.; Makris, N.; Leotsinidis, M.; Prinou, M.; Papapetropoulos, T. Possible health effects of high manganese concentration in drinking water. Arch. Environ. Health 1989, 44, 75–178. [Google Scholar] [CrossRef] [PubMed]
  44. Agency for Toxic Substances and Disease Registry. Toxicological Profile for Manganese. 2012. Available online: http://www.atsdr.cdc.gov/toxprofiles/tp151.pdf (accessed on 15 April 2015). [Google Scholar]
  45. Brown, M.J.; Margolis, S. Morbidity and Mortality Weekly Report (MMWR). 2012. Available online: http://www.cdc.gov/mmwr/preview/mmwrhtml/su6104a1.htm? scid=su6104a1_x. (accessed on 15 April 2015). [Google Scholar]
  46. WHO. Water-Related Diseases; Lead Poisoning. Available online: http://www.who.int/water_sanitation_health/diseases/lead/en/ (accessed on 1 May 2015).
  47. Mayo Clinic. Lead Poisoning. 2011. Available online: http://www.mayoclinic.org/diseases-conditions/lead-poisoning/basics/definition/con-20035487 (accessed on 17 April 2015).
  48. Nriagu, J. Zinc Toxicity in Humans. 2007. Available online: http://0-www-extranet-elsevier-com.brum.beds.ac.uk/homepage_about/mrwd/nvrn/Zinc%20Toxicity%20in%20Humans.pdf (accessed on 12 April 2015).
  49. Fatoki, O.S.; Lujiza, N.; Ogunfowokan, A.O. Trace metal pollution in Umtata River. Water SA. 2002, 28, 183–190. [Google Scholar] [CrossRef]
  50. Jackson, V.A.; Paulse, A.N.; Odendaal, J.P.; Khan, W. Investigation into the metal Contamination of the Plankenburg and Diep Rivers, Western Cape, South Africa. Water SA. 2009, 35, 282–299. [Google Scholar]
  51. Long, E.R.; MacDonald, D.D.; Smith, L.; Calder, F.D. Incidence of adverse biological effects within ranges of chemical concentrations in marine and estuarine sediments. Environ. Manage. 1995, 19, 81–97. [Google Scholar] [CrossRef]
  52. Canadian Council of Ministers of the Environment. Canadian Sediment Quality Guidelines for the Protection of Aquatic Life: Summary Tables; Canadian environmental guidelines; Canadian Council of Ministers of the Environment: Winnipeg, MB, Canada, 2001. [Google Scholar]
  53. Long, E.R.; Field, L.J.; MacDonald, D.D. Predicting toxicity in marine sediments with numerical sediment quality guidelines. Environ. Toxicol. Chem. 1998, 17, 714–727. [Google Scholar] [CrossRef]
  54. Makhera, M.; Gumbo, J.R.; Chigayo, K. Monitoring of microcystin-LR in Luvuvhu River catchment: Implications for human health. Afr. J. Biotechnol. 2011, 10, 405–412. [Google Scholar]
  55. Chimuka, L.; Nefale, F.; Masevhe, A. Determination of Phenols in Water Samples using a Supported Liquid Membrane Extraction Probe and Liquid Chromatography with Photodiode Array Detection. S. Afr. J. Chem. 2007, 60, 102–108. [Google Scholar]
  56. Okonkwo, J.O.; Mothiba, M. Physico-chemical characteristics and pollution levels of heavy metals in the rivers in Thohoyandou, South Africa. J. Hydrol. 2005, 308, 122–127. [Google Scholar] [CrossRef]

