
Recent Trends in the World Gas Market: Economical, Geopolitical and Environmental Aspects

Abstract
:1. Introduction
2. The Global Scenario
2.1. Demand
2.2. Production and Reserves
2.3. The Natural Gas Storage
2.4. International Trade
2.5. Future Scenarios
3. Institutional and Economic Aspects
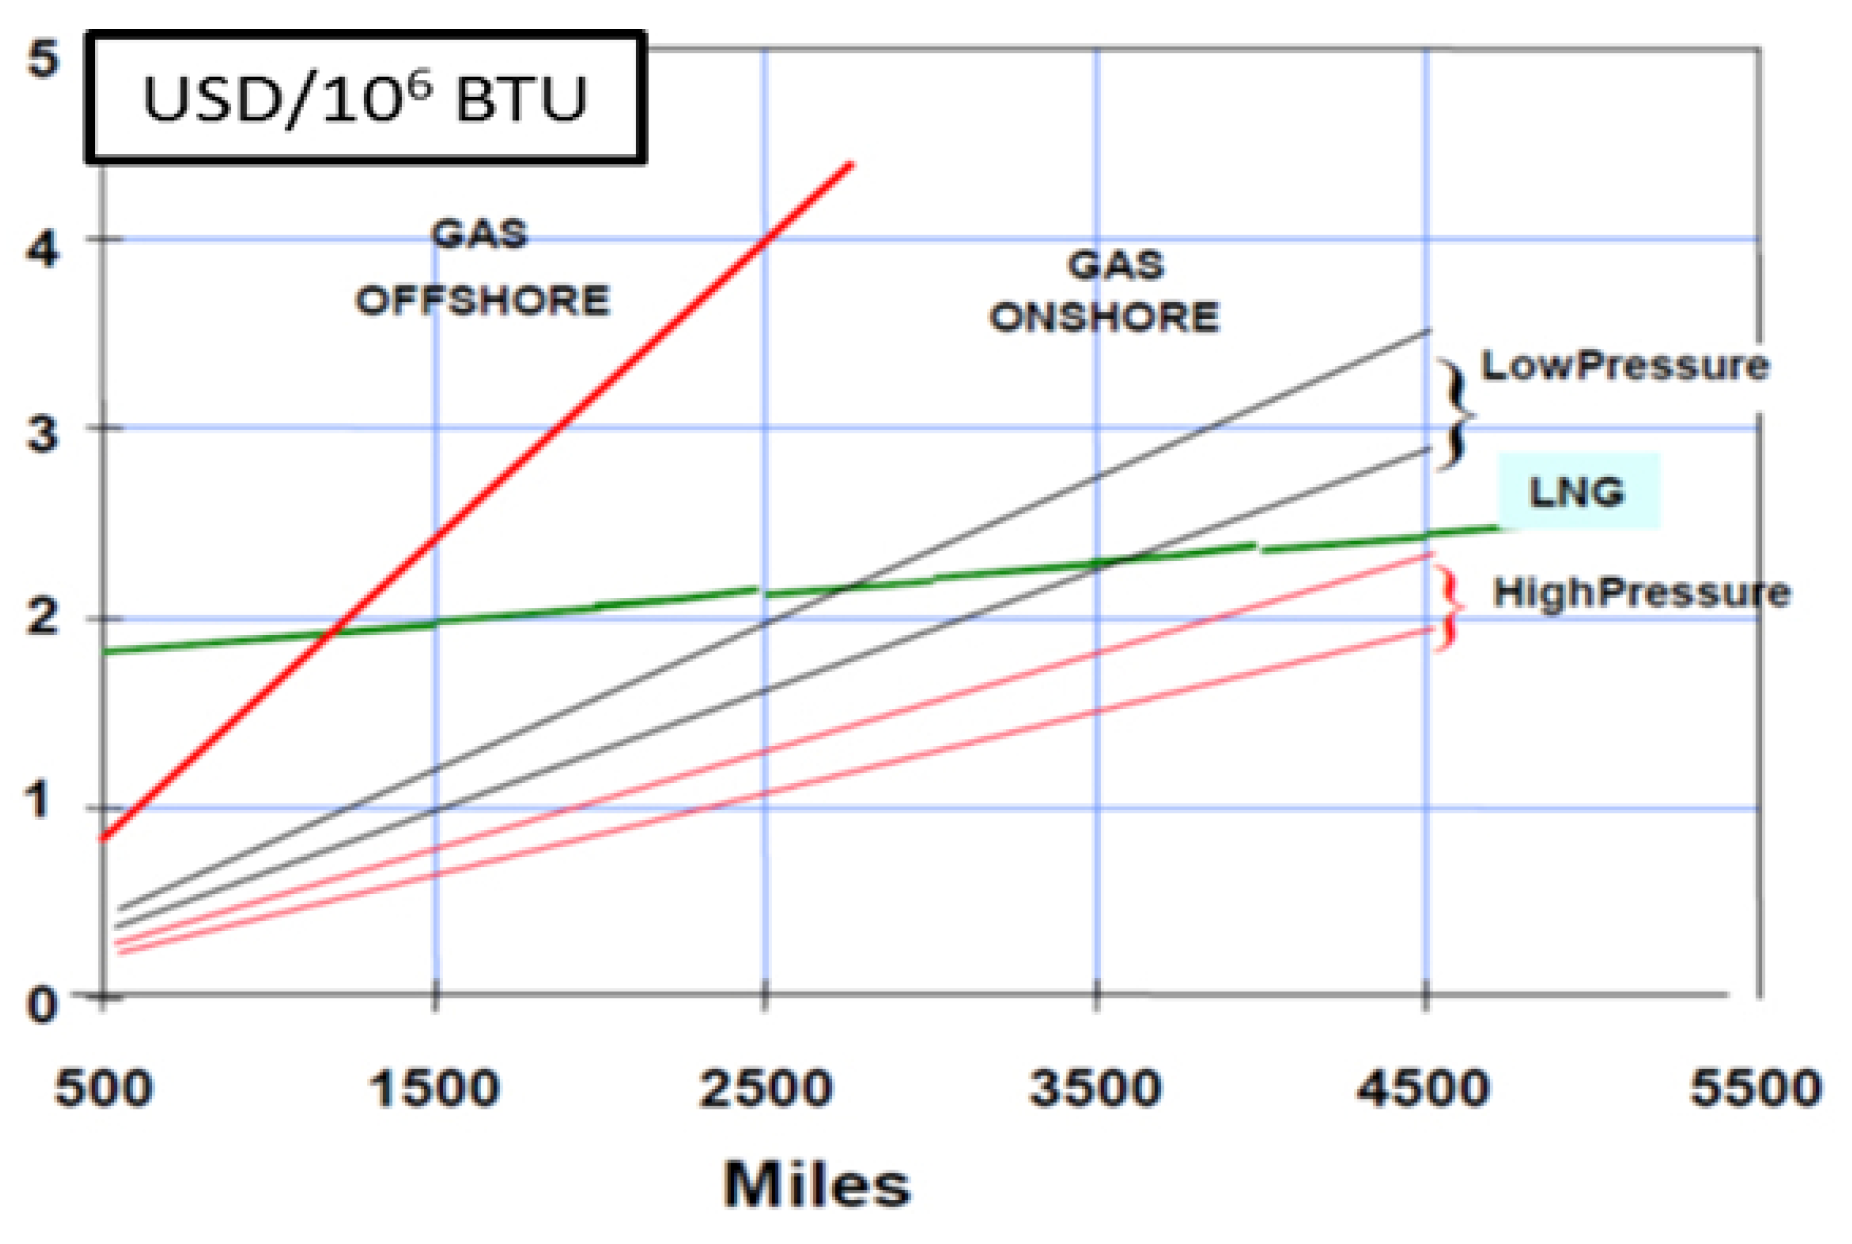
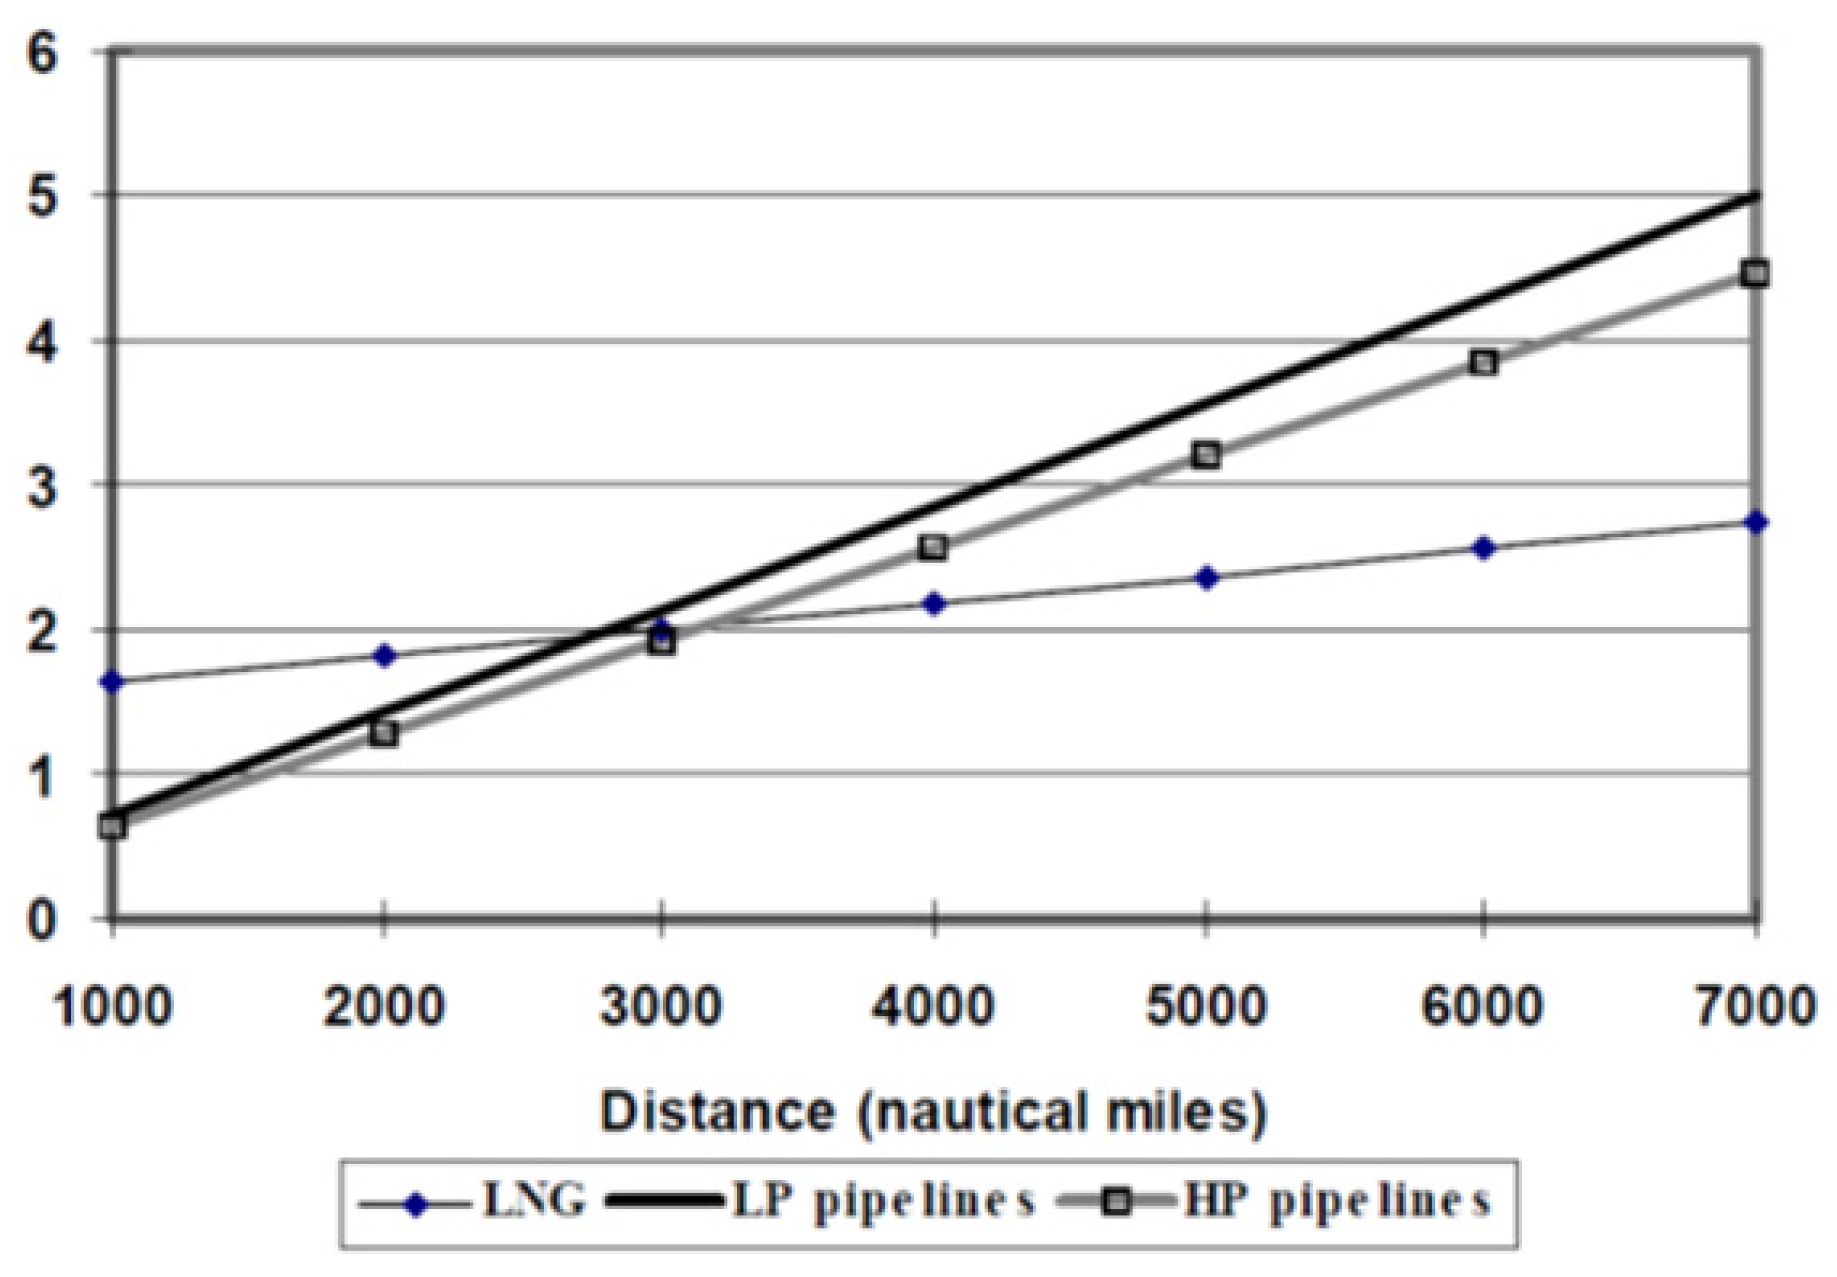
3.1. Natural Gas Production Costs
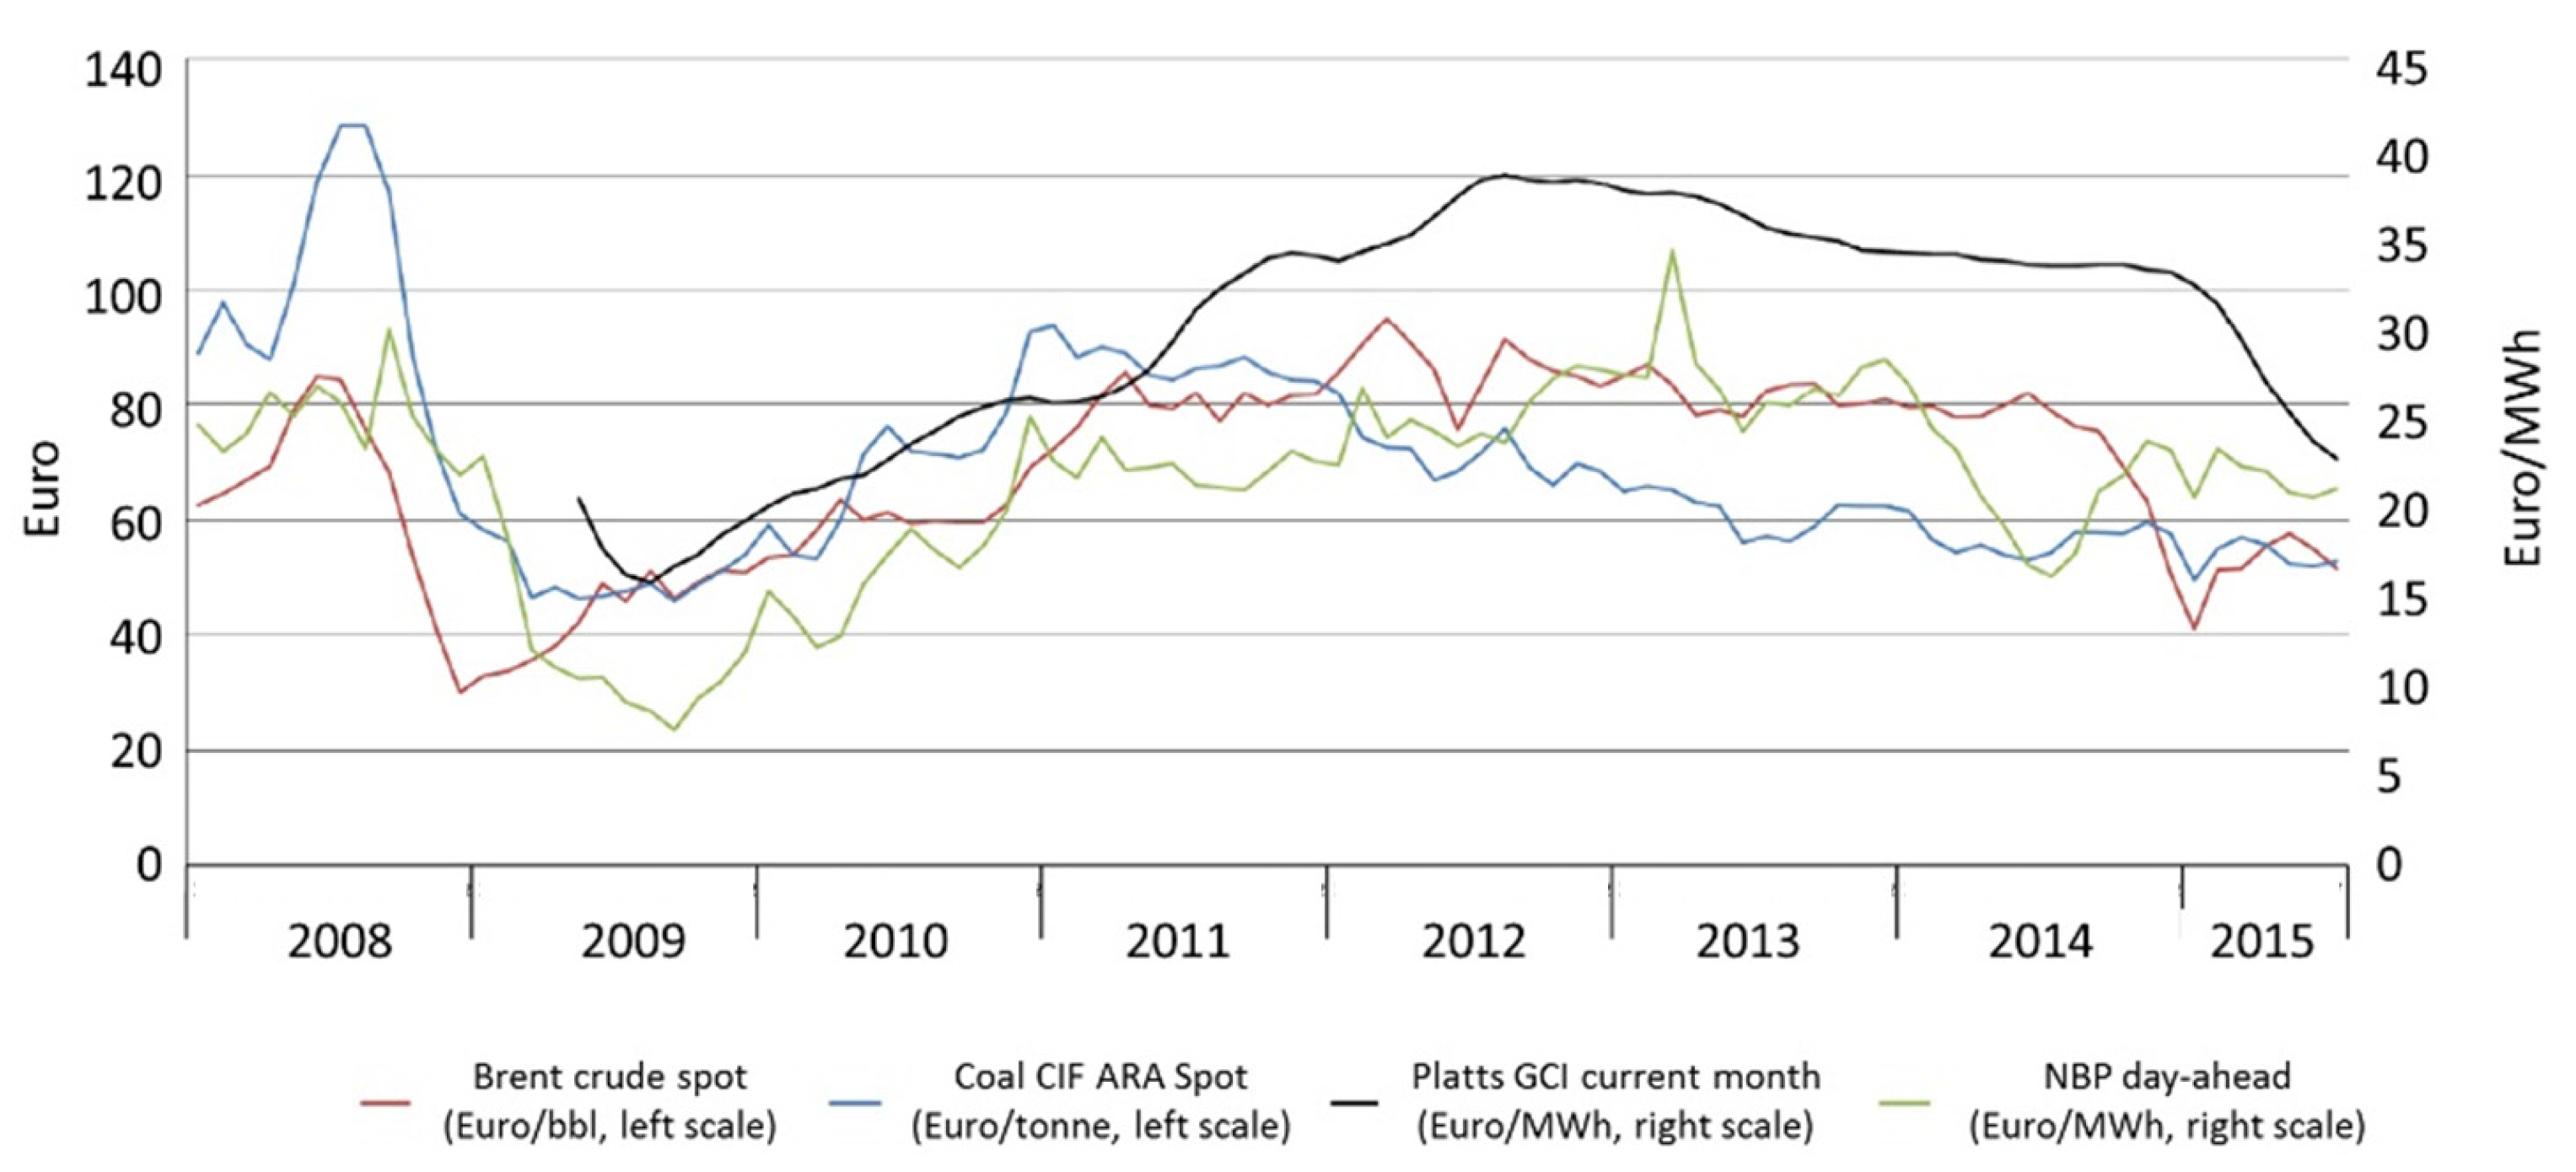
3.2. Natural Gas Market Prices
3.3. Comparison between Oil and Gas
4. Geopolitical Aspects
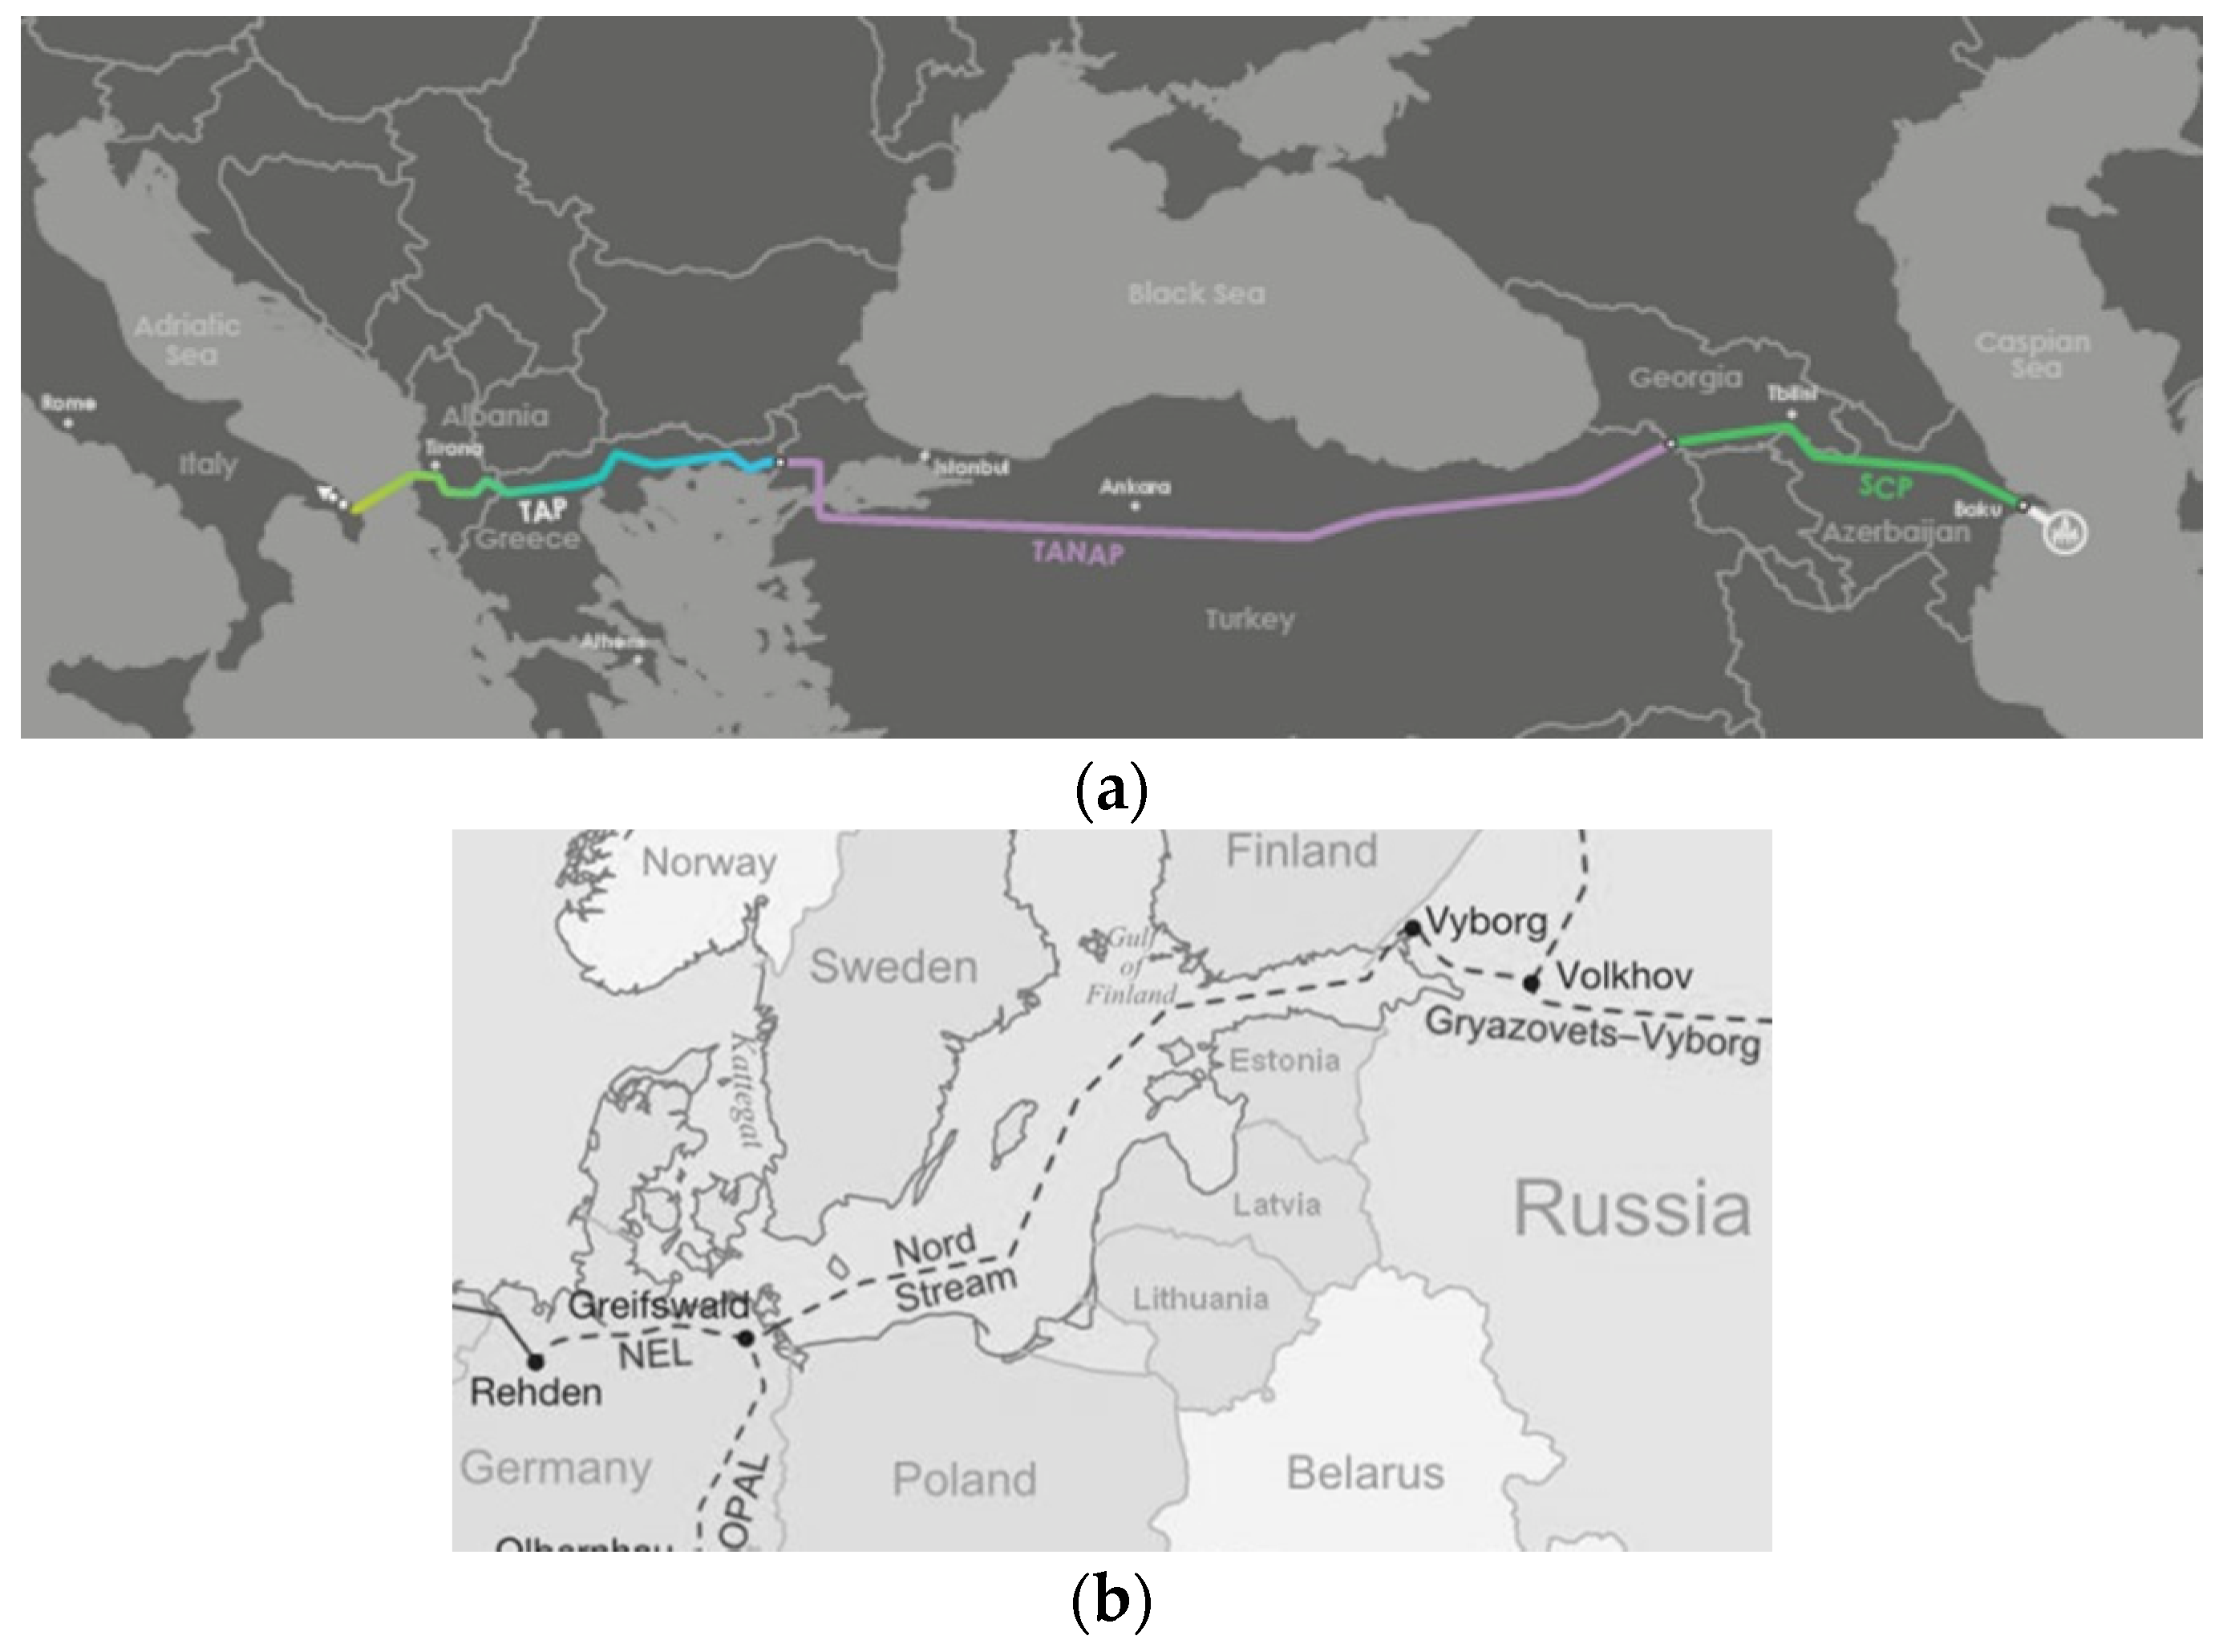
4.1. Relationship between European Union and Russia
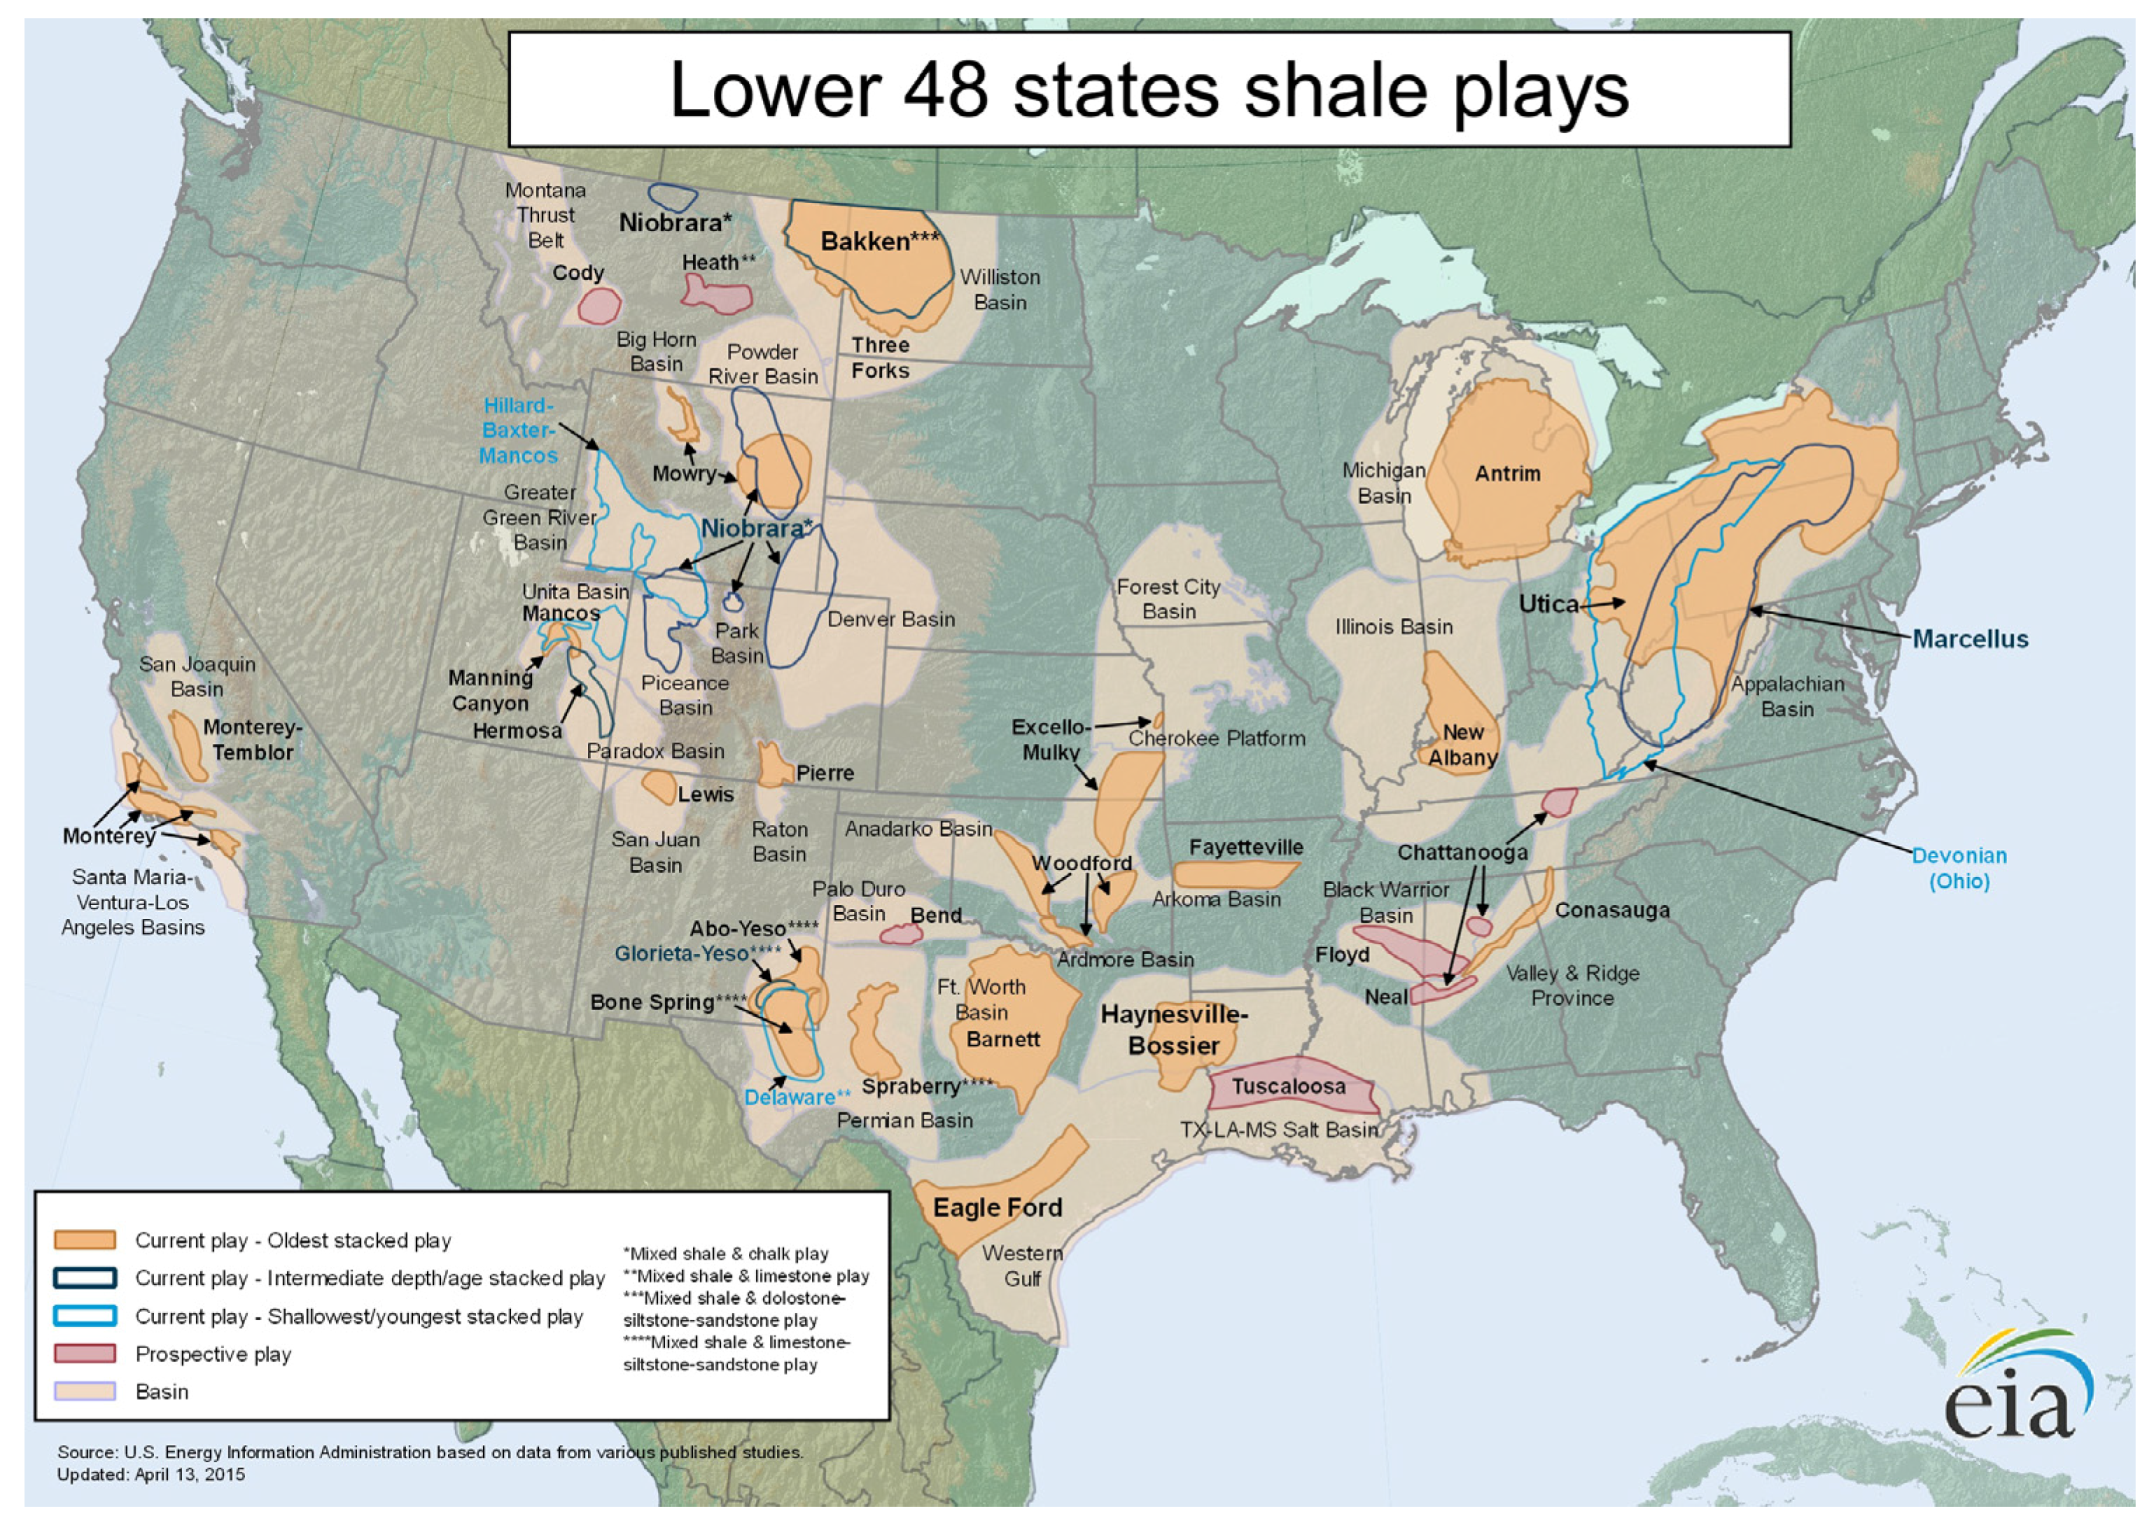
4.2. The American Shale Gas Role
4.3. The Agreement between Russia and China
4.4. The Iranian Impact
5. Environmental Risks and Impacts
5.1. Conventional Gas Extraction
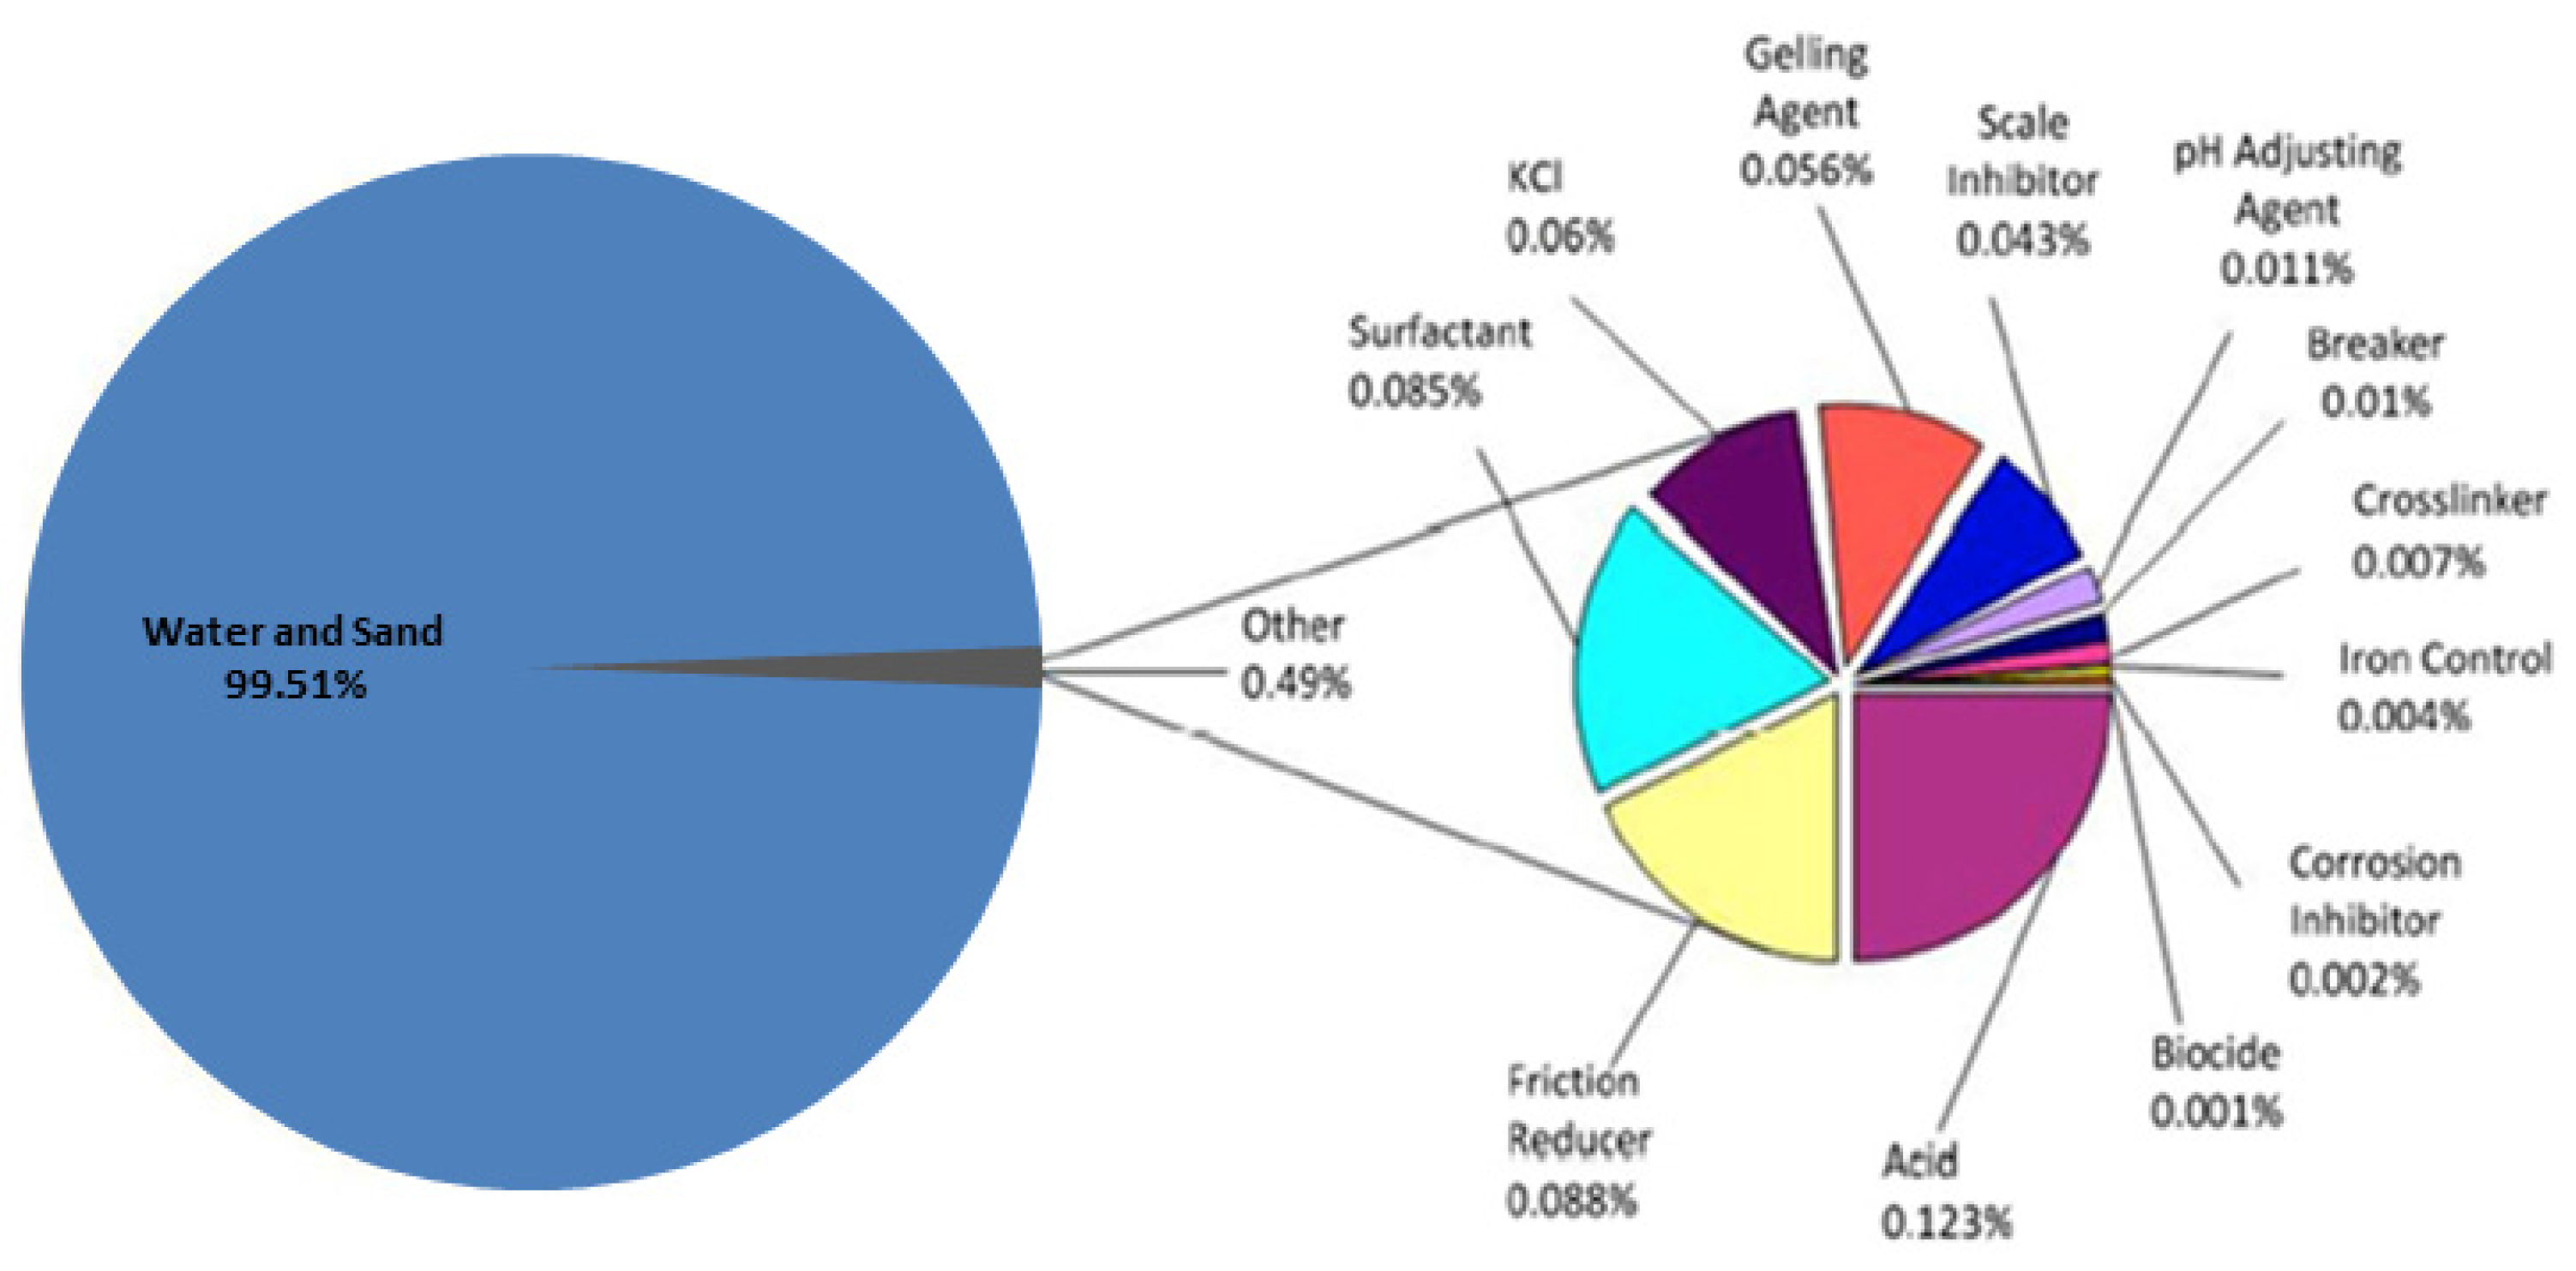
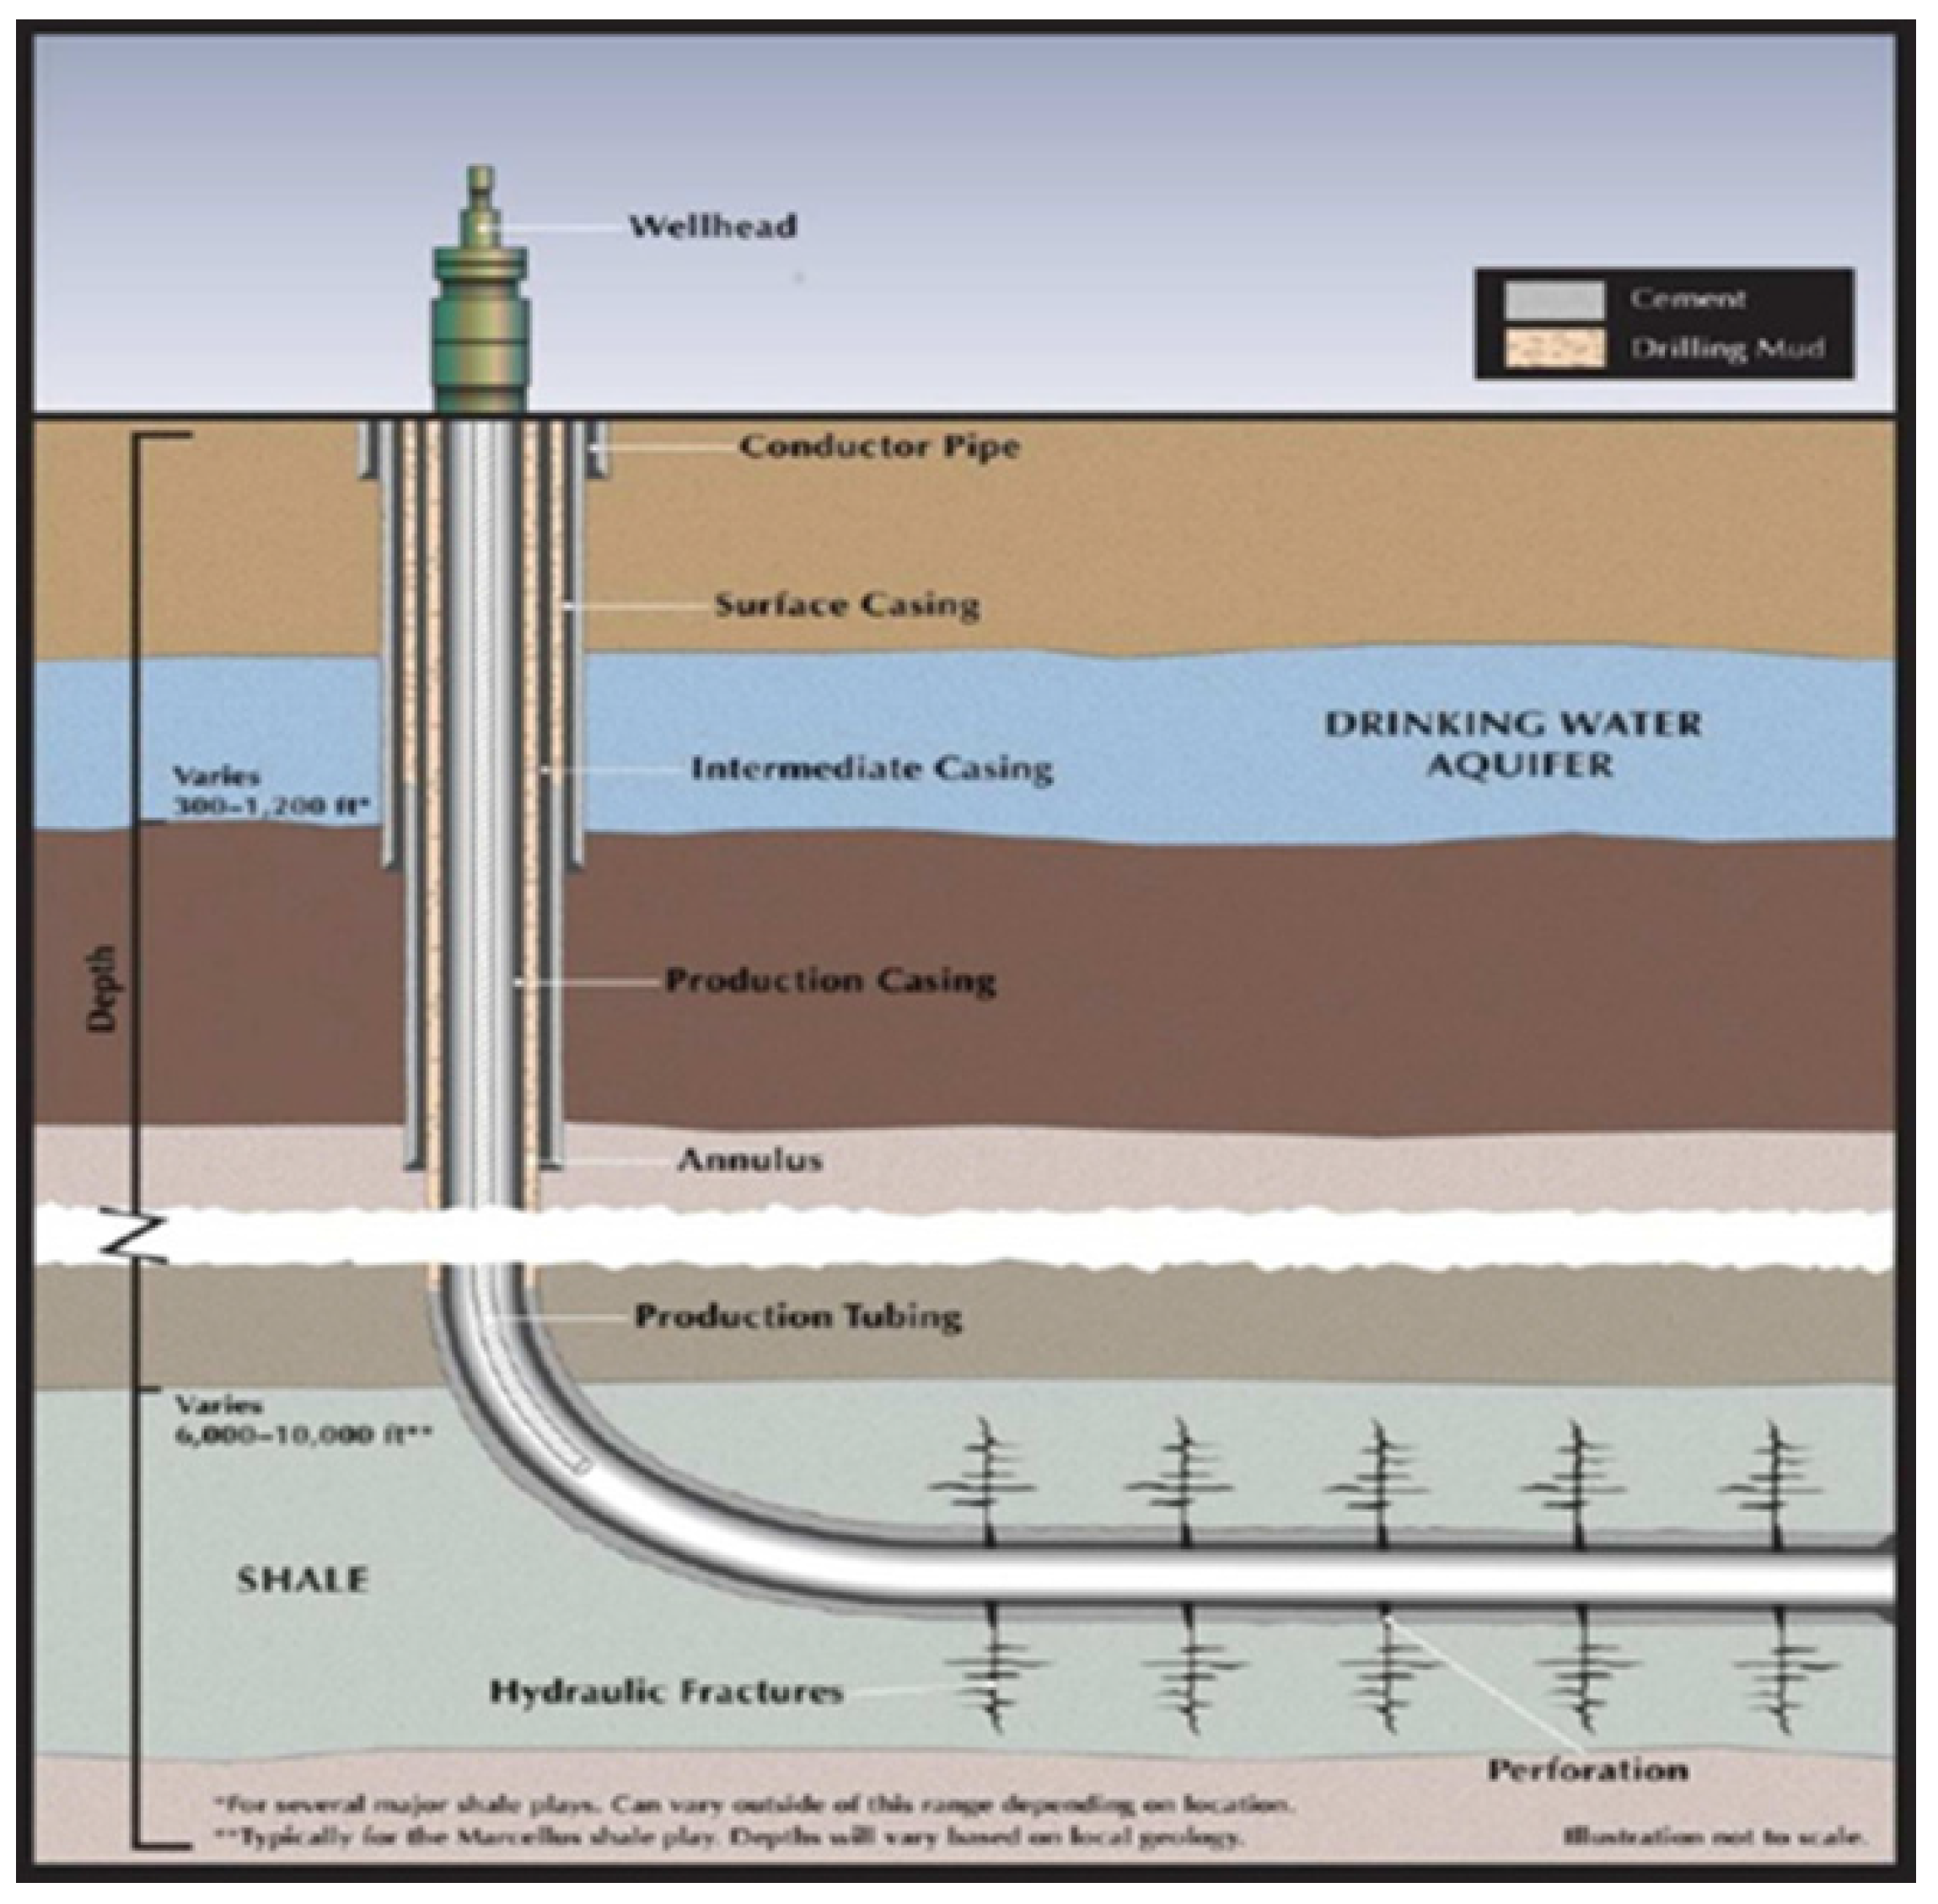
5.2. Unconventional Gas Extraction
5.3. Gas Flaring and Gas Venting
5.4. Transportation
6. Conclusions
- -
- the changing geopolitical scenario due to the role of some specific countries, such as the increasing internal production of the U.S. due to shale gas exploitation;
- -
- the dependence of Europe on Russian gas (the European Commission published its energy security strategy seeking to ensure the energy stability) and the alternative projects to bring gas from Caspian, East Mediterranean, Middle East as well as LNG from various areas;
- -
- the relations between Russia and China and the new role of Iran in the international scenarios, after the end of sanctions;
- -
- the environmental issues due to unconventional gas extraction.
Acknowledgments
Author Contributions
Conflicts of Interest
References
- International Energy Agency. World Energy Outlook 2015; International Energy Agency: Paris, France, 2015. [Google Scholar]
- BP p.l.c. BP Energy Outlook 2035; BP: London, UK, 2015. [Google Scholar]
- Bigerna, S.; Bollino, A.C.; Polinori, P. Marginal cost and congestion in the Italian electricity market: An indirect estimation approach. Energy Policy 2015, 85, 445–454. [Google Scholar] [CrossRef]
- BP. BP Statistical Review of World Energy; BP: London, UK, 2014. [Google Scholar]
- International Energy Agency. World Energy Outlook 2011; International Energy Agency: Paris, France, 2011. [Google Scholar]
- ExxonMobil. The Outlook for Energy: A View to 2040; ExxonMobil: Irving, TX, USA, 2014. [Google Scholar]
- Thomas, S. The Seven Brothers. Energy Policy 2003, 31, 393–403. [Google Scholar] [CrossRef]
- BP. BP Statistical Review of World Energy; BP: London, UK, 2015. [Google Scholar]
- European Commission. Quarterly Report on European Gas Markets Q2 2015; European Commission: Brussel, Belgium, 2015. [Google Scholar]
- The Wall Street Journal. Available online: http://www.wsj.com/articles/SB10001424127887323407104579038682331577924 (accessed on 16 December 2015).
- Nematollahi, O.; Hoghooghi, H.; Rasti, M.; Sedaghat, A. Energy demands and renewable energy resources in the Middle East. Renew. Sustain. Energy Rev. 2016, 54, 1172–1181. [Google Scholar] [CrossRef]
- KPMG, Sector Report, Oil and Gas in Africa. Available online: https://www.kpmg.com/Africa/en/IssuesAndInsights/Articles-Publications/General-Industries-Publications/Documents/Oil%20and%20Gas%20sector%20report%202015.pdf (accessed on 16 December 2015).
- U.S. Energy Information Administration. Available online: http://www.eia.gov/todayinenergy/detail.cfm?id=11951 (accessed on 16 December 2015).
- Federal Energy Regulatory Commission. Energy Primer, a Handbook of Energy Market Basics; Federal Energy Regulatory Commission: Washington, DC, USA, 2015. [Google Scholar]
- Pearson, I.; Zeniewski, P.; Gracceva, F.; Zastera, P.; McGlade, C.; Sorrel, S.; Speirs, J.; Thonhauser, G. Unconventional Gas: Potential Energy Market Impacts in the European Union; JRC Scientific and Policy Reports; European Commission: Brussels, Belgium, 2012. [Google Scholar]
- EIA. Available online: http://www.eia.gov/dnav/ng/ng_stor_cap_dcu_nus_a.htm (accessed on 16 December 2015).
- European Commission. The Role of Gas Storage in Internal Market and in Ensuring Security of Supply; European Commission: Brussels, Belgium, 2014. [Google Scholar]
- Moncada Lo Giudice, G.; Asdrubali, F.; Rotili, A. Influence of new factors on global energy prospects in the medium term: Comparison among the 2010, 2011 and 2012 editions of the IEA’s world energy outlook reports. Econ. Policy Energy Environ. 2013, 3, 67–89. [Google Scholar]
- Hamid Majid, A.; Geo, P. Technical Developments in Utilizing Unconventional Resources of Oil and Gas. In Proceedings of Tenth Arab Energy Conference, Abu Dhabi, United Arab Emirates, 21–23 December 2014.
- Khatib, H. IEA World Energy Outlook 2011—A comment. Energy Policy 2012, 48, 737–743. [Google Scholar] [CrossRef]
- Khatib, H. IEA World Energy Outlook 2010—A comment. Energy Policy 2011, 39, 2507–2511. [Google Scholar] [CrossRef]
- Exxon Mobil. The Outlook for Energy: A View to 2040; ExxonMobil: Irving, TX, USA, 2013. [Google Scholar]
- International Monetary Fund. World Economic Outlook; International Monetary Fund: Washington, DC, USA, 2012. [Google Scholar]
- Urban, R. Il ciclo economico del gas naturale, Il sole azzurro; Arti Grafiche Favia: Modugno, Italy, 2014. [Google Scholar]
- Cornot-Gandolphe, S.; Appert, O.; Dickel, R.; Chabrelie, M.F.; Rojey, A. The challenges of further cost reductions for new supply options (pipeline, lng, gtl). In Proceedings of the 22nd World Gas Conference, Tokyo, Japan, 1–5 June 2003.
- Eni. Available online: http://www.eni.com/en_IT/media/press-releases/2015/08/Eni_discovers_supergiant_gas_field_in_Egyptian_offshore_the_largest_ever_found_in_Mediterranean_Sea.shtml (accessed on 16 December 2015).
- European Commission. Quarterly Report on European Gas Markets Q4 2014; European Commission: Brussel, Belgium, 2014. [Google Scholar]
- International Gas Union. Wholesale Gas Price Survey—2015 Edition; Oslo, International Gas Union: Norway, 2015. [Google Scholar]
- TAP. Available online: www.tap.ag.com (accessed on 16 December 2015).
- European Commission, Energy Security Strategy. Available online: http://ec.europa.eu/energy/en/topics/energy-strategy/energy-security-strate (accessed on 16 December 2015).
- The Wall Street Journal. Available online: http://www.wsj.com/articles/the-american-solution-to-europes-energy-woes-1414526345 (accessed on 16 December 2015).
- The Wall Street Journal. Available online: http://www.wsj.com/articles/new-russia-china-deal-could-further-hit-natural-gas-prices-1415614816 (accessed on 16 December 2015).
- Fitch: Major Iranian Gas Exports Will Take at Least Five Years. Available online: http://www.reuters.com/article/idUSFit92836320150710#hHC0ut62P7quVeiB.99 (accessed on 30 January 2016).
- The Wall Street Journal. Available online: http://www.wsj.com/articles/iran-could-become-major-supplier-of-natural-gas-to-eu-1442155324 (accessed on 16 December 2015).
- SOS Tariffe. Available online: http://www.sostariffe.it/news/limpatto-ambientale-del-gas-naturale-il-problema-dellapprovvigionamento-in-italia-47357 (accessed on 16 December 2015).
- Harrison, M.R.; Campbell, L.M.; Shires, T.M.; Cowgill, R.M. Methane Emissions from the Natural Gas Industry, 2. In EPA/600/R-96/080B, U.S. EPA; Environmental Protection Agency: Washington, DC, USA, 1996. [Google Scholar]
- U.S. Environmental Protection Agency. (U.S. EPA) 2011. In Options for Removing Accumulated Fluid and Improving Flow in Gas Wells; Office of Air and Radiation: Natural Gas Star Program: Washington, DC, USA, 2011. [Google Scholar]
- Vidic, R.D.; Brantley, S.L.; Vandenbossche, J.M.; Yoxtheimer, D.; Abad, J.D. Impact of Shale Gas Development on Regional Water Quality. Science 2013, 340, 1235009. [Google Scholar] [CrossRef] [PubMed]
- ALL Consulting. Available online: http://www.all-llc.com/publicdownloads/ALLFayettevilleFracFINAL.pdf (accessed on 16 December 2015).
- Zoback, M.; Kitasei, S.; Copithorne, B. Addressing the Environmental Risks from Shale Gas Development; Worldwatch Institute: Washington, DC, USA, 2010. [Google Scholar]
- ENI. Available online: http://www.eniscuola.net/wp-content/uploads/2011/02/pdf_gas.pdf (accessed on 16 December 2015).
- Elvidge, C.D.; Zhizhin, M.; Baugh, K.; Hsu, F.C.; Ghoshm, T. Methods for Global Survey of Natural Gas Flaring from Visible Infrared Imaging Radiometer Suite Data. Energies 2016, 9, 14. [Google Scholar] [CrossRef]
- United States Environmental Protection Agency. US EPA-R&D—Methane emissions from the Natural Gas Industry; Technical Report; United States Environmental Protection Agency: Washington, DC, USA, 2006; Volume 2.
- Burnham, A.; Han, J.; Clark, C.E.; Wang, M.; Dunn, J.B.; Palou-Rivera, I. Life-Cycle Greenhouse Gas Emissions of Shale Gas, Natural Gas, Coal, and Petroleum. Environ. Sci. Technol. 2011, 46, 619–627. [Google Scholar] [CrossRef] [PubMed]
- Howarth, R.W.; Santoro, R.; Ingraffea, A. Methane and the greenhouse-gas footprint of natural gas from shale formations. Clim. Change 2011, 106, 679–690. [Google Scholar] [CrossRef]
- Tamura, I.; Tanaka, T.; Kagajo, T.; Kuwabara, S.; Yoshioka, T.; Nagata, T.; Kurahashi, K.; Ishitani, H.M.S. Life cycle CO2 analysis of LNG and city gas. Appl. Energy 2001, 68, 301–319. [Google Scholar] [CrossRef]
- Trozzi, C.; Vaccaro, R. Methodologies for Estimating Air Pollutant Emissions from Ships. In Proceedings of 22nd CIMAC International Congress on Combustion Engines, Copenhagen, Denmark, 18–21 May 1998; pp. 775–782.
- Ruether, J.; Ramezan, M.; Grol, E. Life Cycle Analysis of Greenhouse Gas Emissions for Hydrogen Fuel Production in the US from LNG and Coal. In Proceedings of the Second International Conference on Clean Coal Technologies for Our Future, Chia Laguna, Sardinia, 10–12 May 2005.
- U.S. Energy Information Administration. Available online: http://www.eia.gov/forecasts/steo (accessed on 16 December 2015).
- Turconi, R.; Boldrin, A.; Astrup, T. Life cycle assessment (LCA) of electricity generation technologies: Overview, comparability and limitations. Renew. Sustain. Energy Rev. 2013, 28, 555–565. [Google Scholar] [CrossRef] [Green Version]
- Asdrubali, F.; Baldinelli, G.; D’Alessandro, F.; Scrucca, F. Life Cycle Assessment of electricity production from renewable energies: Review and results harmonization. Renew. Sustain. Energy Rev. 2015, 42, 1113–1122. [Google Scholar] [CrossRef]
- The Wall Street Journal. Available online: http://www.wsj.com/articles/eni-reports-natural-gas-discovery-off-egyptian-coast-1440951226 (accessed on 16 December 2015).


| Billion Cubic Meters | 2004 | 2005 | 2006 | 2007 | 2008 | 2009 | 2010 | 2011 | 2012 | 2013 | 2014 | 2014 Share of Total |
|---|---|---|---|---|---|---|---|---|---|---|---|---|
| Total North America | 783.7 | 782.1 | 778.0 | 813.8 | 821.5 | 815.9 | 849.6 | 870.6 | 903.4 | 928.5 | 949.4 | 28.3% |
| Total S. & Cent. America | 119.0 | 124.0 | 136.0 | 142.7 | 143.7 | 139.1 | 148.6 | 152.1 | 161.7 | 168.4 | 170.1 | 5.0% |
| Total Europe & Eurasia | 1077.9 | 1098.4 | 1122.0 | 1127.2 | 1135.8 | 1041.5 | 1121.3 | 1097.8 | 1080.9 | 1060.8 | 1009.6 | 29.6% |
| Total Middle East | 259.3 | 277.0 | 294.7 | 315.7 | 347.0 | 361.1 | 395.4 | 418.7 | 430.5 | 437.7 | 465.2 | 13.7% |
| Total Africa | 81.1 | 85.5 | 89.1 | 96.0 | 100.9 | 99.6 | 107.2 | 113.9 | 121.8 | 120.3 | 120.1 | 3.5% |
| Total Asia Pacific | 377.7 | 408.2 | 436.3 | 468.9 | 499.3 | 512.6 | 571.6 | 612.2 | 647.6 | 665.3 | 678.6 | 19.9% |
| Total World | 2698.8 | 2775.2 | 2856.1 | 2964.4 | 3048.2 | 2969.9 | 3193.7 | 3265.3 | 3345.8 | 3381.0 | 3393.0 | 100.0% |
| Billion Cubic Meters | 2004 | 2005 | 2006 | 2007 | 2008 | 2009 | 2010 | 2011 | 2012 | 2013 | 2014 | 2014 Share of Total |
|---|---|---|---|---|---|---|---|---|---|---|---|---|
| Total North America | 753.5 | 750.5 | 769.7 | 781.8 | 800.8 | 807.3 | 821.1 | 866.5 | 893.8 | 903.3 | 948.4 | 27.7% |
| Total S. & Cent. America | 134.7 | 140.7 | 154.3 | 162.3 | 163.2 | 158.5 | 163.2 | 167.2 | 173.7 | 173.3 | 175.0 | 5.0% |
| Total Europe & Eurasia | 1025.3 | 1028.8 | 1043.0 | 1041.2 | 1070.0 | 950.3 | 1021.7 | 1034.2 | 1028.2 | 1034.7 | 1002.4 | 28.8% |
| Total Middle East | 296.6 | 318.7 | 341.6 | 370.8 | 400.3 | 425.1 | 488.6 | 540.7 | 565.1 | 580.5 | 601.0 | 17.3% |
| Total Africa | 156.4 | 177.3 | 192.2 | 204.7 | 212.3 | 200.0 | 213.3 | 210.2 | 215.4 | 204.7 | 202.6 | 5.8% |
| Total Asia Pacific | 344.8 | 373.4 | 391.7 | 407.3 | 426.9 | 448.2 | 494.7 | 496.9 | 504.0 | 512.3 | 531.2 | 15.3% |
| Total World | 2711.3 | 2789.3 | 2892.5 | 2968.1 | 3073.4 | 2989.4 | 3202.6 | 3315.7 | 3380.2 | 3408.8 | 3460.6 | 100.0% |
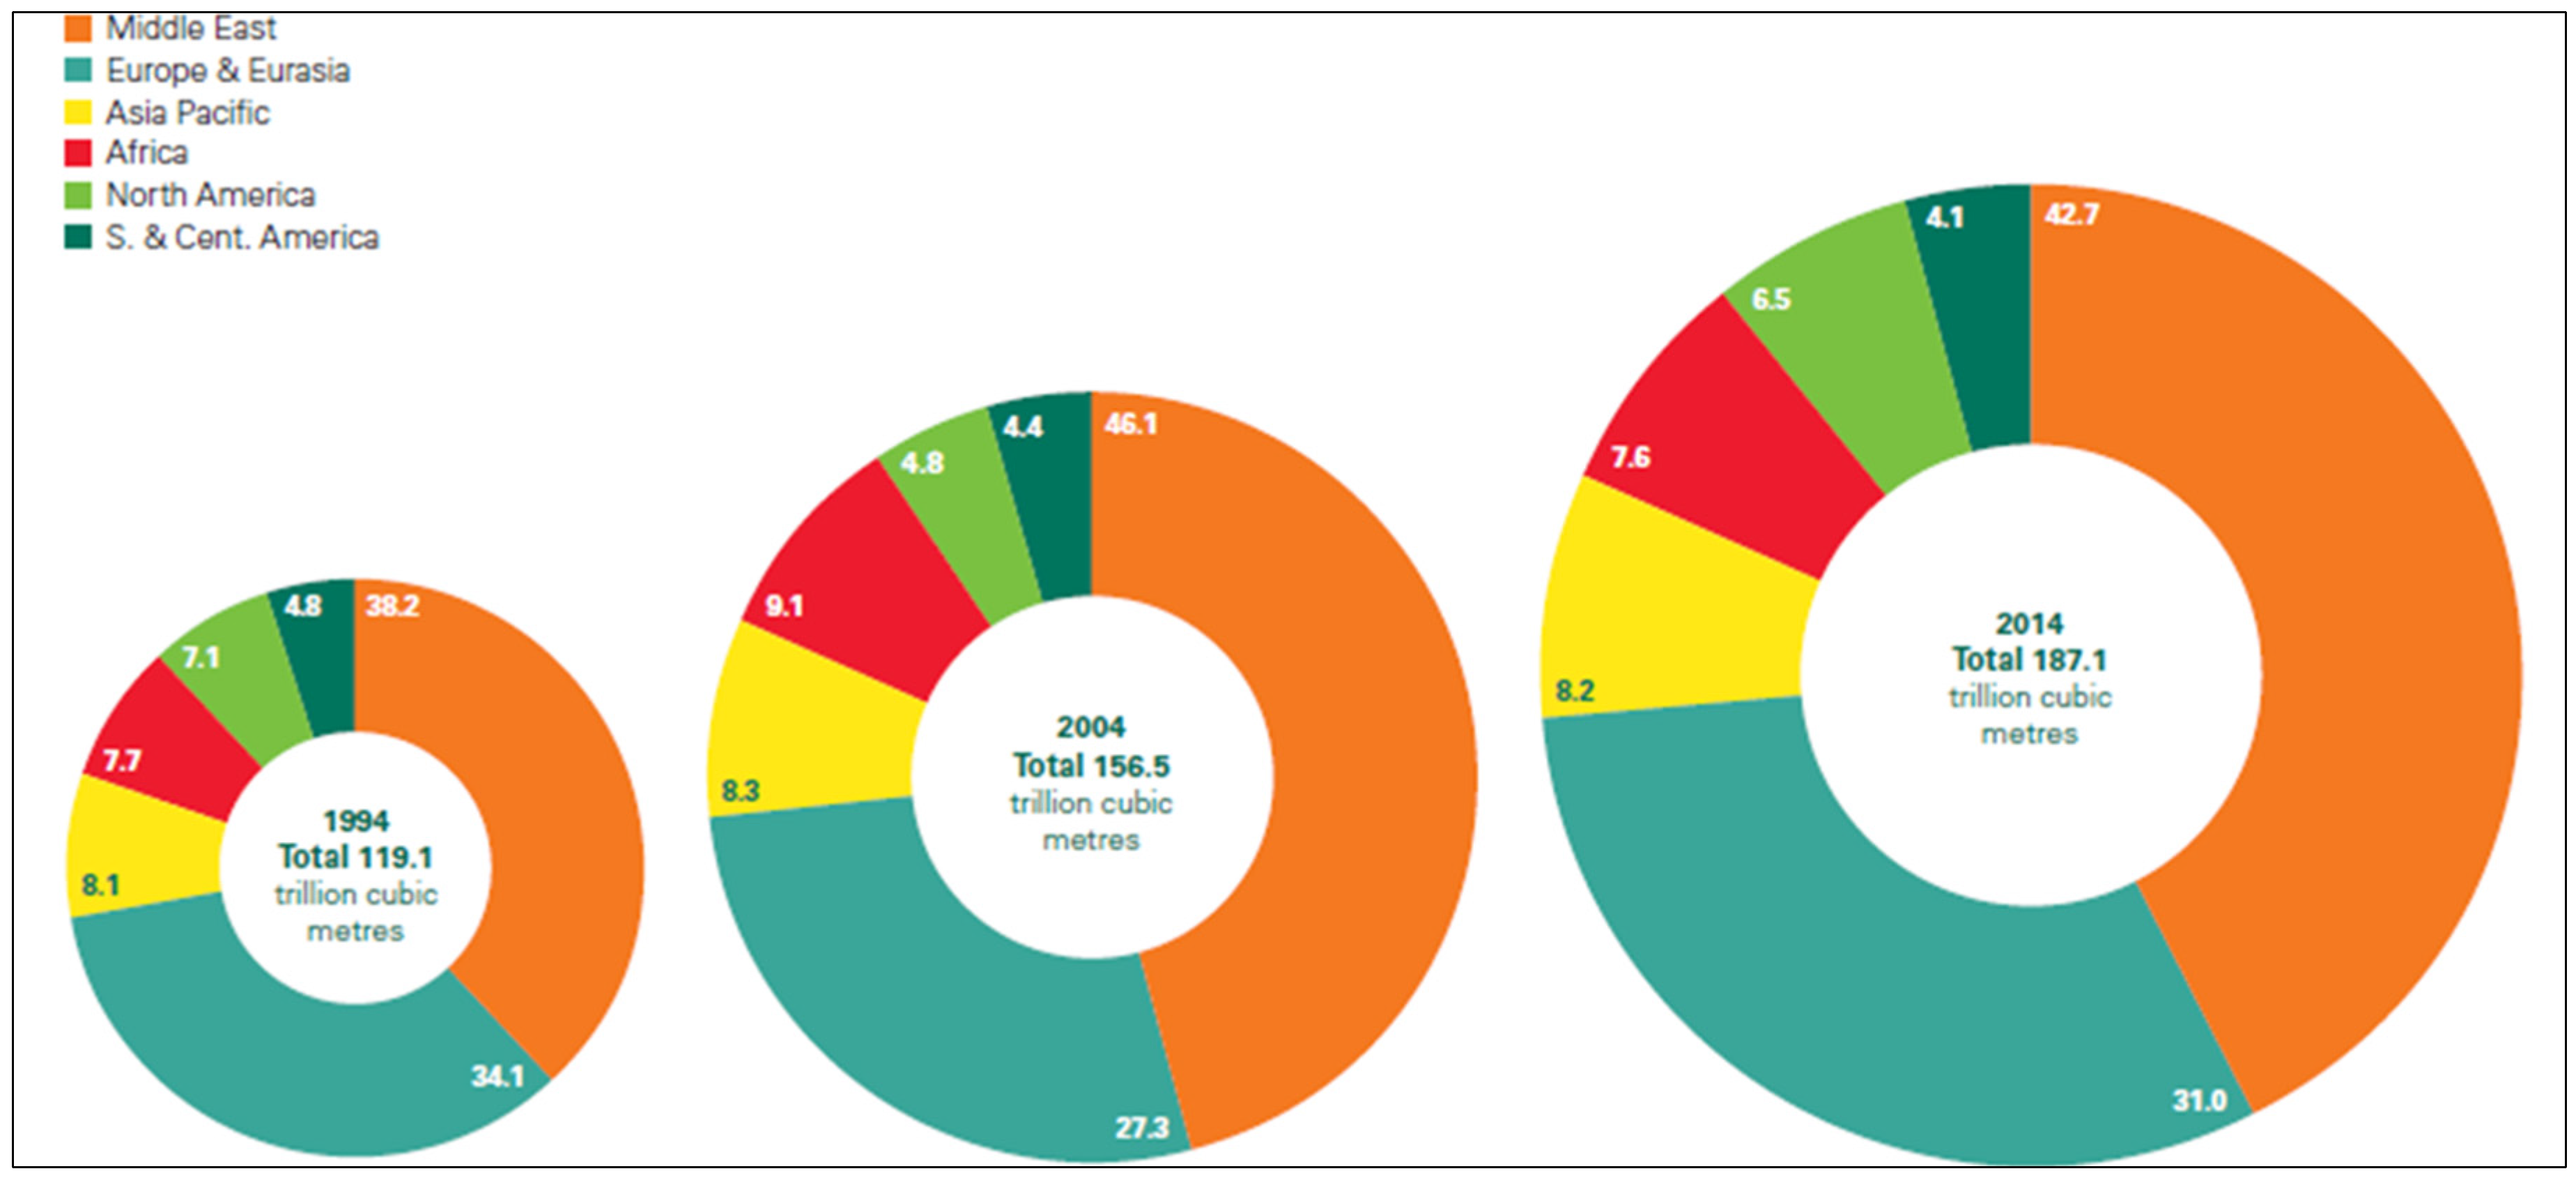
| At End 1994 | At End 2004 | At End 2013 | At End 2014 | ||
|---|---|---|---|---|---|
| Trillion Cubic Meters | Trillion Cubic Meters | Trillion Cubic Meters | Trillion Cubic Meters | Share of Total (%) | |
| Total North America | 8.5 | 7.5 | 12 | 12.1 | 6.5 |
| Total S. & Cent. America | 5.7 | 7.0 | 7.7 | 7.7 | 4.1 |
| Total Europe & Eurasia | 40.6 | 42.7 | 57.5 | 58.0 | 31.0 |
| Total Middle East | 45.5 | 72.2 | 80.0 | 79.8 | 42.7 |
| Total Africa | 9.1 | 14.2 | 14.2 | 14.2 | 7.6 |
| Total Asia Pacific | 9.7 | 13.0 | 15.2 | 15.3 | 8.2 |
| Total World | 119.1 | 156.5 | 186.5 | 187.1 | 100 |
| Billion Cubic Meters | 2011 | 2012 | 2013 | 2014 |
|---|---|---|---|---|
| Norway | 93.6 | 104.2 | 101.4 | 106.3 |
| North Africa | 32.9 | 37.4 | 31.4 | 28.5 |
| North Stream | 0.5 | 10.6 | 22.1 | 32.8 |
| Yamal pipeline | 22.8 | 25.0 | 30.6 | 29.8 |
| Ukraine/Slovakia | 70.4 | 51.8 | 53.5 | 31.4 |
| LNG | 87.0 | 63.9 | 48.5 | 47.2 |
© 2016 by the authors; licensee MDPI, Basel, Switzerland. This article is an open access article distributed under the terms and conditions of the Creative Commons by Attribution (CC-BY) license (http://creativecommons.org/licenses/by/4.0/).
Share and Cite
Toscano, A.; Bilotti, F.; Asdrubali, F.; Guattari, C.; Evangelisti, L.; Basilicata, C. Recent Trends in the World Gas Market: Economical, Geopolitical and Environmental Aspects. Sustainability 2016, 8, 154. https://0-doi-org.brum.beds.ac.uk/10.3390/su8020154
Toscano A, Bilotti F, Asdrubali F, Guattari C, Evangelisti L, Basilicata C. Recent Trends in the World Gas Market: Economical, Geopolitical and Environmental Aspects. Sustainability. 2016; 8(2):154. https://0-doi-org.brum.beds.ac.uk/10.3390/su8020154
Chicago/Turabian StyleToscano, Alessandro, Filiberto Bilotti, Francesco Asdrubali, Claudia Guattari, Luca Evangelisti, and Carmine Basilicata. 2016. "Recent Trends in the World Gas Market: Economical, Geopolitical and Environmental Aspects" Sustainability 8, no. 2: 154. https://0-doi-org.brum.beds.ac.uk/10.3390/su8020154