Article

Revealing Social Values by 3D City Visualization in City Transformations

1
Construction Engineering and Management, Division of Industrialized and Sustainable Construction, Department of Civil, Environmental and Natural Resources Engineering, Luleå University of Technology (LTU), Luleå 97187, Sweden
2
Industrial Work Environment, Division of Human Work Science, Department of Business Administration, Technology and Social Sciences, Luleå University of Technology (LTU), Luleå 97187, Sweden
*
Author to whom correspondence should be addressed.
These authors contributed equally to this work.
Sustainability 2016, 8(2), 195; https://0-doi-org.brum.beds.ac.uk/10.3390/su8020195
Submission received: 31 October 2015 / Revised: 26 January 2016 / Accepted: 16 February 2016 / Published: 22 February 2016

Abstract

:
Social sustainability is a widely used concept in urban planning research and practice. However, knowledge of spatial distributions of social values and aspects of social sustainability is required. Visualization of these distributions is also highly valuable, but challenging, and rarely attempted in sparsely populated urban environments in rural areas. This article presents a method that highlights social values in spatial models through 3D visualization, describes the methodology to generate the models, and discusses potential applications. The models were created using survey, building, infrastructure and demographic data for Gällivare, Sweden, a small city facing major transformation due to mining subsidence. It provides an example of how 3D models of important social sustainability indices can be designed to display citizens’ attitudes regarding their financial status, the built environment, social inclusion and welfare services. The models helped identify spatial variations in perceptions of the built environment that correlate (inter alia) with closeness to certain locations, gender and distances to public buildings. Potential uses of the model for supporting efforts by practitioners, researchers and citizens to visualize and understand social values in similar urban environments are discussed, together with ethical issues (particularly regarding degrees of anonymity) concerning its wider use for inclusive planning.

Graphical Abstract

1. Introduction

This article presents a method for visualizing distributions of social values in 3D city models and discusses its potential for inclusive sustainable urban planning. Its development was prompted by a perceived need for such a model to facilitate a planned transformation of the municipality of Gällivare, situated in northern Sweden with approximately 18,000 inhabitants. The method is rooted in a sustainability framework, which can be used to analyze diverse social aspects from chronological perspectives in urban studies and planning.
A key concept of sustainable development originates from Our Common Future, also known as the Brundtland Report: “development that meets the needs of the present without compromising the ability of future generations to meet their own needs” [1] (p. 16). The term includes three dimensions of sustainable development: environmental, economic, and social. The social dimension became widely used in international research in the beginning of the 21st century. During the last decade, various definitions have been proposed, discussed and reviewed [2,3,4]. However, despite the lack of consensus, many of the aspects generally associated with social sustainability are related to human capital, social capital and well-being [5]. The criteria for social sustainability often encompass numerous factors that are favored by a focal society or group of people. Thus, analysis of people’s perceptions of their conditions and environments is important for assessing social sustainability, together with analysis of social changes to determine whether it is decreasing or increasing (and/or whether planned actions will reduce or increase it). Dempsey et al. [2] identified several aspects of social sustainability related to urban environments, such as social inclusion and local networks, income distribution, sense of community and belonging, the attractiveness of the public realm, housing, and urban design. Equality, resource distribution and access to public services are also regarded as important aspects of social sustainability to consider in urban studies. In addition, Dymén [6] has highlighted the importance of integrating gender perspectives in municipal spatial planning to avoid inequality risks.
Urban transformation in any geo-socio-economic context introduces numerous challenges for politicians and planners in terms of balancing demands related to economic growth, social justice and protection of green spaces [7]. These urban planning problems have wicked characteristics and can only be solved by an iterative collaborative process by involved stakeholders [8]. Sustainable development is dependent on a closer and wider dialogue between all stakeholders and a closer integration of a various urban decision-making and professional fields [9].
Geographic information systems (GIS) can facilitate visualization and analysis of information about the current states and trends of social values in the urban landscape. The technology can enhance awareness of sustainability dimensions, improve data accessibility [10], and greatly assist the generation of maps and urban models that are valuable for both visualizing social values in urban areas [11,12,13] and helping planners to communicate and share ideas with the public [14]. Here, 3D visualization offers a way for citizens with diverse backgrounds to understand and suggest design changes in their community [15]. Visualization of 3D models offers improved cognitive understanding of vertical dimensions and spatial relations compared with 2D-visualization especially when users can navigate through the 3D environment [16]. They are more suitable in such contexts than 2D models since they aid acquisition of qualitative understanding [17] and can provide more common representations of buildings that support communication among, and decision-making by, stakeholders with diverse educational levels and professional backgrounds [18,19,20,21]. Similarly, Ranzinger and Gleixner [22] claimed that 3D models are more useful in urban planning processes than 2D models for three kinds of stakeholders: citizens, planners and politicians. 3D models, according to Ranzinger and Gleixner, can: (1) show citizens what is suggested to be built, which increases their engagement in the planning process; (2) help planners to explain their ideas and reduce delays; and (3) increase politicians’ security in the legitimacy of their decisions by enabling them to visualize multiple aspects of projects. GIS have mainly been applied to date in relatively narrow social contexts of specific professions, including (inter alia) sustainable urban and regional planning, energy planning, natural resource management, civil engineering, criminology, and public health [23,24,25,26,27,28].
Previous efforts to visualize social values have mainly focused on attitudes towards the preservation of green areas such as woodlands, gardens and parks in attempts to balance urban development with conservation or enhancement of ecological and social values [12,13,29]. In several of these studies, attitude surveys have been used to create maps of the affected public’s perceptions and values. This has led to an increasing abundance of empirical evidence that has enabled community stakeholders to identify and map various landscape-attached values, perceptions and services two-dimensionally [29]. Several approaches have been applied, as illustrated by the following examples. Survey information has been used in combination with landscape data to create weighted-density heatmaps that visualize perceived and experienced values [13,30]. A questionnaire has been used in combination with landscape data [12] and face-to-face interviews have been used in combination with mapping to display responders’ experiences of green areas using thematic maps [31]. A cluster map has been generated using single-informant interviews [29]. Ecosystem services in New York City have been mapped using an approach involving visualization in thematic maps of spatial patterns of social-ecological conditions focused on vacant land in the city’s cultural landscape [32]. In addition, in built environment research contexts, 2D GIS has been used to examine various social aspects of cities based on survey data. Notably, this approach has been applied to map urban revitalization in an evaluation of a new housing policy [33], resident-defined neighborhood mapping has been applied using GIS to analyze phenomenological neighborhoods [34], and 2D GIS has been used to probe the ability of built environment designs to encourage walking by individuals with negative attitudes towards walking [35].
In summary, maps (2D) have been relatively widely used for displaying social values related to ecosystem services and some other aspects of urban environments in diverse contexts. Previous studies relevant to planners have focused more on metropolises than on medium-sized and smaller cities, so addressing Gällivare requires adaptation of visualization practices to a relatively neglected type of urban environment [36]. The method presented addresses these challenges by combining data from surveys of Gällivare’s residents with Swedish national statistics, building and infrastructure data. The resulting visualization of social data in a 3D city model provides access to information on citizens’ preferences and an instrument for enhancing both community involvement and communication between planners, policy-makers and other stakeholders. The following specific questions are addressed here:
-
How can the theoretical framework of social sustainability be used in the aggregation and analysis of data from surveys, national statistics and spatial data to enable inclusive planning?
-
How can survey data be ethically integrated in an automated way that avoids revelation of individual citizens’ identities, and what ethical concerns should be considered when visualizing social data?
-
How can responses to surveys on attitudes be analyzed and visualized to ensure that they adequately reflect variations in population sizes in different parts of a city?
The paper is structured as follow. First, the method and case study of the city transformation of the municipality of Gällivare is presented. The method of data collection, integration and model visualization and analysis of social values of residents are described. Second, the result and analysis of the case study is presented. Finally, the results are discussed and concluded in relation to the use of social sustainability frameworks in 3D visualization models, potential applications and limitations of their wider use in terms of privacy and ethical issues.

2. Method

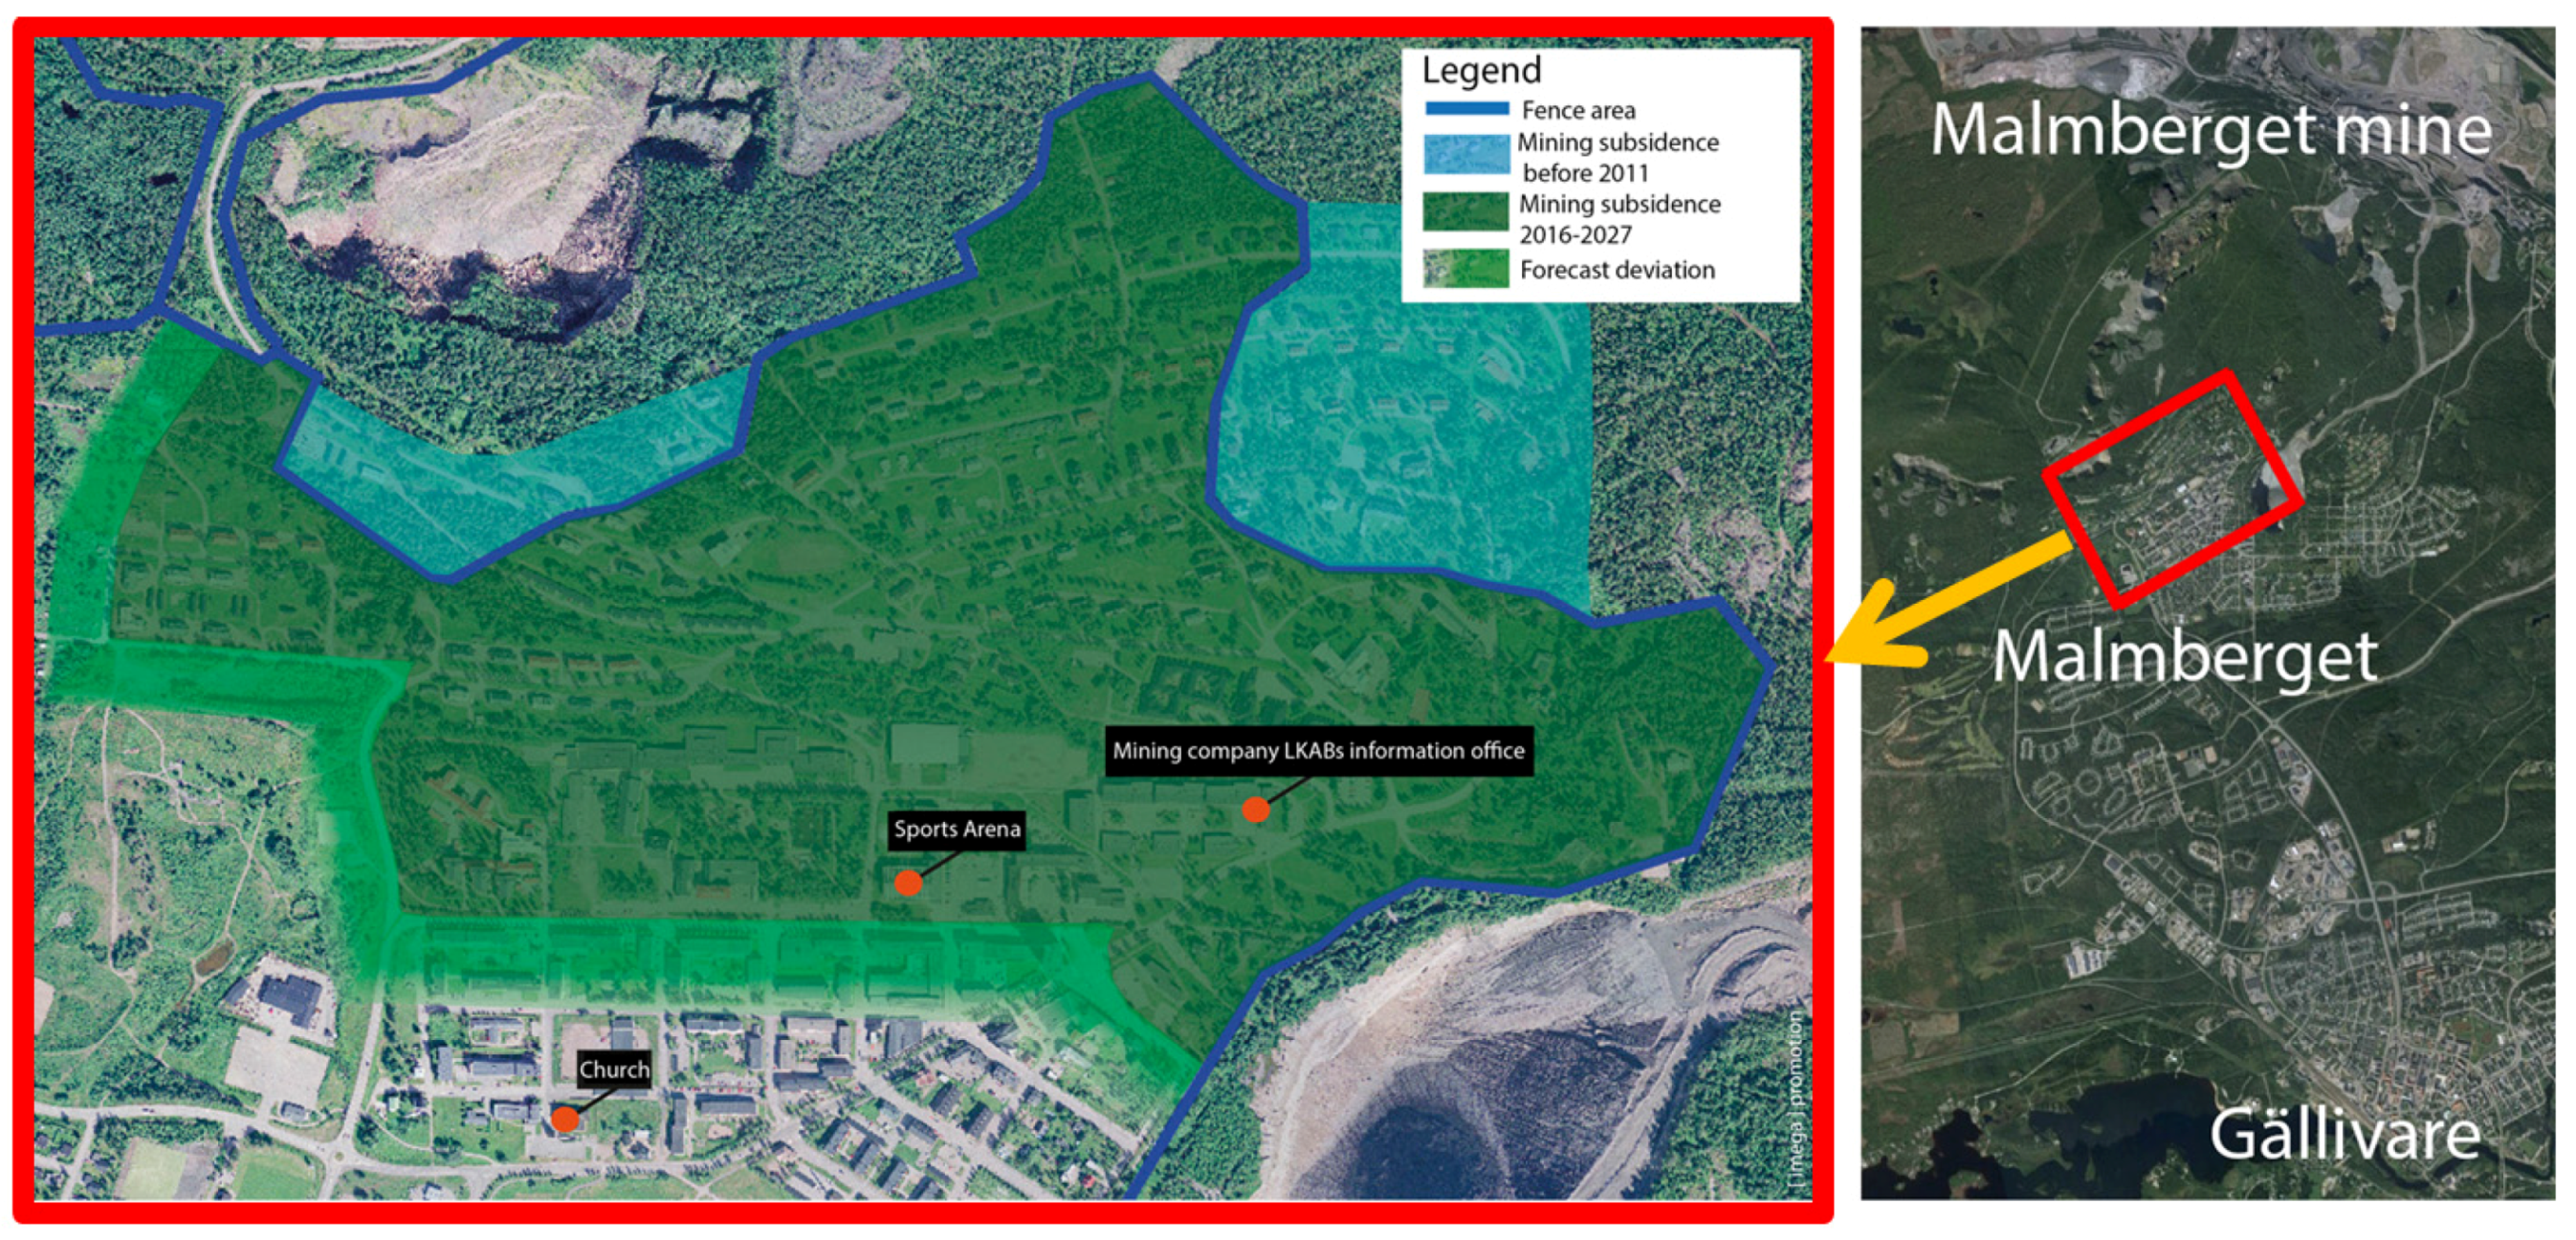
2.1. The Case of the Urban Transformation of Gällivare-Malmberget

A case study of a city transformation was selected, because case studies are suitable when studying complex processes [37]. The method is used to examine phenomena in natural settings, using multiple methods of data collection to gain information from one or more people, groups or organization [38]. There are two urban centers in the municipality of Gällivare: Gällivare and Malmberget, 5 km to the north and site of a large iron ore mine. Parts of the city center in Malmberget situated above the mine are being demolished and relocated to Gällivare because of ground subsidence. The city transformation of Gällivare and Malmberget was also selected as a case to explore social-spatial relationships using multiple methods of data collection from different sources such as municipality of Gällivare, the Swedish National Land Survey, Luleå University of Technology and Statistics Sweden. This transformation poses both major planning challenges and opportunities to create sustainable living areas.
To support this transformation it is important to understand the needs and perceived problems of the Gällivare/Malmberget population in a spatial context. Socially, the municipality can be summarized as a mining community, with high median income, low unemployment rate and shortage of housing compared to other sparsely populated areas in Sweden. Problematic issues not explicitly considered here include a depopulation trend shared by many small remote communities and the common gender segregation in Swedish mining communities, in terms of both numbers and traditional divisions of labor [39]. A major spatial factor is closeness to the mining pit, as it is situated close to a residential area in Malmberget (see Figure 1). These socio-spatial contextual factors highlight the importance of social aspects such as personal financial status, gender patterns, social inclusion and attitudes towards infrastructure and welfare in planning.

2.2. Data Collection

Data collected from the municipality of Gällivare and the administrative agencies Statistics Sweden (SCB) and Swedish National Land Survey were used to geo-validate the survey data, i.e., compare the population density with the frequency of responses. Pertinent datasets were then combined to relate indices of attitudes (described below) to public data on population, infrastructure and the built environment (Table 1).
The survey was conducted by Jacobsson and Segerstedt in 2014 in the municipality of Gällivare, using questions based on the theoretical framework of social sustainability. Results of the survey were analyzed separately, and different social sustainability factors were analyzed and aggregated to form four indices measuring citizens’ satisfaction in terms of: social inclusion, built environment, public services in the municipality and their personal finances [40]. In the report, Jacobsson and Segerstedt argue that considering moving from Gällivare is an important variable for social sustainability as it reflects the current and possible changes in the future, drawing on the sustainability definition from the Brundtland report cited earlier. Indices emerged from the survey were found to significantly influence the probability to consider leaving Gällivare.
In this article, visualizations of spatial patterns of all these indices are presented. Below follows a description of how indices were constructed by Jacobsson and Segerstedt. Variables included in the Built environment index reflect respondents’ ratings (on scales from 1 to 5) of the comfort and planning of their residential neighborhood, attractiveness of the city center, and the range of stores in the city center. The Personal finance index combines variables on respondents’ contentment with their financial situation and the ease for them to balance household income and expenses. This index was chosen as a measure of socio-spatial welfare distribution to enable detection of possible pockets of perceived economic instability in the focal municipality, which was regarded as relatively affluent due to the relatively high income in the community. The Public services index was based on factor analysis of a range of variables measuring satisfaction with the provision of healthcare services, public schools, kindergartens and elderly care.
The Social inclusion index combines variables on opinions about Gällivare municipality being a good place of residency (or not) for people of different religions, different cultures and sexual orientations/identity, together with a variable concerning gender equality in the municipality. According to Jakobsson and Segerstedt [40], social values underlying all of those indices influence risks of people considering moving from the community, which they use to measure social sustainability. Of 3000 potential respondents aged 20–80 years contacted, 1237 replied (equivalent to 9 % of the total number of inhabitants in Gällivare municipality in this age range in 2014 when data were collected). No significant differences were found proportionally between the group of respondents and the total population (of the same age range) in terms of distribution of residences, or distributions of age and gender. The respondents’ scores for each of the questions and indices were digitized in tabular form.
Points with address attributes representing buildings’ positions were provided by the GIS office of Gällivare municipality. The respondents’ scores were aggregated in accordance with geographical references, in the form of 250 m × 250 m statistical squares, used by SCB to compile data on distributions of populations, education levels, incomes, jobs, age groups and people’s origins in Sweden. According to SCB the size of the squares is based on a compromise between privacy of the citizens and detail of the statistics (SCB, 2015). Information on locations of roads and building footprints provided by the Swedish National Land Survey was used in distance analyses of the built environment.

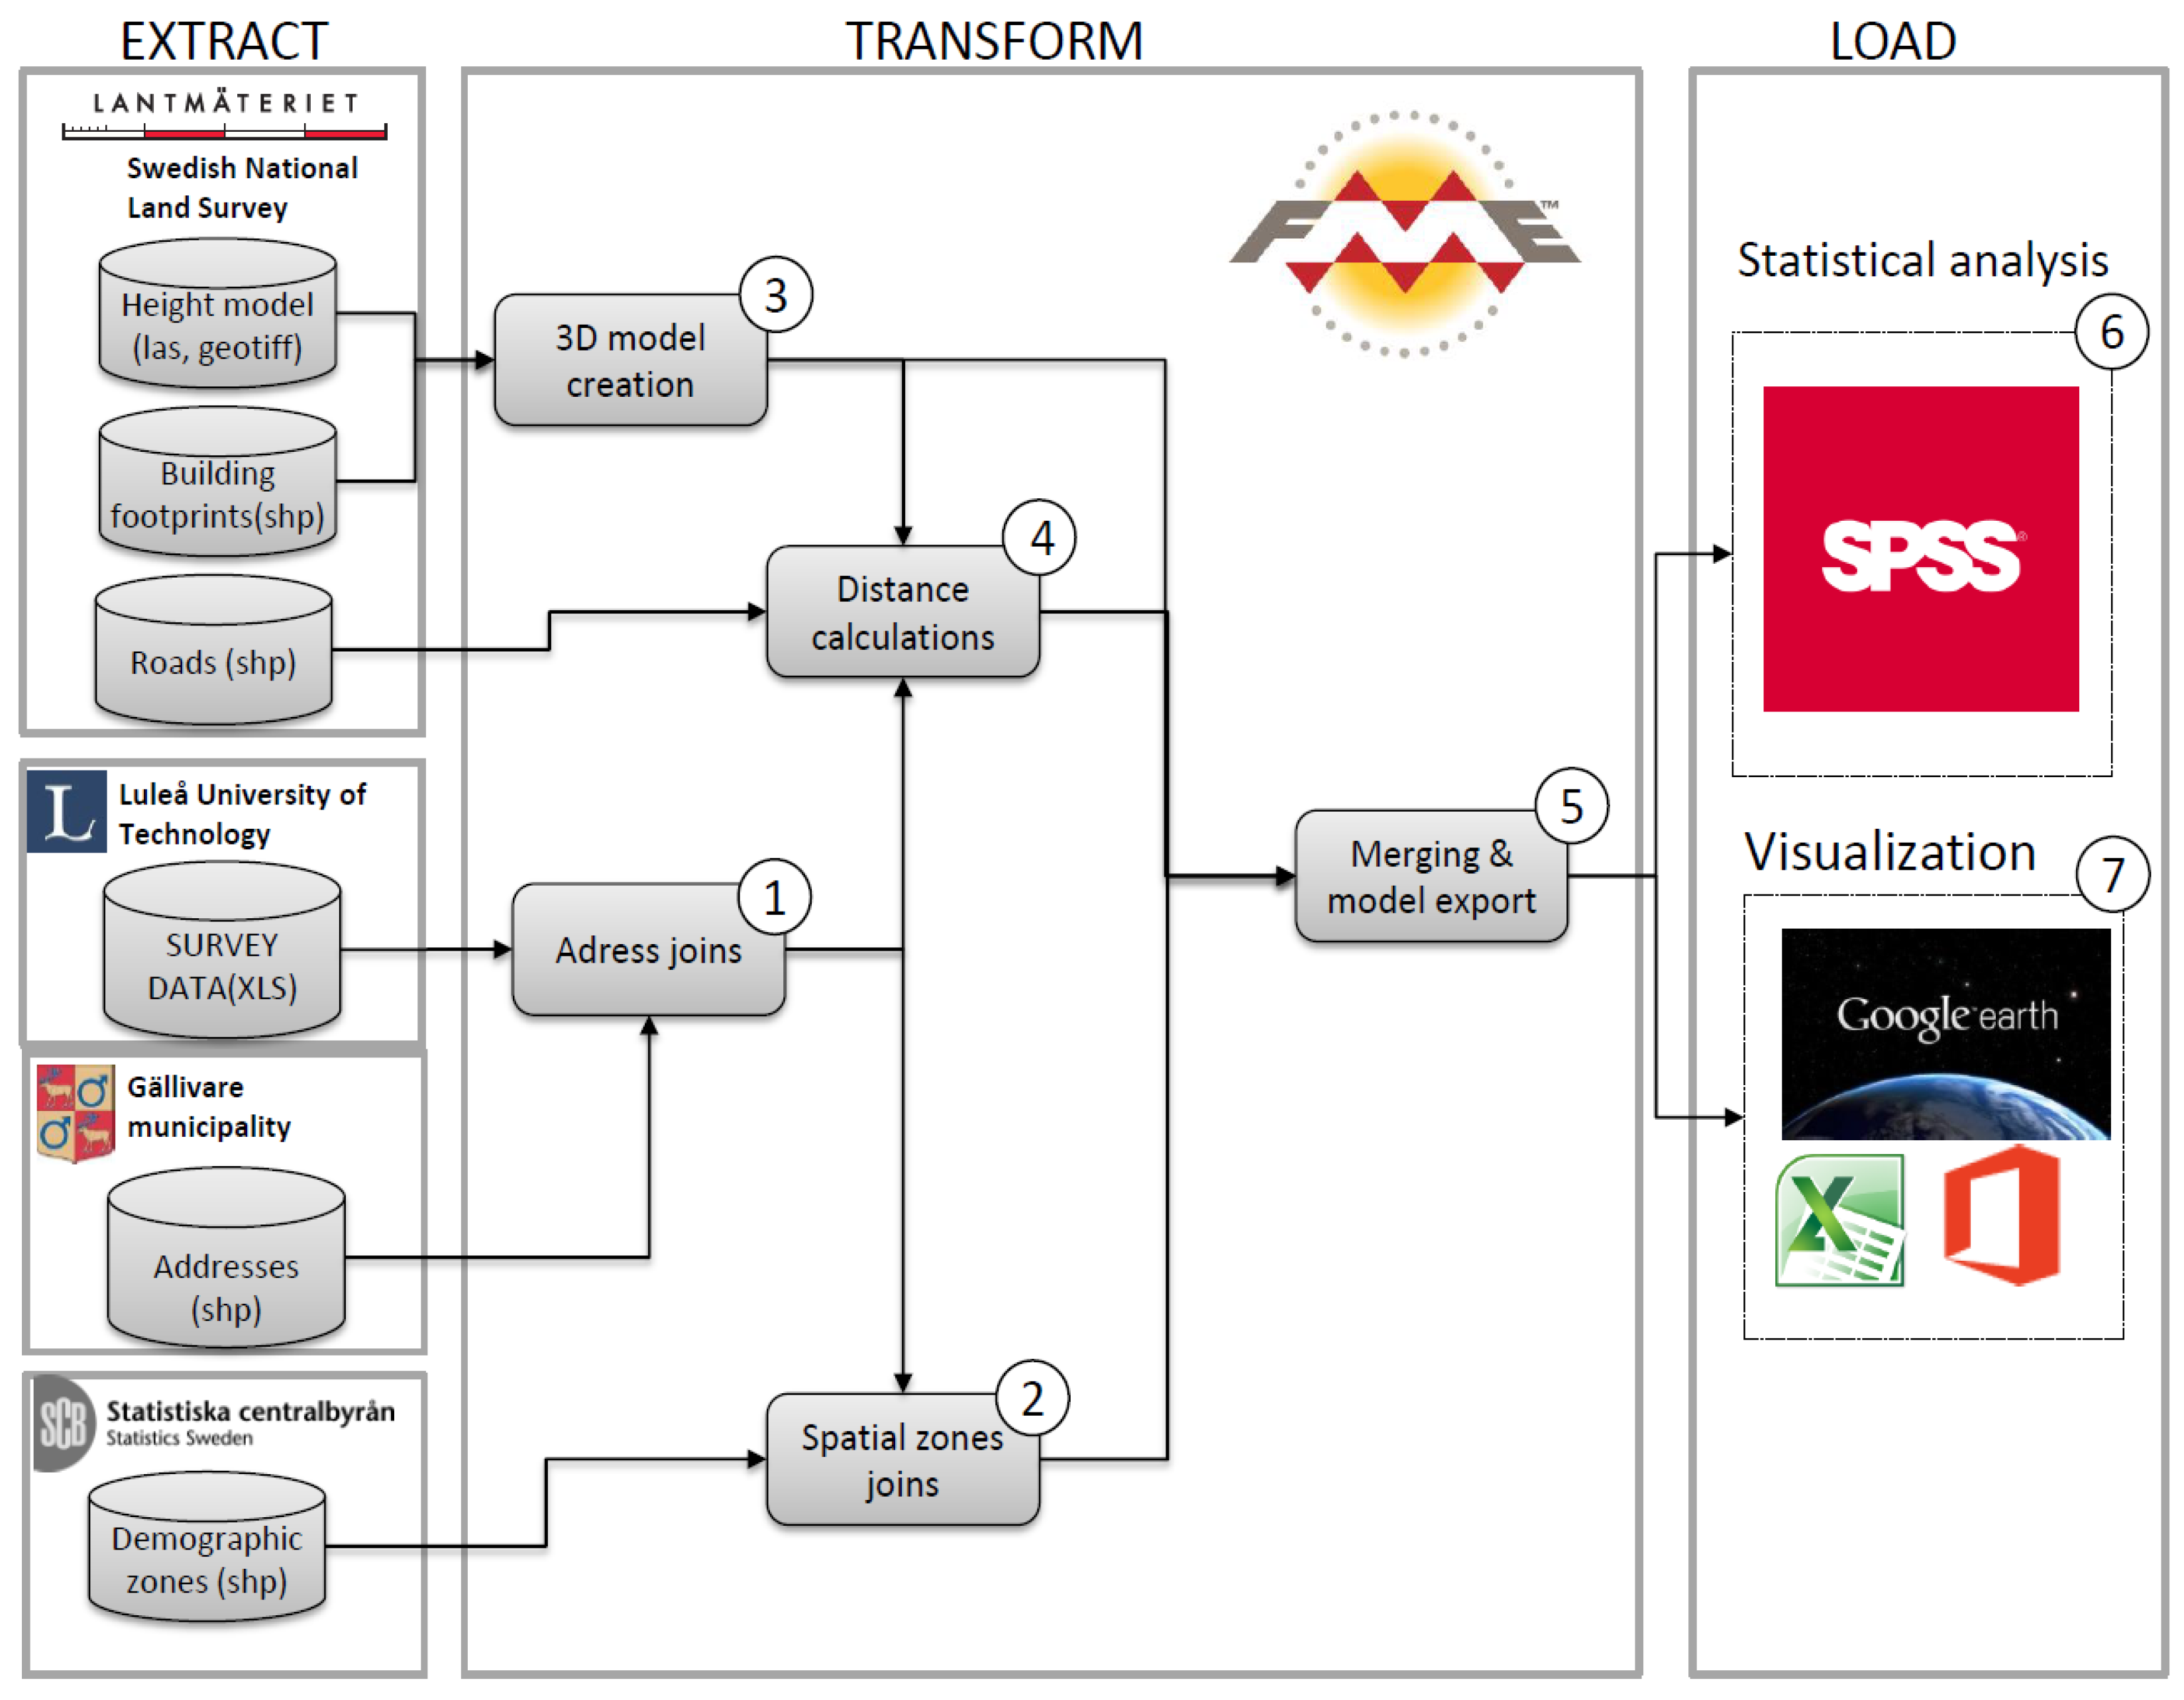
2.3. Data Integration

The Feature Manipulation Engine (FME) developed by Safe Software was used for integrating the data. It is specifically designed for extracting, transforming and loading (ETL) data and can manage the exchange of spatial and non-spatial data in more than 300 formats [41,42]. The ETL based process method is show in Figure 2 and consists of the following steps.
(1)
Address joins: First, the attribute addresses for the two datasets were cleaned and standardized using regular expressions and string replacer/modifiers. Data were then joined by address to create on combined dataset that consisted of the records of the survey data and the address points. Consequently, it was possible to geo-position over 90% of all survey respondents in the area.
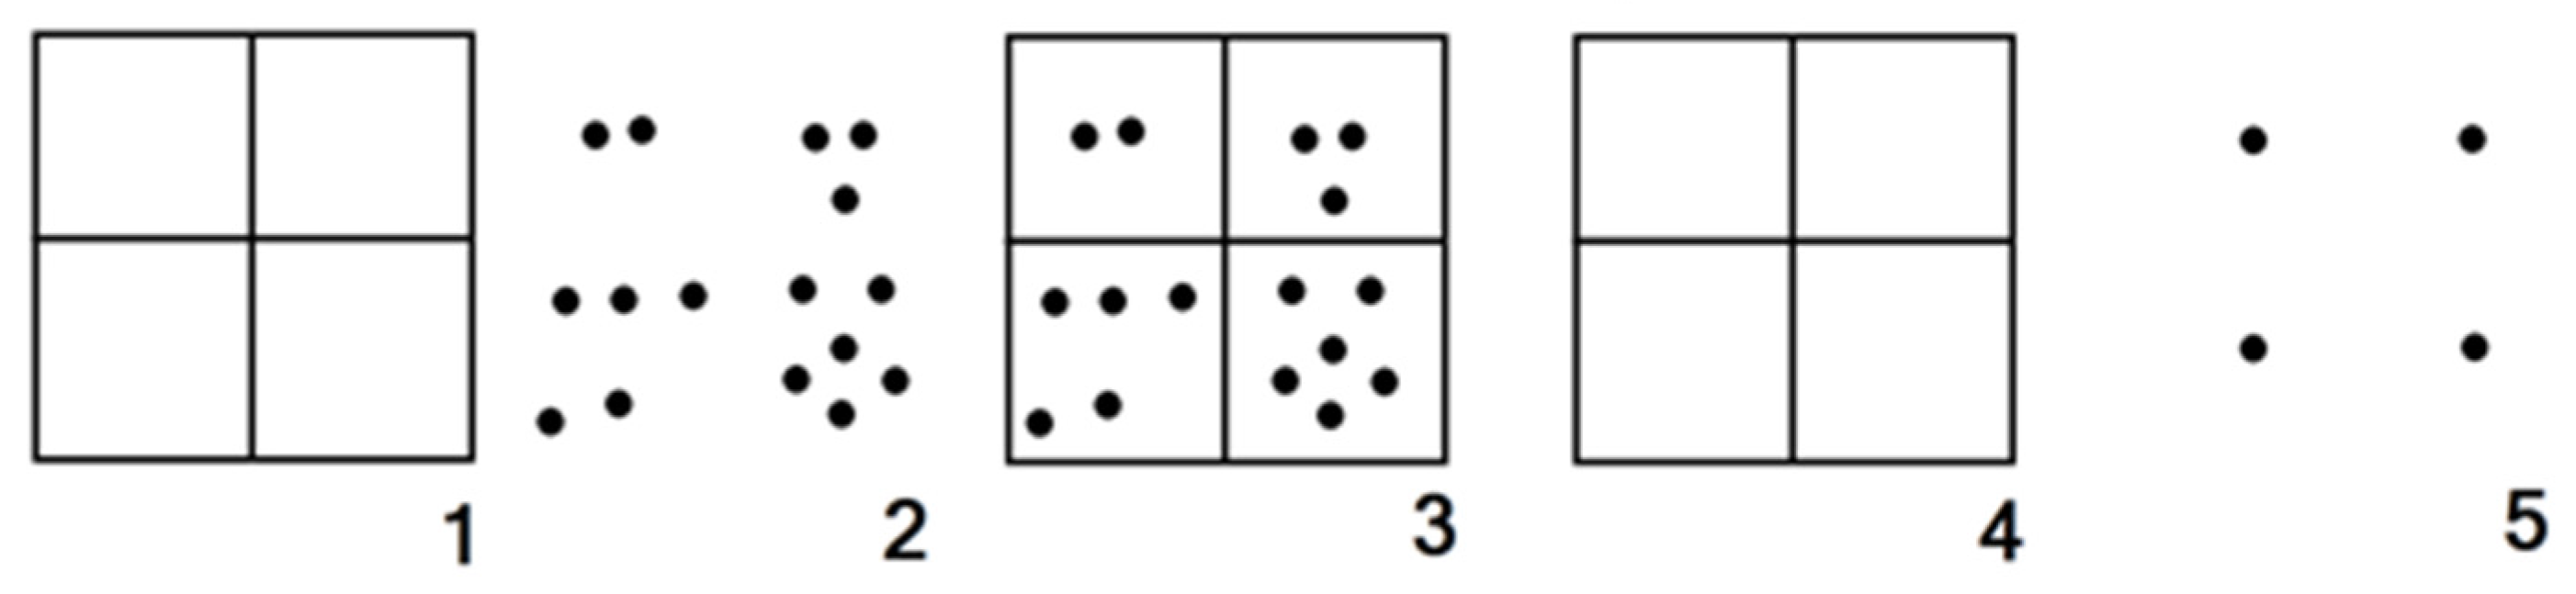
(2)
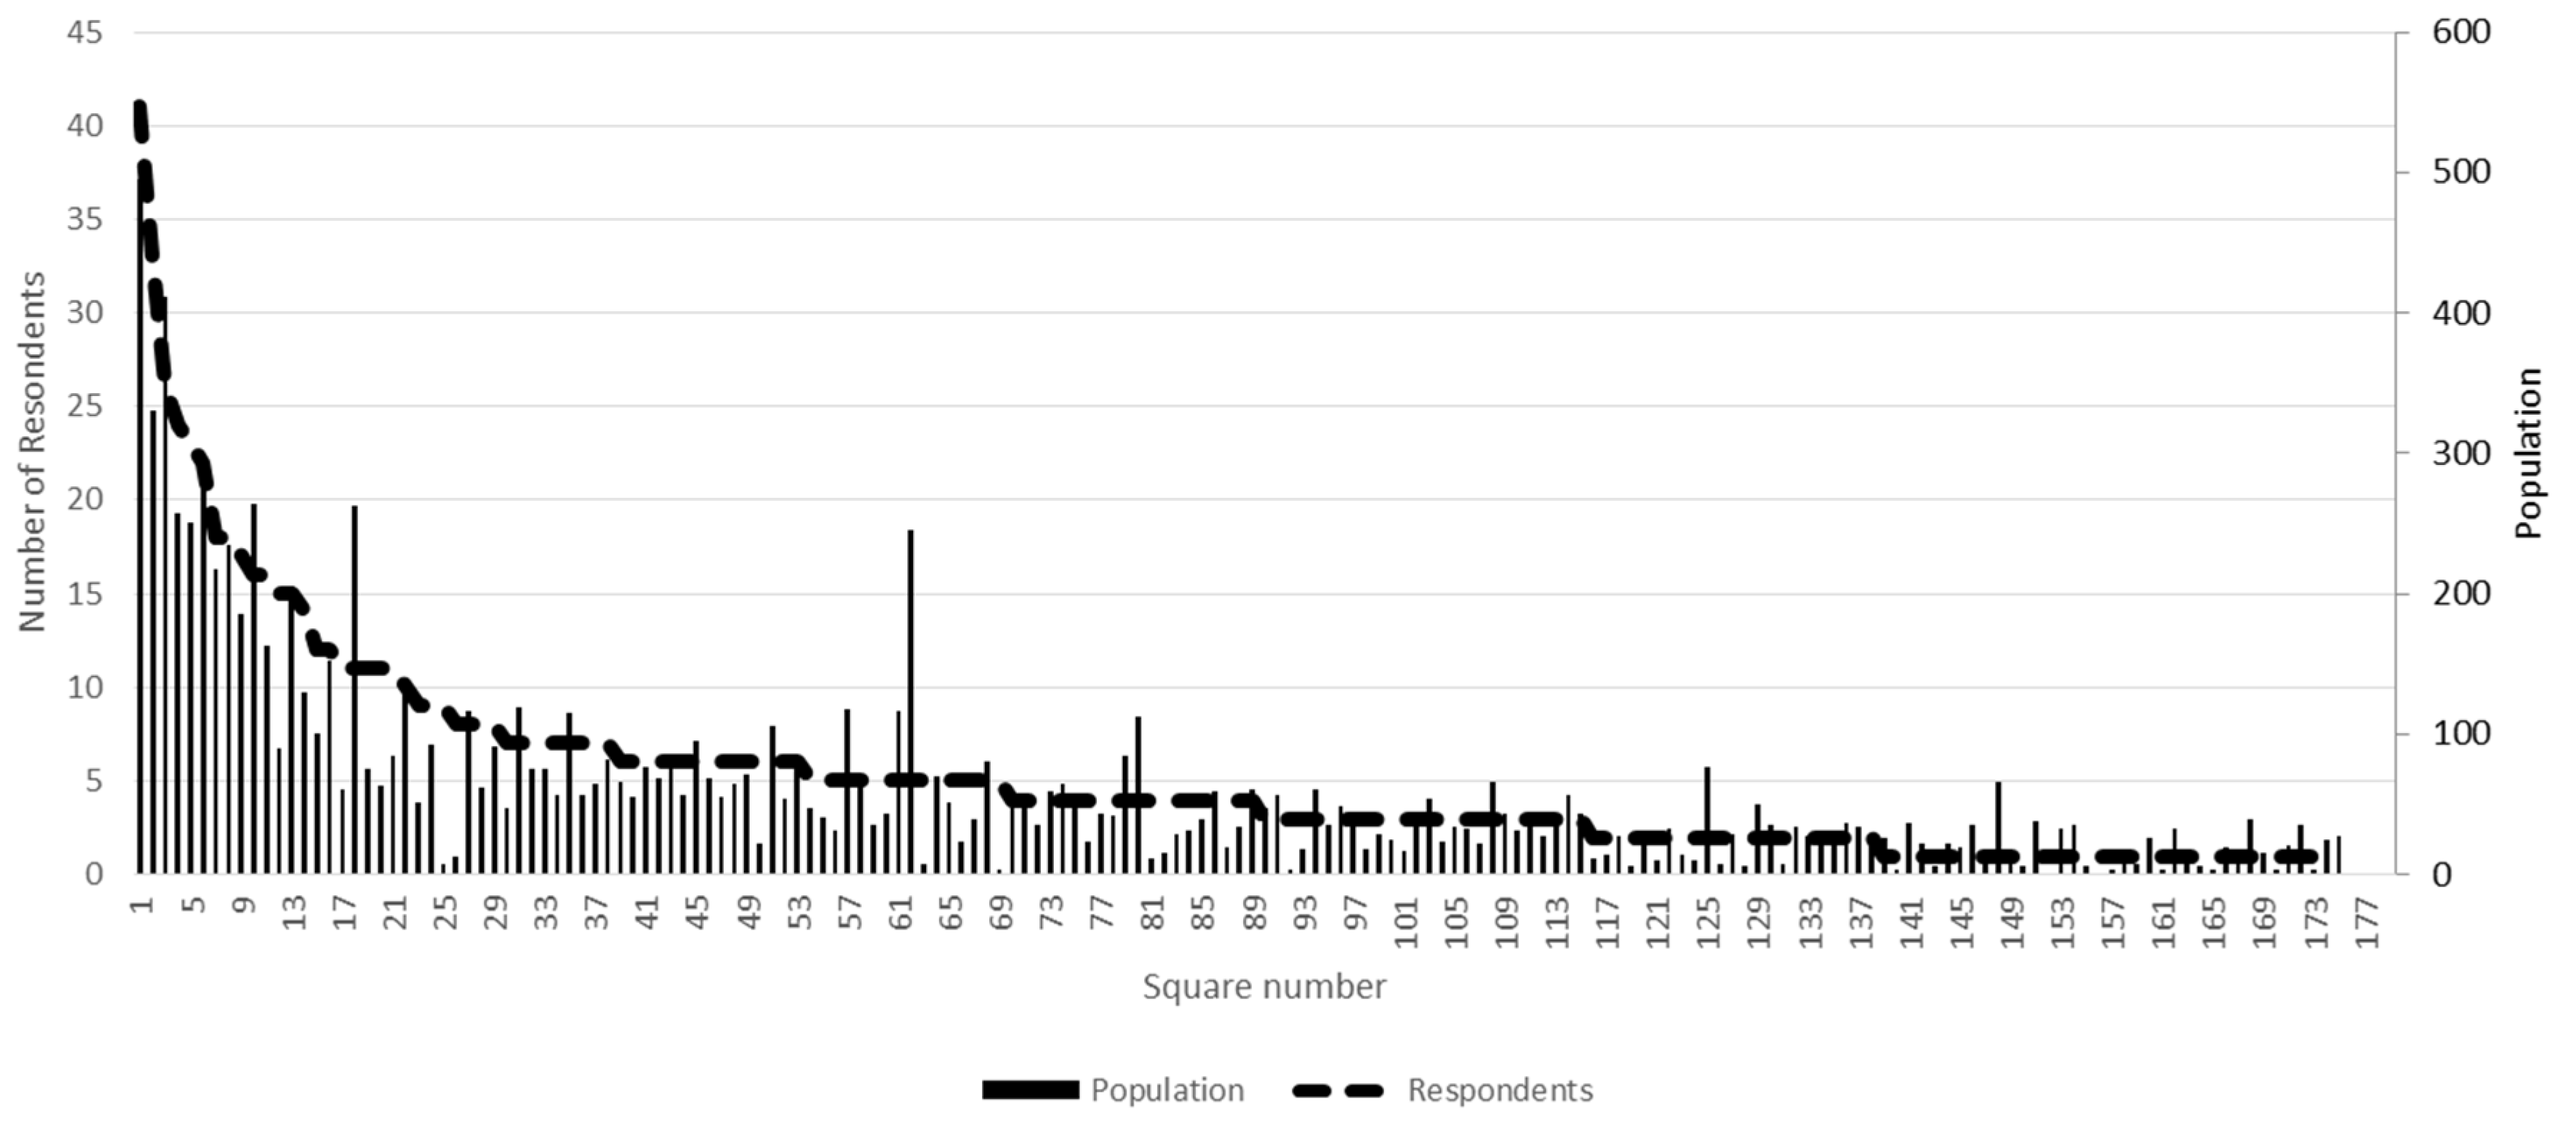
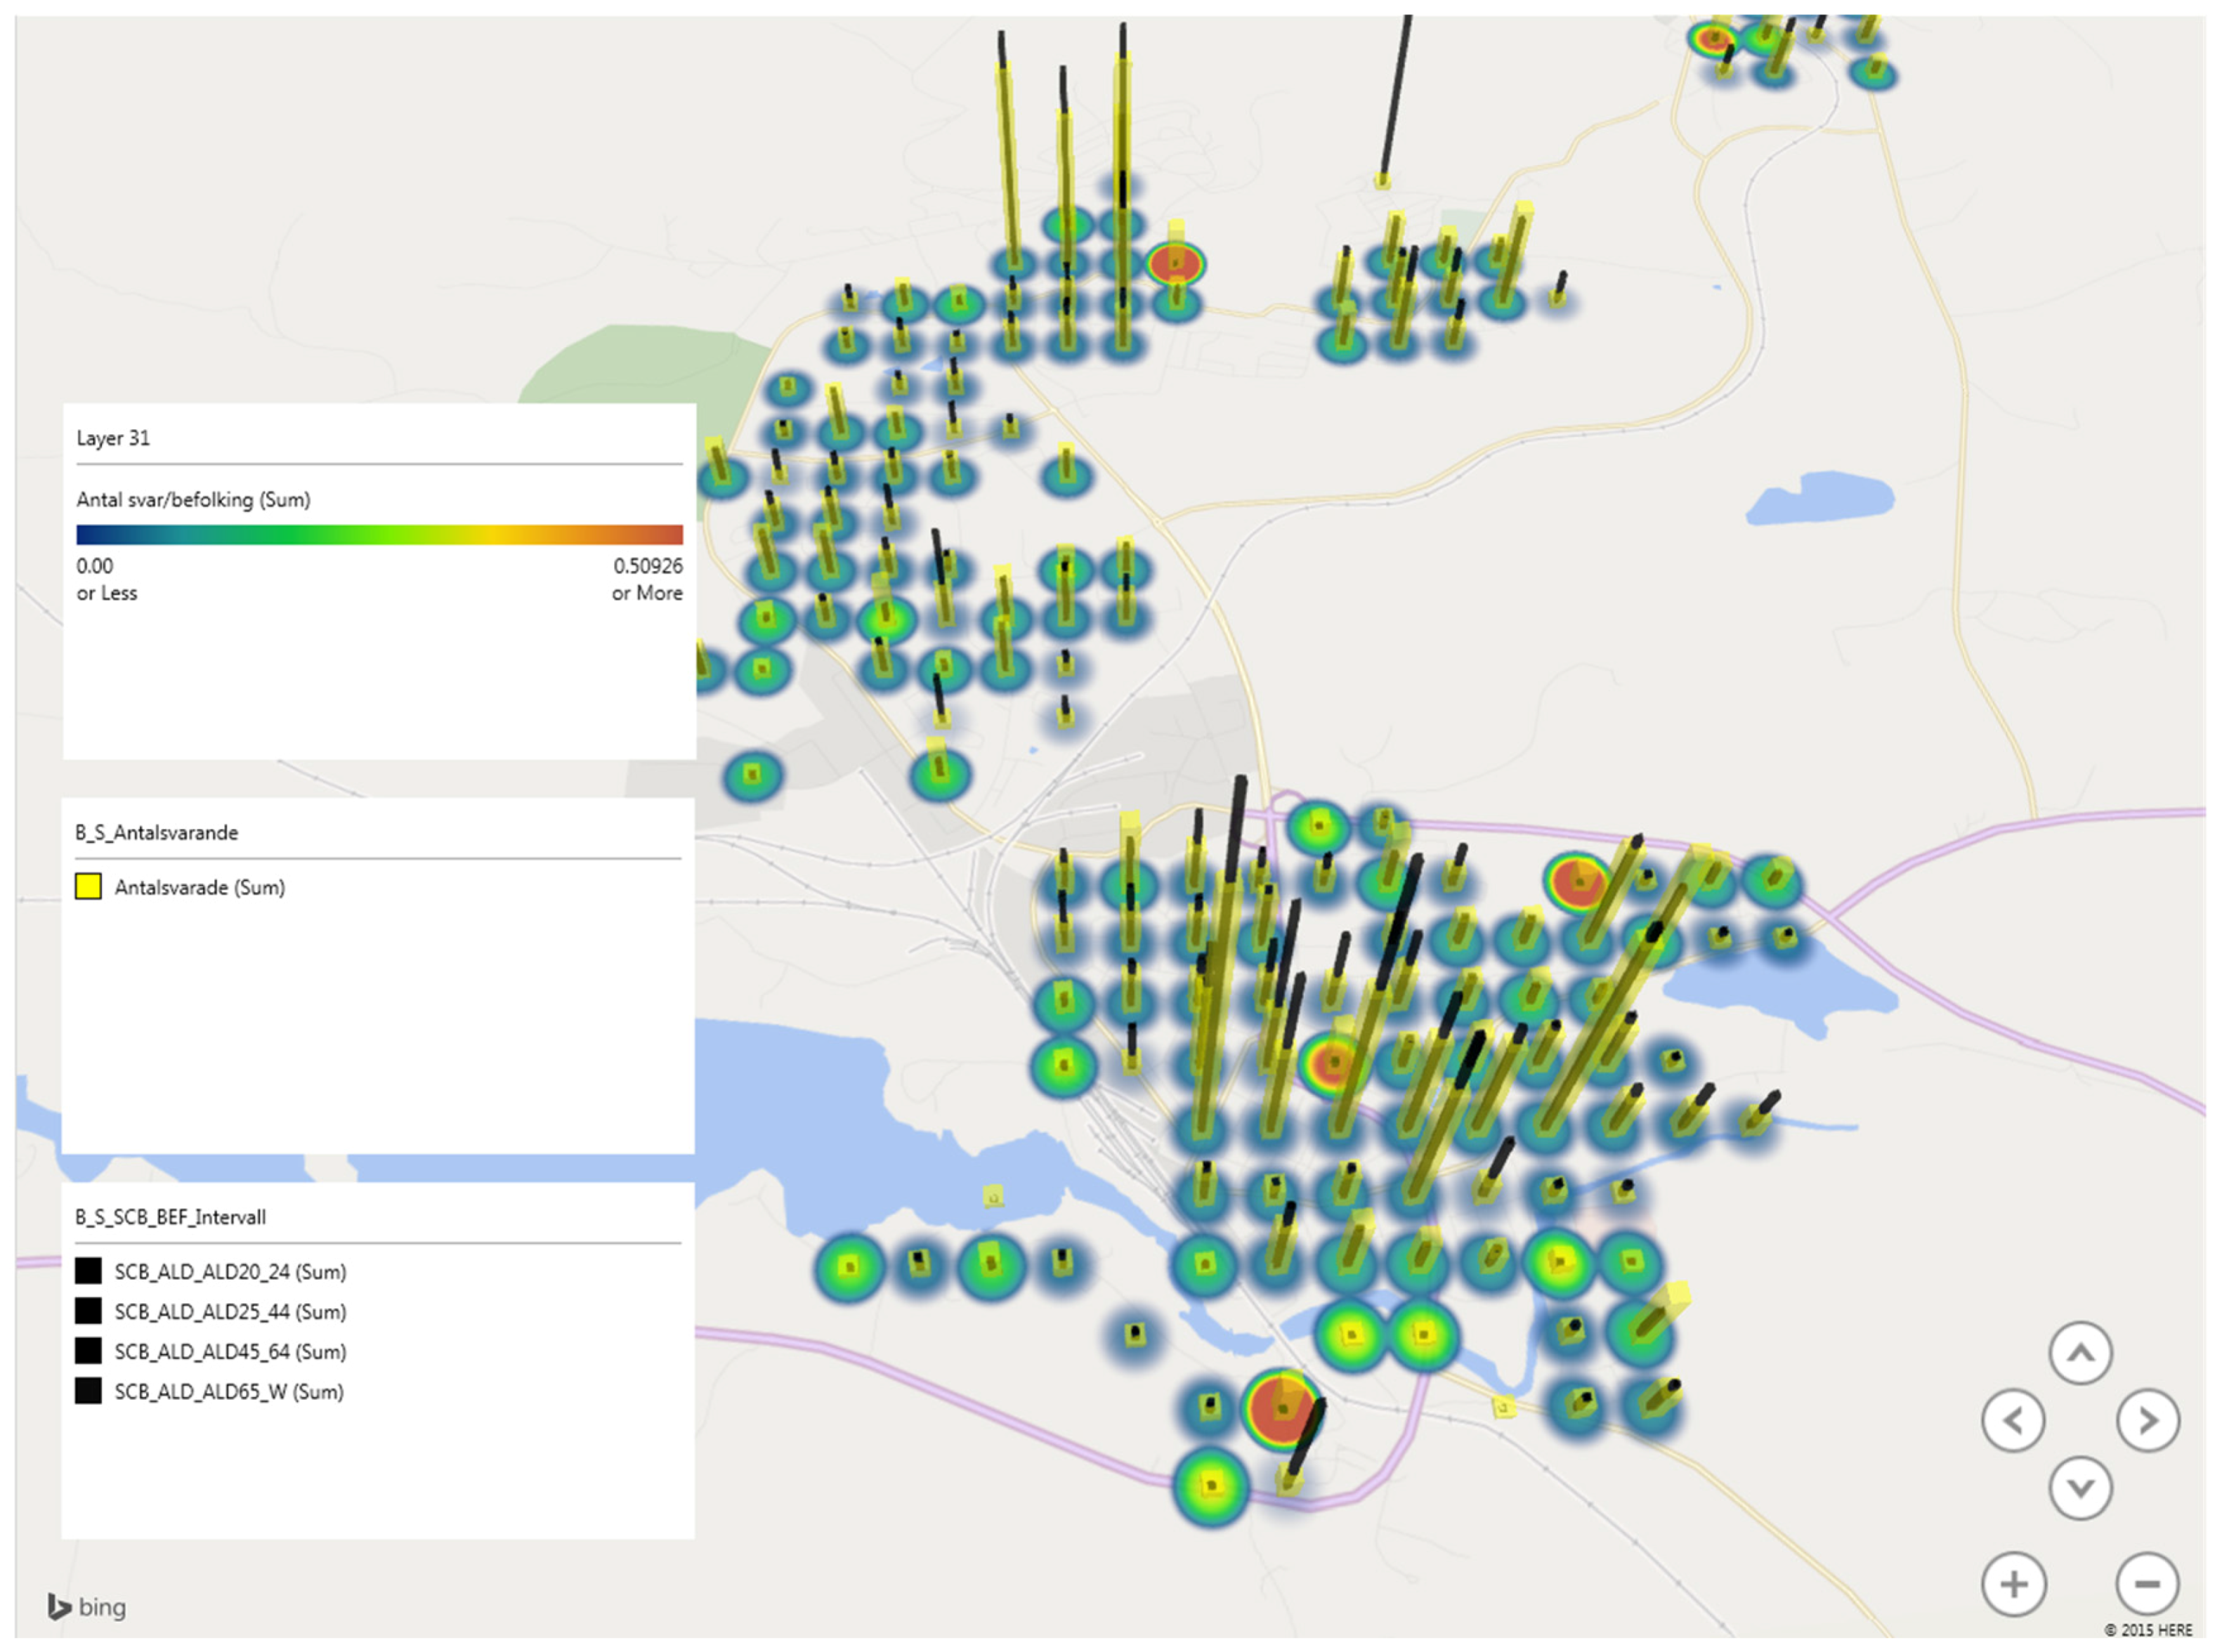
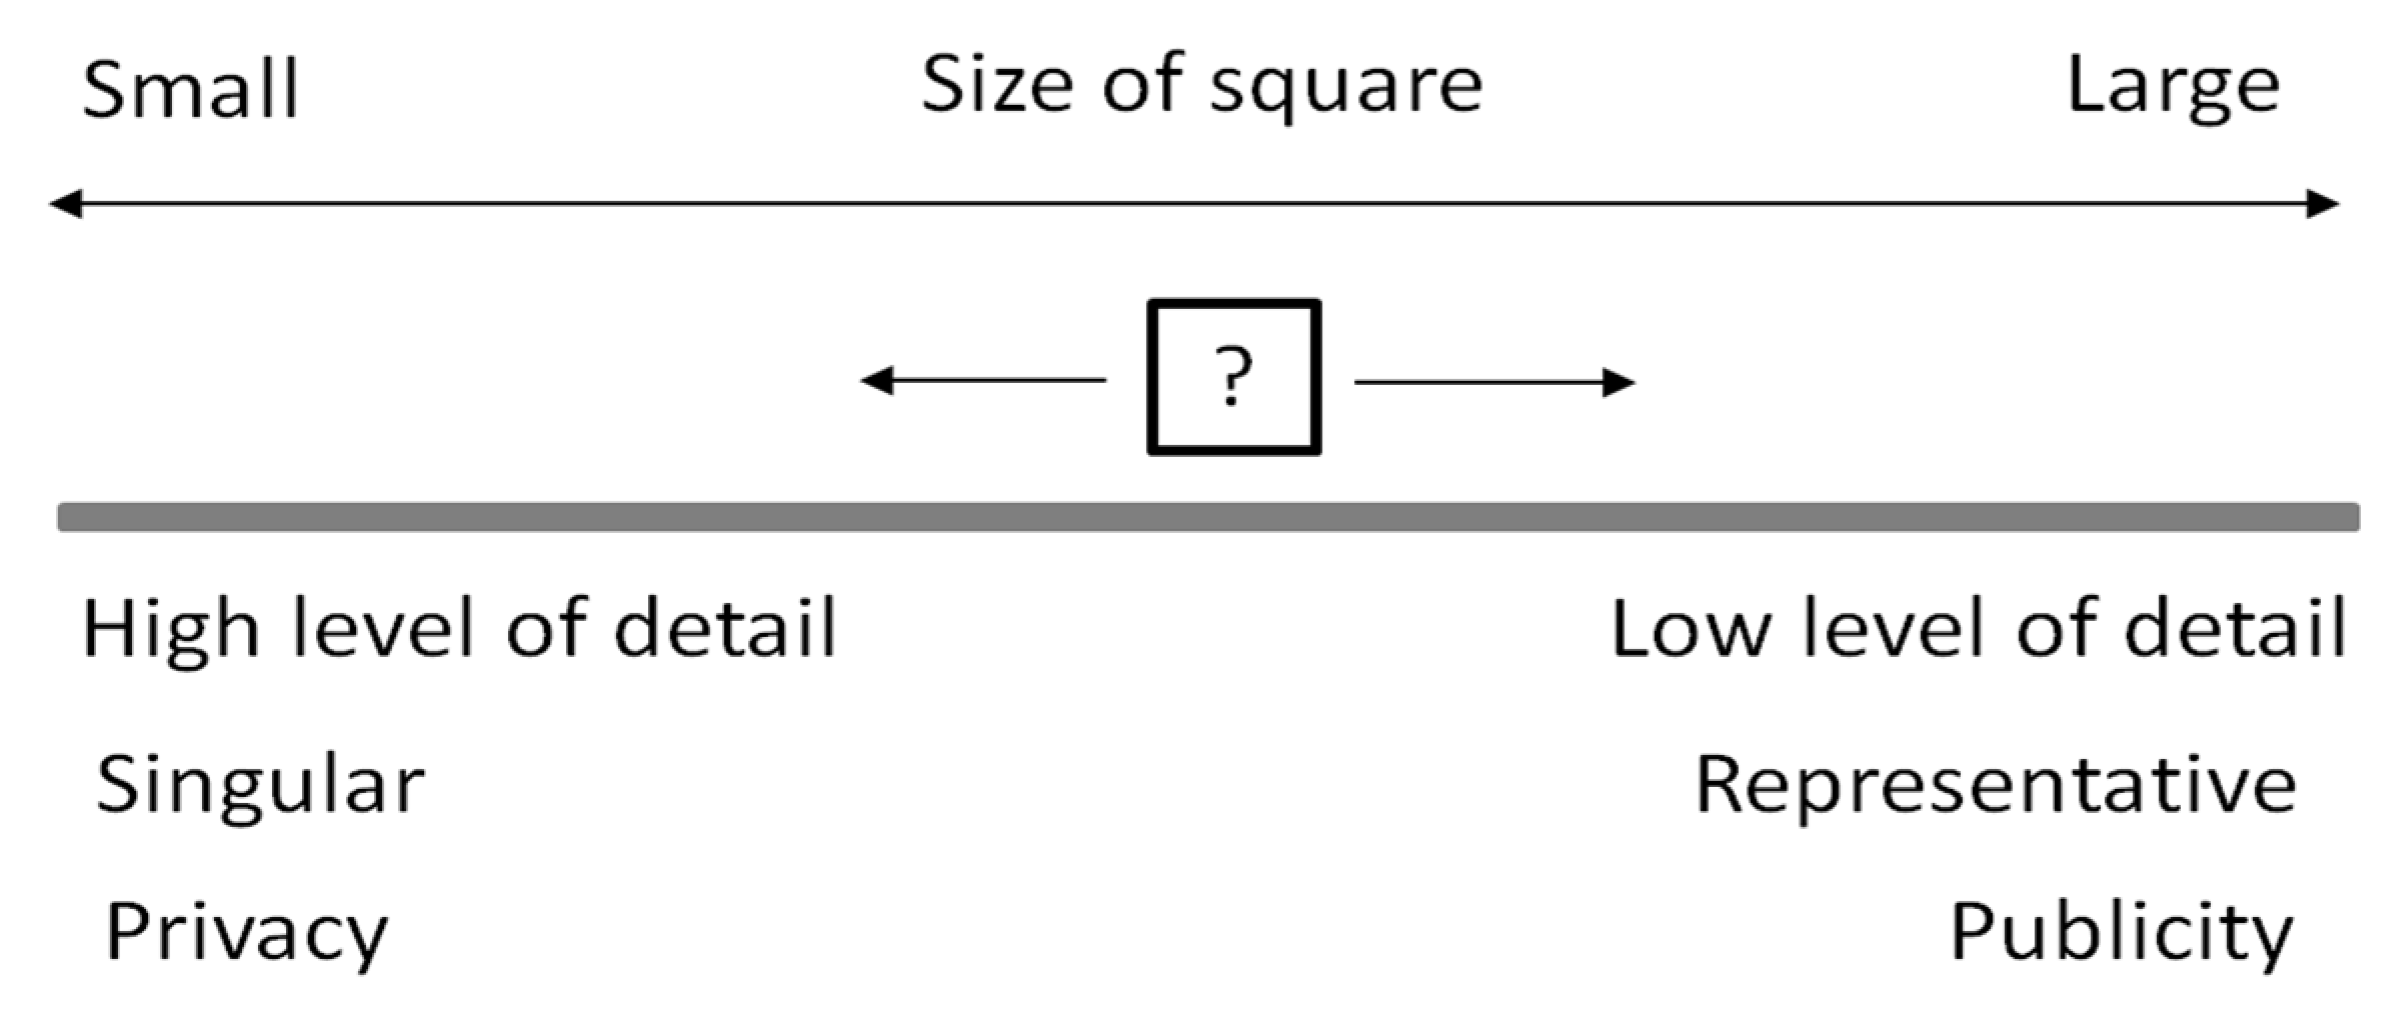
Spatial zones joins: Data were spatially joined to Statistic Sweden (SCB) demographic zones (which is important to ensure that no individual citizens can be identified). The aggregation of the respondents in SCBs demographic zones (squares) is illustrated in Figure 3. The resulting points were re-projected and converted to the LL84 geographic coordination system. Squares with a population smaller than 10 or 1–2 family (detached and semi-detached) home units less than 2 were filtered and removed from the map outputs due to privacy considerations. Finally, the coordinates were extracted and exported together with the SCB and survey data in order to use Microsoft Power Map (a Microsoft Excel add-on) as a visualization tool.
(3)
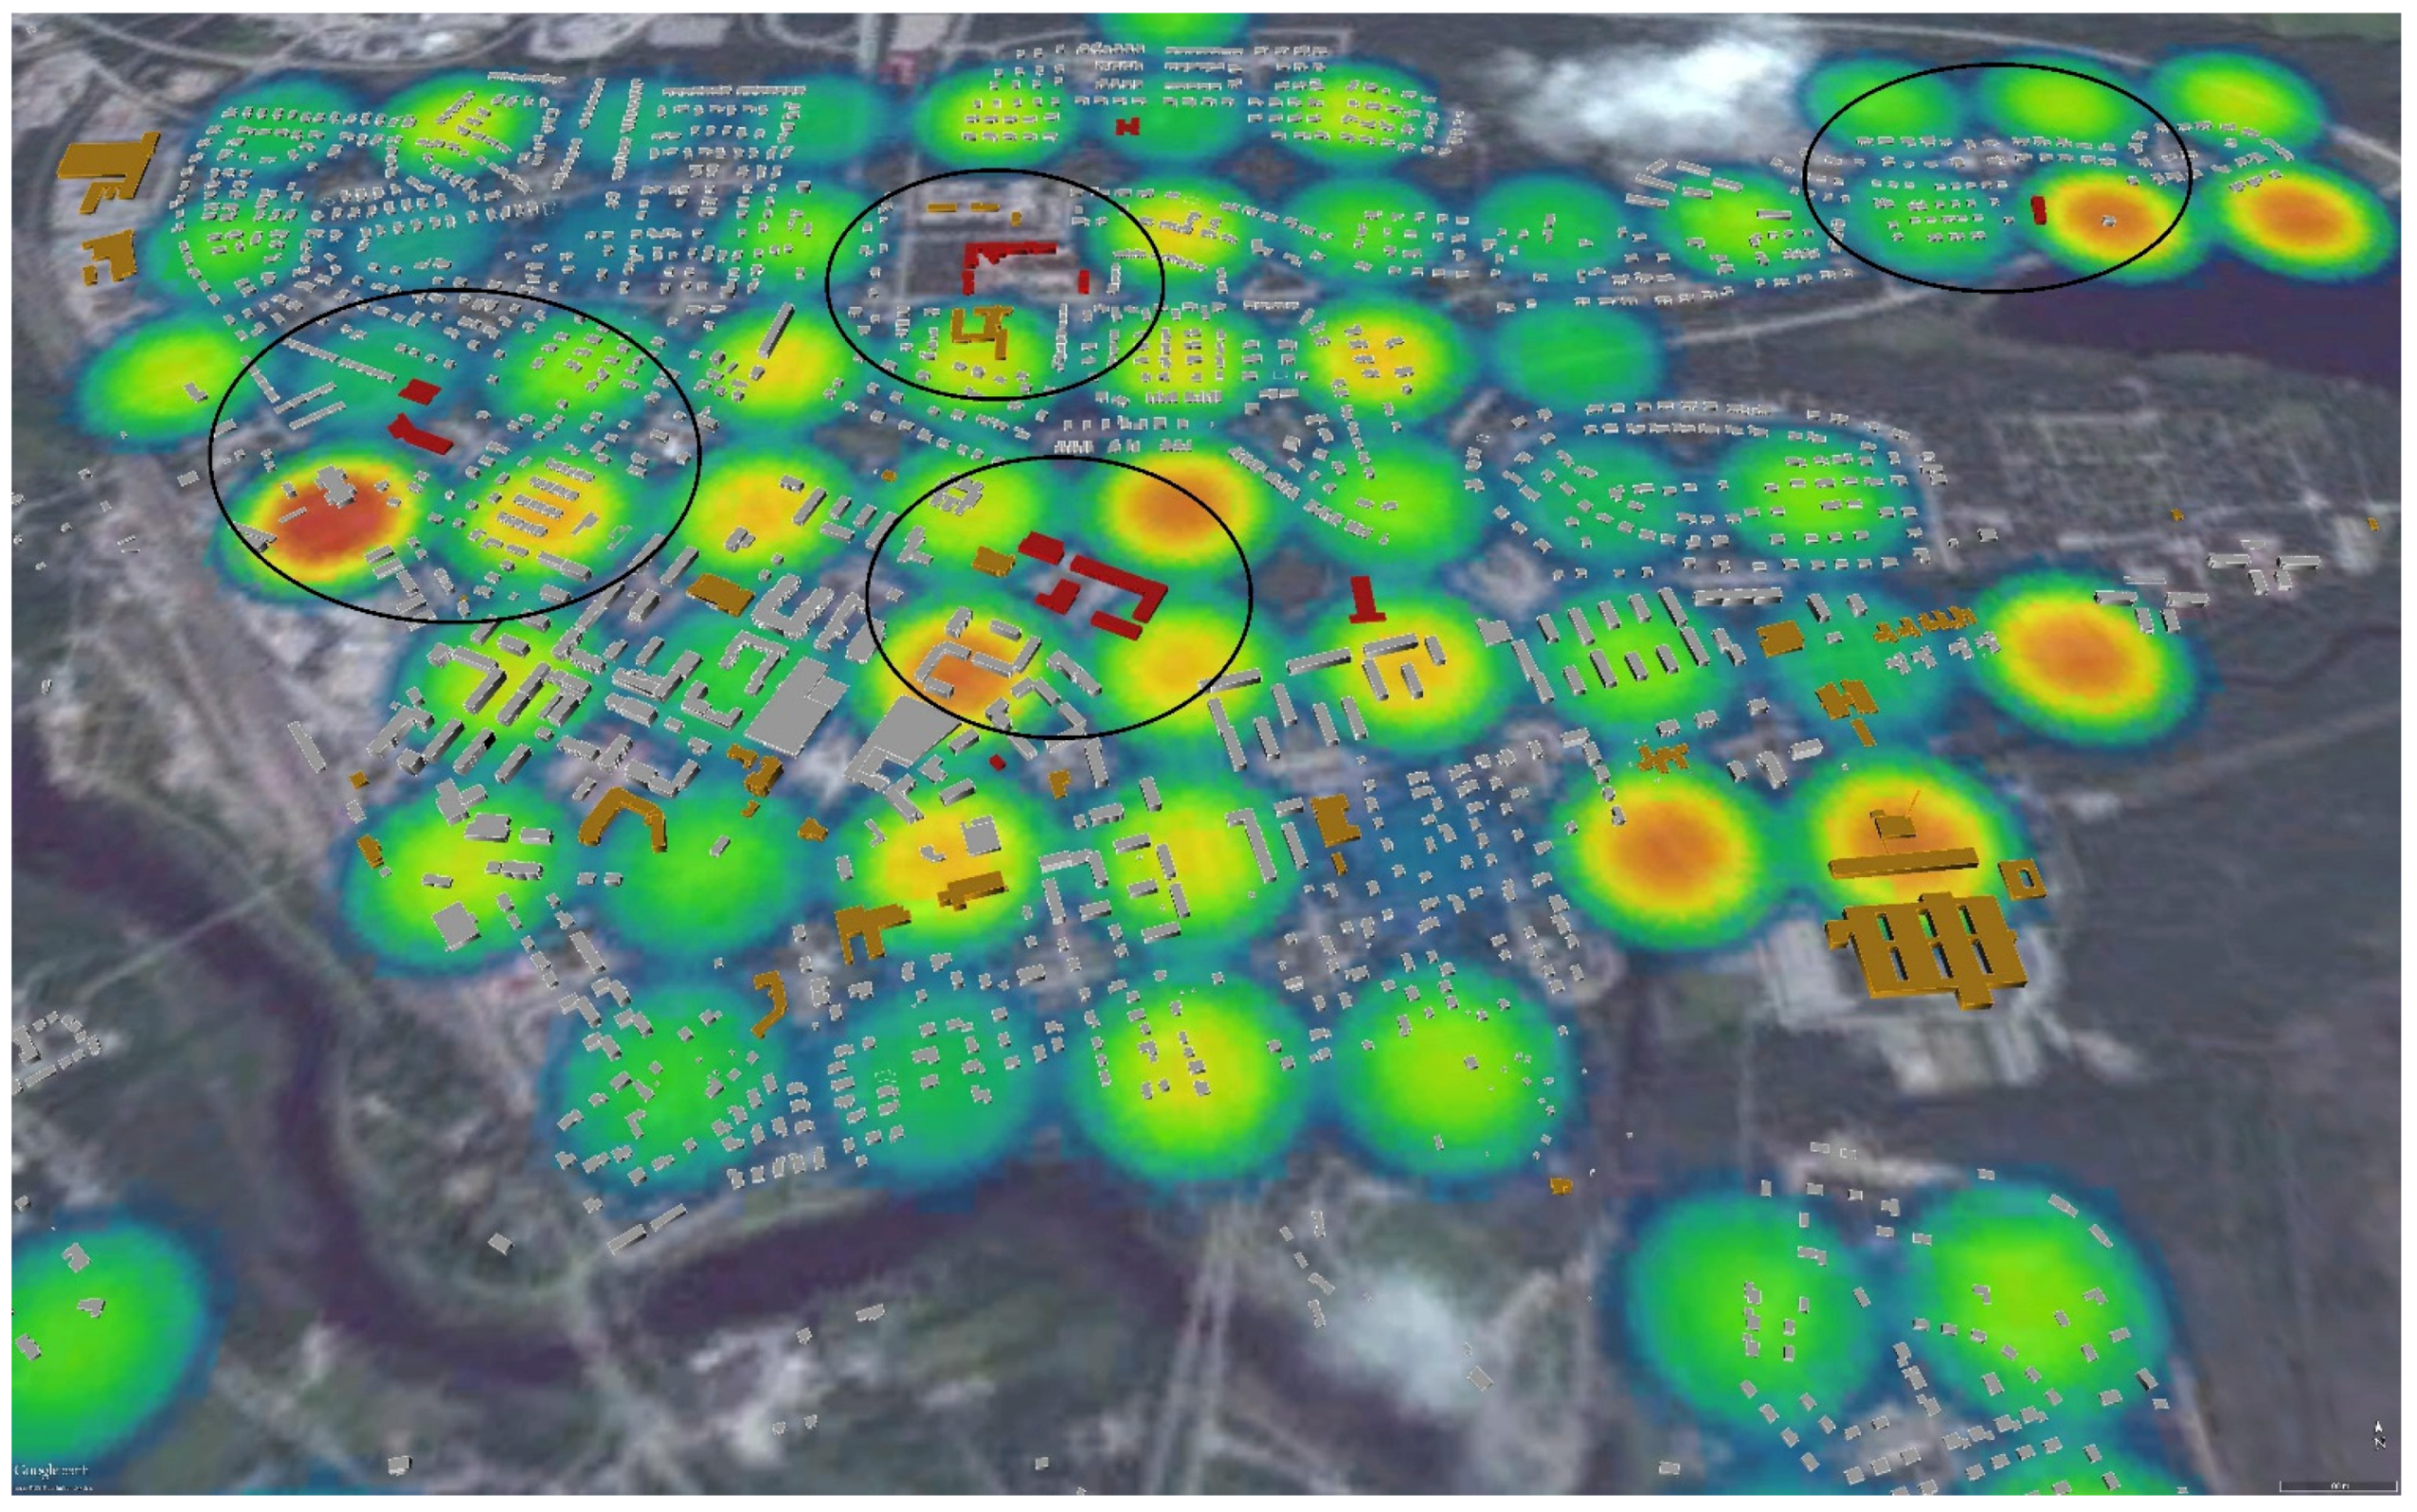
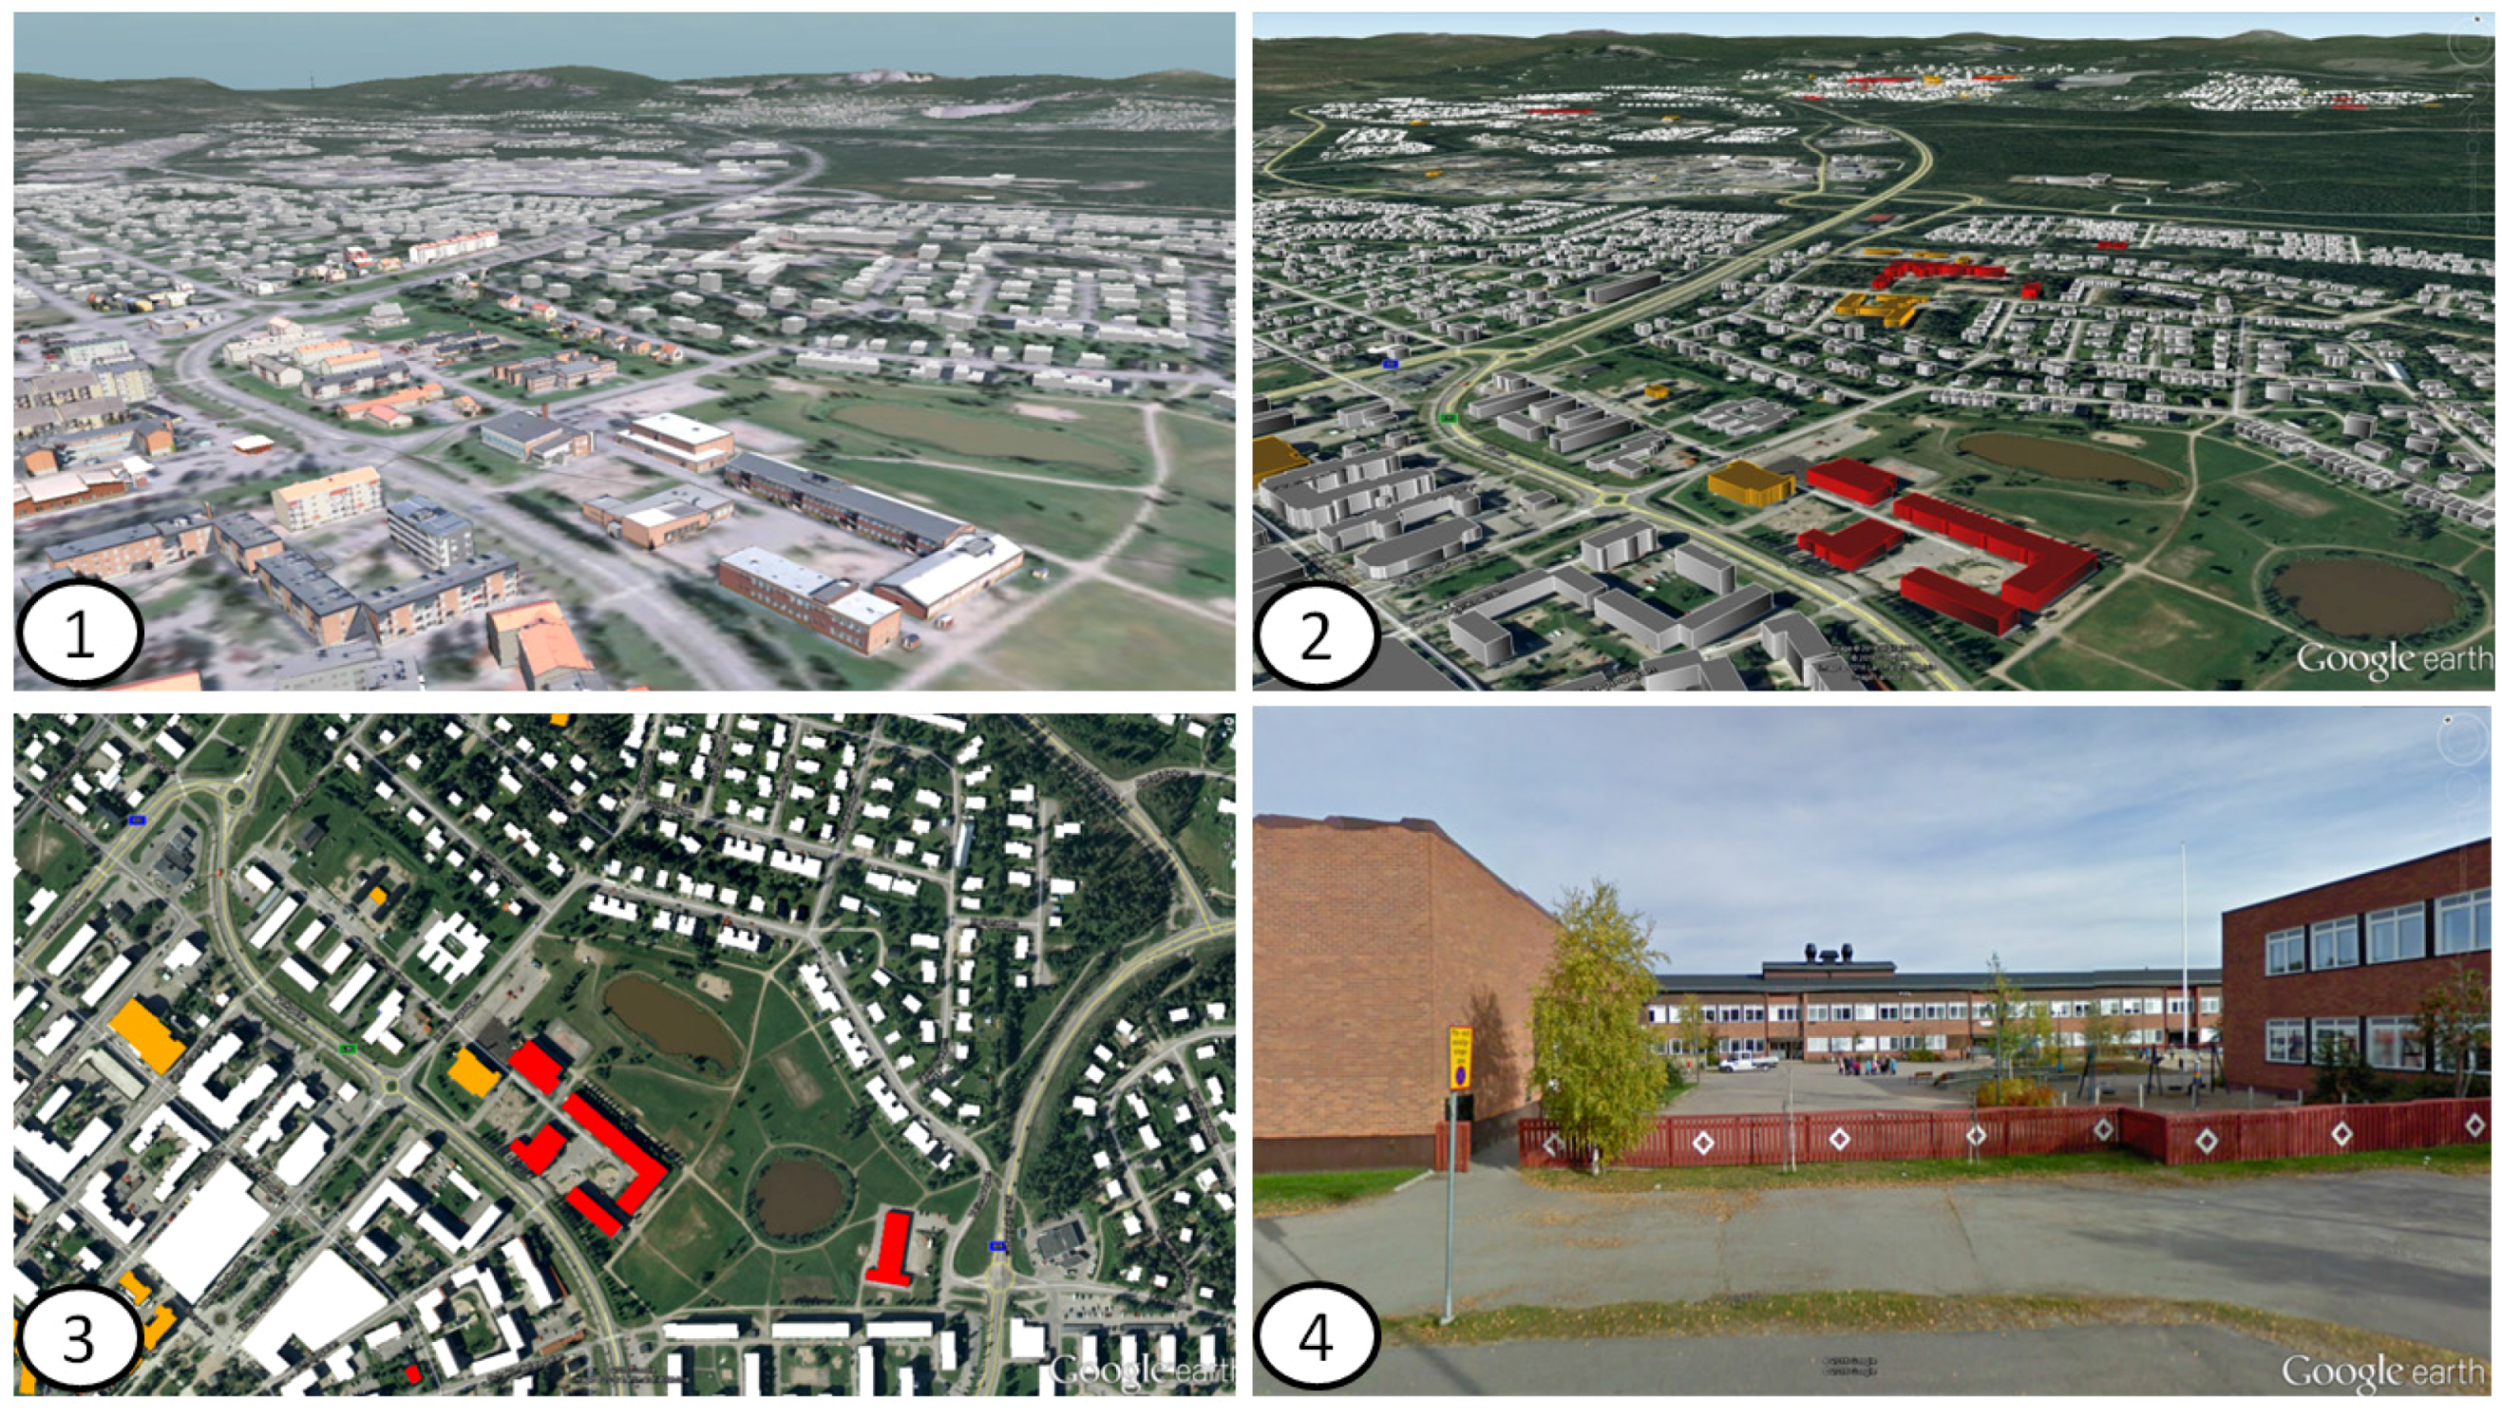
3D model creation: This step automatically processes and creates 3D buildings from aerial Lidar data by extracting point clouds of each building using the building footprint from the National Property map. The building height is then calculated as the different between the highest points (Lidar data) that lies within the footprint and the ground level (geotiff). The footprint are then extruded from the ground to its average roof height and colored according to buildings function, e.g., schools and hospitals. The ground height model provided by Lantmäteriet is available for the whole country. This implies that this kind of 3D model creation can be automated for all cities in Sweden.
(4)
Distance calculations: In this step, the nearest distance between roads and buildings polygons, and the address points of the respondents were automatically measured and stored as two distance attributes. Based on the distance attribute, two additional (Boolean (1 or 0)) attributes were created based on if they were within or outside the 200 meters zone, which were used in the statistical analysis.
(5)
Merging and model export: This is the step where the data were analyzed by the authors. SPSS was used for statically analyses (Step 6). Microsoft Excel/Power Map and Google Earth was used for visualization of the social values in 3D (Step 7).

3. Results and Analysis

The results were examined in Microsoft Power Map and Google Earth, as they offer good possibilities to visualize statistical data in 3D urban environments and abilities to iteratively modify both visualization settings and the data. Three types of visualization were used: heat maps, which are graphical representations of data where the individual values contained in a matrix are represented as colors; 3D charts in which heights of virtual bars are proportional to the values; and a 3D building model combined with heat maps to enable detailed analyses of certain districts.

3.1. Survey Geo-Validation

As shown in Figure 4, there was a strong correlation between the population density and number of respondents in the 250 m × 250 m squares. The percentage of the population of the city centers of Gällivare and Malmberget covered by spatially mapped data in dataset 5 was 8.5%. The total number of respondents in the same dataset covered 11.5% of the total population of the municipality as a whole, including the rural parts that are not part of the visualization model. However, the number of respondents per square was relatively low; only 22 (14.5%) squares had more than 10 respondents. The largest deviation from the average percentage was in squares with just 1–2 respondents (6.5%).
The numbers of respondents were also plotted, with population density, using a 3D model to visualize their spatial distribution in the city, as illustrated in Figure 5. Here, the number of sets of responses is shown in yellow, total population in black and the ratio between them in a heat map (red indicating a high ratio and blue a low ratio of responses to population density). Figure 5 confirms the correlation between the population density and frequency of responses. However, it also shows that the strongest local variations in the ratio are in areas where there are large variations in population density between neighboring squares, for instance zones where multi-family buildings are adjacent to 1–2 family (detached and semi-detached) home units. Furthermore, it shows that the ratio is highest in areas that are the most lightly populated, often in the outskirts of the city.

3.2. Analysis of Socio-Spatial Patterns

This section presents an analysis of the socio-spatial patterns visualized by mapping the indices based on respondents’ expressed perceptions described in the data collection section regarding the Built environment, Personal finance, Social inclusion, and Public services.

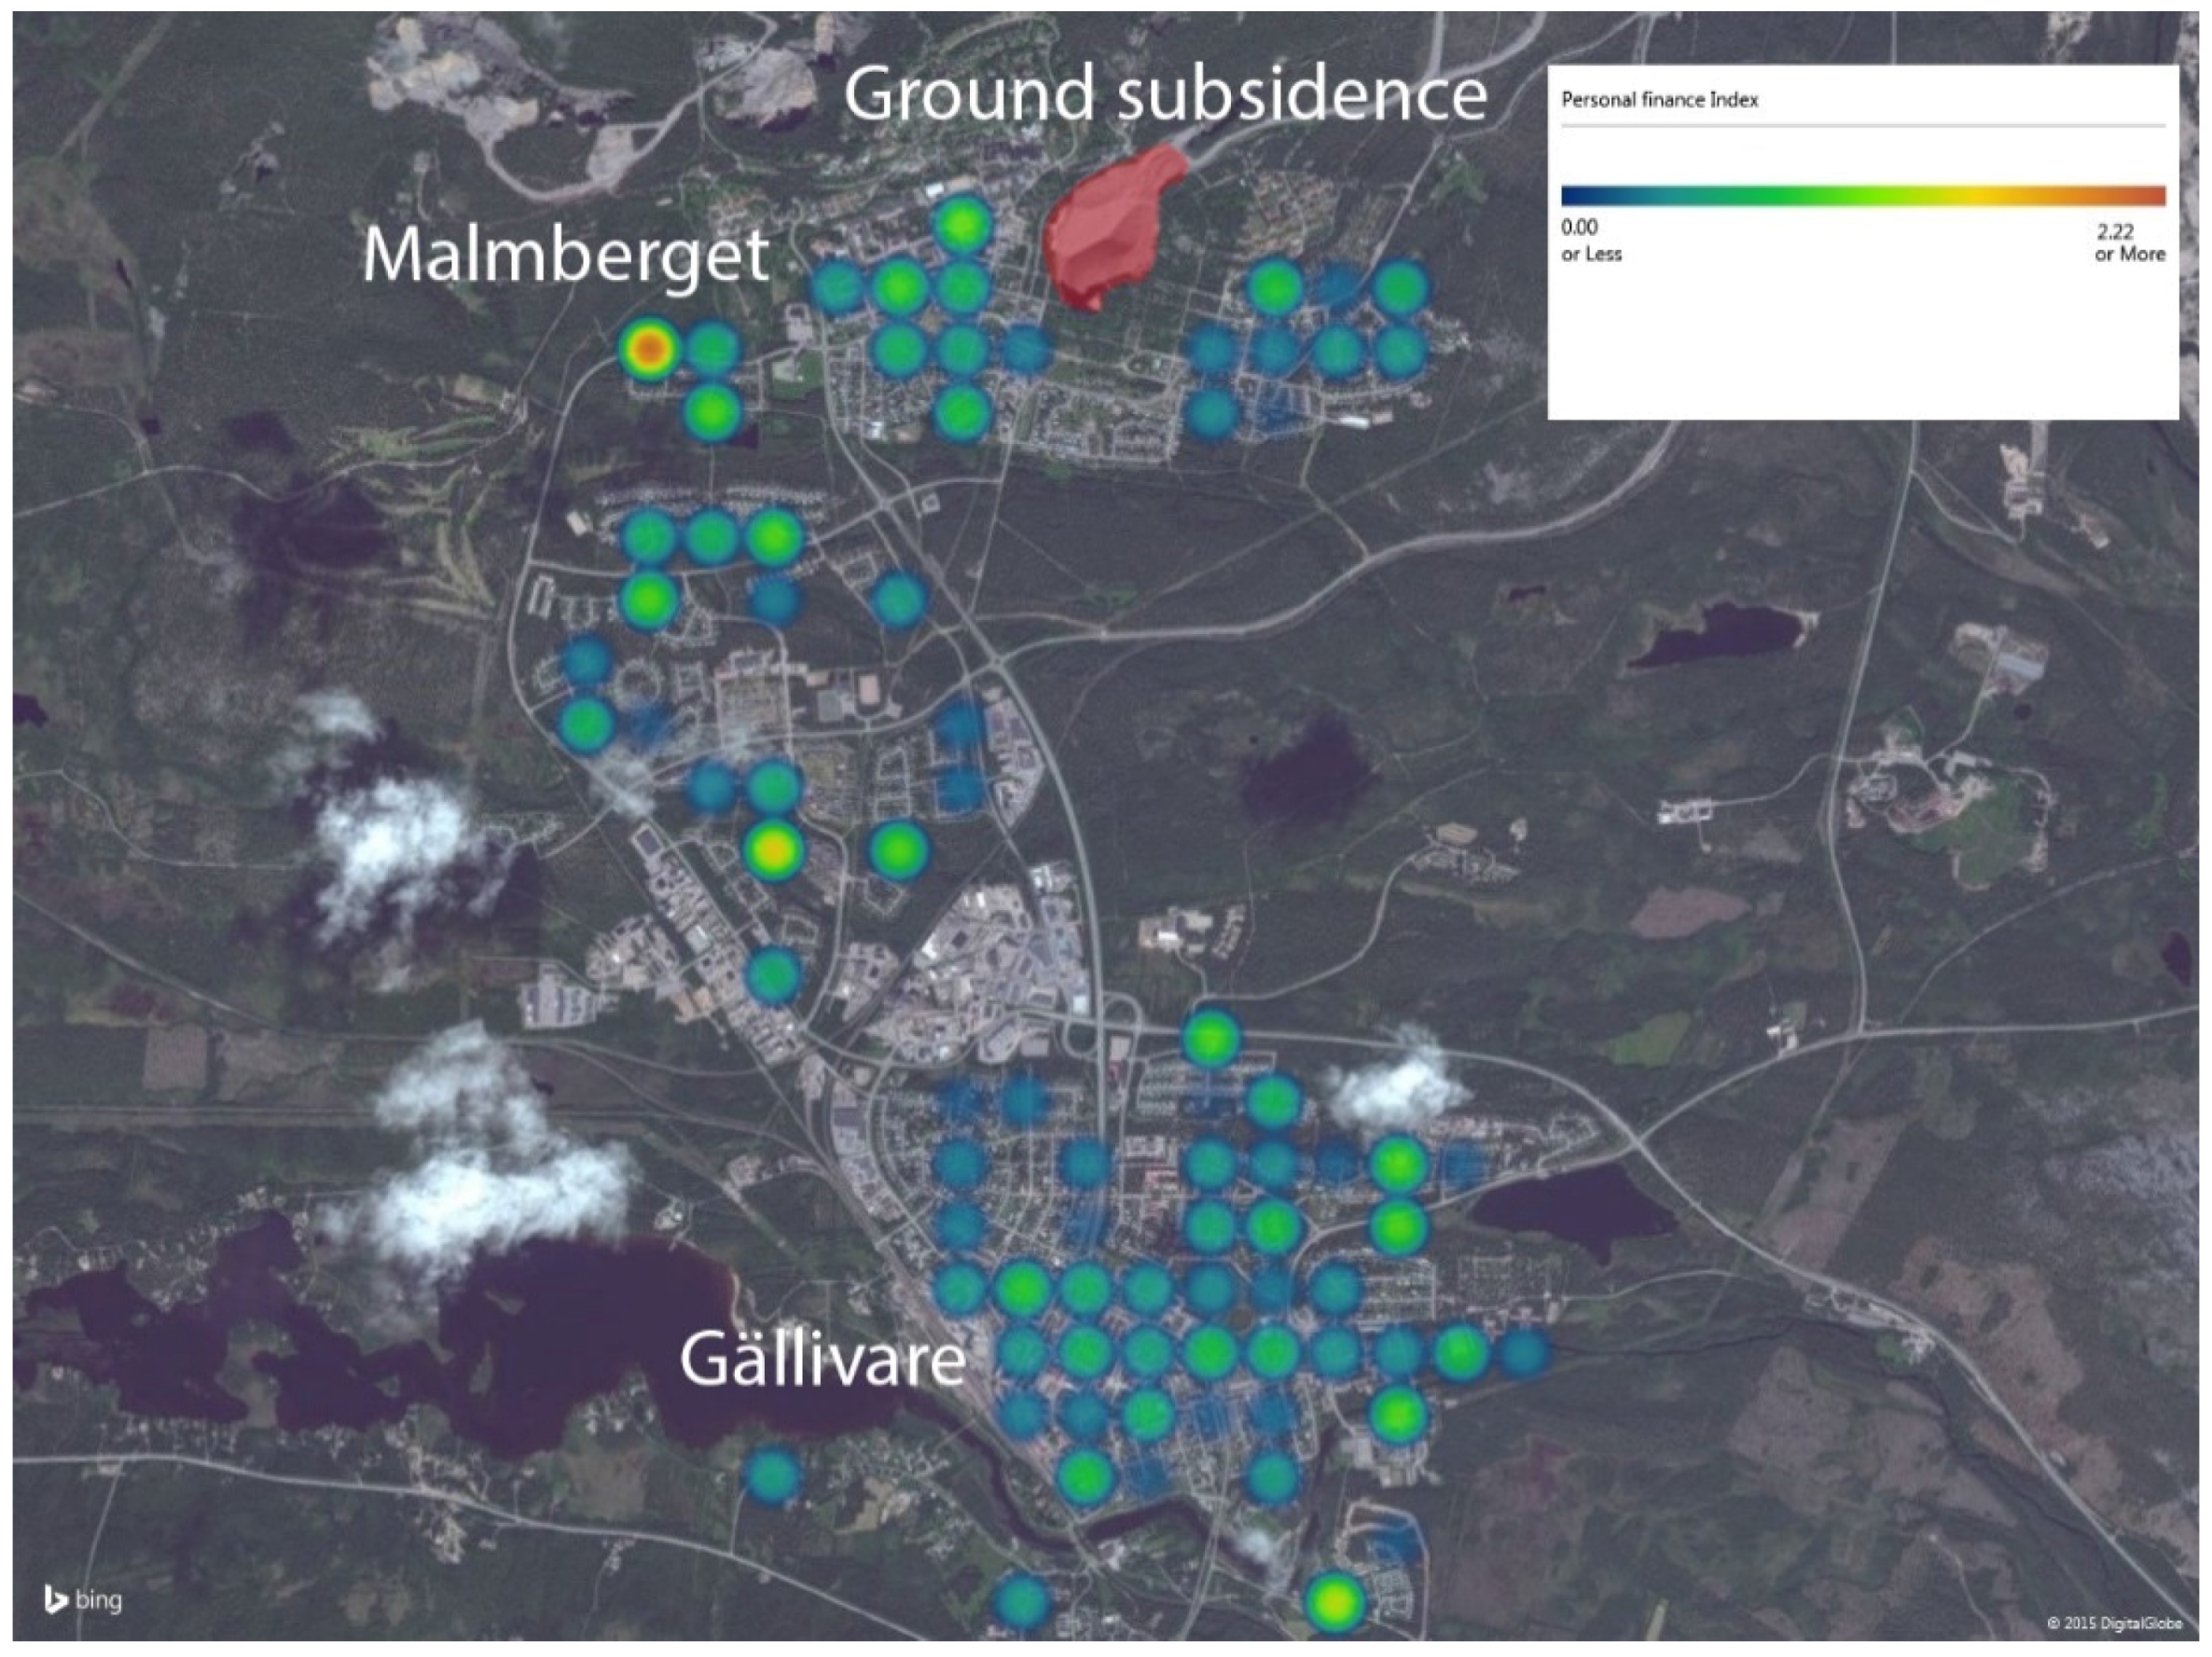
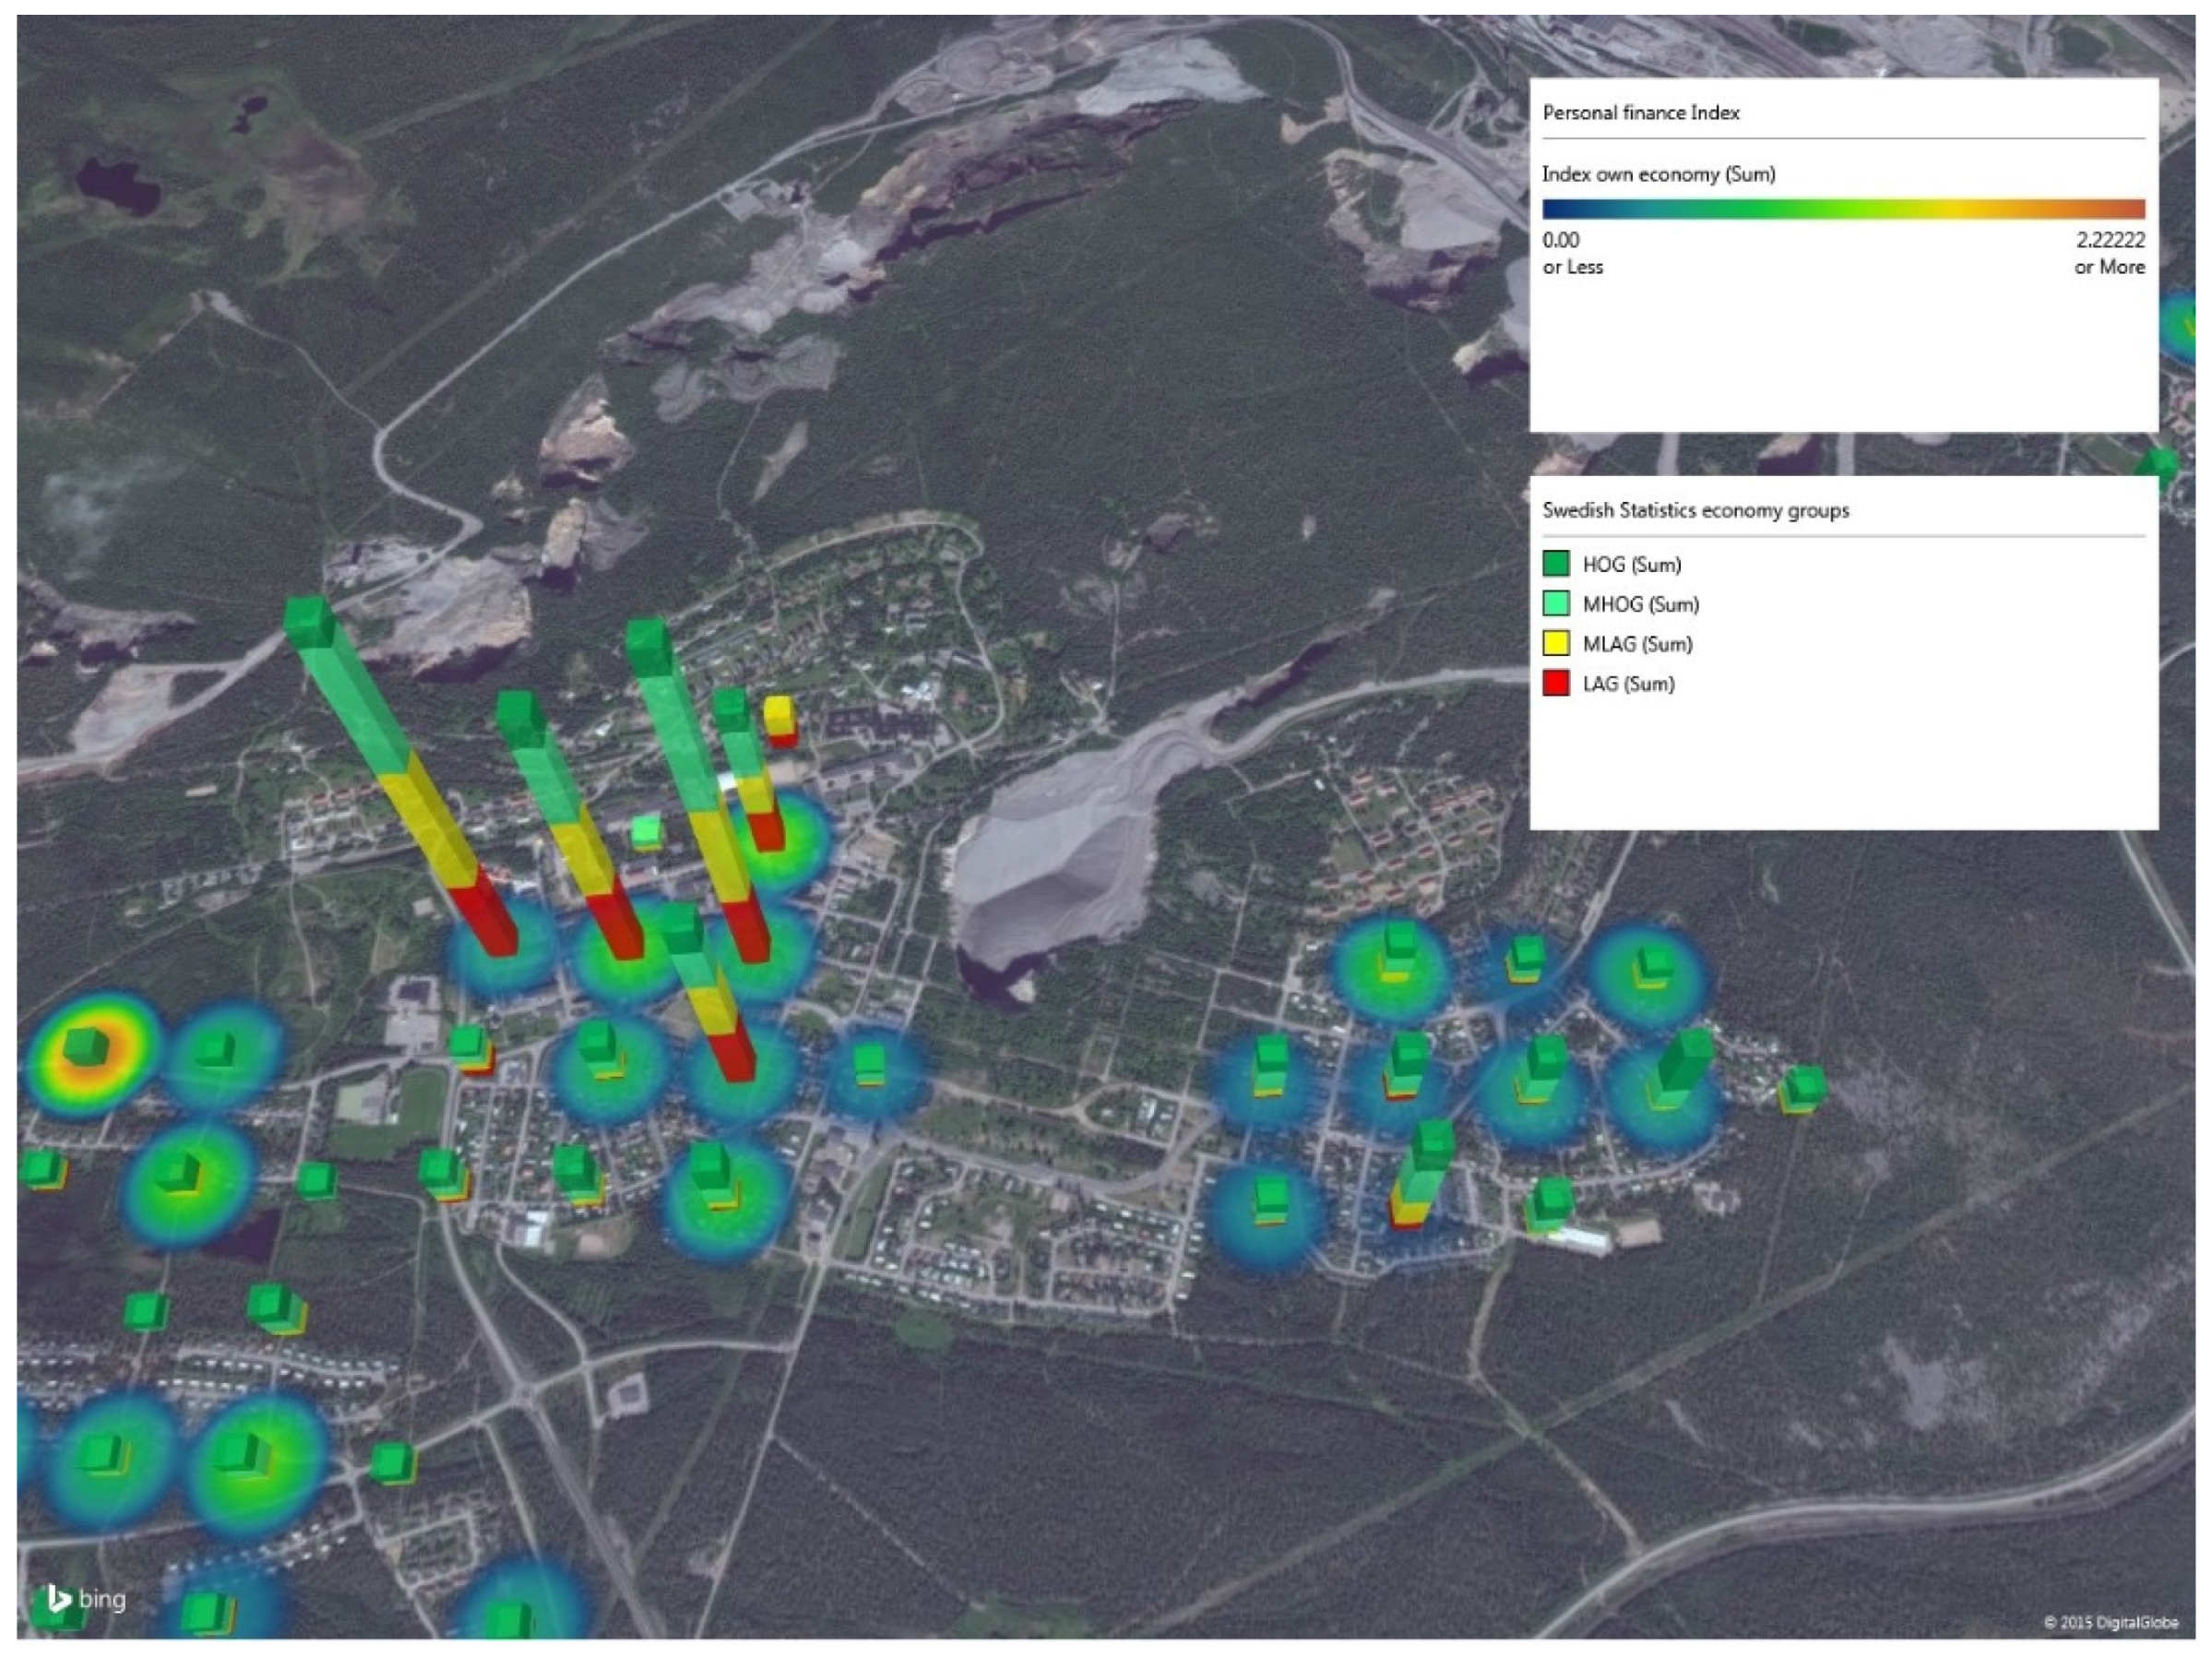
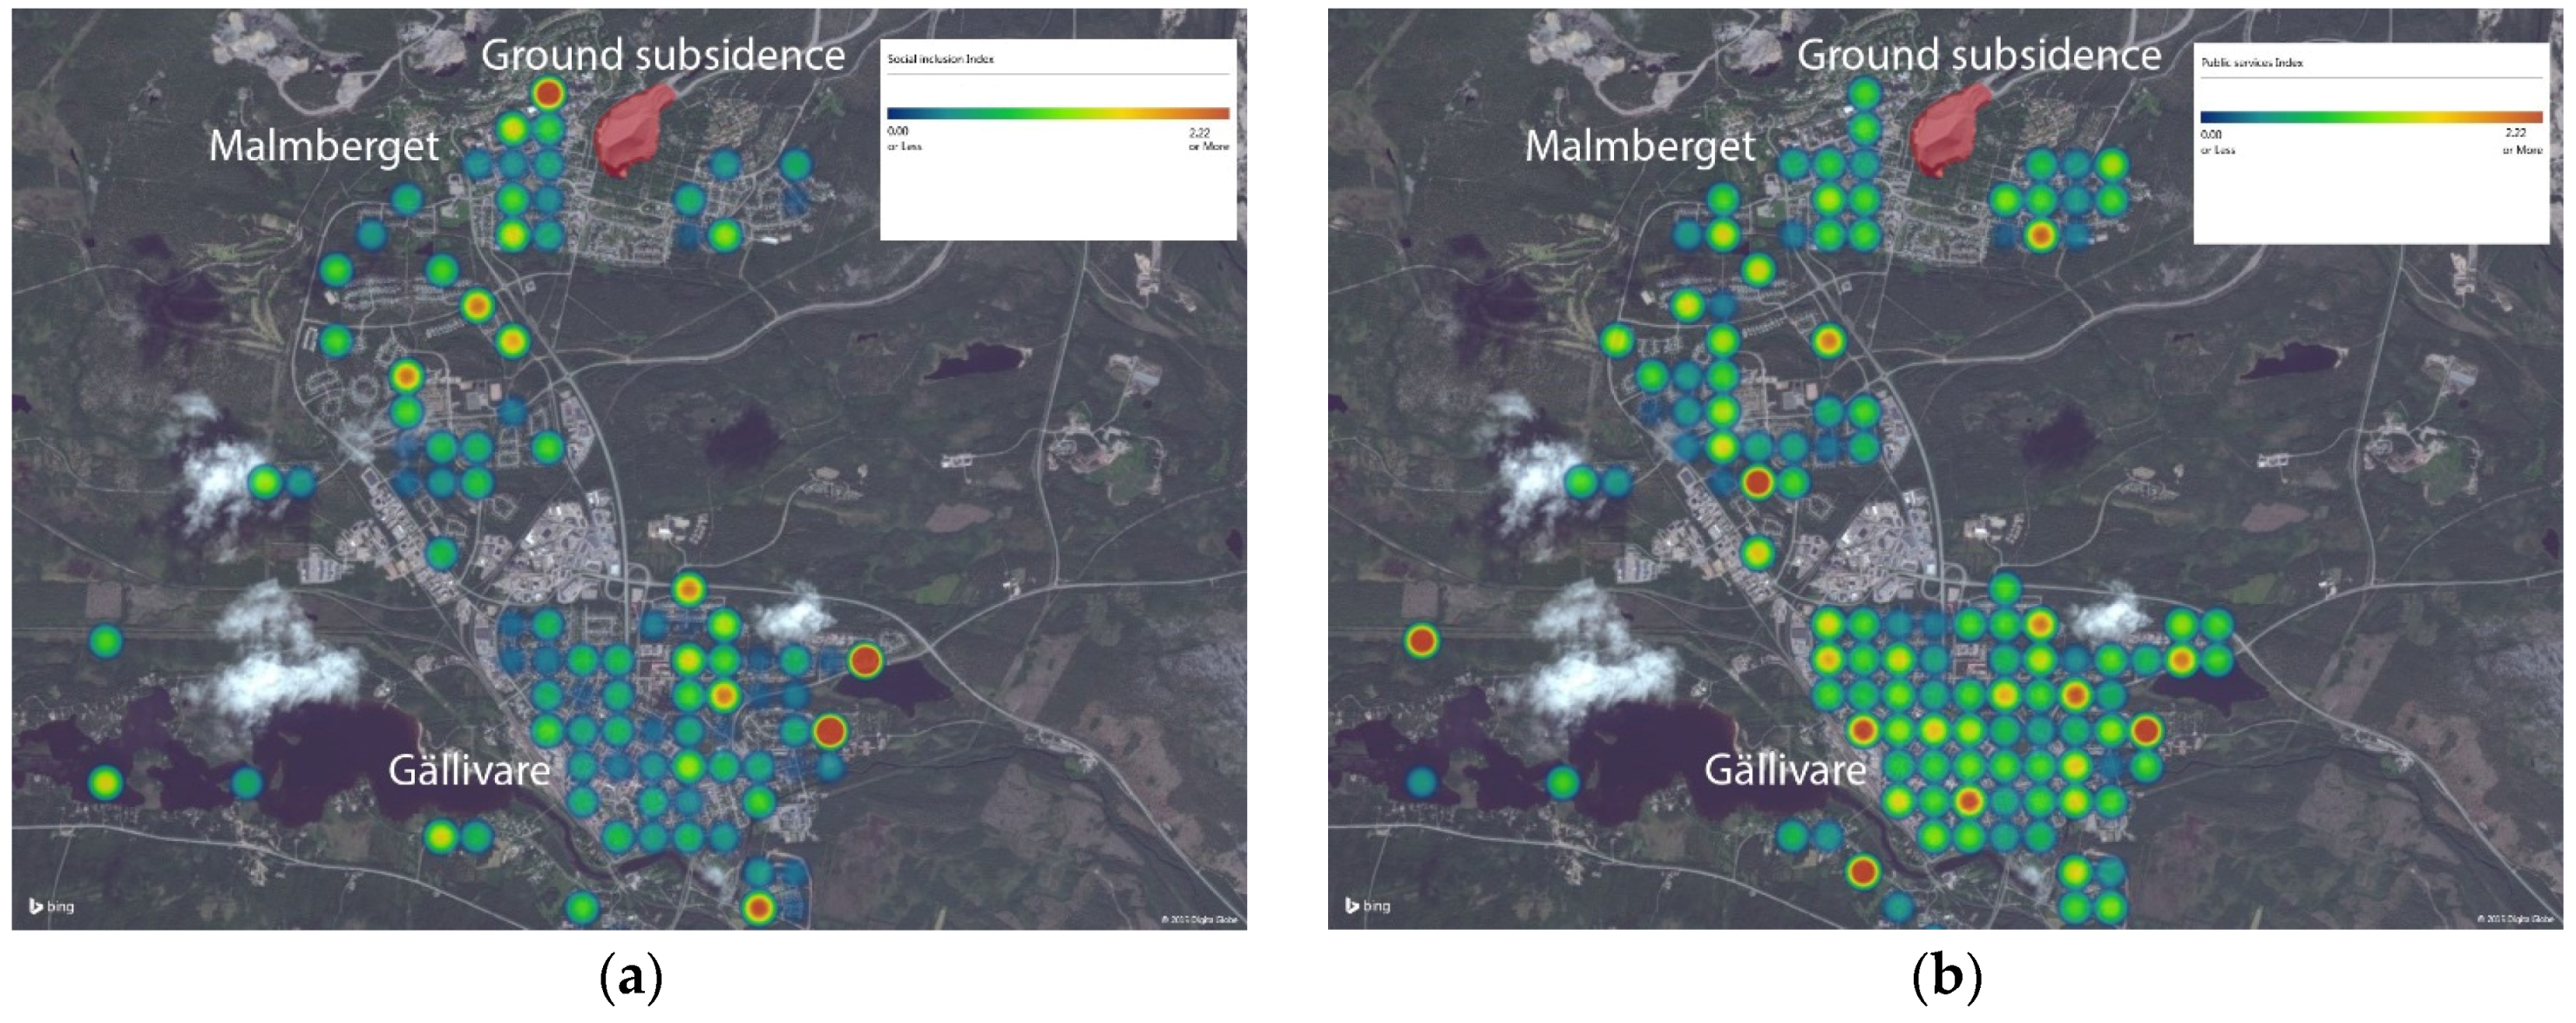
3.2.1. Personal Finance, Social Inclusion and Public Services

There were generally small differences in Personal finance scores among the 250 m × 250 m squares (dataset 6, Table 1) in Malmberget and Gällivare, as indicated in Figure 6. However, groups least satisfied with their financial circumstances resided in areas of the city centers of both Gällivare and Malmberget with multi-family buildings. The population in these areas also had the highest proportion of low income households, as indicated in Figure 7 (although these districts also had high ratios of high income households). Thus, unsurprisingly, the respondents’ satisfaction with their financial status (dataset 1, Table 1) appears to be strongly influenced by their income. Attitude variables were originally used by Jakobsson and Segerstedt [40] to address social inequalities in the areas with high income; thus, these results can be seen as a contextualization of the survey data.As can be seen in Figure 6 and Figure 7, there is no clear correlation between spatial distributions of high financial (dis)satisfaction and affluent or low-income areas. These maps indicate that this urban environment was not strongly segregated at the time of the data collection, and planners could use the visualization to monitor risks of demographic changes and the urban transformation increasing segregation. The model also shows strong similarities in spatial patterns of Built environment scores (indicating satisfaction with the urban environment) and Personal finance scores. Notably, 20% (36/176) of the squares (mostly in the city centers) have higher than average means for both of these indices. There are no clear spatial patterns in the Social inclusion and Public services index scores, except that the people in the outskirts of the city tended to be least satisfied in these respects (Figure 8a,b). The findings indicate that planners should focus efforts to engage citizens in these areas in participatory dialogues in order to improve satisfaction with the built environment.

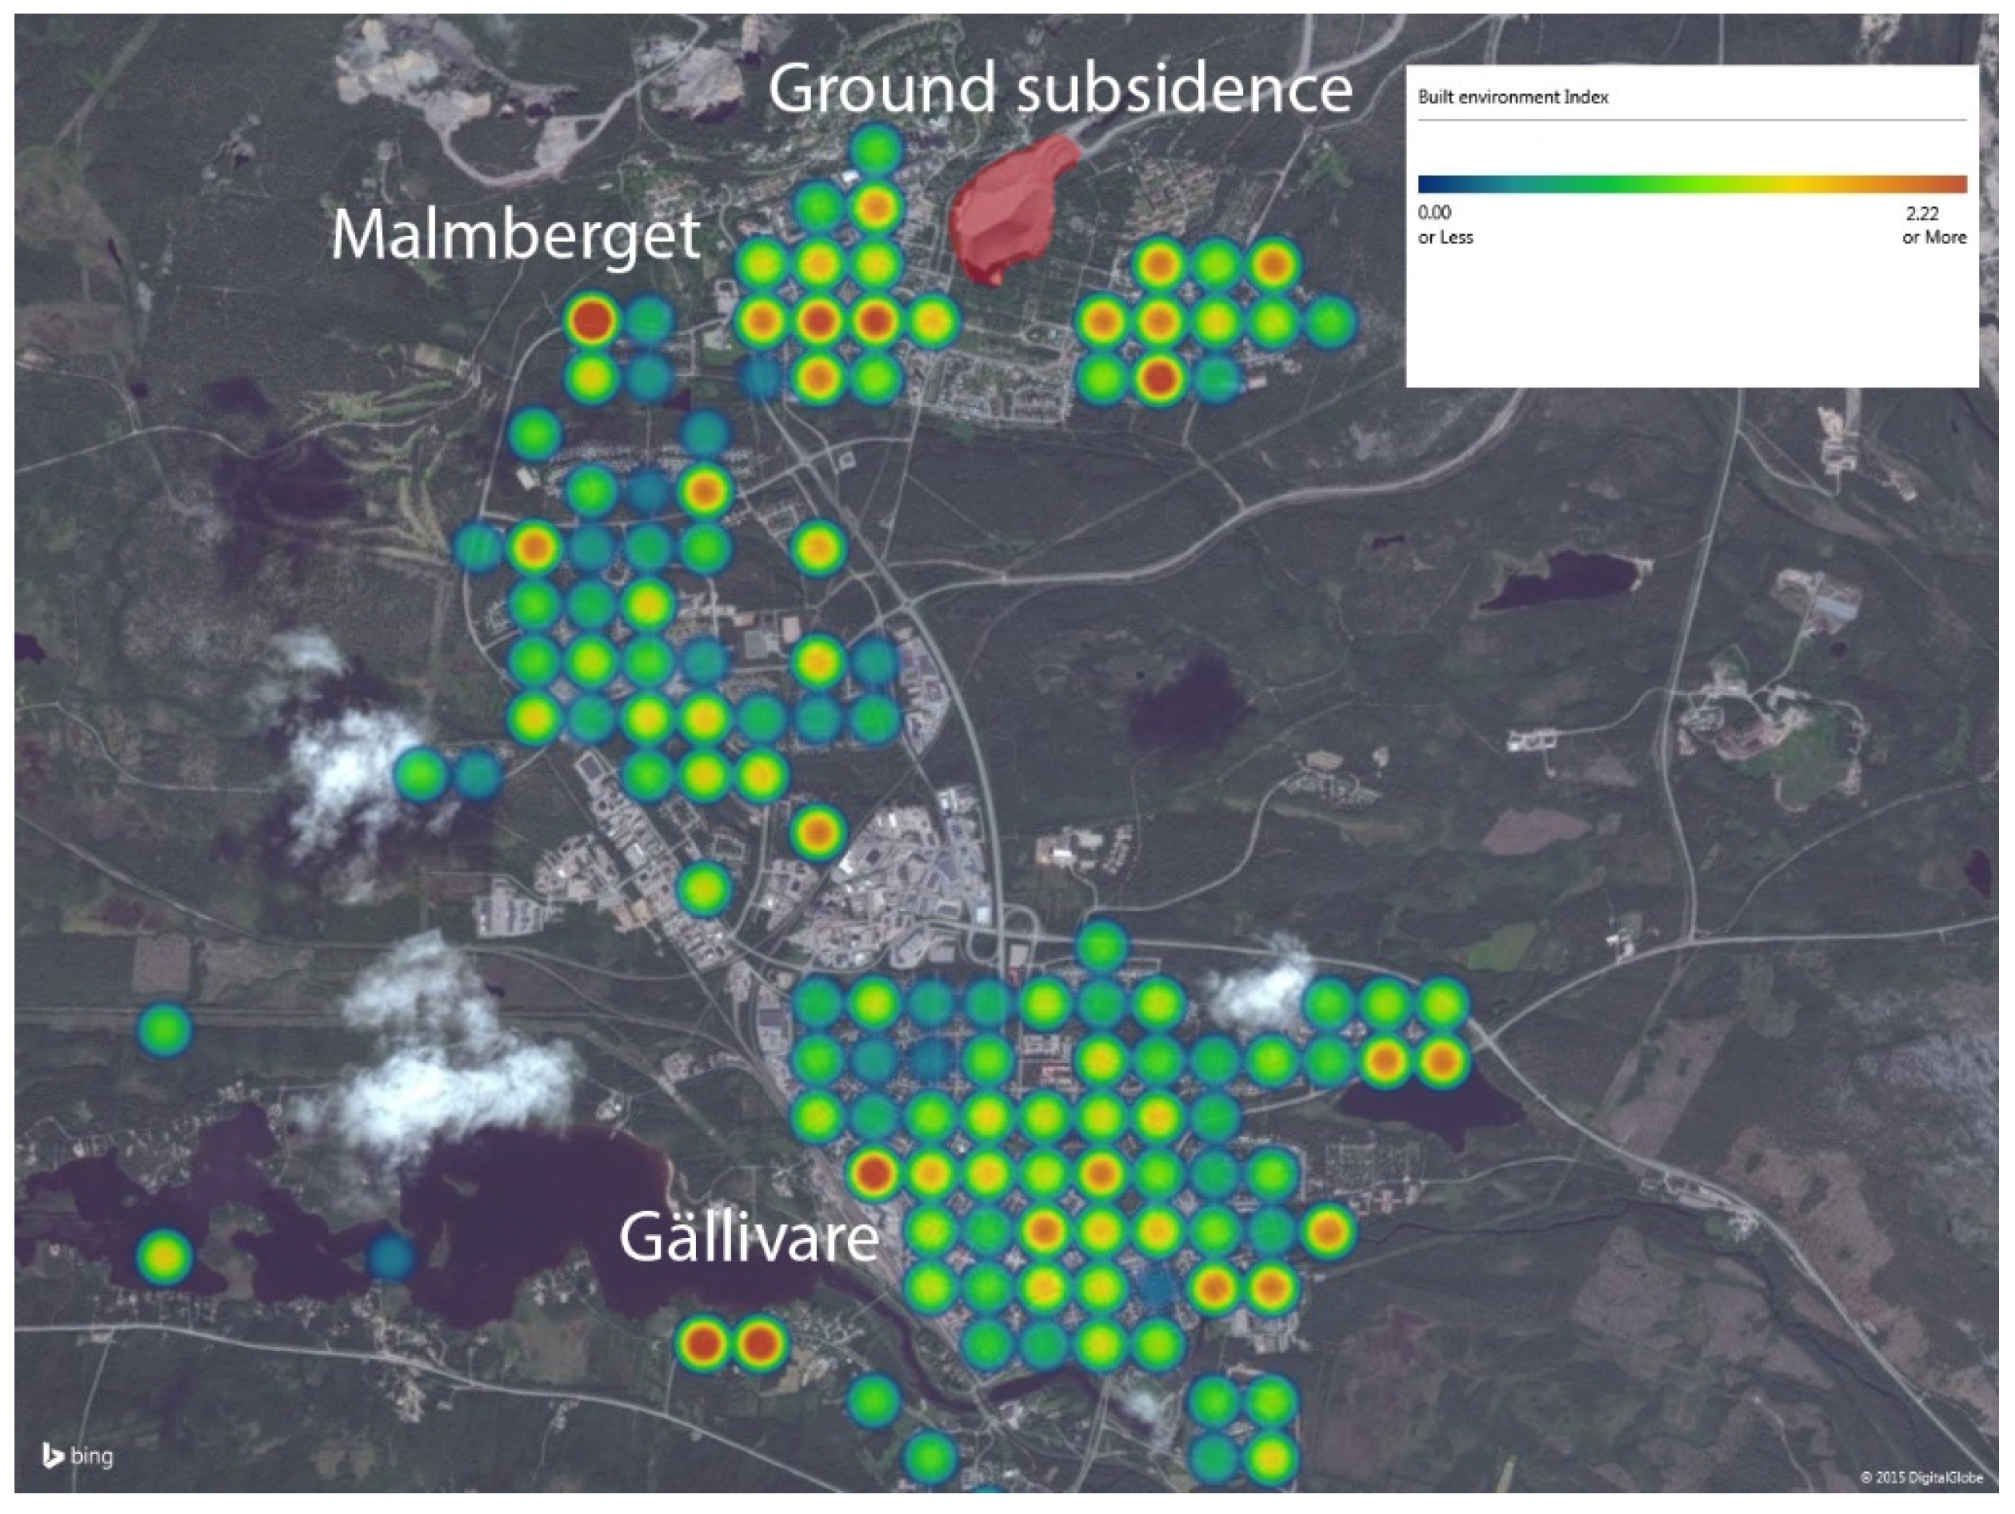
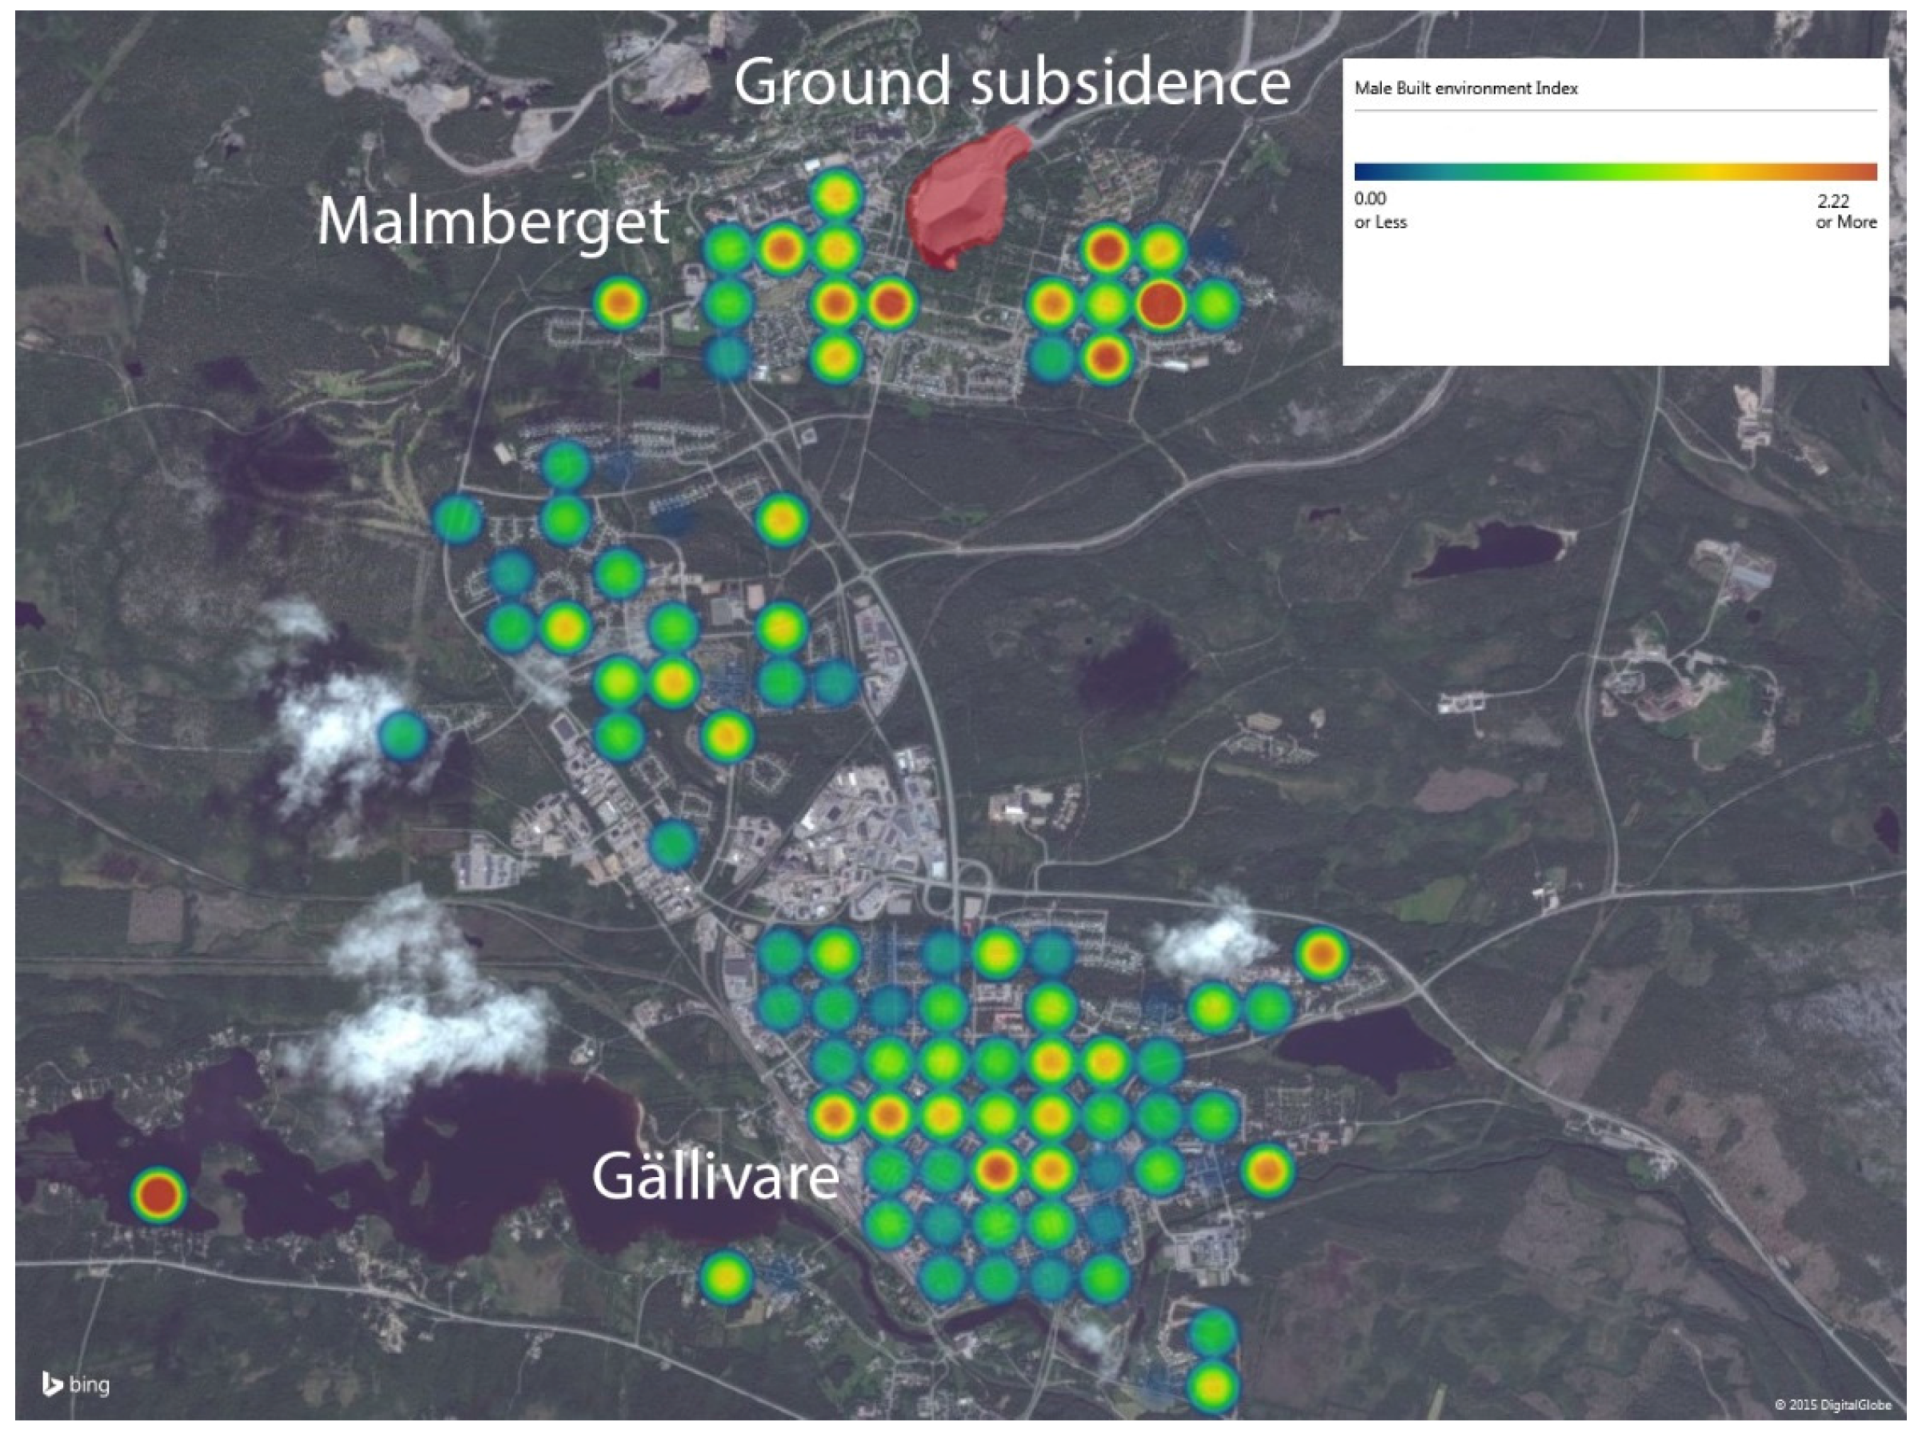
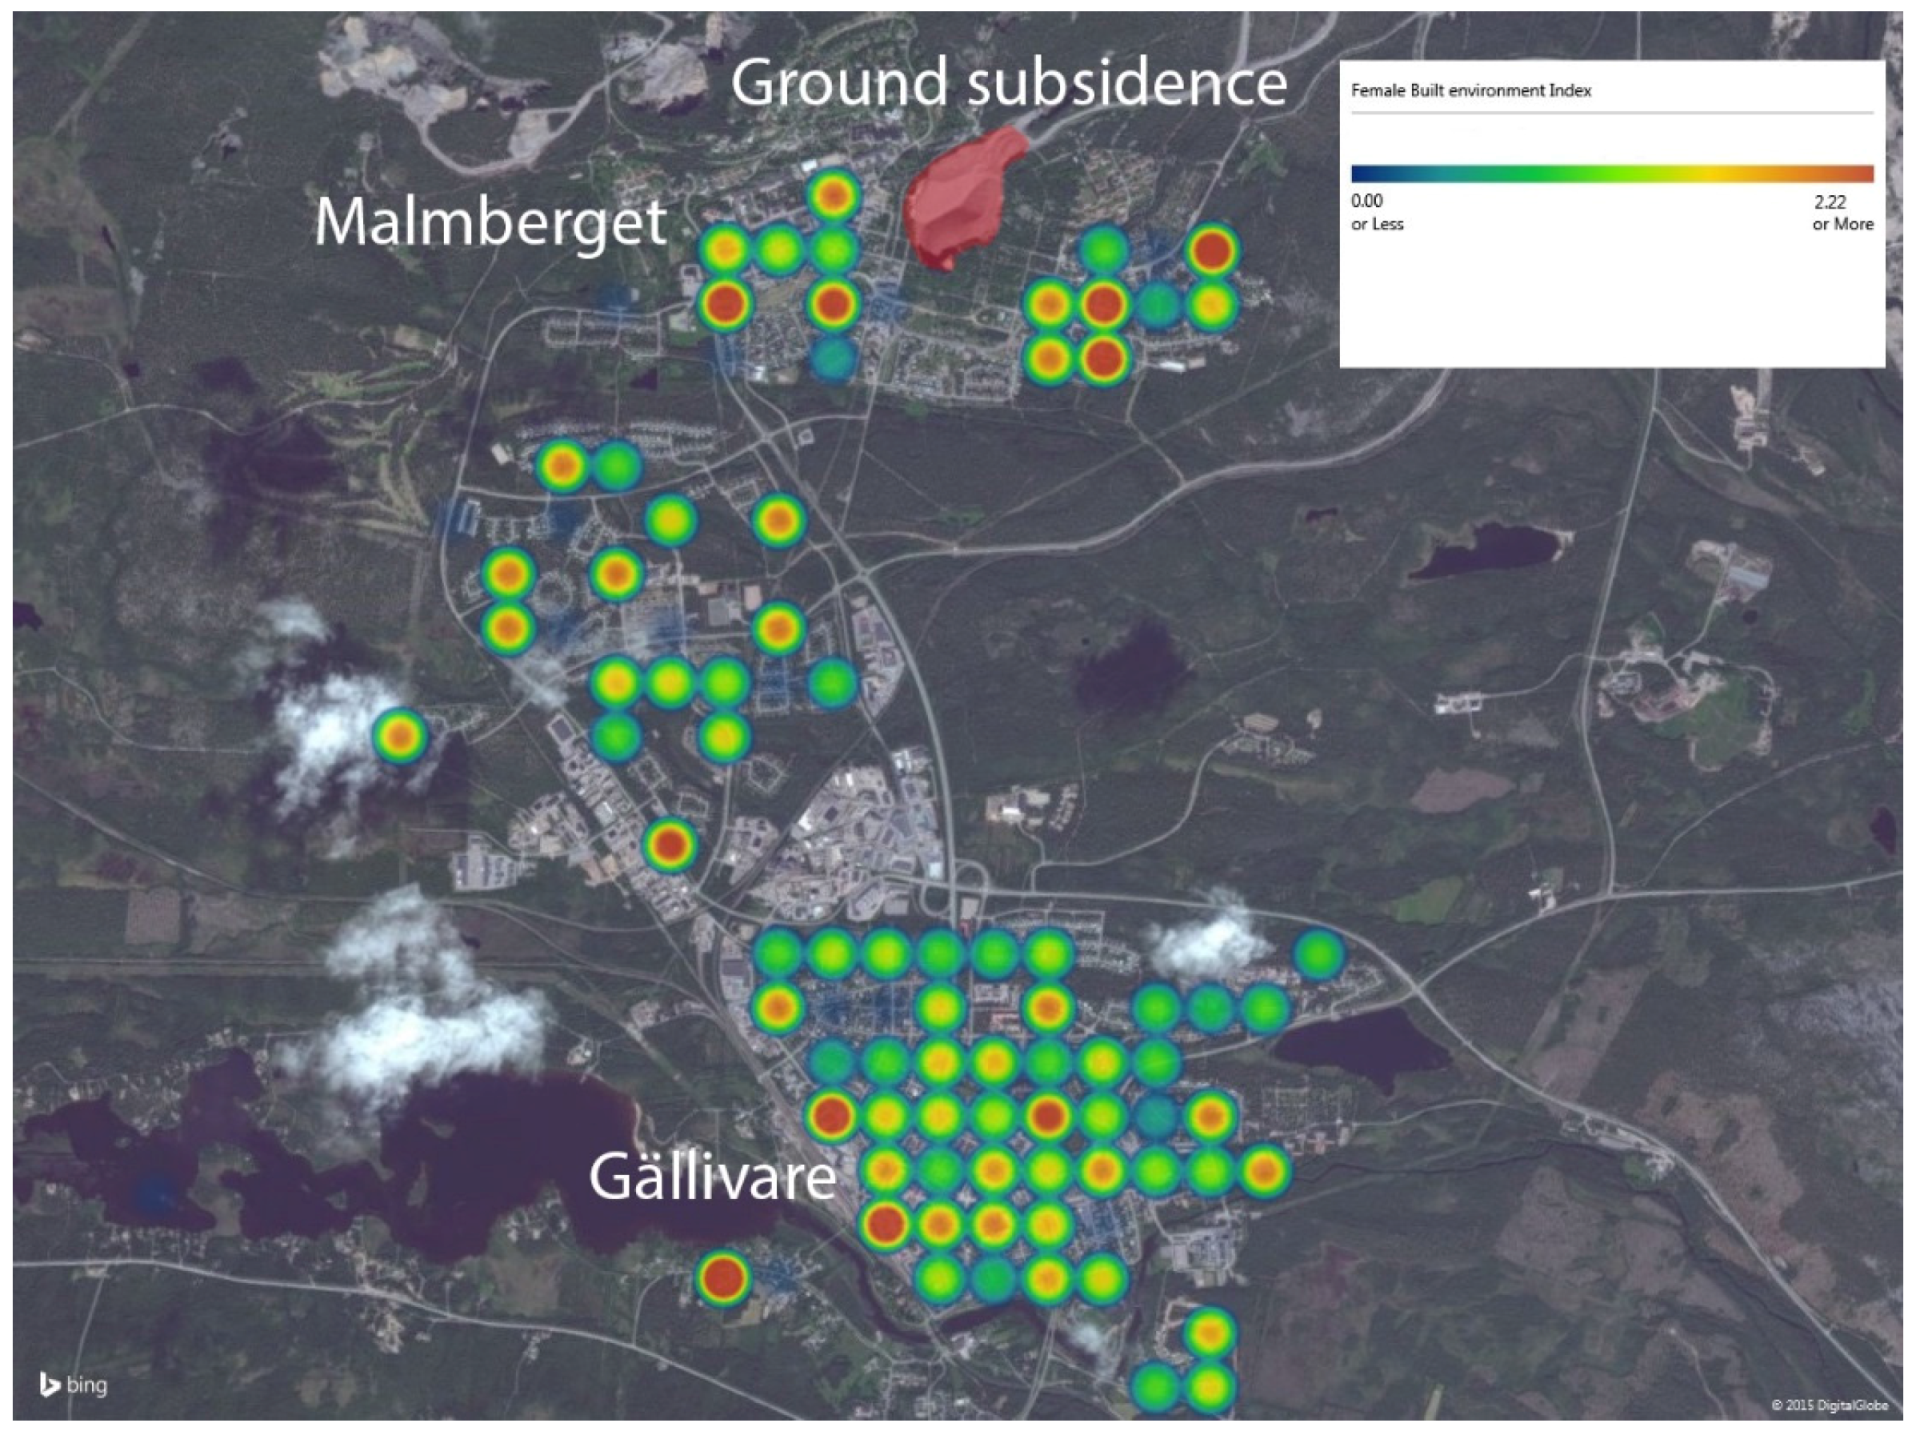
3.2.2. Built Environment

Built environment scores (mapped in Figure 9) were lower than scores for all of the other visualized indices, in accordance with findings by Jakobsson and Segerstedt (2014) that dissatisfaction with the built environment is the strongest motivator of those considering moving from Gällivare. The spatial distribution of the scores suggests that closeness to the mining pit is strongly associated with dissatisfaction with the built environment in Malmberget, as dissatisfaction is high in areas with both multi-family buildings and areas with 1–2 family (detached and semi-detached) home units east of the pit.
Citizens who live in areas (of either low or high density) close to public buildings seemed to be least satisfied with the built environment (Figure 10). However, contrary to previous findings [43] there was no clear correlation between dissatisfaction and closeness to major roads. These patterns raise questions that are highly relevant for both planners and researchers regarding: why closeness to public buildings apparently affects citizens’ satisfaction with the built environment, whether closeness to major roads really affects this satisfaction, whether there are gender-related differences in perceptions of the built environment between men and women, and (if so) whether there are socio-spatial patterns in differences between their perceptions.
To address these questions further, the relationships between dissatisfaction with the built environment and distances from both major roads and public buildings were studied by logistic regression. In these analyses, scores of groups of the respondents who resided closer to and further than 200 m from major roads and public buildings were compared. The results are summarized in Table 2.
The regressions confirmed predictions from the 3D models regarding public buildings, showing that respondents living close to them were substantially less satisfied with the built environment than respondents living further away, but no effect of distance from major roads was found. They also confirmed that proximity to roads had no effect, in contrast to previous findings [41]. However, the negative effects recorded in the cited study may be balanced by satisfaction associated with the increases in accessibility offered by major roads [44,45]. If so, planners may be able to reduce or even eliminate dissatisfaction associated with living close to a major road by mitigating adverse factors such as noise and enhancing positive factors such as access to them.
Regarding effects of gender, as shown in Figure 11 and Figure 12, women were more dissatisfied with the built environment than men at the time of the survey, regardless of whether they lived near the area affected by mining subsidence, the city center or the areas with 1–2 family (detached and semi-detached) home units. Male residents in the areas with 1–2 family (detached and semi-detached) home units far from the mining subsidence areas and public facilities were particularly satisfied, on average. However, the spatial distributions of dissatisfaction with the built environment were very similar for men and women in Malmberget and close to the mining pit. As already described, variables reflecting degrees to which respondents perceive their residential area to be well-planned and comfortable are included in the Built environment index.

4. Discussion

The presented model displays aspects of social sustainability in Gällivare municipality, such as distributions of resources operationalized through national and locally gathered statistics, together with citizens’ perceptions of their financial status, built environment, social inclusion, and provision of public services, as measured by indices based on several variables. The results show that citizens were most dissatisfied with the Built environment, and scores for this index were most strongly spatially distributed, confirming findings by Jakobsson and Segerstedt [40] that this was the strongest motivator for people wanting to leave the municipality. They also show that Personal finance scores were spatially correlated with several other perceptions of the respondents in different areas. Thus, these indices visualized in heatmaps may be particularly useful for urban planners engaged in social sustainability analysis, politicians and other decision-makers to identify possible urban planning issues at early stages. The model alone cannot provide robust guidance for redesigning areas, as it provides little indication of some of the factors influencing citizen’s attitudes. Nevertheless, such visualization can be helpful for identifying spatial areas to focus upon in qualitative and interactive collaboration processes between citizens and professional stakeholders such as urban planners, traffic planners, and decision-makers. The application of the model presented here shows, for instance, areas where satisfaction with the built environment and social inclusion are lowest, which could guide interactive processes that assist interpretation of the social values visualized by the model.
Such interactive processes, mediated through various kinds of meetings and media, can improve qualitative understanding, using 3D models as points of departure. Figure 13 (1–4) shows an example of a public building, a school, located in a residential area where dissatisfaction with the built environment is high. To obtain insights into such dissatisfaction, similar pictures like Figure 13 (4) taken by citizens or other participants in planning dialogues could be used to start discussions and enhance the inclusiveness of urban design processes.
Within virtual environments, buildings can be visualized in many ways and in this study they were represented by extruded footprints to give a 3D representation of the city ((2) in Figure 13). The main benefits of using this type of simplified model is that it can be generated for all urban areas in Sweden, it is light weighted and still gives a representation of the average height of buildings which makes it easier for citizens to identify a certain area compared with a 2D model ((3) in Figure 13). Additionally, where streets and roads are available, street view can support planners and citizens to inspect details in the urban environment within the model that can help these groups to understand problematic areas ((4) in Figure 13). This creates a good complementary to the 3D model but it lacks opportunity to get an overall detail representation of an urban area that can be obtained using a more detailed texture model which is also makes the model more realistic ((1) in Figure 13). The drawback using a fully textured 3D model is that it requires much work and cost for municipality to create and maintain. This was the case in our study where only a small part of the area of Gällivare and Malmberget had textured 3D models of the buildings. Since the citizens are familiar with the area, a 3D cube model of the city in combination with street view is probably enough to stimulate the discussion of the urban environment and other social sustainable issues.As a complement heat maps, 3D graphs can be used to visualize hot spots and distribution of social indicators. Although static 3D graphs can be difficult to interpret [46], 3D graphs in a virtual environment give more freedom for the user to select perspectives, scales and number of variables to be visualized compared with 2D maps. The 2D map is just a specific perspective of the 3D graph in a virtual environment. However, we suggest further studies in how 3D visualization techniques are perceived and can be used by both planners and public.
Overall, the results show that visualization and analysis of citizens’ preferences regarding the built environment can support efforts to raise social sustainability and the inclusiveness of urban planning processes. The approach may be particularly useful in small municipalities like Gällivare, where possibilities to aggregate spatial data statistically may be limited due to the low population density. However, use of such data raises several ethical dilemmas, particularly concerning ways to ensure that sufficient detail is obtained for planning purposes while maintaining sufficient anonymity to ensure that individual respondents’ answers are not identifiable. This dilemma is illustrated in Figure 14, which highlights the importance of identifying a geographical unit (square size) that provides a suitable compromise between the level of detail, representativity and privacy. It also shows that the SCB squares are small enough to enable this kind of analysis and large enough to reduce risks of making single households identifiable in the model to acceptable levels.
When the visualization model was tested, the possibility of presenting data for separate houses was considered, but in the context of a small city that could enable identification of individual residents. Therefore, we decided to present data in bigger spatial units of at least 250 m × 250 m. The data associated with these squares can be easily integrated with income and population statistics. Thus, spatial analysis involving specified numbers of residential buildings in each square is suggested for Statistics Sweden, as well as retaining squares with either one multi-family dwelling or more than two 1–2 family (detached and semi-detached) home units when the data are connected to people living in the area.
The proposed survey geo-validation method ensured that the survey provided good spatial representation of Gällivare municipality by comparing numbers of respondents and the total population of each square. This is important for validating the survey from both statistical and democratic perspectives. The results of the survey also revealed significant differences between different parts of the city, especially in the Built environment index. Such findings may be valuable for urban planners and decision-makers seeking to prevent urban social segregation and enhance citizens’ satisfaction with their environments.

5. Conclusions

The method described and exemplified in this article provides a means to aggregate and visualize spatial distributions of variables from multiple data sources in a small urban environment, rooted in a theoretical framework of social sustainability. Distributions of resources and citizens’ perceptions of their personal finances, built environment, social inclusion and provision of public services are presented in 250 m × 250 m squares in heat maps, together with data from Statistics Sweden. Such models can be used in various ways to facilitate communication between planners, policy-makers and citizens, for example to inform and initiate dialogue about spatial distributions of social variables and (dis)satisfaction with the built environment. In addition, targeted inclusion of citizens from the most affected areas may substantially improve the structure and solution-orientation of dialog between stakeholders.
In the context of Gällivare and Malmberget, examples show that there is a distinct dissatisfaction with the built environment close to the mining pit, but an even more pronounced pattern is the strong spatial overlap of dissatisfaction with the built environment and personal financial situation. The difference between women’s and men’s satisfaction with the built environment in the center of Gällivare can be visualized but not explained through the presented model.
These patterns can be interpreted from a social equity perspective, regarding attractiveness of the public realm as a dimension of social sustainability. Clear socio-spatial connections between citizens’ perceptions of their housing, personal finances and the public realm were detected, inter alia by directly comparing (and visualizing) distributions of reported incomes and perceptions of personal financial circumstances. Jakobsson and Segerstedt [40] detected correlations between social sustainability factors, particularly dissatisfaction with the built environment and thoughts of moving away from Gällivare municipality. Such risk assessments could be used to provide additional depth and guidance in further social sustainability analyses, for instance to identify groups of people who are most likely to leave for prioritized inclusion in interactive urban planning discussions.
The automated ETL solution involving use of survey mapper offers opportunities to discuss results with diverse actors while securing a certain degree of anonymity of respondents, if survey data are mapped using conventional GIS tools like ArcGIS. Thus, ETL tools can support the privacy of individual citizens, but they also have drawbacks due to the lack of knowledge of data transformations in “black box” processes. However, if a similar model were used on a broader scale, ethical issues regarding respondent confidentiality would become more crucial. While a contextualized model can be adjusted to scale up to increase the level of confidentiality and retain meaningful levels of visualization for planners, decision-makers and stakeholders involved in discussions, a more universal model would raise risks of exposure of individual opinions. Therefore, if the proposed method were to be used on a national scale, a formal ethical approval process may be required.

Acknowledgments

Special thanks are due to: Lena Abrahamsson, at the Department of Business Administration, Technology and Social Sciences for her comments on structuring of several drafts and Malin Lindberg, at the same department for detailed comments on the final draft—as well as all other academic partners involved at Luleå University of Technology (LTU). We also gratefully acknowledge assistance from: the Swedish Research Council Formas; Vinnova—Sweden’s Innovation Agency; Alice, the Attractive Living in Cold Climate, research project at LTU; and Attract, the Attractive, sustainable habitats in cold climates, research project at LTU.

Author Contributions

Tim Johansson, Eugenia Segerstedt, Thomas Olofsson and Mats Jakobsson initially discussed the idea of the paper. Eugenia Segerstedt worked on the social sustainability framework and provided an overview of relevant social sustainability research. Tim Johansson reviewed previous research on visualization. Eugenia Segerstedt chose and statistically prepared variables for visualization based on survey data she produced with Mats Jakobsson in previous work. Tim Johansson was responsible for data integration, survey geovalidation and all the graphic work. Tim Johansson and Eugenia Segerstedt analyzed the data, conceptualized the final version of the article and wrote it. Thomas Olofsson and Tim Johansson reviewed the article and were involved in various stages of the work.

Conflicts of Interest

The authors declare no conflict of interest. The founding sponsors had no role in the design of the study; in the collection, analyses, or interpretation of data; in the writing of the manuscript, and in the decision to publish the results.

References

  1. Brundtland, G.; Khalid, M.; Agnelli, S.; Al-Athel, S.; Chidzero, B.; Fadika, L.; Hauff, V.; Lang, I.; Shijun, M.; de Botero, M.M. Our Common Future: Report of the World Commission on Environment and Development; United Nations: Oslo, Norway, 1987. [Google Scholar]
  2. Dempsey, N.; Bramley, G.; Power, S.; Brown, C. The social dimension of sustainable development: Defining urban social sustainability. Sustain. Dev. 2011, 19, 289–300. [Google Scholar] [CrossRef]
  3. Vallance, S.; Perkins, H.C.; Dixon, J.E. What is social sustainability? A clarification of concepts. Geoforum 2011, 42, 342–348. [Google Scholar] [CrossRef]
  4. Ghahramanpouri, A.; Lamit, H.; Sedaghatnia, S. Urban Social Sustainability Trends in Research Literature. Asian Soc. Sci. 2013, 9, 185–193. [Google Scholar] [CrossRef]
  5. Weingaertner, C.; Moberg, Å. Exploring social sustainability: Learning from perspectives on urban development and companies and products. Sustain. Dev. 2014, 22, 122–133. [Google Scholar] [CrossRef]
  6. Dymén, C. Engendering Spatial Planning: A Gender Perspective on Municipal Climate Change Response. Ph.D. Thesis, KTH Royal Institute of Technology, Stockholm, Sweden, 2014. [Google Scholar]
  7. Campbell, S. Green cities, growing cities, just cities? Urban planning and the contradictions of sustainable development. J. Am. Plan. Assoc. 1996, 62, 296–312. [Google Scholar] [CrossRef]
  8. Rittel, H.; Webber, M. Wicked problems. Man-Made Futures 1974, 26, 272–280. [Google Scholar]
  9. Bentivegna, V.; Curwell, S.; Deakin, M.; Lombardi, P.; Mitchell, G.; Nijkamp, P. A vision and methodology for integrated sustainable urban development: BEQUEST. Build. Res. Inf. 2002, 30, 83–94. [Google Scholar] [CrossRef]
  10. Axelsson, R.; Angelstam, P.; Degerman, E.; Teitelbaum, S.; Andersson, K.; Elbakidze, M.; Drotz, M.K. Social and cultural sustainability: Criteria, indicators, verifier variables for measurement and maps for visualization to support planning. Ambio 2013, 42, 215–228. [Google Scholar] [CrossRef] [PubMed]
  11. Sousa, L.; Galante, H.; Batel, A.; Hespanha, P. “Observing cities” social inequalities: A cartographic case study of Aveiro, Portugal. Cities 2003, 20, 241–252. [Google Scholar] [CrossRef]
  12. Tyrväinen, L.; Mäkinen, K.; Schipperijn, J. Tools for mapping social values of urban woodlands and other green areas. Landsc. Urban Plan. 2007, 79, 5–19. [Google Scholar] [CrossRef]
  13. Sherrouse, B.C.; Clement, J.M.; Semmens, D.J. A GIS application for assessing, mapping, and quantifying the social values of ecosystem services. Appl. Geogr. 2011, 31, 748–760. [Google Scholar] [CrossRef]
  14. Yin, L.; Shiode, N. 3D spatial-temporal GIS modeling of urban environments to support design and planning processes. J. Urban. Int. Res. Placemaking Urban Sustain. 2014, 7, 152–169. [Google Scholar] [CrossRef]
  15. Al-Kodmany, K. Visualization tools and methods in community planning: From freehand sketches to virtual reality. J. Plan. Lit. 2002, 17, 189–211. [Google Scholar] [CrossRef]
  16. Van Lammeren, R.; Houtkamp, J.; Colijn, S.; Hilferink, M.; Bouwman, A. Affective appraisal of 3D land use visualization. Comput. Environ. Urban Syst. 2010, 34, 465–475. [Google Scholar] [CrossRef]
  17. Brooks, S.; Whalley, J.L. Multilayer hybrid visualizations to support 3D GIS. Comput. Environ. Urban Syst. 2008, 32, 278–292. [Google Scholar] [CrossRef]
  18. Woksepp, S.; Olofsson, T. Credibility and applicability of virtual reality models in design and construction. Adv. Eng. Inf. 2008, 22, 520–528. [Google Scholar] [CrossRef]
  19. Isaacs, J.P.; Falconer, R.E.; Gilmour, D.J.; Blackwood, D.J. Enhancing urban sustainability using 3D visualisation. Proc. ICE-Urban Des. Plan. 2011. [Google Scholar] [CrossRef]
  20. Roupé, M. Development and Implementations of Virtual Reality for Decision-making in Urban Planning and Building Design. Ph.D. Thesis, Chalmers University of Technology, Gothenburg, Sweden, 2013. [Google Scholar]
  21. Blackwood, D.J.; Gilmour, D.J.; Isaacs, J.P.; Kurka, T.; Falconer, R.E. Sustainable urban development in practice: The SAVE concept. Environ. Plan. B Plann. Des. 2014, 41, 885–906. [Google Scholar] [CrossRef]
  22. Ranzinger, M.; Gleixner, G. GIS datasets for 3D urban planning. Comput. Environ. Urban Syst. 1997, 21, 159–173. [Google Scholar] [CrossRef]
  23. Drummond, W.J.; French, S.P. The future of GIS in planning: Converging technologies and diverging interests. J. Am. Plan. Assoc. 2008, 74, 161–174. [Google Scholar] [CrossRef]
  24. Zhang, X.; Wang, Z.; Lin, J. GIS Based Measurement and Regulatory Zoning of Urban Ecological Vulnerability. Sustainability 2015, 7, 9924–9942. [Google Scholar] [CrossRef]
  25. Massimo, A.; Dell’Isola, M.; Frattolillo, A.; Ficco, G. Development of a Geographical Information System (GIS) for the Integration of Solar Energy in the Energy Planning of a Wide Area. Sustainability 2014, 6, 5730–5744. [Google Scholar] [CrossRef]
  26. Soytong, P.; Perera, R. Use of GIS Tools for Environmental Conflict Resolution at Map Ta Phut Industrial Zone in Thailand. Sustainability 2014, 6, 2435–2458. [Google Scholar] [CrossRef]
  27. Swangjang, K.; Iamaram, V. Change of land use patterns in the areas close to the airport development area and some implicating factors. Sustainability 2011, 3, 1517–1530. [Google Scholar] [CrossRef]
  28. Tufte, E.R.; Graves-Morris, P. The Visual Display of Quantitative Information; CT: Graphics Press: Cheshire, UK, 1983. [Google Scholar]
  29. Fagerholm, N.; Käyhkö, N. Participatory mapping and geographical patterns of the social landscape values of rural communities in Zanzibar, Tanzania. Fenn. Int. J. Geogr. 2009, 187, 43–60. [Google Scholar]
  30. Brown, G. Social–ecological hotspots mapping: A spatial approach for identifying coupled social-ecological space. Landsc. Urban Plan. 2008, 85, 27–39. [Google Scholar]
  31. Plieninger, T.; Dijks, S.; Oteros-Rozas, E.; Bieling, C. Assessing, mapping, and quantifying cultural ecosystem services at community level. Land Use Policy 2013, 33, 118–129. [Google Scholar] [CrossRef]
  32. McPhearson, T.; Kremer, P.; Hamstead, Z.A. Mapping ecosystem services in New York City: Applying a social–ecological approach in urban vacant land. Ecosyst. Serv. 2013, 5, 11–26. [Google Scholar] [CrossRef]
  33. Perkins, D.D.; Larsen, C.; Brown, B.B. Mapping urban revitalization: Using GIS spatial analysis to evaluate a new housing policy. J. Prev. Interv. Commun. 2009, 37, 48–65. [Google Scholar] [CrossRef] [PubMed]
  34. Lohmann, A.; McMurran, G. Resident-defined neighborhood mapping: Using GIS to analyze phenomenological neighborhoods. J. Prev. Interv. Commun. 2009, 37, 66–81. [Google Scholar] [CrossRef] [PubMed]
  35. Joh, K.; Nguyen, M.T.; Boarnet, M.G. Can built and social environmental factors encourage walking among individuals with negative walking attitudes? J. Plan. Educ. Res. 2012, 32, 219–236. [Google Scholar] [CrossRef]
  36. Bell, S.E. “There Ain’t No Bond in Town Like There Used to Be”: The Destruction of Social Capital in the West Virginia Coalfields. Sociol. Forum 2009, 24, 631–657. [Google Scholar] [CrossRef]
  37. Yin, R.K. Case Study Research: Design and Methods; Sage publications: Thousand Oaks, CA, USA, 2013. [Google Scholar]
  38. Benbasat, I.; Goldstein, D.K.; Mead, M. The case research strategy in studies of information systems. MIS Q. 1987, 11, 369–386. [Google Scholar] [CrossRef]
  39. Abrahamsson, L.; Segerstedt, E.; Nygren, M.; Johansson, J.; Johansson, B.; Edman, I.; Åkerlund, A. Gender, Diversity and Work Conditions in Mining; Luleå University of Technology: Luleå, Sweden, 2014. [Google Scholar]
  40. Jakobsson, M.; Segerstedt, E. Mot en Gruvlig Framtid?: Malmfältare om Stadsomvandlingen i Kiruna och Gällivare; Luleå University of Technology: Luleå, Sweden, 2014. [Google Scholar]
  41. El-Mekawy, M. Integrating BIM and GIS for 3D City Modelling: The Case of IFC and CityGML; KTH: Stockholm, Sweden, 2010. [Google Scholar]
  42. Safe. Available online: http://www.safe.com/fme/fme-desktop/ (accessed on 20 October 2015).
  43. Brereton, F.; Clinch, J.P.; Ferreira, S. Happiness, geography and the environment. Ecol. Econ. 2008, 65, 386–396. [Google Scholar] [CrossRef]
  44. Tillema, T.; Hamersma, M.; Sussman, J.M.; Arts, J. Extending the scope of highway planning: Accessibility, negative externalities and the residential context. Transp. Rev. 2012, 32, 745–759. [Google Scholar] [CrossRef]
  45. Hamersma, M.; Tillema, T.; Sussman, J.; Arts, J. Residential satisfaction close to highways: The impact of accessibility, nuisances and highway adjustment projects. Transp. Res. Policy Pract. 2014, 59, 106–121. [Google Scholar] [CrossRef]
  46. Kumar, N.; Benbasat, I. The effect of relationship encoding, task type, and complexity on information representation: An empirical evaluation of 2D and 3D line graphs. MIS Q. 2004, 255–281. [Google Scholar]
Figure 1. The location of mining subsidence zones in Malmberget. Buildings and roads within these zones are going to be demolished or relocated. The blue line on the left picture shows the fence area, the light blue area shows mining subsidence before 2011, and the dark green area shows predicted mining subsidence in 2016–2027 with forecast deviation shown in light green.
Sustainability 08 00195 g001
Figure 2. Schematic illustration of the integration of point data with SCB data squares.
Sustainability 08 00195 g002
Figure 3. Schematic illustration of the integration of point data with SCB data squares.
Sustainability 08 00195 g003
Figure 4. Total population in the 20–80 year age range (right y-axis) and numbers of respondents (left y-axis), aggregated in 250 m × 250 m squares.
Sustainability 08 00195 g004
Figure 5. 3D chart showing numbers of respondents aged 20–80 years in each 250 m × 250 m square in yellow, total population in black, and the ratio between them in a heat map with colors from blue to red where blue stands for best representation. Datasets 1, 3 and 5 from Table 1 are used in this visualization.
Sustainability 08 00195 g005
Figure 6. Heatmap of Personal finance index scores: red to blue indicating low to high satisfaction in each 250 m × 250 m square.
Sustainability 08 00195 g006
Figure 7. Heatmap of Personal finance scores and 3D chart of SCB income groups in 250 m × 250 m squares in the center of Malmberget (red lowest, yellow low, light green medium and dark green high).
Sustainability 08 00195 g007
Figure 8. Heatmaps showing (a) Social inclusion and (b) Public services scores in 250 m × 250 m squares.
Sustainability 08 00195 g008
Figure 9. Heatmap showing Built environment scores in 250 m × 250 m squares of the two city centers Malmberget and Gällivare and the area affected by ground subsidence caused by the mine.
Sustainability 08 00195 g009
Figure 10. Heat map showing Built environment index scores and school buildings (red colored) and public buildings like churches, hospitals and a sports hall (orange colored).
Sustainability 08 00195 g010
Figure 11. Heatmap showing Built environment index scores for male respondents in the 250 m × 250 m squares.
Sustainability 08 00195 g011
Figure 12. Heatmap showing Built environment index scores for female respondents in the 250 m × 250 m squares.
Sustainability 08 00195 g012
Figure 13. Examples of building visualizations: (1) Textured 3D building model; (2) 3D building footprints; (3) 2D Building footprints; and (4) Image from Google Street.
Sustainability 08 00195 g013
Figure 14. Effects of size of the geographical units (here squares) on the level of detail, representativity and privacy in analyses such as this.
Sustainability 08 00195 g014
Table 1. Datasets used, analyses and their relationships.
Datasets
Data Analyses1. Survey (Luleå University of Technology)2. Building Footprints (Swedish National Land Survey)3. Address Points (Municipality of Gällivare)4. Roads (National Swedish National Land Survey)5. Population Squares (SCB, Statistics Sweden)6. Economic Squares (SCB, Statistics Sweden)
Survey geo-validationX X X
Built environment IndexXXXX
Personal finance IndexX X X
Social inclusion IndexX X X
Public services IndexX X X
Table 2. Results of logistic regression (B exponents, standard errors of the exponents, Wald statistics, degrees of freedom and significance) between citizens’ satisfaction with the built environment and distances of their residences from public buildings and major roads.
BS.E.Wald dfdfSig.Exp (B)
Distance from public buildings1.0820.17538.41110.0002.950
Distance from major roads2.2640.1702.41610.1201.302
Constant−1.8970.147165.79310.0000.150

