Article

The Effects of National Cultural Traits on BOP Consumer Behavior

by
Tsai Chi Kuo
1,*,†,
Jessica Hanafi
2,
Wan Chen Sun
1,† and
Rex Aurelius C. Robielos
3
1
Department of Industrial and Systems Engineering, Chung Yuan Christian University, Taoyuan 32023, Taiwan
2
Department of Industrial Engineering, Universitas Pelita Harapan, Lippo Karawaci, Tangerang, Banten 15811, Indonesia
3
School of Industrial Engineering and Engineering Management, Mapúa Institute of Technology, Manila 1002, Philippines
*
Author to whom correspondence should be addressed.
These authors contributed equally to this work.
Sustainability 2016, 8(3), 272; https://0-doi-org.brum.beds.ac.uk/10.3390/su8030272
Submission received: 25 November 2015 / Revised: 15 February 2016 / Accepted: 7 March 2016 / Published: 16 March 2016
(This article belongs to the Section Economic and Business Aspects of Sustainability)

Abstract

:
Scholars who aim to solve problems with poverty and a lack of resources often focus on bottom of pyramid (BOP) consumer groups. They propose that the traditional TOP (top of pyramid) business strategies are not suitable for BOP populations, and that it is crucial to determine and satisfy BOP consumption demands. The purpose of this study is to find out which factors influence BOP consumption, and to explore BOP integrated products. The concepts of “national cultural traits” and sustainable product design are also used. The findings will help enterprises learn how to make profits in BOP markets (addressing economic goals), while helping the poor get out of poverty (addressing social goals). Two different areas concerning BOP consumers are used to illustrate the results.

1. Introduction

In June 2013, the United Nations (UN) forecast that by 2050, the world population would reach 9.6 billion [1]. Meanwhile, rapid population growth has widened the gap between rich and poor countries as well as the inequality problems caused by the misallocation of social resources. To eliminate poverty and hunger and ensure sustainable development, it will be necessary to achieve economic, environmental, and socially comprehensive goals, also called triple bottom lines (TBLs). The perspective of the bottom of pyramid as consumer groups has been a growing interest for many researchers and enterprises [2,3].
BOP population groups are those in which individuals have daily incomes of less than 2 USD. Currently it is estimated that four billion people are at the bottom of pyramid. These groups are also referred to as “rising stars” or “rising powers” [4]. The bottom of the pyramid is mainly distinguished from their counterpart, the middle class and the top of the pyramid (TOP) [5,6], by their incomes and geographic locations. However, there are several additional characteristics of the BOP. People living at the BOP typically cannot predict their revenue, even in the short run. The BOP populations tend to be relatively isolated, typically leading to strong local cultures and less contact with national or international consumer habits [7]. Also, the BOP may not have adequate education, health care, and appropriate infrastructure. They are also often not well served by the private sectors as they tend to pay more for the same products than the TOP. Although traditionally have been considered as the area of government agencies and non-profit organizations, through creative means, BOP can be converted into vibrant consumers of goods and services that will merit profit organizations while improving their quality of life [8,9]. Therefore, many enterprises regard the BOP market as a potential market, and many sales models have been developed as a result [4,10,11].
The concept of BOP venture has been expected to accommodate the triple bottom line and improve the standards of living of the poor. BOP venture is a revenue generating enterprise that either sells goods to, or sources products from, those at the bottom of the pyramid [12,13]. Innovative strategies have been developed to promote this concept. Smaller product sizes and strong local adaption, distribution to facilitate frequent purchases and hard to reach areas, little reliances on contracts and strong reliance on informal ties are some examples of these strategies [5,14,15]. With these characteristics, the BOP offers a wealth of opportunities for social entrepreneurs who can integrate its cultural characteristics into solutions that will address its unmet social needs [8].
To develop the business strategies and management to satisfy BOP consumption demands, we need to understand the consumer behavior at the bottom of the pyramid and identify if there is any specific requirement for product design. Countries with population at the bottom of the pyramid are scattered across Asia, Africa and parts of Latin America [9]. Each of these nations has their own cultural traits. The relationship between BOP natural cultural traits and their behavior needs to be explored to understand how to achieve the economic goals of generating profit and social goals of helping the poor out of poverty. Therefore, the purpose of this study is to explore the impact of national cultural traits on BOP consumer behavior by using BOP groups as research samples and identify the design requirement of BOP.
The outline of this paper is as follows. First, a literature review on consumer behavior at the bottom of pyramid and previous innovation strategies used by enterprises are presented in the next section. BOP design requirements and Hofstede’s cultural dimensions theory [16] are explored to find the relationship between BOP product design and local culture. The next section describes the research methods used in this study. A case study of the behavior of BOP consumer groups in the Phillipines and Indonesia is presented and evaluated in Section 4. Finally, the empirical data is analysed and conclusions are drawn.

2. Literature Review

While BOP groups can be seen as offering new market opportunities, enterprises cannot depend on the traditional product design and business management models that satisfy TOP consumers to meet the demands of the BOP market. Instead, they need to understand the behavior of BOP consumers and how to provide sustainable commodities or services that satisfy their demand through sustainable consumption.
The United Nations Environment Programme [17] has summarized two challenges for enterprises in addressing ecological footprints and consumption level, and proposed the contract and converge principle for consumption and ecological footprint levels. Figure 1 shows that BOP customers need to increase their consumption to satisfy their basic needs in the future. Meanwhile, the trend for TOP consumers, shown as a dashed line, is reversed. They must reduce their overall consumption and environmental impacts more quickly to achieve sustainable development.

2.1. Introduction to BOP

The definition of Bottom of Pyramid is often argued. Many articles defined it as a per capita income at or below $1500 or $2000 per annum, which is expressed comparably by using the purchasing power parity basis [18]. The World Bank defined the BOP according to consumption measures of $2 per day consumption. The location of the BOP, either in rural or urban areas also influenced the definition of BOP. Urban BOP nested in a specific areas of the city defined as slums. Meanwhile rural BOP was usually scattered in remote areas with limited access to transportation and logistics distribution [19]. Although Kolk et al. [18] identified 70% of the BOP consumers as located in Asia, variations on the poverty level, e.g., extreme, moderate and relative poverty, exist and may influence the behavior of BOP consumers. However, however they are defined and despite income and resource constraints, as Subrahmanyan and Gomez-Arias [9] identified from their research, BOP consumers are sophisticated and creative.
The BOP concept and initiatives, as first introduced by Prahalad [13], consider the poor in the value network as entrepreneurs and not only as consumers. They are expected to be co-inventors together with the multinational enterprises [20]. However, people in this segment mostly depend on an informal economy that is inefficient and offers poor quality goods, higher prices and poor distribution. The co-inventor ideas were less materialised as there have been no reports of affordable skills training for the BOP market [9]. However, as observed by Tooley [21] in India, Ghana, Kenya and Nigeria, BOP consumers strived and sacrificed to send their kids to budget private school as an investment for their future.
The BOP consumers are identified with strong social bonds. They treasure social relationship and community interactions. This is shown in many aspects of their life. In marketplace, according to a study conducted by Viswanathan [22], the way they build a relationship with the neighbourhood retailers acts as insurance in that they are able to get credit during times of hardship. Long-term relationship leading to trust is a key element. ICT adoptions are also high among BOP consumers as ICT has enabled easier social interactions [9,23].
Judgment of BOP membership not only depends on national boundaries, but also on market characteristics. Developing countries are characterized by having fast-growing populations, strong and explosive markets, and a great focus on maintaining basic living needs [24]. The BOP market’s total household income of $5 trillion per year makes it a potentially important global market. Many BOP individuals pay higher prices for basic goods and services than wealthier consumers, either in terms of cash value or effort, while receiving lower-quality goods and services as well. This is generally referred to as the poverty penalty. The poverty penalty can take on five possible forms [25]: poorer quality, higher prices, non-access, non-usage, or catastrophic spending burden.
Despite the nearly unlimited business opportunities presented by BOP markets, enterprises should keep in mind some common misperceptions about BOP groups. Table 1 lists enterprises’ wrong approaches to BOP groups [13].
According to Prahalad and Hart [13], to satisfy BOP groups’ life needs and making them accept business co-venturing in a sustainable and profitable way requires companies to dismiss traditional approaches to capitalism. Applying smart strategies in technology and innovation is one of the examples. They further develop and analyze this idea through their progressive models BOP 1.0 (selling to the poor), BOP 2.0 (business co-venturing), and BOP 3.0 (inclusive business) [26,27]. Simanis and Huart [27] also propose that the BOP strategy should be changed from what they call BOP 1.0 to BOP 2.0. Table 2 explains BOP 1.0 and 2.0. In BOP 2.0, business co-venturing creates mutual value within a corporate entrepreneurship framework. Enterprises need to understand different BOP groups’ demands, based on their different national and cultural traits. Also, enterprises should engage in innovation to develop different BOP-integrated products with different national and cultural traits. According to Rigby and Bilodeau [28], for a successful enterprise, innovation is more important than reductions in cost.
In a study that collects literature and verifies the importance of innovative business models, Prahalad [2] proposes 12 innovation principles for the BOP market, as shown in Table 3. Crul and Diehl [29] suggest the D4S (design for sustainability) approach, which focuses on human resources, global resources, and overall interests in sustainable design. Castillo et al. [30] offer the BOP-oriented integrated product development concept, and argue that four dimensions should be considered to satisfy the demand of BOP consumers: user desire, scientific and technological feasibility, financial feasibility, and earth sustainability.
In summarizing BOP innovation strategies, this study formulated BOP product design according to the Ramani et al.’s and Castillo et al.’s four dimensions [10,30]: user desire, financial feasibility, scientific and technological feasibility, and sustainability. The challenges and practices involved in the four dimensions are presented in Table 4.

2.2. National and Cultural Trait

Normally, cultural differences can effect on the degree of importance placed on relationships and networks when doing business both between countries and between different groups within a country [31]. Just as there are gaps in the national average incomes of various economies, national cultural traits also vary, as do BOP consumption demands. Normally, the BOP is less educated, less travelled and less exposed to western influences and media. Enterprises thus need to develop suitable BOP business strategies and solutions especially for different cultures.
There have been many previous studies of national cultural analysis [32,33,34]. Among these, several researchers [35,36] have studied the impact of culture on marketing at the BOP based on Hofstede’s work. Although some research argue Hofstede’s model that is contentious, Hofstede’s studies [16] have been validated thoroughly and cited often, and are still used for research as well as in the BOP. Hofstede [37] defines a culture as the collective mental programming of the mind. There are a lot of theoretical and philosophical contestations about the application of Hofstede's variables especially in the context of the BOP. The mental programming shared by residents of a country or region, or by members of other groups, consists of four dimensions: power distance (from small to large), collectivism versus individualism, femininity versus masculinity, uncertainty avoidance (from weak to strong), and pragmatism [37]. These can be explained in more detail as follows: power distance, collectivism vs. individualism, masculinity, uncertainty avoidance index, and pragmatism.

3. Research Method

To identify different BOP groups and appropriate marketing for different customer needs, this study uses the national cultural traits proposed by Hofstede [16]. In addition, the integrated product development concept proposed by Castilo et al. [14] is employed to develop a BOP-integrated product. The research architecture of this research is depicted in Figure 2, and involves the following steps:
Step 1.
Use factor analysis to find the common factor of notational and cultural traits and BOP-integrated product.
Step 2.
Use stepwise regression analysis to determine the impact of national cultural traits on BOP-integrated products.
Step 3.
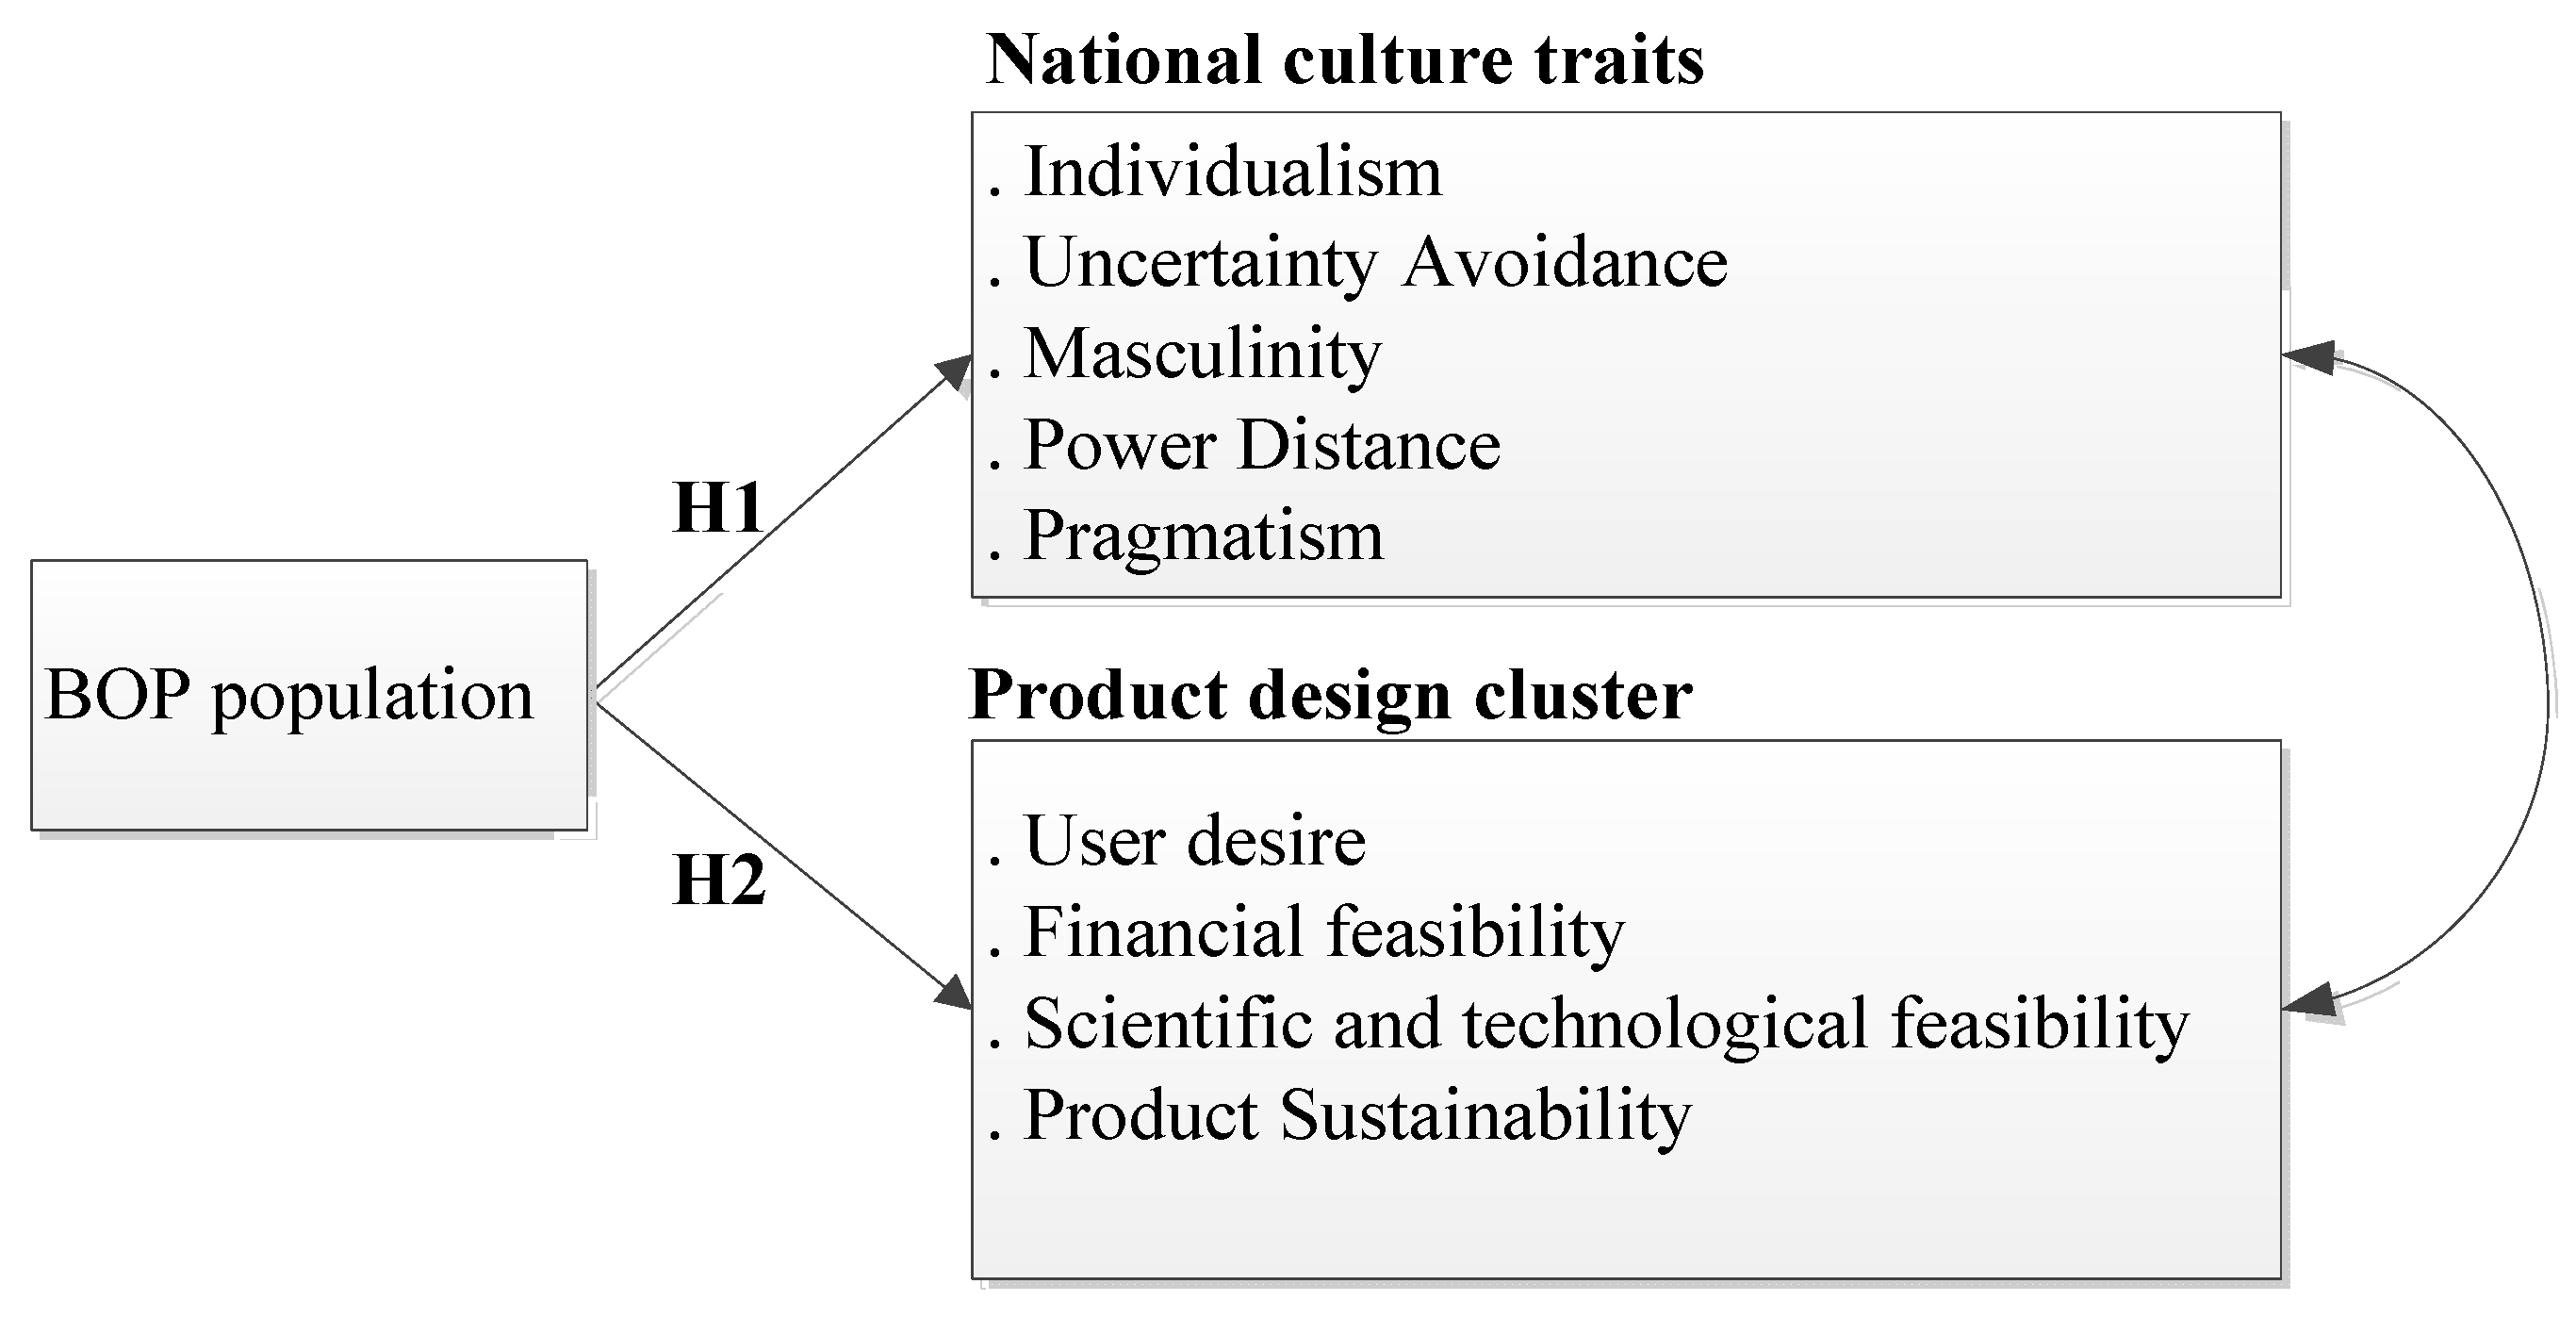
Test different BOP groups’ national and cultural traits and BOP-integrated products. Two hypotheses are included:
H1:
Different BOP populations have different national and cultural traits.
H2:
Different BOP populations will have different BOP product design clusters.

3.1. Research Development

Survey Design

For this study, a questionnaire was first designed based on the literature review [30,37], and then modified by three experts who are familiar with BOP marketing. Two experts were academics in Taiwan, while the other works in the electric industry and has five years of BOP marketing experience. The questionnaire was originally written in English, and then translated into Indonesian. Table 5 gives detailed information on the questionnaire. The questionnaire consists of two parts. The first part addresses national cultural traits while the second part questioned BOP respondents’ considerations in selecting product design. The content of the questionnaire was checked for consistency with local customs to ensure that it involved no discrimination against the BOP populations. The respondents were invited to respond to specific statements on a 5-point Likert scale, ranging from “strongly disagree” to “strongly agree.”
For the data collection, two BOP groups were involved, from Indonesia and the Philippines, since the majority of the populations of these two countries belong to the BOP market. The per-capita GDPs of participants from Indonesia and the Philippines were 3594 USD and 2611 USD, respectively. Our survey was carried out in March and April 2013.
Indonesia Bureau of Statistics found that 28.59 million people (11.22%) in Indonesia are living in poverty [41]. Among those, 10.65 million people are from urban areas and living in slums. In Indonesia, the survey was carried out in Jakarta where slum areas were identified based on the database from the Jakarta Capital Region provincial government. One slum district for each of the five municipalities in Jakarta were surveyed. Questionnaires were distributed directly to the leader of the neighborhoods in each of the district. The leaders were paid for some fees to distribute the questionnaires and for each questionnaires filled, the respondents were given a token in the form of sachets of household cleaning products. The sample in Jakarta represented the BOP of Jakarta and partially BOP of Indonesia. Meanwhile in the Philippines, the survey was conducted in suburban areas of Manila. The questionnaires were distributed through online survey.
The paper-based surveys were distributed to 372 potential BOP consumers in Indonesia, out of which 232 (62.36%) were effective. In the Philippines, the surveys were distributed to 144 potential BOP consumers, out of which 136 (95.83%) were effective. In the end, a total of 368 valid samples were collected from Indonesia and the Philippines.
The profile of the respondents in Indonesia and the Philippines are slightly different. In Indonesia, most of the respondents were female (69%) while in the Philippines the ratio between male and female respondents was almost equal (52% male). This is due to the fact that the respondents in Indonesia majority are stay-at-home mother and village residents. The male residents usually work outside home. The level of education in the Philippines is mostly college (75%) while only 10% of respondents are college educated in Indonesia. The rest are high school (54%) and elementary school graduates (36%). Interestingly, even though 75% of respondents in the Philippines are college educated, 58% of the respondents are still earning less than US$2,000 annually, compared to 53% of the respondents in Indonesia. However, higher income groups (US$3,500–4,000) are 10% higher in the Philippines (24%) than in Indonesia. Most of the respondents in the two nations have televisions (above 93%) and CRT televisions are still owned by majority of the respondents in Indonesia (74%). The type of television owned by the respondents in Philippines are equally distributed between LED (38%), CRT (33%) and LCD TV (29%).

3.2. Data Analysis Method

The data were encoded and analyzed by using the SPSS statistics software package. The analysis methods included the use of:
(1)
Descriptive statistics: Potential BOP consumers’ basic data.
(2)
Factor analysis: Two measurement variables were considered, for national cultural traits and BOP product design, by using the principal component analysis method.
(3)
Reliability analysis: Cronbach’s α was used to measure the questionnaire’s consistency and reliability. The Cronbach’s α coefficient was above 0.70, indicating high reliability. A score between 0.70 and 0.35 is acceptable, while one below 0.35 should be rejected.
(4)
Pearson correlation analysis: A correlational analysis of national cultural traits and BOP product design was used to explore the collinearity between variables.
(5)
Mean difference test: A t-test was used to test the average mean of the two countries.
(6)
Step regression analysis: Stepwise regression was extensively used to determine the most influential terms and parameters in linear regression models. Stepwise regression is a modification of forward selection, so that after each step in which a variable is added, all candidate variables in the model are checked to see if their significance has been reduced below the specified tolerance level.

4. Empirical Data Analysis and Results

In this research, the BOP for Indonesia and the Philippines are selected. From the KPMG report [42], 203 million, or 81.5% of Indonesians are at the bottom of the economic pyramid. Among these people, without salaries or sufficient collateral, the 96 million Indonesians living on less than USD 1.90 a day are considered too risky for loans or live in locations too remote for formal financial services. For the Philippines, there are about 57.4 million BOP customers. Based on purchase parity terms, this means 62.5% live in vulnerability to poverty or below USD 3 a day per person [43]. From the experts’ suggestions, TV ownership rates and types could help identify the BOP population. Therefore, based on the sample taken from Indonesia and the Philippines for this study, the respondents’ basic data, as well as their TV ownership rates and types, were collected to confirm their BOP status. Figure 3 provides data on the basic information of respondents.

4.1. Survey results

The survey results showed that respondents that had average annual incomes equal to or below USD 2000 were focused on their basic sanitary facilities. In contrast, respondents with annual average incomes below or equal to USD 3500 were more concerned about home appliances. Table 6 presents information on the sample with average annual incomes below or equal to USD 3500 in Indonesia and the Philippines, in terms of which home appliances they expect to have in their homes.

4.1.1. Reliability and Validity Analysis

For the Cronbach’s α coefficients of the samples for Indonesia and the Philippines, the reliability of national cultural traits (Indonesia: 0.693, Philippines: 0.809) and BOP product design (0.751), are all close to or above 0.7, and thus the model is reliable.
In addition, principal component analysis (PCA) and the varimax rotation methods have been used in this study. The Indonesian national cultural traits that have eigenvalues above 1 have been used as a benchmark for selecting common factors. The national cultural traits of the Philippines are represented by five factors in this analysis. According to a study by Cuiford (1965) on the factorial load of factor analysis, a load of ±0.3 is regarded as acceptable, a load of ±0.4 or above is significant, a load of ±0.5 is considerably significant, and a load below 0.3 means that the questionnaire item should be deleted.
The following factors have been addressed for each dimension: individualism, uncertainty avoidance, masculinity, power distance, and pragmatism (Table 7). The pre-event determination criterion KMO was determined to be 0.701 (acceptable for factor analysis) and 0.853 (suitable for factor analysis). The ball appraisal result was 0.000, in terms of significance. Based on the two determination criteria, the cumulative variance of the two countries is 71.919% and 73.058%, for the Philippines and Indonesia, respectively.
With regard to BOP product design, the samples for Indonesia and the Philippines have been combined. From 14 questions, four mutually independent common factors have been extracted. Based on an analysis, common factors were selected that had eigenvalues above 1.
According to a factor analysis, the KMO statistic quantity is 0.698 (acceptable for factor analysis), and the ball appraisal value is 0.000, in terms of significance. Research into practical experience shows that a dimension should have at least three questions if its characteristics are to be measured accurately. Therefore, in factor analysis, if only one or two questions are used for common factors, their dimensions and the question item may be deleted. However, in order to ensure financial feasibility, two question items have been designed for factors in this study, and thus the questionnaire items have not been deleted. The originally named “user desire” has been converted into “marketing activities”, “earth sustainability” has been converted into “product sustainability”, “scientific and technological feasibility” has been converted into “product feasibility” and “financial feasibility” has been converted into “innovative financial marketing”, as can be seen in Table 8.

4.1.2. Collinearity Test of Stepwise Regression

Stepwise regression analysis has been conducted for this study, by applying the Pearson cumulative coefficient matrix to test the correlation between various factors in the sample data. The results of the analysis suggest that the correlational coefficients of various factors are mostly lower than 0.5, indicating good mutual independence of variables. The correlation matrix for the various variables is shown in Table 9.

4.2. Verification Results for Research Hypotheses

The differences between Indonesia and the Philippines, in terms of their national cultural traits and BOP product design, have been verified. Based on the evidence, the hypothesis of H1 and H2 are accepted.

4.2.1. t-Test

The t-test method is applied in this study to verify whether there are any differences between Indonesia and the Philippines, in terms of national cultural traits and BOP product design. The results showed that with respect to national cultural traits, Indonesia and the Philippines have significant differences in “individualism” “uncertainty avoidance”, “masculinity”, and “power distance”. For the Philippines, the degree of “individualism”, “uncertainty avoidance”, “masculinity”, and “power distance” is higher than for Indonesia. With respect to BOP product design, Indonesia and the Philippines have significant differences in terms of “marketing activities”, “product sustainability”, and “innovative financial marketing”. Consumers in the Philippines are more likely to focus on “marketing activities”, “product sustainability”, and “innovative financial marketing”. The results of the analysis are shown in Table 10.

4.2.2. Stepwise Regression Analysis

Stepwise regression analysis has been carried out to determine the impact of national cultural traits on BOP product design marketing activities. In Table 11, the results show that for Indonesia, “individualism” and “uncertainty avoidance” can explain 22.7% of the total variance for the dimension of “BOP product design’s marketing activities”. For the Philippines, “pragmatism”, “uncertainty avoidance”, and “masculinity” can explain 34.7% of the total variance in the dimension of “BOP product design—marketing activities”. For other factors, such as product usability, product sustainability, and innovative financial feasibility, the results are shown in Table 11, Table 12, Table 13 and Table 14.

4.2.3. Product Design for Indonesia’s BOP Population

According to Table 15, Indonesia is a country with a low degree of individualism, a medium degree of uncertainty avoidance and masculinity, and a high degree of power distance and pragmatism. Based on the integration of data and empirical analysis results, this study indicates that a low degree of individualism is connected to association with organizations and groups and trust in their professional expertise and decisions. Hence, consumers with a low degree of individualism are more likely to be affected by the suggestions of marketers. On the other hand, a low degree of uncertainty avoidance is connected to greater risk-taking and the acceptance of uncertainty, without a tendency toward conservatism. Hence, it can be inferred that consumers with a low degree of uncertainty avoidance are willing to try experiential or trial use services provided by marketers. Consumers with a low degree of masculinity emphasize quality of life, and regard humans as more important than material objects. Hence, it can be inferred that consumers with a low degree of masculinity are concerned about product feasibility and, for example, care less about whether a product is the latest available than about whether it is usable. Consumers with a high degree of pragmatism are frugal with resources, and thus are likely to be concerned about product sustainability. Consumers with a low degree of individualism tend to be associated with organizations and groups, and to trust their professional knowledge and decisions. Hence, it can be inferred that consumers with a low degree of individualism are more affected by innovative financial marketing. Consumers with a high degree of pragmatism tend to save money, and thus are less likely to be affected by innovative financial marketing.

4.2.4. Product Design for the Philippines’ BOP Population

According to existing literature, the Philippines is a country with a low degree of individualism and pragmatism, a medium degree of uncertainty avoidance, and a high degree of masculinity and power distance. Based on a literature review and the results of empirical analysis, the findings in this study indicate that consumers with a low degree of uncertainty avoidance are willing to take risks and accept uncertainty, but are without a tendency toward conservatism. Hence, these consumers are more likely to be willing to try the experiential or trial use services provided by marketers. Consumers with a low degree of pragmatism expect fast results, and are concerned about real achievements, indicating that they value fast repair and maintenance services. Consumers with a low degree of uncertainty avoidance are characterized by a preference for products that they recognize. Hence, it can be inferred that they value product usability, in terms of their basic needs for products, and not too many complex functionalities. Consumers with a low degree of pragmatism expect fast results and are concerned about facts. Hence, it can be inferred that consumers with low degree of pragmatism value product usability, in terms of features like a product that they can repair to save time. Consumers with a low degree of individualism tend to be associated with organizations and groups, and to trust their professional expertise and decisions. Consumers with a low degree of pragmatism are characterized by respect for society, which suggests that they are more likely to be concerned about product sustainability, as well as governmental policies. Consumers with a low degree of uncertainty avoidance are willing to take risks and accept uncertainty without a tendency toward conservatism. Hence, it can be inferred that they will be willing to try new payment mechanisms provided by innovative financial marketers.

4.2.5. Implications for BOP Product Design

This study’s data on BOP consumers in Indonesia and the Philippines can be combined to arrive at broader conclusions, and to explore the impact of common national cultural traits on purchases related to BOP product design. Table 16 shows the national cultural traits that affect product design for different BOP populations. This study shows that uncertainty avoidance has a significant impact on marketing activities, masculinity has a significant impact on product usability, and pragmatism has a significant impact on product sustainability. Consumers with a low degree of uncertainty avoidance are willing to take risks and accept uncertainty without a tendency toward conservatism, suggesting that they are more willing to try the experiential or trial services provided by marketers. Regarding product usability and product sustainability, the differing results concerning the national cultural tendencies of masculinity and pragmatism in Indonesia and the Philippines suggest that consumers with a low degree of masculinity value real-life quality rather than material, focus on human elements, and value product feasibility. For example, as long as products are usable, consumers with low levels of masculinity are less likely to care whether they are the latest. In contrast, consumers with a high degree of masculinity tend to focus on materialism and pursue the perfect. Hence, it can be inferred that they also value product feasibility, but expect the best possible products. Consumers with a high degree of pragmatism are frugal and save resources, which makes them value product sustainability. However, consumers with a low degree of pragmatism are characterized by their respect for society. Hence, it can be inferred that consumers with a low degree of pragmatism are fairly concerned about product sustainability, as well as governmental promotion and policy. With regard to product usability and sustainability, market segmentation should be carried out based on product performance.
In terms of innovative financial marketing, there are no national cultural traits in common between Indonesia and the Philippines. According to data from rural banks, BOP populations lack knowledge of innovative financial marketing. Most enterprises are worried about BOP populations’ capabilities to pay debts. However, the debt payment rate of the poor can be as high as 99%, which is far higher than that of the rich. Some other relevant findings are listed as follows:
(a)
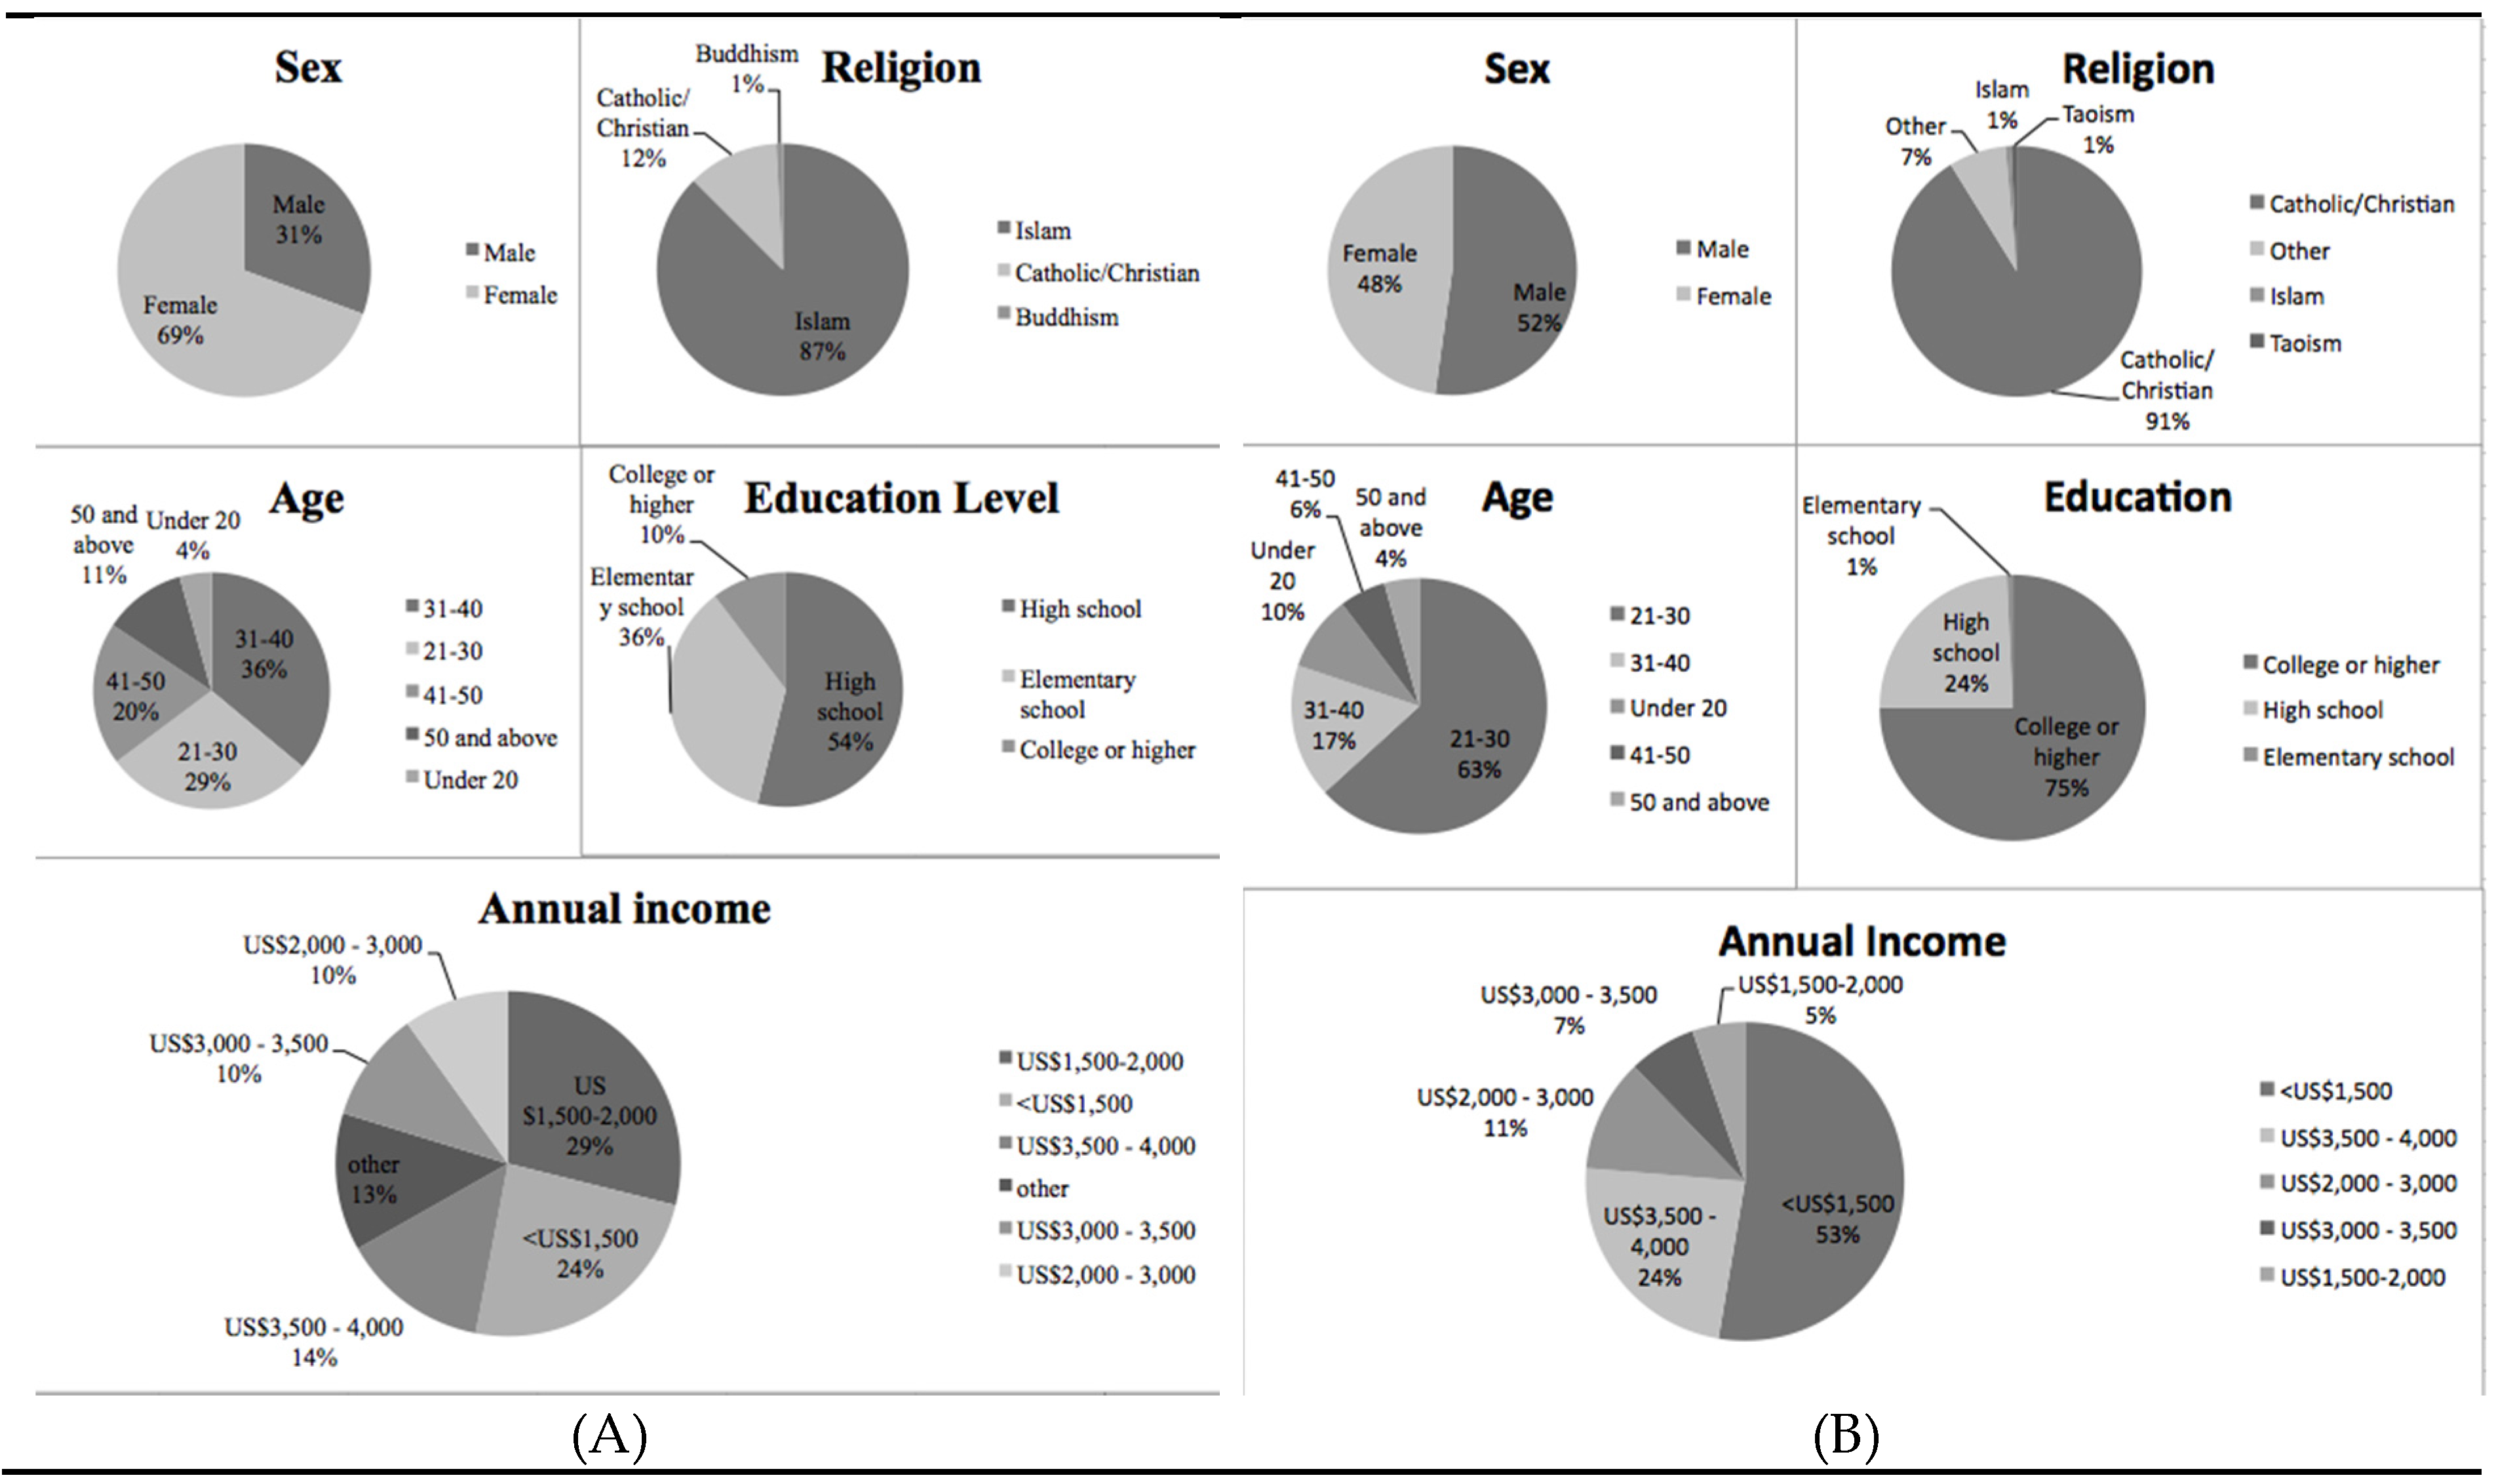
According to a Scheff test, consumers with a primary school educational level value product usability more than consumers with junior and senior high school educations or college and university educations. However, this study’s findings show that in the Philippines, educational level has no significant impact on BOP product design factors. A possible reason for this may be the fact that the data on the Philippines for this study have been collected through an online questionnaire. For the sample from the Philippines, 75% of participants had college and university educations or higher. This suggests that educational level, as a variable, is connected to slight differences regarding BOP product design.
(b)
Annual income has a significant influence on the “product sustainability” consideration in Indonesia. According to a Scheff test, Indonesian consumers with average annual incomes of USD 1,500 or more cared less about “product sustainability” than consumers with average annual incomes of USD 4000 or more. However, in the Philippines, average annual income was not found to have any significant impact on BOP product design considerations. This may also be due to the online method of data collection. For the sample from the Philippines in this study, 50.7% of participants had average annual incomes of USD 1500 or more. This shows that average annual income has a slight impact on BOP product design.

5. Conclusions

This research presents a preliminary study of the national cultural traits of different BOP populations with regard to BOP product design. In terms of consumer perspectives, it explores the BOP product design dimensions valued by consumers, and further verifies the relationships between them. This makes it possible to clarify the relationship between cultural traits and BOP product design, so as to help enterprises introduce products to the BOP market without barriers.
This study also involved the first empirical research comparing consumers in Indonesia and the Philippines in terms of BOP product design relationships. Previous studies have surveyed different products in individual countries, but this study covers BOP consumers in both Indonesia and the Philippines. The findings of this study cannot therefore be considered to be fully representative of all consumers in both countries since the sample data collection were mainly restricted to the slum districts and suburbs of the capital regions. This should be considered in the application of this study’s conclusions. In addition, with regard to the scale of national cultural traits, as respondents may be negatively affected by too many questions, two questions were designed for each dimension. Other researchers have argued that there should be at least three questions for each dimension in a survey. Otherwise, the lack of options may lead to failed measures of dimensional characteristics. Hence, the impact of these differences should be considered.
This study also determined that BOP consumers in Indonesia and the Philippines are interested in online communications and transportation products and services. These should thus be explored in future research. In addition, the different tendencies associated with different national cultural traits should be considered, and markets should be segregated by product usability and product sustainability, based on different products’ performance. The HLM method can be applied in the analysis of the relationship between national cultural traits and BOP product design factors, as it can take into account variables at different levels. The traditional statistics method places variables of different levels into a single regression model to determine BOP product demand. This helps enterprises enter the BOP market without barriers. Finally, this study’s exploration of the relationships between demographic statistics variables and BOP product design shows that educational level and income can impact the BOP product design relationship. However, this study only explores demographic statistic variables. Differences in BOP product design have not been incorporated into the research framework. Since demographic statistic variables impact BOP product design, follow-up research about BOP marketing [45,46] should be conducted and analysed further.

Acknowledgments

The author would like to thank the National Science Council of the Republic of China, Taiwan for financially supporting this research under contract 104-2621-M-033 -004.

Author Contributions

Tsai Chi Kuo and Wan Chen Sun designed the research; Tsai Chi Kuo and Wan Chen Su performed the research; Jessica Hanafi and Rex Robielos collected and analyzed data; Tsai Chi Kuo and Wan Chen Sun wrote the paper; and finally, Jessica Hanafi and Rex Robielos revised the paper. All authors have read and approved the final manuscript.

Conflicts of Interest

The authors declare no conflict of interest.

References

  1. UN. World Population Prospects: The 2012 Revision; UN: New York, NY, USA, 2013; pp. 19–20. [Google Scholar]
  2. Prahalad, C.K. The Fortune at the Bottom of the Pyramid: Eradicating Poverty though Profits; Person Education: Upper Saddle River, NJ, USA, 2004. [Google Scholar]
  3. London, T.; Hart, S.L. Reinventing strategies for emerging markets: beyond the transnational model. J. Int. Bus. Stud. 2004, 35, 350–370. [Google Scholar] [CrossRef]
  4. Sinkovics, N.; Sinkovics, R.R.; Yamin, M. The role of social value creation in business model formulation at the bottom of the pyramid—Implications for MNEs? Int. Bus. Rev. 2014, 23, 692–707. [Google Scholar] [CrossRef]
  5. Rivera-Santos, M.; Rufín, C. Global village vs. small town: Understanding networks at the Base of the Pyramid. Int. Bus. Rev. 2010, 19, 126–139. [Google Scholar] [CrossRef]
  6. Zhao, G.; Cavusgil, E.; Zhao, Y. A protection motivation explanation of base-of-pyramid consumers’ environmental sustainability. J. Environ. Psychol. 2016, 45, 116–126. [Google Scholar] [CrossRef]
  7. Arnould, E.J.; Mohr, J.J. Dynamic transformations for base-of-the-pyramid market clusters. J. Acad. Mark. Sci. 2005, 33, 254–274. [Google Scholar] [CrossRef]
  8. Coleman, S.; Kariv, D. Creating the Social Venture; Routledge: Abingdon, UK, 2015. [Google Scholar]
  9. Subrahmanyan, S.; Gomez-Arias, J.T. Integrated approach to understanding consumer behavior at bottom of pyramid. J. Consum. Market. 2008, 25, 402–412. [Google Scholar]
  10. Ramani, S.V.; SadreGhazi, S.; Duysters, G. On the diffusion of toilets as bottom of the pyramid innovation: Lessons from sanitation entrepreneurs. Technol. Forecast. Soc. Chang. 2012, 79, 676–687. [Google Scholar] [CrossRef]
  11. Dey, B.L.; Pandit, A.; Saren, M.; Bhowmick, S.; Woodruffe-Burton, H. Co-creation of value at the bottom of the pyramid: Analysing Bangladeshi farmers' use of mobile telephony. J. Retail. Consum. Serv. 2016, 29, 40–48. [Google Scholar] [CrossRef]
  12. Prahalad, C.K.; Hammond, A. What Works: Serving The poor, Protably: A Private Sector Strategy for Global Digital Opportunity; Markle Foundation/World Resources Institute, Digital Dividend: Washington, DC, USA, 2001. [Google Scholar]
  13. Prahalad, C.K.; Hart, S.L. The Fortune at the Bottom of the Pyramid; Pearson Prentice Hall: Upper Saddle River, NJ, USA, 2006. [Google Scholar]
  14. Anderson, J.; Markides, C. Strategic Innovation at the Base of the Pyramid. MIT Sloan Manag. Rev. 2007, 49, 83–88. [Google Scholar]
  15. Hammond, A.L.; Prahalad, C.K. Selling to the poor. Foreign. Policy 2004, 142, 30–37. [Google Scholar] [CrossRef]
  16. Hofstede, G. National Cultures Revised. Behav. Sci. Res. 1983, 18, 285–304. [Google Scholar]
  17. UNEP. How Can Business Encourage Sustainable Consumption in Base of the Pyramid Markets? UNEP/Wuppertal Institute Collaborating Centre on Sustainable Consumption and Production (CSCP): Wuppertal, Germany, 2010. [Google Scholar]
  18. Kolk, A.; Rivera-Santos, M.; Rufin, C.R. Reviewing a Decade of Research on the Base/Bottom of the Pyramid (BOP) Concept. Bus. Soc. 2013, 20, 1–40. [Google Scholar] [CrossRef]
  19. Ireland, J. Lessons for successful BOP marketing from Caracas' slums. J. Consum. Market. 2008, 25, 430–438. [Google Scholar]
  20. Simanis, E.; Hart, S.L. Innovation from the inside out. MIT Sloan Manag. Rev. 2009, 50, 77–86. [Google Scholar]
  21. Tooley, J. Could for-profit private education benefit the poor? Some a priori considerations arising from case study research in India. J. Educ. Policy 2007, 22, 321–342. [Google Scholar] [CrossRef]
  22. Viswanathan, M.; Rosa, J.A. Product and Market Development for Subsistence Marketplaces: Consumption and Entrepreneurship beyond Literacy and Resource Barriers. In Product and Market Development for Subsistence Marketplaces; JAI: Amsterdam, The Netherlands, 2007; pp. 1–17. [Google Scholar]
  23. Kolk, A. Sustainability, Accountability and Corporate Governance: Exploring Multinationals' Reporting Practices. Bus. Strategy Environ. 2008, 17, 1–15. [Google Scholar] [CrossRef]
  24. Hammond, A.L.; Kramer, W.J.; Katz, R.S.; Tran, J.T.; Walker, C. The Next Four Billion: Market Size and Business Strategy at the Base of the Pyramid; International Finance Corporation/World Resources Institute Washington DC: Washington, DC, USA, 2007. [Google Scholar]
  25. Mendoza, R.U. Why do the poor pay more? Exploring the poverty penalty concept. J. Int. Dev. 2011, 23, 1–28. [Google Scholar] [CrossRef]
  26. Hart, S.L.; Cañeque, F.C. Base of the Pyramid 3.0: Sustainable Development Through Innovation and Entrepreneurship; Greenleaf Publishing: Sheffield, UK, 2015. [Google Scholar]
  27. Simanis, E.N.; Hart, S.L. The Base of the Pyramid Protocol: Toward Next Generation BoP Strategy Center for Sustainable Global Enterprise; Cornell University, Johnson School of Management: Ithaca, NY, USA, 2008. [Google Scholar]
  28. Rigby, D.; Bilodeau, B. Management Tools and Trends 2009; Bain & Company: Boston, MA, USA, 2009. [Google Scholar]
  29. Crul, M.R.M.; Diehl, J.C. Design for Sustainability-A Practical Approach for Developing Economies; UNEP and Delft University of Technology: Delft, The Netherlands, 2009. [Google Scholar]
  30. Castillo, L.G.; Diebl, J.C. Design Considerations for Base of the Pyramid (BOP) Project; Delf University of Technology: Delft, The Netherlands, 2012. [Google Scholar]
  31. Kandachar, P. Designing for Global Sustainable Solutions Challenges and Opportunities. In Sustainability in Design: Now! Challenges and Opportunities for Design Research, Education and Practice in the XXI Century; Ceschin, F., Vezzoli, C., Zhan, J., Eds.; Greenleaf Publishing Limited: London, UK, 2010. [Google Scholar]
  32. Hofstede, G. The business of international business is culture. Int. Bus. Rev. 1994, 3, 1–14. [Google Scholar] [CrossRef]
  33. Smith, P.B.; Dugan, S.; Trompenaars, F. National Culture and the Values of Organizational Employees: A Dimensional Analysis Across 43 Nations. J. Cross-Cult. Psychol. 1996, 27, 231–264. [Google Scholar] [CrossRef]
  34. Malhotra, S.; Sivakumar, K.; Zhu, P. A comparative analysis of the role of national culture on foreign market acquisitions by U.S. firms and firms from emerging countries. J. Bus. Res. 2011, 64, 714–722. [Google Scholar] [CrossRef]
  35. Fletcher, R. The Impact of Culture on Marketing at the Bottom of the Pyramid. Available online: http://www.unice.fr/crookall-cours/iup_cult/_docs/_Fletcher%20-%20Cultural%20Differences%20marketing%205687.pdf (accessed on 15 February 2016).
  36. Van Boeijen, A. Crossing Cultural Chasms Towards a Culture-Conscious Approach to Design, TUDelft. Available online: http://studiolab.ide.tudelft.nl/studiolab/vanboeijen/files/2011/05/Proefschrift-AGC-van-Boeijen.pdf (accessed on 15 February 2016).
  37. Hofstede, G. Cultures and Organizations: Software of the Mind; McGraw-Hill Publication, 1997. [Google Scholar]
  38. Smith, C. Design for the Other 90%; Cooper-Hewitt, National Design Museum: New York, NY, USA, 2007. [Google Scholar]
  39. Fisher, M. Design to Kickstart Incomes. In Design for the other 90%; Cooper-Hewitt, National Design Museum: New York, NY, USA, 2007. [Google Scholar]
  40. ASME. Engineering Solutions for the Base of the Pyramid: A report prepared for the Strategic Issues Committee Strategic Management Sector; ASME: New York, NY, USA, 2009. [Google Scholar]
  41. BPS Indonesian Bureau of Statistics, Persentase Penduduk Miskin Maret 2015 mencapai 11,22 persen in Indonesian. Avaialble online: http://bps.go.id/brs/view/1158/ (accessed on 15 February 2016).
  42. KPMG KPMG New Indonesian “Branchless Banking” and Microfinance Laws—A Catalyst for Microfinance Growth? Available online: http://www.kpmg.com/ID/en/IssuesAndInsights/ArticlesPublications/Documents/Financial%20Inclusion%20in%20Indonesia.pdf (accessed on 15 February 2016).
  43. Rappler Bottom of Pyramid Market in PH Worth $33.4-B—ADB. Available online: http://www.rappler.com/business/features/39058-bottom-of-the-pyramid-market-in-phiippines-adb (accessed on 15 February 2016).
  44. Hofstede, G. Culture Insight. Available online: http://geert-hofstede.com (accessed on 15 February 2016).
  45. London, T. The Base of the Pyramid Promise: Building Businesses with Impact and Scale; Stanford University Press: Palo Alto, CA, USA, 2016. [Google Scholar]
  46. Singh, R. Poor markets: Perspectives from the base of the pyramid. Decision 2015, 42, 463–466. [Google Scholar] [CrossRef]
Figure 1. The consumption level of TOP and BOP.
Sustainability 08 00272 g001
Figure 2. Research model.
Sustainability 08 00272 g002
Figure 3. Basic data of respondents. (A) Indonesia respondent profile; (B) Philippines respondent profile.
Sustainability 08 00272 g003
Table 1. Enterprises’ wrong approaches to BOP groups [13].
Assumed PerceptionsWrong Decisions
The poor are not our target customers since they cannot afford high-quality products or services.Being unwilling to change the current cost structure and thus losing potential profits from the BOP market.
The poor will not use products sold in developed countries.BOP groups cannot afford products and thus not developing the BOP market
Only the mature market knows how to appreciate technological innovation and is ready to pay for it.BOP consumers do not need advanced technology and thus that it is unnecessary to develop innovative technology for BOP groups.
The BOP market is not important to the long-term development and survival of multinational companies.Acting as if the BOP market is not worth the company’s concern.
The sense of knowledge accomplishment exists only in a mature market, and it is very difficult to recruit managers for the BOP market.Not sending excellent talents to develop the BOP market.
Table 2. From BOP 1.0 to BOP 2.0 [27].
DifferencesBOP 1.0 (Selling to the Poor)BOP 2.0 (Business Co-Venturing)
View of peopleAs potential consumersAs business partners
Model of engagementDeep listeningDeep dialogue
Business solutionReduce price points, redesign packaging extend distributionExpand imagination marry capabilities, build shared commitment
Nature of relationshipsArm’s length relationships mediated by NGOsDirect, personal relationships facilitated by NGOs
Table 3. Innovative BOP marketing principles [2,10,13,20,27].
BOP Marketing Innovative Principles
(1)  Focus on value and on delivering performance for the price
(2)  Innovate
(3)  Make solutions scalable
(4)  Aim to conserve resources
(5)  Identify functionality
(6)  Think in terms of process innovations
(7)  Reduce the skills required to do a job
(8)  Educate consumers in the use of products
(9)  Design products and services that operate in very tough infrastructure environments
(10) Make interfaces simple and learning curves short
(11) Innovate in distribution
(12) Challenge assumptions
Table 4. Projects requirements for BOP project according to 4 design cluster [30].
ReferencesDesireabilityFeasibilityViabilitySustainability
Prahalad [2]
  • challenging conventional wisdom
  • education of customers
  • interfaces
  • skilling of work
  • process innovation
  • design for hostile infrastructure
  • deep understanding of functionality
  • price performance
  • hybrids
  • scalable and transportatable
  • distribution: accessing the customer
  • conserving resources
  • eliminate, reduce and recycle
Anderson & Markides [14]
  • acceptability
  • affordability
  • availability
  • awareness
Smith & Polak [38]
  • co-creation
  • infinite expand
  • miniatunization
  • appropriate technology
  • affordability
  • participatory developement
Fisher [39]
  • ergonomics and safety
  • cultural acceptability
  • design for available manufacturing capacity
  • strength and durability
  • ease of installation and use
  • portability
  • energy efficient (human powered)
  • income generating
  • return on investment
  • afforadability
  • environmental sustainability
Asme [40]
  • consider the context
  • design for DIY (do-it-yourself)
  • transparent technology
  • appropriate solutions not appropriate technology
  • embrace the market
Kandachar [31]
  • user-oriented
  • co-created
  • multi-stakeholder-s
  • adaptability
  • reliability
  • system thinking
  • affordability
  • availability
  • accessibility
  • BOP as produc er
  • sustainable development
  • coporate social responsibility
Table 5. Questionnaire design source criteria.
CategoriesCriteriaSub-CriteriaQuestionnaire Item
National cultural traits[N1] Individualism19. In a group, I like to be referred to with leadership titles
20. The growth of the national economy affects my quality of life
[N2] Uncertainty avoidance21. If a product is not clearly marked, even if it is cheap, I would not consider buying it
22. For new products to market, if I have no information on them from acquaintances, I would not consider buying them
[N3] Masculinity23. After buying an item, if I feel that I have overpaid, I will return it or request a refund
24. I think bargaining while shopping can save a lot of money
[N4] Power distance25. The customer is always right, and so even if a customer’s requirements are excessive, service personnel should try to meet them
26. I think that junior employees must obey the decisions made in the workplace by more senior employees
[N5] Pragmatism27. I have good saving habits
28. I believe that energy conservation and environmental protection are very important
BOP product design[B1] User desireReturning from overseas5. I have friends and family who are returning from overseas, so I have greater requirements for products
Effective marketing method7. If an item is highly appreciated by my family and friends, that encourages me to buy it
8. If sales staff comment on a product at a sales location, it encourages me to buy it
9. If experiences with a product or trial services are provided at a sales location, it encourages me to buy the product
After-sales service10. I think that the warranty on a product is very important
11. If fast repair or refund services are offered for a product, it will encourage me to buy it
[B2] Financial feasibilityCash credit17. If I need to use a product and do not have enough money, I will use microcredit to buy it
Lease18. If I need to use a product and do not have enough money, I will lease it
[B3] Scientific and technological feasibilityUsability1 When I buy products , they do not necessarily need to be the latest products, as long as they work
2. When I buy home appliances, I do not care if they are second-hand, as long as they work
Process simplification3. In my opinion, products should be consistent with my basic requirements, and no complex functions are needed
Sharing4 .I am willing to share products with my neighbors or family members
Modularization6. If I can repair a product by myself, it saves me trouble with maintenance
[B4] SustainabilityTraining12. In my opinion, environmentally-friendly products can reduce the destruction of the Earth
13. If the government subsidizes environmentally-friendly products, I will be more likely to buy them
14. If a product has environmentally friendly components, I will be more likely to buy it
15. If a product has environmentally friendly components, even if its price is higher, I will buy it
Inclusive enterprise16. If a manufacturer sets up in my country, to increase job opportunities and promote economic development, it will encourage me to buy the manufacturer’s products
Table 6. Expectations of appliance ownership among study participants with average annual incomes of USD 3500 or less.
ElectronicsIndonesiaPhilippines
TV81.8%100%
Refrigerator59.1%87.5%
Gas stove54.5%75%
Washing machine42.9%83.9%
Cooker45.5%22.6%
Cellphone75%60%
Sanitary facilities25.5%66.7%
Water pump15.6%25.2%
Table 7. Factor analysis of national cultural traits (I: Indonesia, P: Philippines).
FactorContent DescriptionFactor LoadingVariance (%)Cumulative (%)
IPIPIP
[N1]In a group, I like to be referred to with leadership titles0.9280.7649.0536.999.0536.99
The growth of the national economy affects my quality of life0.9180.770
[N2]If a product is not clearly marked, even if it is cheap, I would not consider buying it0.7920.71010.128.6919.1745.58
For new products to market, if I have no information on them from acquaintances, I would not consider buying them0.8460.975
[N3]After buying an item, if I feel that I have overpaid, I will return it or request a refund0.8540.83510.619.0029.7854.58
I think bargaining while shopping can save a lot of money0.7290.537
[N4]The customer is always right, and so even if a customer’s requirements are excessive, service personnel should try to meet them0.5280.85114.087.9043.8662.58
I think that junior employees must obey the decisions made in the workplace by more senior employees0.4740.620
[N5]I have good saving habits0.8200.77428.0611.0271.9273.06
I believe that energy conservation and environmental protection are very important0.8170.342
Table 8. Factor analysis of BOP product design.
FactorContents of FactorFactor LoadingVarianceCumulative Variance
[B1]If sales staff comment on a product at a sales location, it encourages me to buy it0.83328.71228.712
If experiences with a product or trial services are provided at a sales location, it encourages me to buy the product0.798
I think that the warranty on a product is very important0.642
If fast repair or refund services are offered for a product, it will encourage me to buy it0.637
If an item is highly appreciated by my family and friends, that encourages me to buy it0.620
[B2]If the government subsidizes environmentally-friendly products, I will be more likely to buy them0.73413.31742.028
If a product has environmentally friendly components, I will be more likely to buy it0.734
In my opinion, environmentally-friendly products can reduce the destruction of the Earth0.721
[B3]When I buy home appliances, they do not necessarily need to be the latest products, as long as they work0.75010.03152.059
In my opinion, products should be consistent with my basic requirements, and no complex functions are needed0.654
When I buy home appliances, I do not care if they are second-hand, as long as they work0.610
If I can repair a product by myself, it saves me trouble with maintenance0.467
[B4]If I need to use a product and do not have enough money, I will lease it0.8698.33060.390
If I need to use a product and do not have enough money, I will use microcredit to buy it0.838
Table 9. Related coefficient matrixes for all factors.
8[N1][N2][N3][N4][N5][B1][B2][B3][B4]
IPIPIPIPIPIPIPIPIP
111
20.167 *0.420 **11
30.253 **0.340 **0.137 *0.440 **11
40.209 **0.397 **0.243 **0.423 **0.403 **0.444 **11
50.212 **0.518 **0.0410.388 **0.289 **0.461 **0.429 **0.424 **11
60.374 **0.381 **0.354 **0.407 **0.144 *0.464 **0.247 **0.371 **0.135 *0.450 **11
70.138 *0.262 **0.170 **0.353 **0.300 **0.385 **0.255 **0.184 *0.149 *0.323 **0.246 **0.370 **11
80.0920.478 **−0.0530.356 **0.157 *0.385 **0.177 **0.295 **0.408 **0.592 **0.155*0.686 **0.140 *0.359 **11
90.1160.1220.0540.241 **0.0410.069−0.0580.137−0.133*0.0000.1060.0280.094−0.126−0.181 **−0.05311
Notes: (1) I = Indonesia, P = Philippines; (2) ** = Significant at 0.01 (two-tailed), * = significant at 0.05 (two-tailed).
Table 10. t-test of national cultural traits and BOP product design for Indonesia and Philippines.
FactorMeanP Value
IndonesiaPhilippines
[N1]3.3534 < 3.55150.018 *
[N2]3.0086 < 3.41180.000 **
[N3]3.3901 < 3.73900.000 **
[N4]3.4375 < 3.78310.000 **
[N5]4.0237 > 3.91540.150
[B1]3.2147 < 3.82350.000 **
[B2]3.5884 < 3.66910.256
[B3]3.9287 < 4.12250.013 *
[B4]2.4246 < 2.70220.007 **
Note: * = p < 0.05, ** = p < 0.01.
Table 11. Stepwise regression analysis of national cultural traits and BOP product design—marketing activities (Note: ß = regression coefficient, R2 = coefficient of determination).
CountryFactorßR2R2 Change
Indonesia BOPIndividualism0.3240.1410.141
Uncertainty avoidance0.2990.2270.086
Philippines BOPPragmatism0.2640.2280.228
Uncertainty avoidance0.2570.3130.085
Masculinity0.2240.3470.034
Table 12. Stepwise regression analysis of national cultural traits and BOP product design—product usability.
CountryFactorßR2R2 Change
Indonesia BOPMasculinity0.2350.0900.090
Power distance0.1610.1120.022
Philippines BOPMasculinity0.2240.1680.168
Uncertainty avoidance0.2040.2170.049
Pragmatism0.1950.2440.027
Table 13. Stepwise regression analysis of national cultural traits and BOP product design—product sustainability.
CountryFactorßR2R2 Change
IndonesiaPragmatism0.4080.1670.167
Philippines BOPPragmatism0.4860.3800.380
Individualism0.2410.4210.041
Table 14. Stepwise regression analysis of national cultural traits and BOP product design—innovative financial feasibility.
CountryFactorßR2R2 Change
IndonesiaPragmatism−0.1650.0180.18
Individualism0.1510.0390.22
Philippines BOPUncertainty avoidance0.2550.0650.065
Table 15. Hofstede’s culture scores for Indonesia and Philippines [44].
CountriesIndividualismUncertainty AvoidanceMasculinityPower DistancePragmatism
Indonesia1448467862
Philippines3244649427
Notes: Maximum = 100.
Table 16. National cultural traits of different BOP populations, with regard to product design.
Product designIndividualismUncertainty AvoidanceMasculinityPower DistancePragmatism
IPIPIPIPIP
Marketing activities
Product usability
Product sustainability
Financial feasibility√(n)
Note: n = negative effect, I = Indonesia, P = Philippines.

