
Sustainable Load-Balancing Scheme for Inter-Sensor Convergence Processing of Routing Cooperation Topology


Abstract
:1. Introduction
2. Related Works
2.1. Existing Topology Design and Verification Tools
2.2. Topology Reconfiguration and Control and Load-Balancing Mechanism
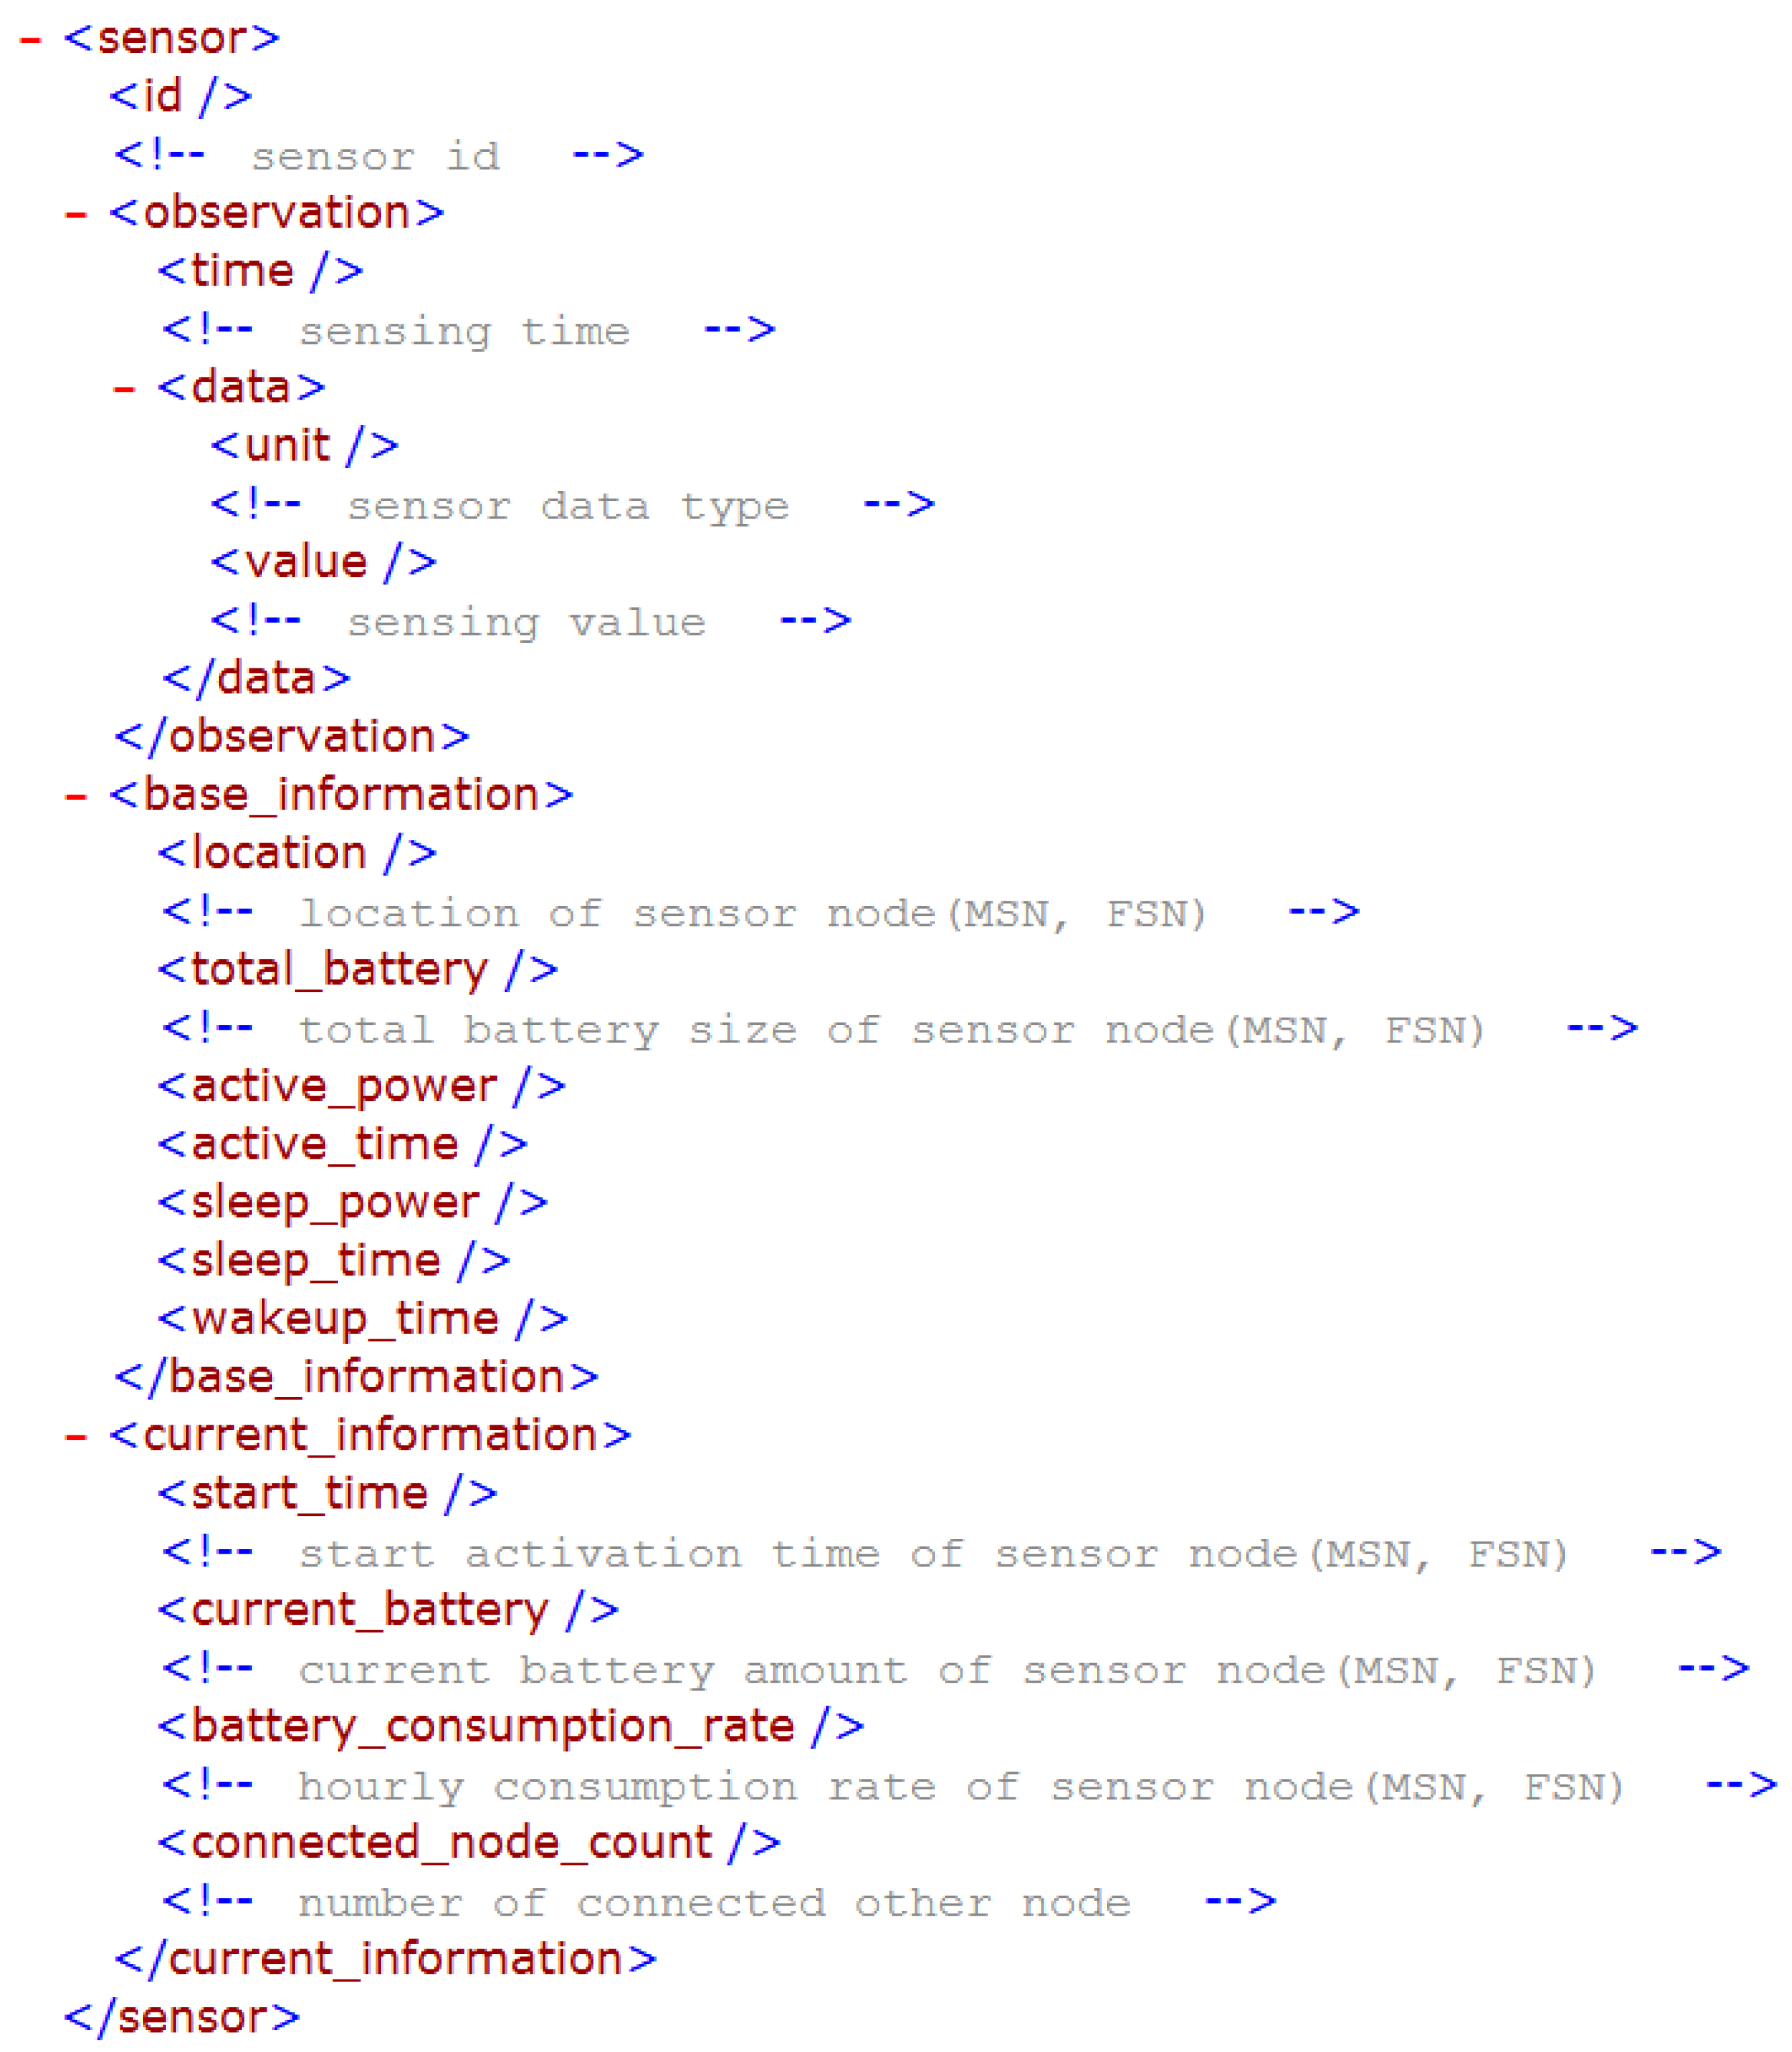
3. SLS Scheme
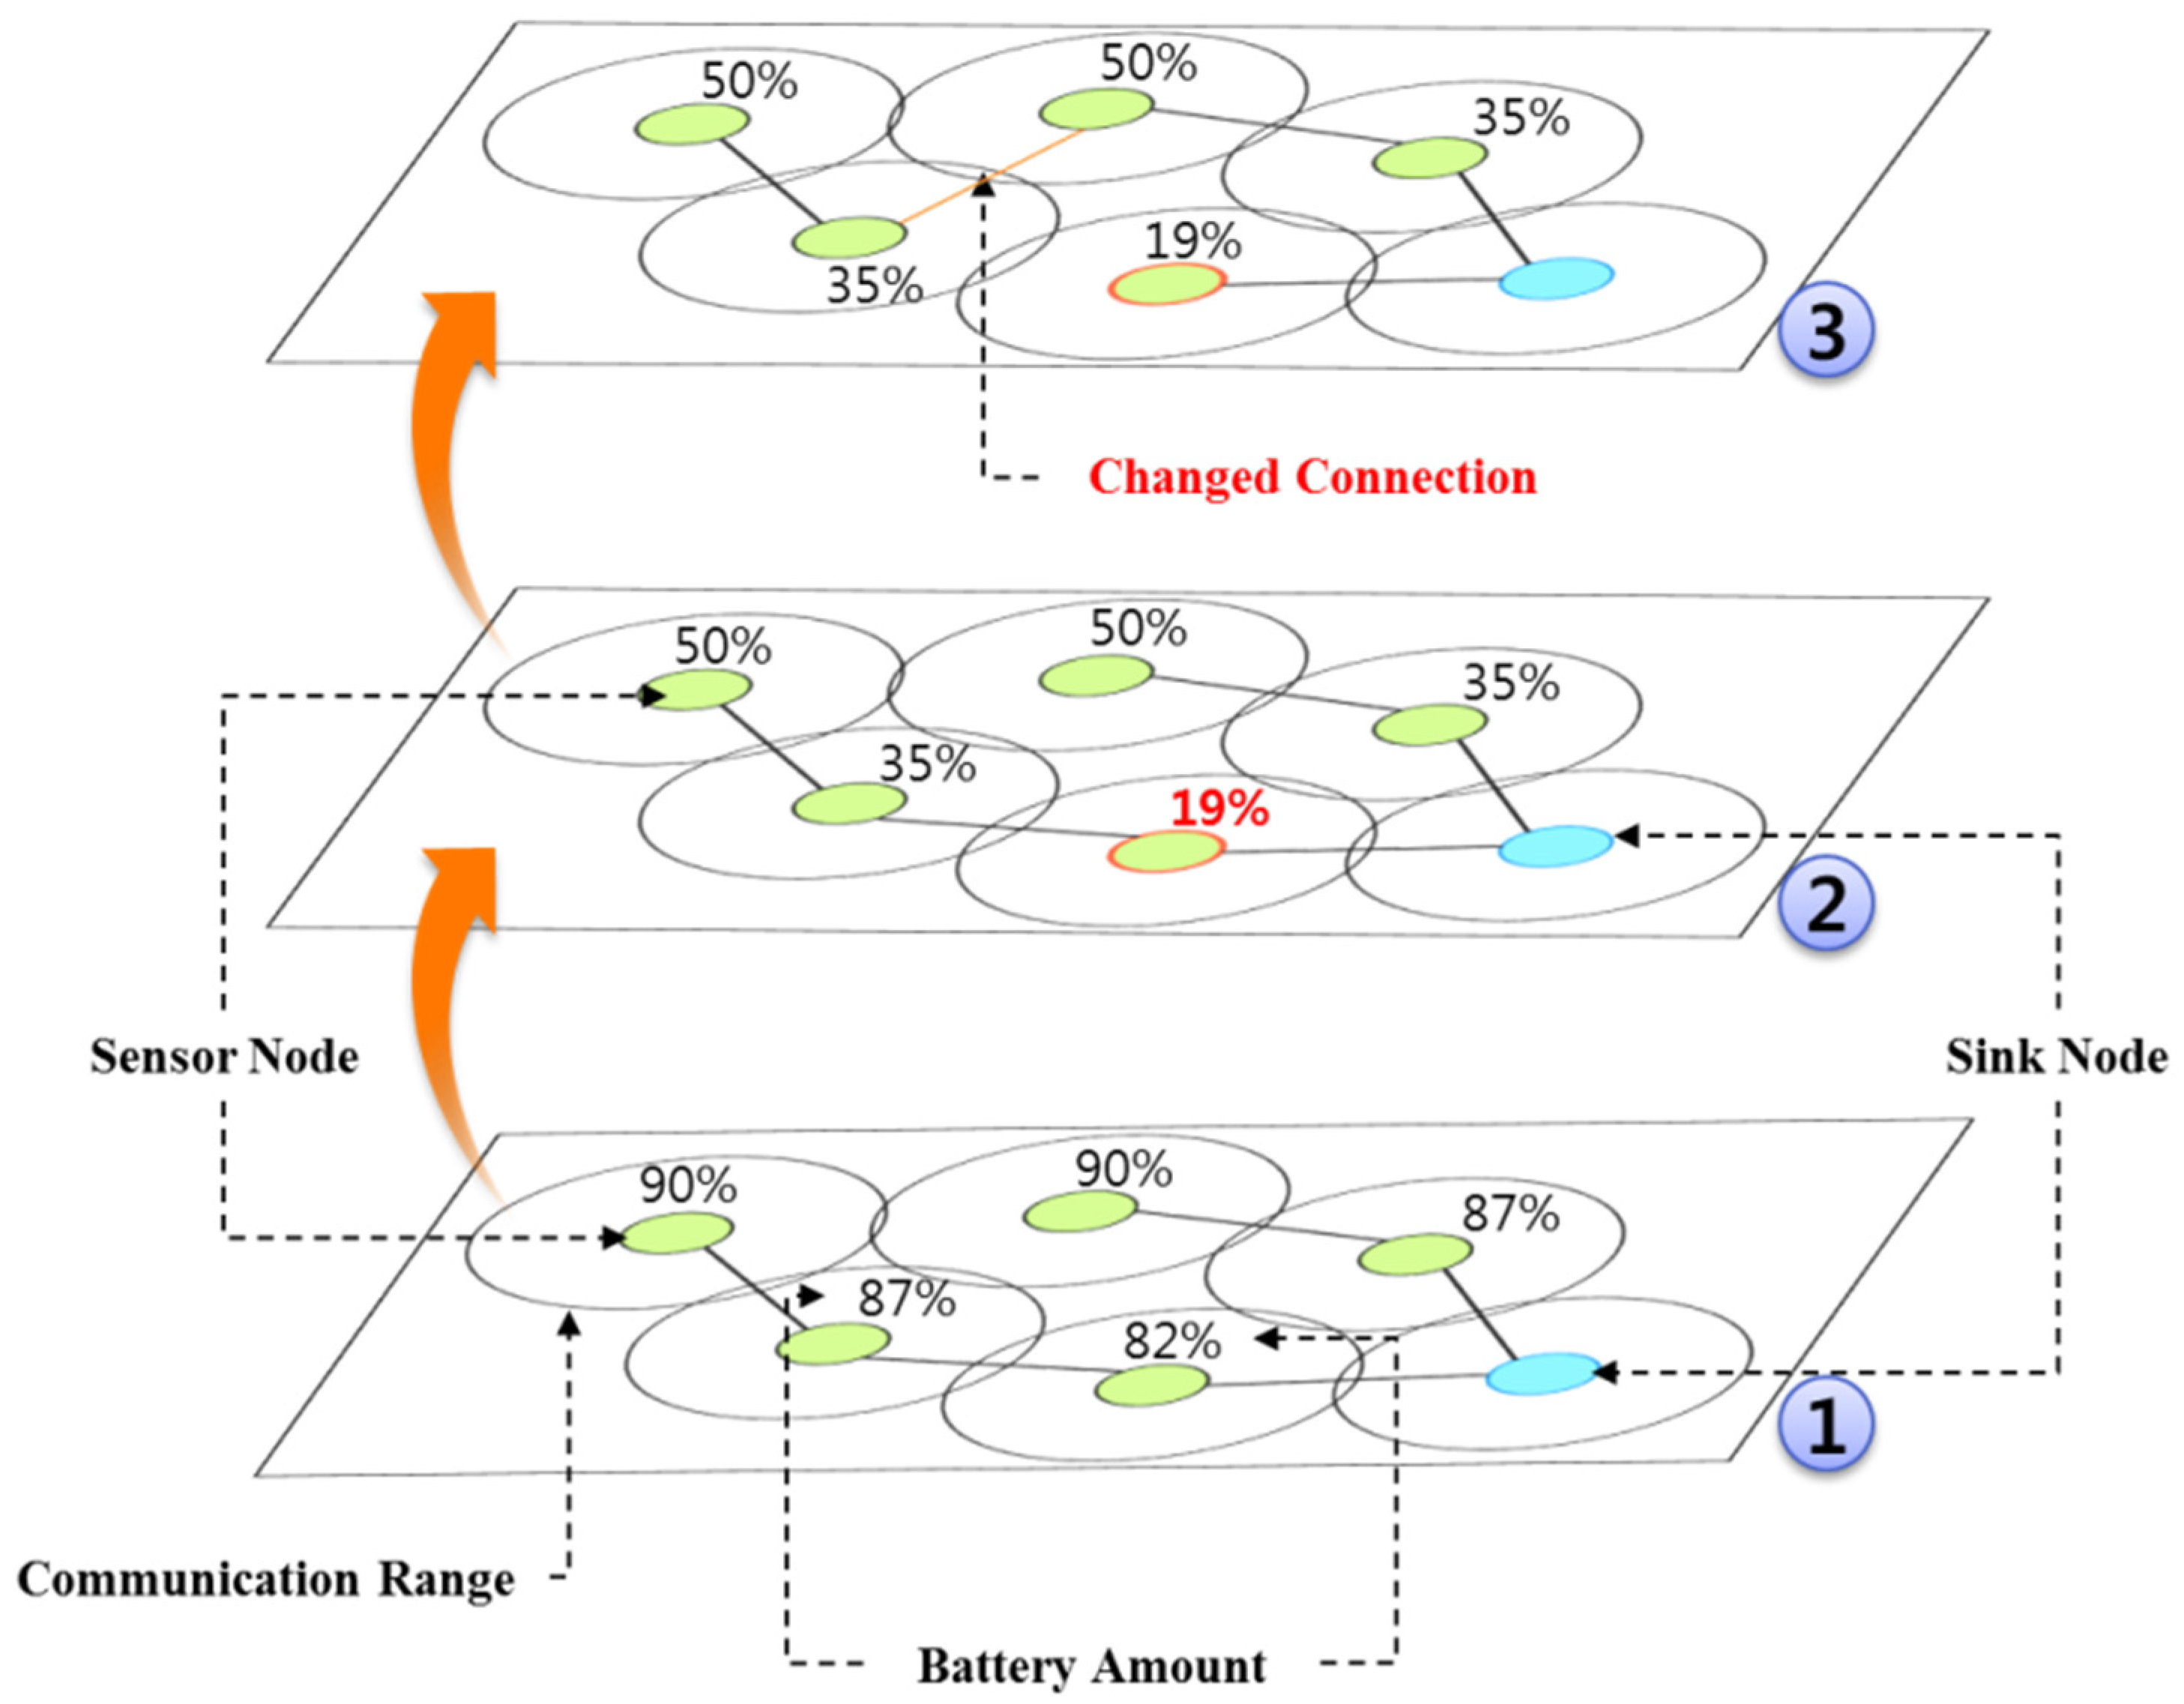
- ①
- The battery consumption rate per unit time is computed in the initially composed topology. The battery consumption rate is calculated by using the battery remains after the implementation to active and sleep modes with the time that the sensor first operated as a standard, which can be expressed as in Equation (1).
- ②
- The battery consumption rate is compared to that of other connectable neighboring sensor nodes. The basic method of comparison is to sending its own battery consumption rate during communication for connectivity maintenance. Here, the comparison is conducted when transferring sensing data or routing sensing data from other sensor nodes.
- ③
- Referring to the battery consumption rate comparison results in ②, sensing data are transferred to the sensor nodes that have lower battery consumption rates.
- ④
- The received sensor nodes iteratively perform ①, ②, and ③ until the transfer to the sink node is complete.
- ①
- The battery consumption rate per unit time is computed in the initially composed topology. The battery consumption rate is calculated by using the battery remains after the implementation to active and sleep modes with the time that the sensor first operated as a standard, which can be expressed as in Equation (1).
- ②
- If is equal to or larger than the threshold value, proceed to ③. Otherwise, sensing data are transferred to the connected sensor nodes. If it is not larger than the threshold value, ① and ② are iteratively performed until the received sensor node transfers to the sink node, routing the sensing data.
- ③
- The battery consumption rate is compared to that of other connectable neighboring sensor nodes. The basic method of comparison is to send its own battery consumption rate during communication for connectivity maintenance. Here, the comparison is conducted when transferring sensing data or routing sensing data from other sensor nodes.
- ④
- Referring to the battery consumption rate comparison results in ②, sensing data are transferred to the sensor nodes that have lower battery consumption rates.
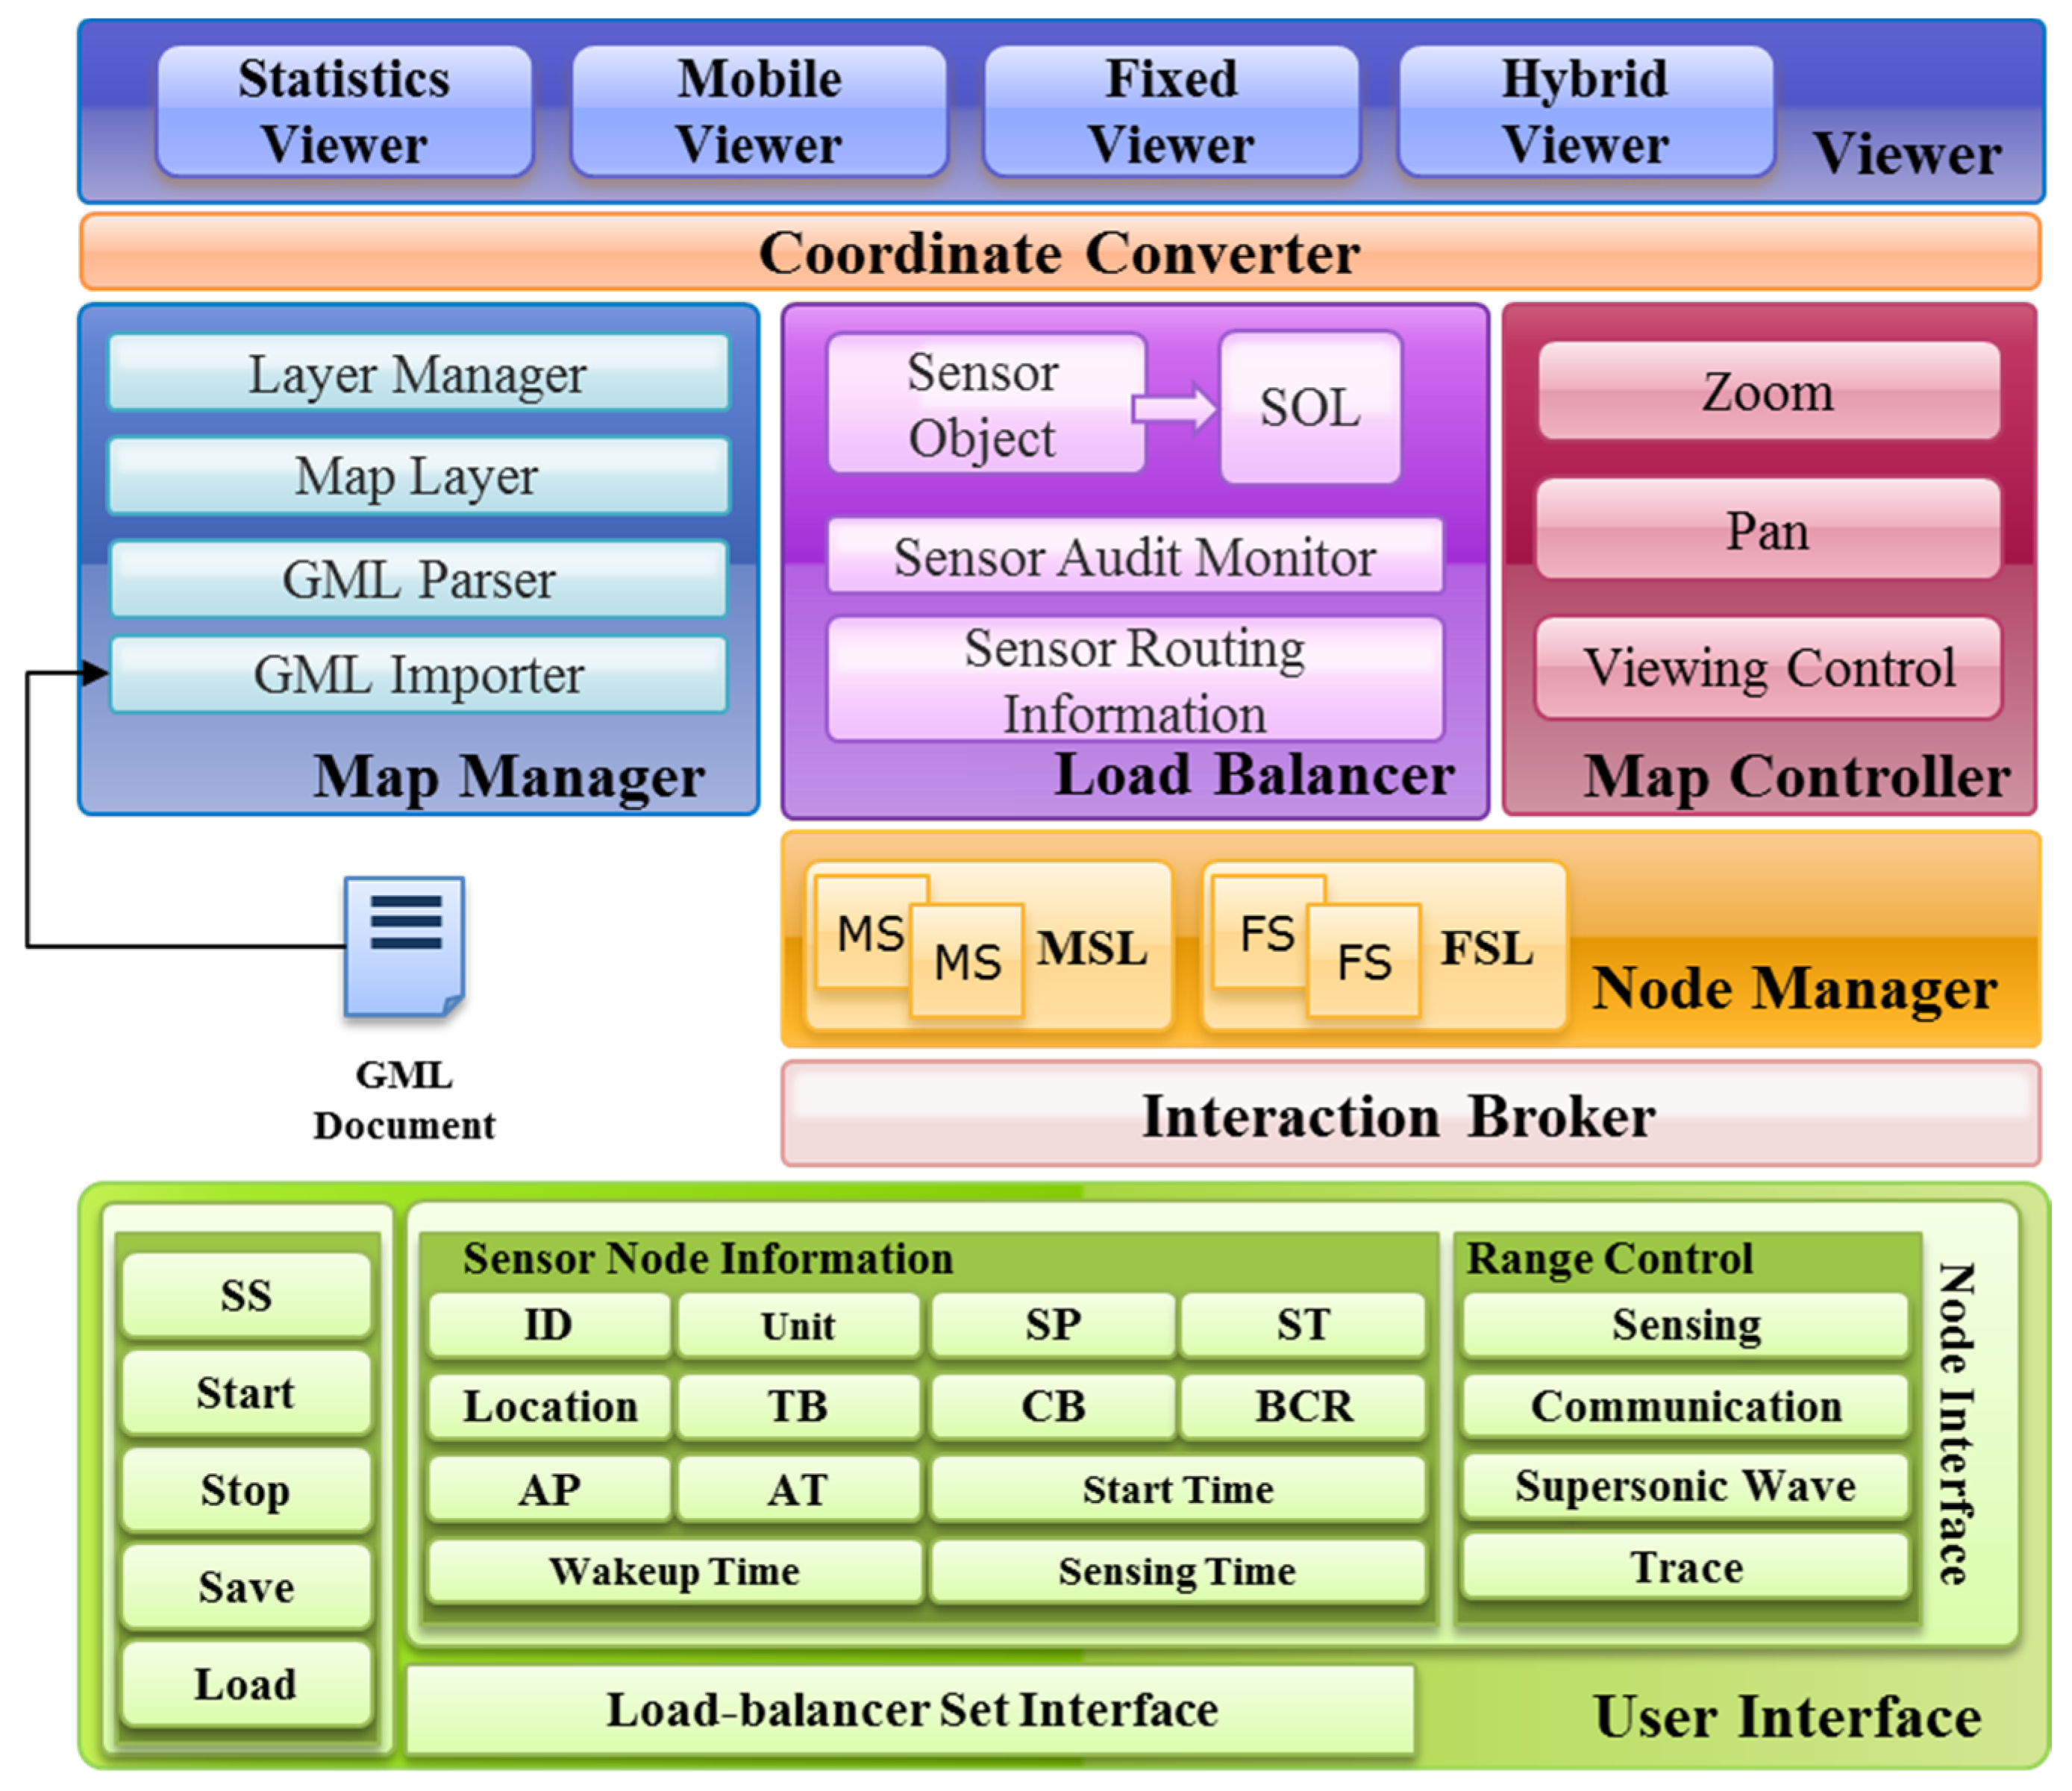
4. Design of the SLS
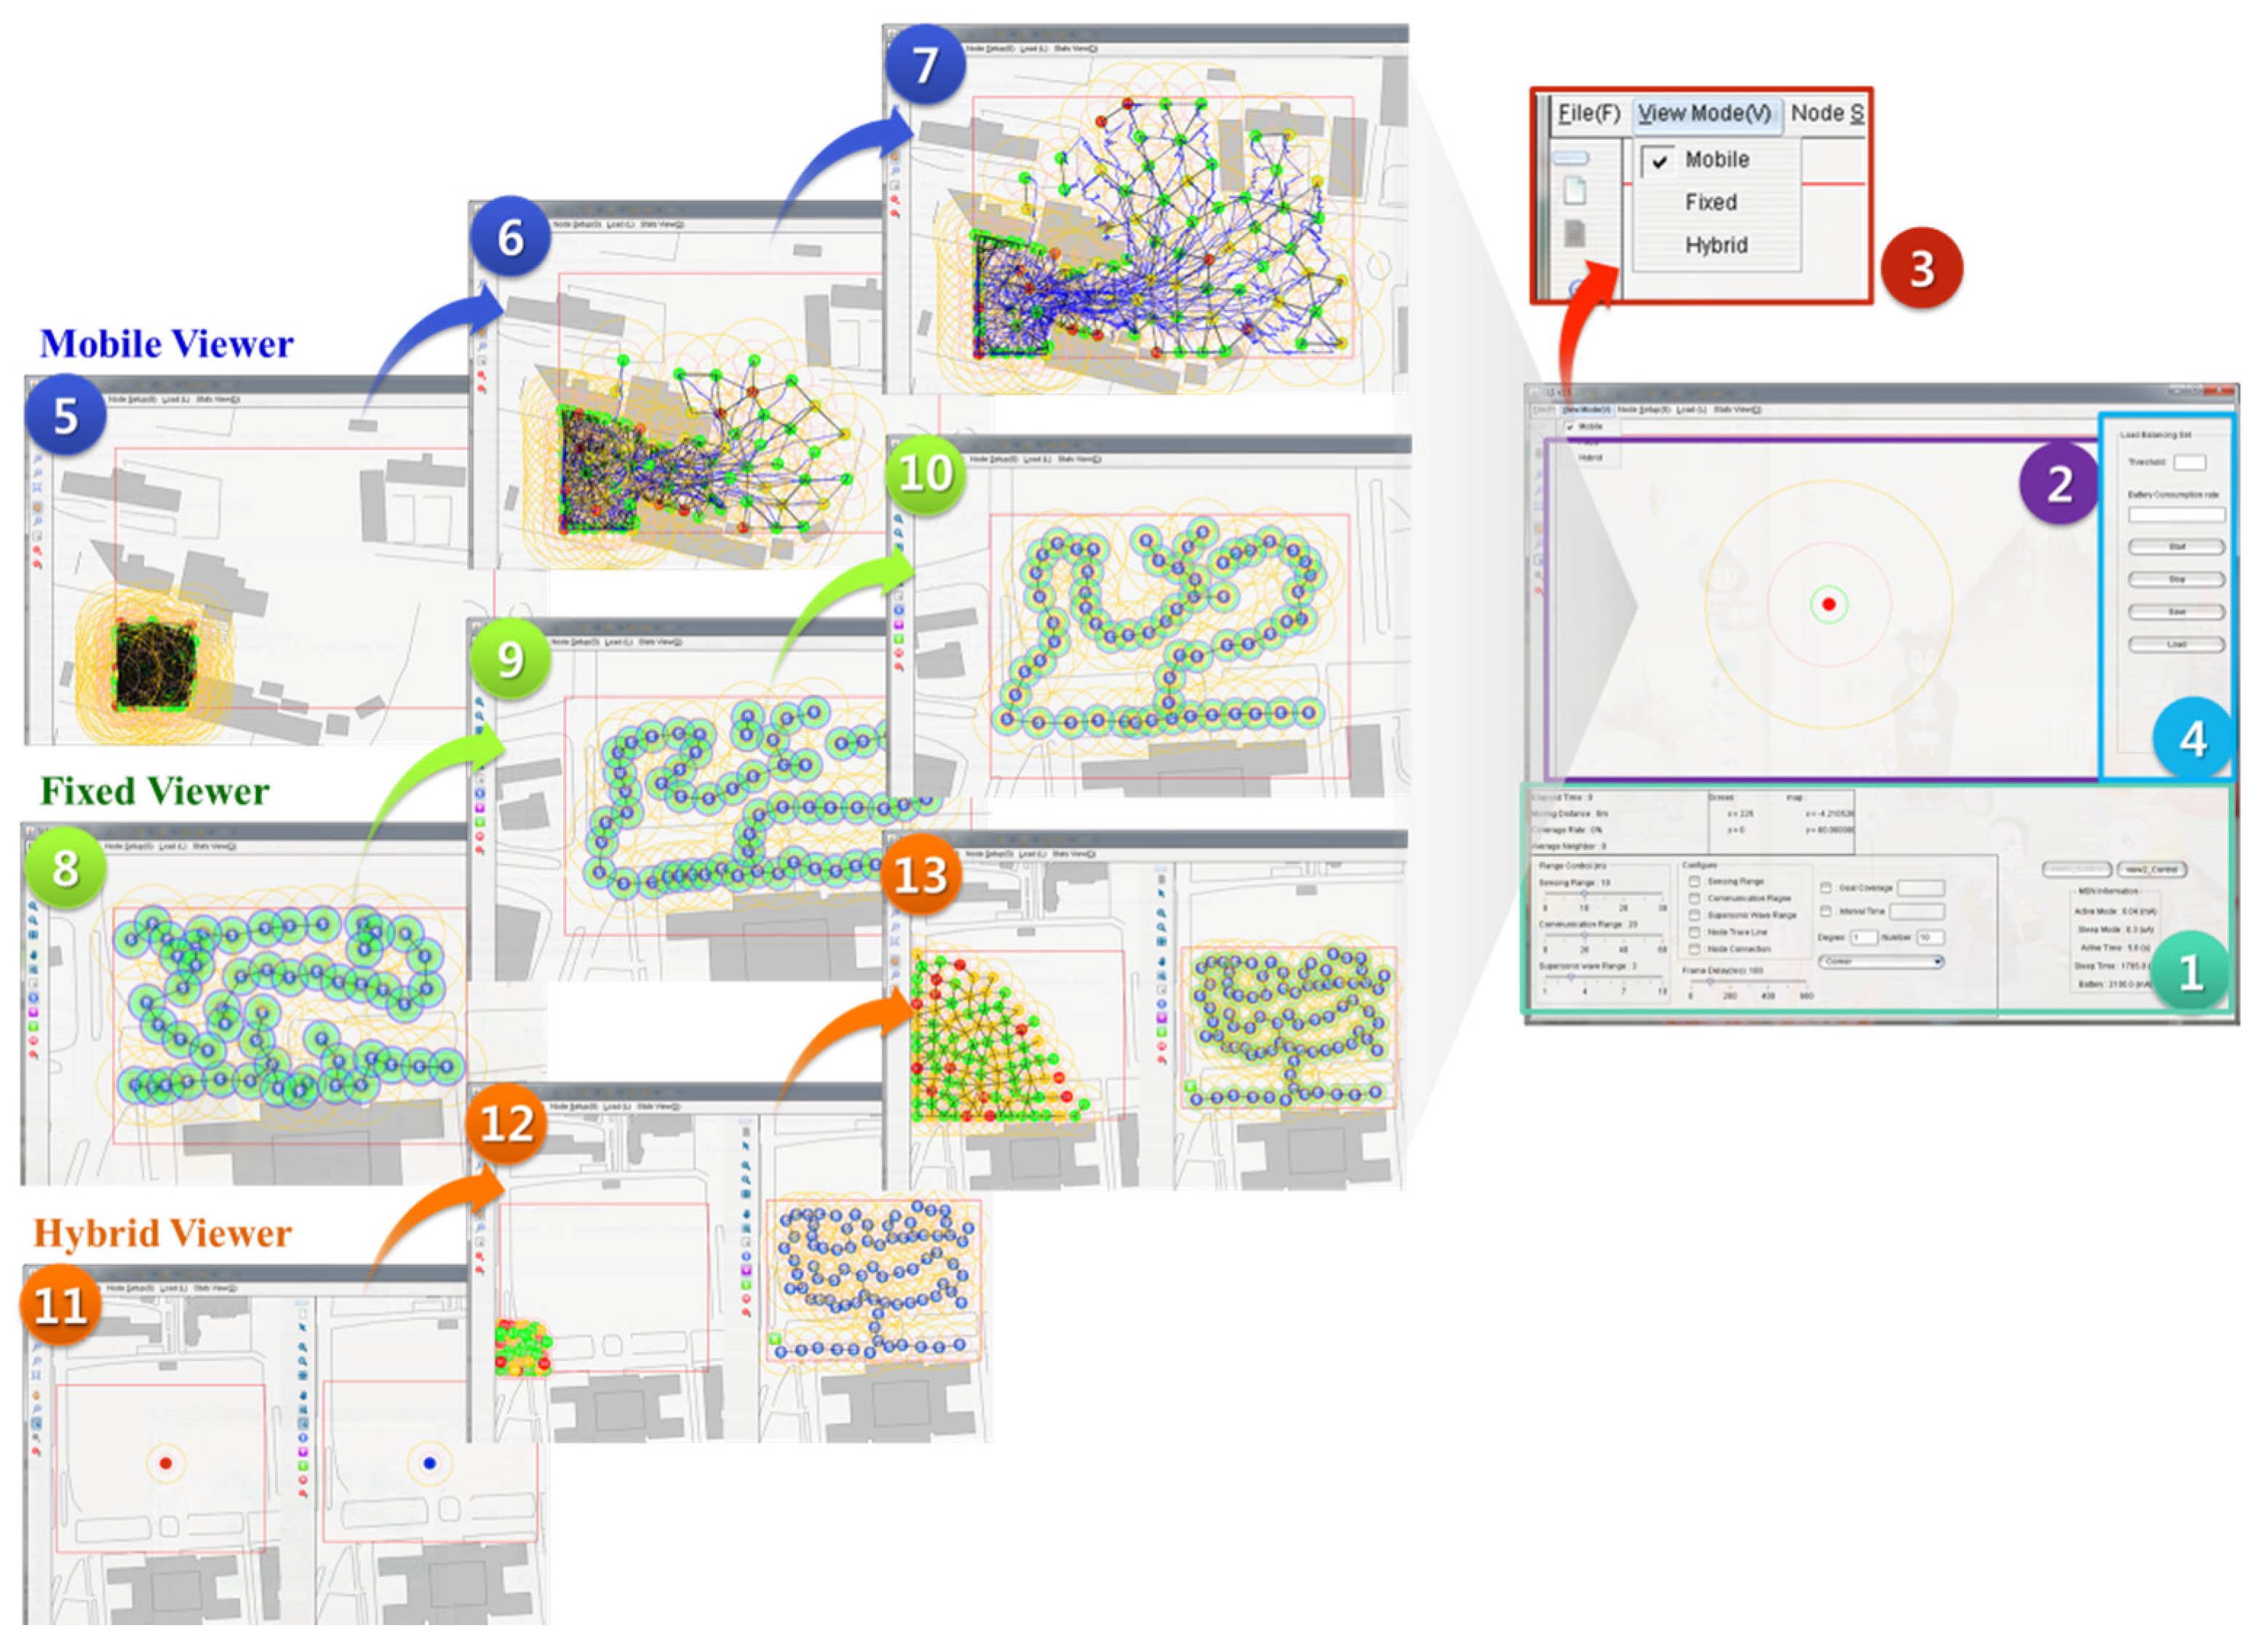
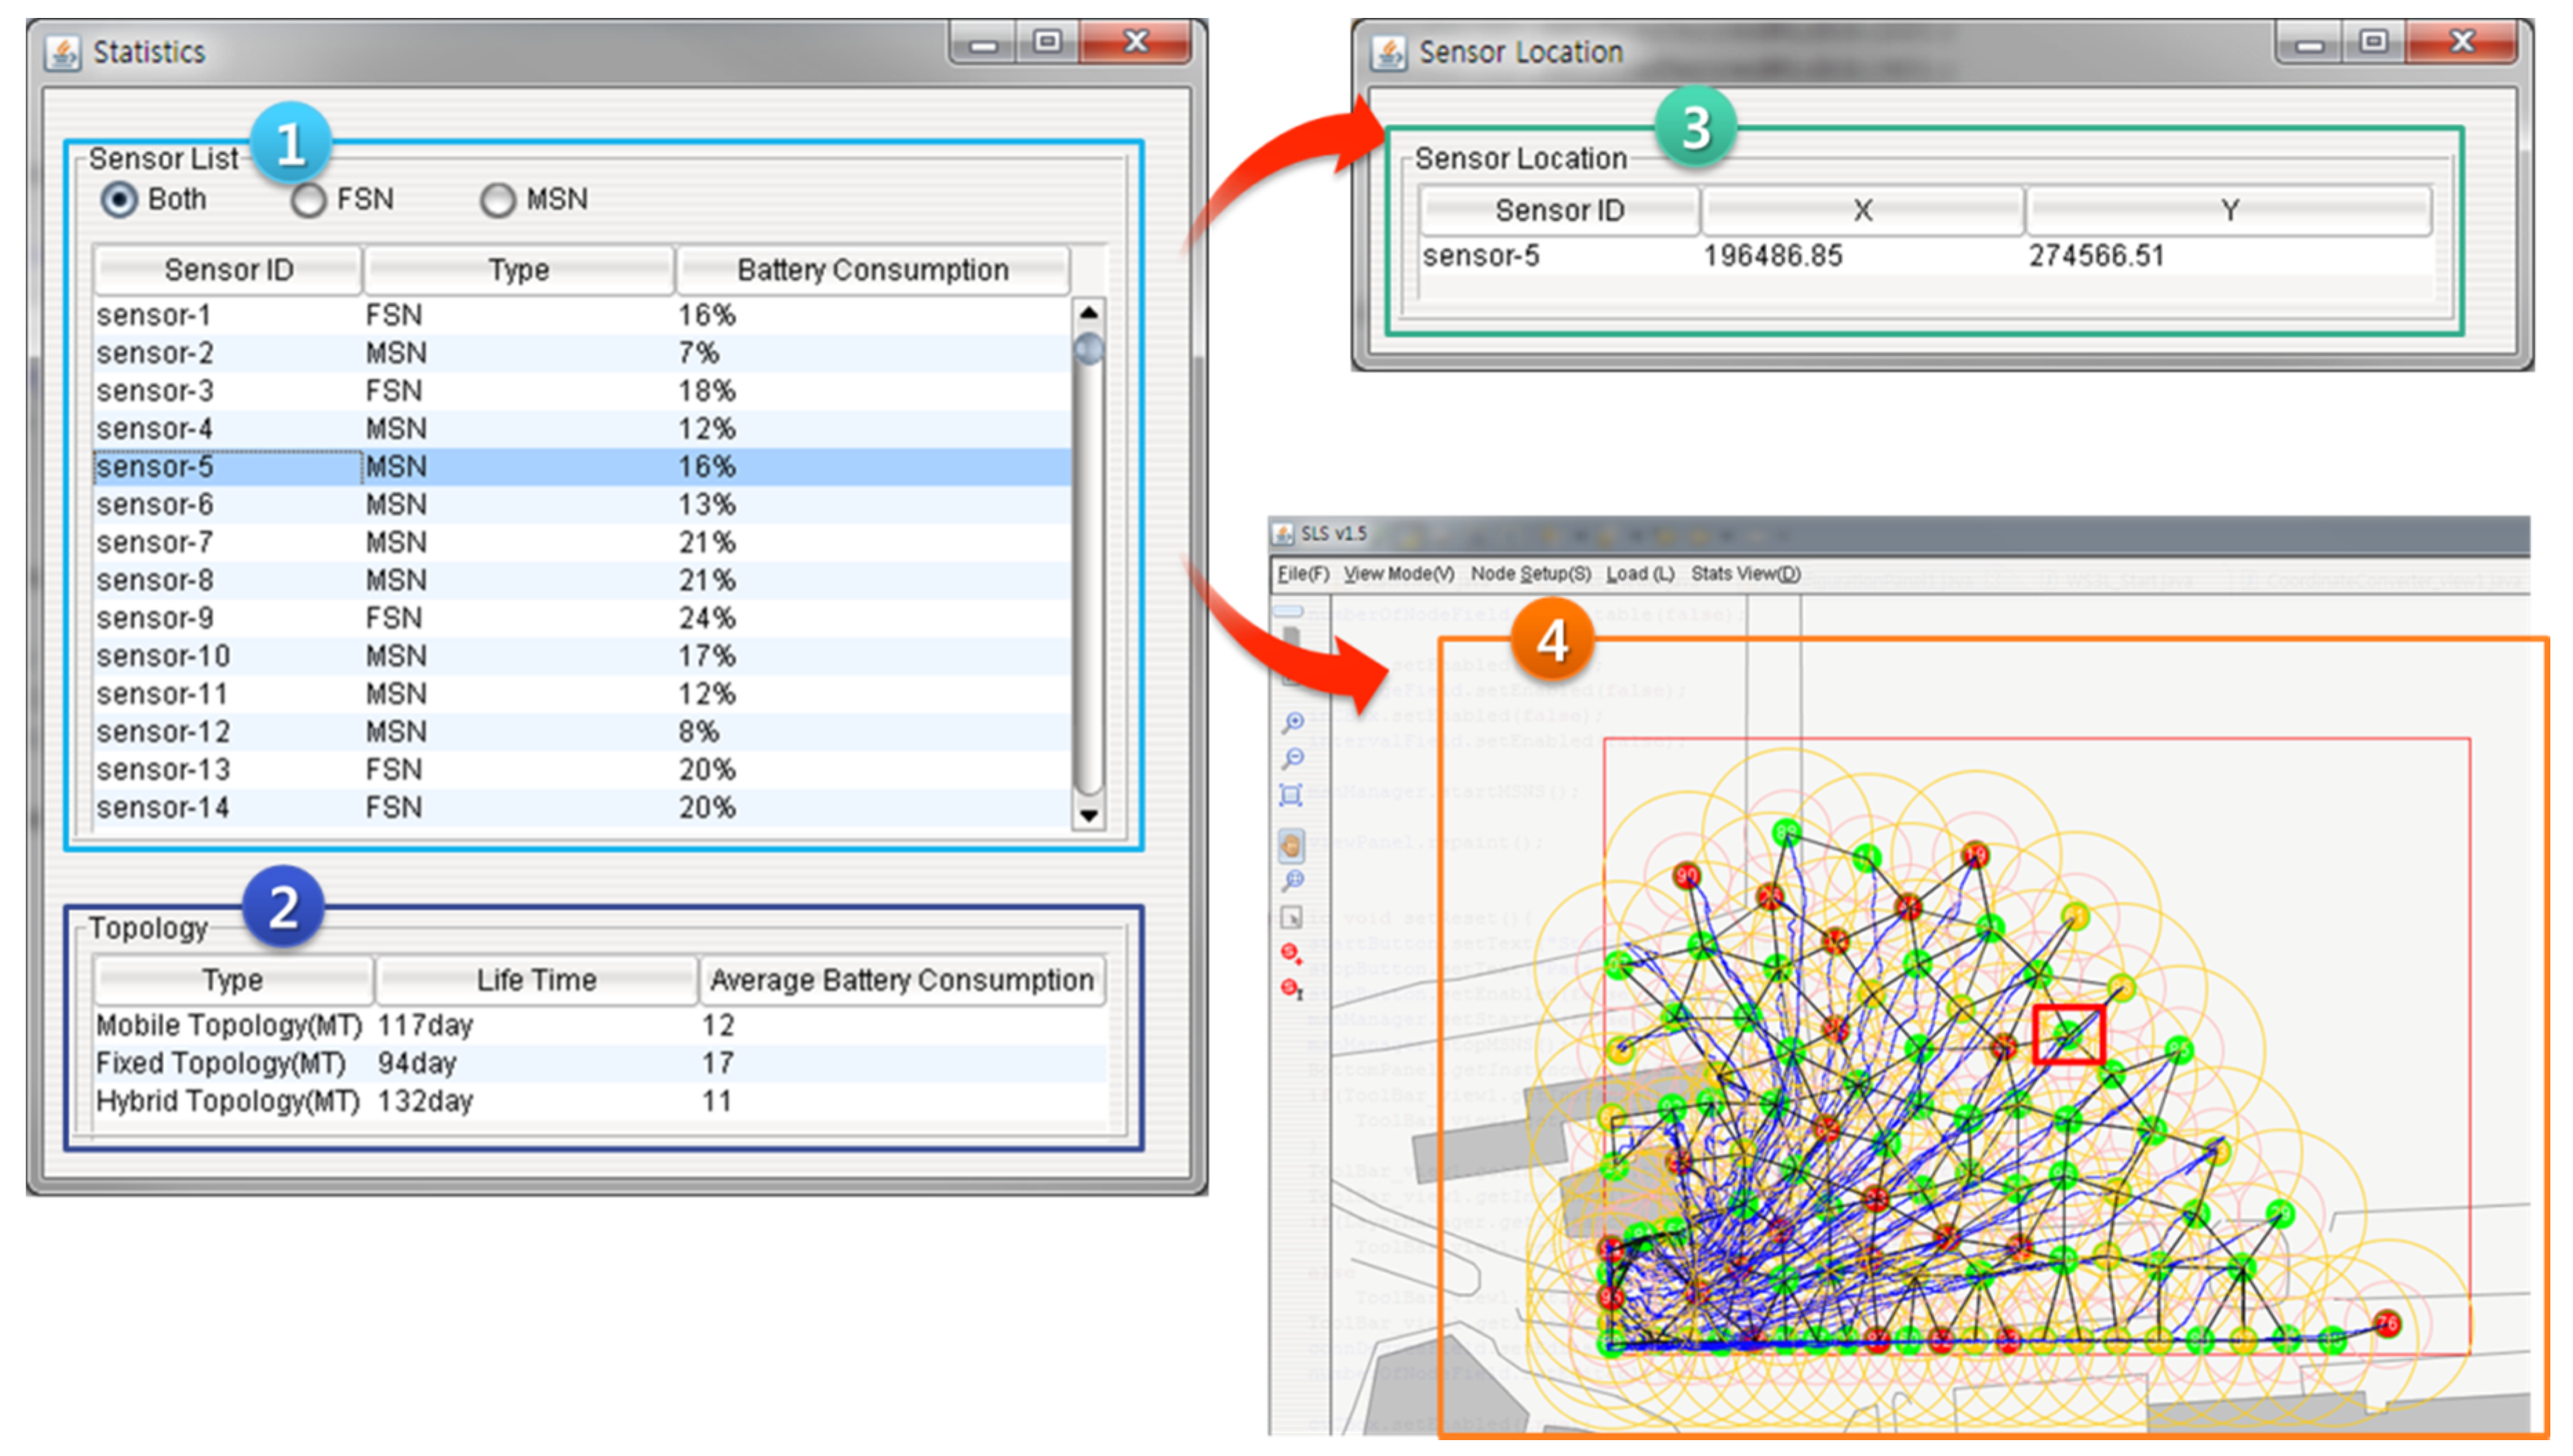
5. Implementation of SLS
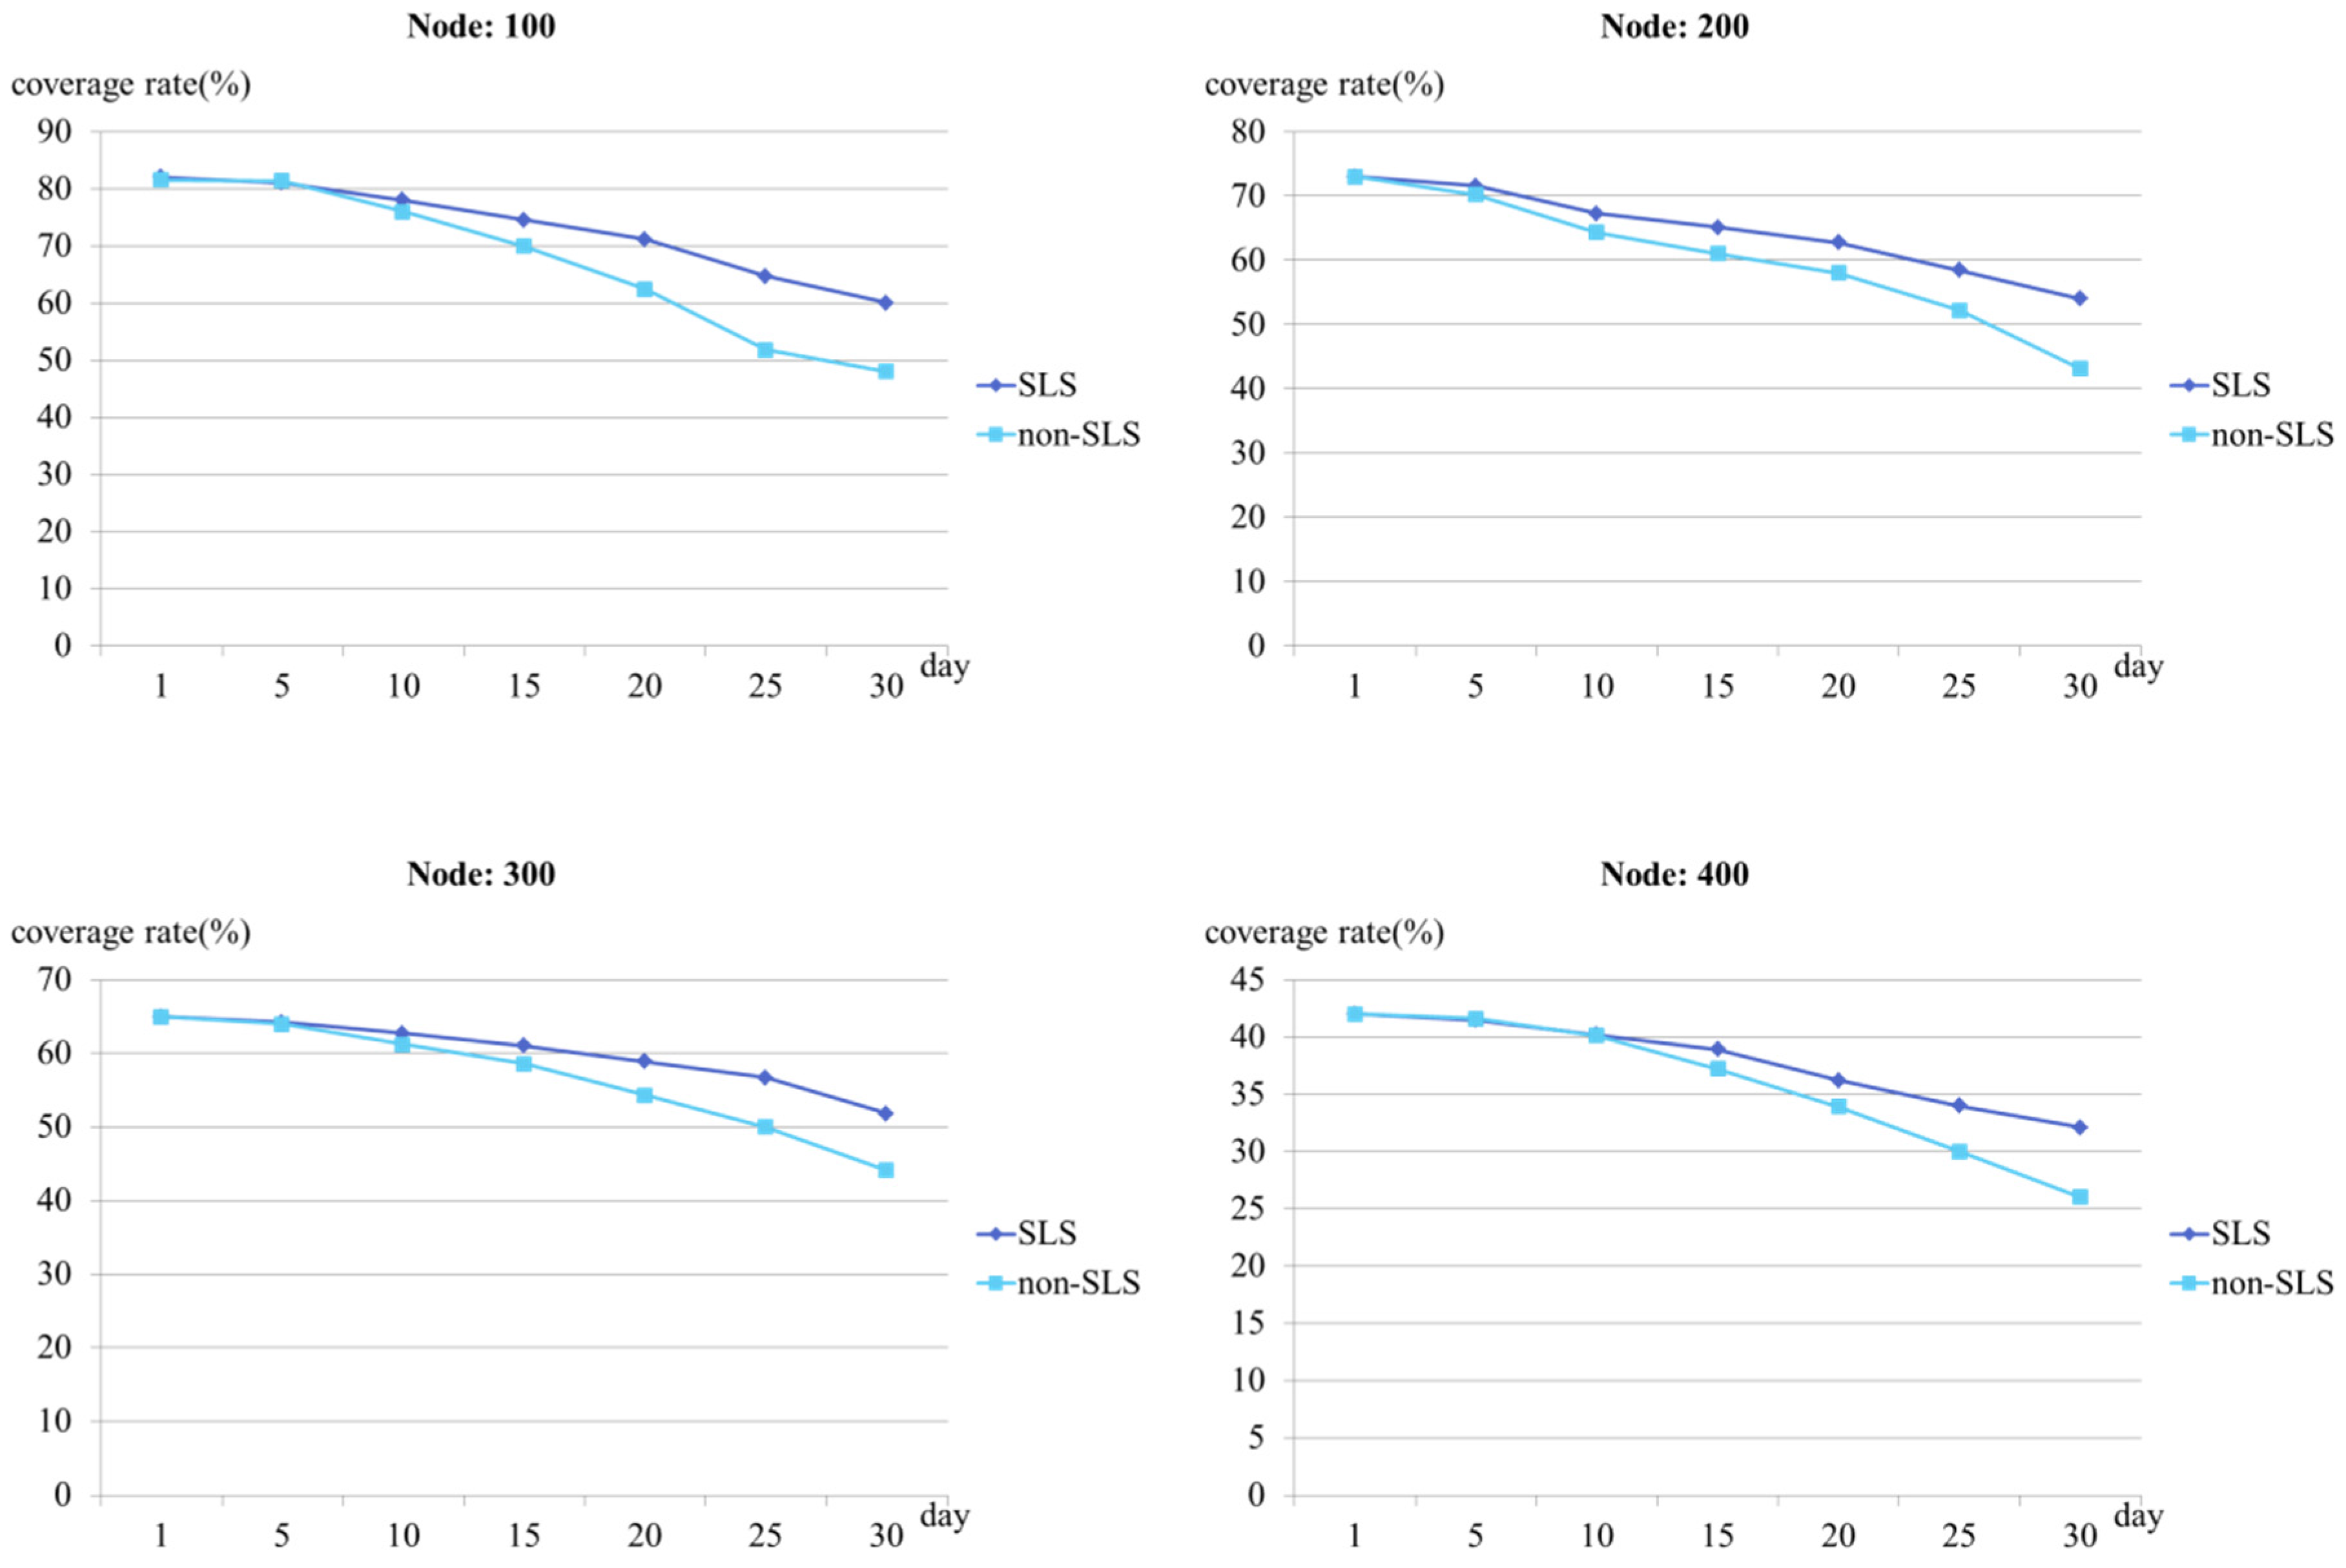
6. Performance Evaluation
7. Conclusions
Acknowledgments
Author Contributions
Conflicts of Interest
References
- Gupta, G.P.; Misra, M.; Garg, K. An Energy Efficient Distributed Approach-Based Agent Migration Scheme for Data Aggregation in Wireless Sensor Networks. J. Inf. Process. Syst. 2015, 11, 148–164. [Google Scholar]
- Jeong, Y.-S.; Kim, H.-W.; Jang, H.J. Adaptive resource management scheme for monitoring of CPS. J. Supercomput. 2013, 66, 57–69. [Google Scholar] [CrossRef]
- He, B.; Li, Y. Big Data Reduction and Optimization in Sensor Monitoring Network. J. Appl. Math. 2014, 2014. [Google Scholar] [CrossRef]
- Kim, H.-W.; Jeong, Y.-S. Integrated Validation System for the Simulation of Diverse Sensor in WSNs. Int. J. Distrib. Sens. Netw. 2013, 2013. [Google Scholar] [CrossRef]
- Pughat, A.; Sharma, V. A review on stochastic approach for dynamic power management in wireless sensor networks. Hum.-Centr. Comput. Inf. Sci. 2015, 5. [Google Scholar] [CrossRef]
- Jeong, Y.-S.; Kim, H.-W.; Park, J.H. Visual Scheme for the Detection of Mobile Attack on WSN Simulator. Int. J. Distrib. Sens. Netw. 2013, 2013. [Google Scholar] [CrossRef]
- Jeong, Y.-S.; Kim, H.-W.; Park, J.H. Visual Scheme Monitoring of Sensors for Fault Tolerance on Wireless Body Area Networks with Cloud Service Infrastructure. Int. J. Distrib. Sens. Netw. 2014, 2014. [Google Scholar] [CrossRef]
- Ahn, H.; Jung, B.K.; Park, J.R. Effect of reagents on optical properties of asbestos and remote spectral sensing. J. Converg. 2014, 5, 15–18. [Google Scholar]
- Jeong, Y.-S.; Song, E.-H.; Chae, G.-B.; Hong, M.; Park, D.-S. Large-Scale Middleware for Ubiquitous Sensor Networks. IEEE Intell. Syst. 2010, 25, 48–59. [Google Scholar] [CrossRef]
- Ren, Y.; Wang, B.; Zhang, S.; Zhang, H. A Distributed Energy-Efficient Topology Control Routing for Mobile Wireless Sensor Networks. In Proceedings of the 6th International IFIP-TC6 Networking Conference, Atlanta, GA, USA, 14–18 May 2007; pp. 132–142.
- Kim, H.-W.; Park, J.-H.; Song, E.-H.; Jeong, Y.-S. Parallel Processing Simulator for Separate Sensor of WSN Simulator with GPU. In Proceedings of the 29th International Conference on Advanced Information Networking and Application, IEEE, Gwangju, Korea, 24–27 March 2015; pp. 255–262.
- Blum, J.; Ding, M.; Thaeler, A.; Cheng, X. Connected Dominating Set in Sensor Networks and MANETs. In Handbook of Combinatorial Optimization; Springer: New York, NY, USA, 2005; pp. 329–369. [Google Scholar]
- Cho, H.-S.; Yoo, S.-J. Power, mobility and wireless channel condition aware connected dominating set construction algorithm in the wireless ad-hoc network. J. Korean Inst. Commun. Inf. Sci. 2005, 30, 274–286. [Google Scholar]
- Hong, Y.-S.; Lim, H.-S. A Load-balanced Topology Maintenance with Partial Topology Reconstruction. J. Korean Inst. Commun. Inf. Sci. 2010, 35, 1188–1197. [Google Scholar]
- Wu, J.; Dai, F.; Gao, M.; Stojmenovic, I. On Calculating Power-Aware Connected Domination Sets for Efficient Routing in Ad Hoc Wireless Networks. J. Commun. Netw. 2002, 4, 59–70. [Google Scholar] [CrossRef]


| Tools | Description |
|---|---|
| ATEMU [11] | ATEMU, which was the first command-based simulator based on C, does not provide a Graphical User Interface (GUI). Moreover, its performance rate is extremely slow due to the implementation of sequential sensor nodes despite text-based simulation. It guarantees cycle accuracy; however, only the parameters provided on the different systems can be determined. |
| AVRORA [11] | AVRORA is Java-based and it is capable of the simultaneous simulation of multiple sensor nodes. Each sensor node is implemented by a single thread. Prompt understanding is difficult as a GUI is not provided. |
| GloMoSim [11] | GloMoSim uses Parsec language for parallel simulation of the topology of large-scale sensor nodes. However, as the number of sensor nodes that are to be built in the actual environment provide simple deployment, routing prediction of big sensing data and load-balancing simulation are not possible. |
| NS2 [11] | NS2 is a discrete event simulator that has a module-type approach. Although NS2 has a number of sensor setting functions, the application program model is not sufficient when interaction between the application program and the network is required. Although NS2 has a Network Animator for GUI support, simultaneity is excluded as the event command is called from the file where it was previously stored. |
| NS3 [11] | NS3 provides better performance in the aspect of memory management compared to NS2. However, it is a new simulation tool rather than an extended version of NS2 and it does not support all NS2 models. Consequently, simulation is not possible with incompatible models. Moreover, an analysis function for load-balancing is not supported. |
| QualNet [11] | QualNet is the next version of GloMoSim. It is capable of simulating module scenarios and object models developed by different designers. Although it supports the function of a sensor network, analysis for load-balancing is still required as it only provides limited RF analysis. |
| SENSE [11] | SENSE is a simulator based on C++ with a complex FT, MT, and HT configuration. Although we can use G-Sense for substituting the autonomous visualization tool, it is not appropriate for real-time processing of MSN movement. Therefore, with this simulator, it is difficult for users to detect topology configuration problems for big sensing data. |
| SWANS [11] | SWANS is a Java-based simulator capable of user model definition. Moreover, it can present network communication flow on topology on an interface. However, condition setting for load-balancing in FTs, MTs, and HTs is not possible and it also has the limitation of showing only event-based communication flow. |
| TOSSIM [11] | TOSSIM is a simulator developed at Berkeley University in the United States that simulates TinyOS. Although it is capable of actual movement inference and hardware analysis, simulation of OS and the functions of other sensor nodes is not possible due to TinyOS dependency. TOSSIM has a Java-based TinyViz for a GUI, but it is not sufficient for the movement of dynamic sensor nodes. |
© 2016 by the authors; licensee MDPI, Basel, Switzerland. This article is an open access article distributed under the terms and conditions of the Creative Commons Attribution (CC-BY) license (http://creativecommons.org/licenses/by/4.0/).
Share and Cite
Kim, H.-W.; Park, J.H.; Jeong, Y.-S. Sustainable Load-Balancing Scheme for Inter-Sensor Convergence Processing of Routing Cooperation Topology. Sustainability 2016, 8, 436. https://0-doi-org.brum.beds.ac.uk/10.3390/su8050436
Kim H-W, Park JH, Jeong Y-S. Sustainable Load-Balancing Scheme for Inter-Sensor Convergence Processing of Routing Cooperation Topology. Sustainability. 2016; 8(5):436. https://0-doi-org.brum.beds.ac.uk/10.3390/su8050436
Chicago/Turabian StyleKim, Hyun-Woo, Jong Hyuk Park, and Young-Sik Jeong. 2016. "Sustainable Load-Balancing Scheme for Inter-Sensor Convergence Processing of Routing Cooperation Topology" Sustainability 8, no. 5: 436. https://0-doi-org.brum.beds.ac.uk/10.3390/su8050436