Article

Assimilation and Translocation of Dry Matter and Phosphorus in Rice Genotypes Affected by Salt-Alkaline Stress

1
Northeast Institute of Geography and Agroecology, Chinese Academy of Sciences, Changchun 130102, Jilin, China
2
University of Chinese Academy of Sciences, Beijing 100049, China
3
Da’ an-Sodic Land Experiment Station, Chinese Academy of Sciences, Da’ an 131300, Jilin, China
*
Authors to whom correspondence should be addressed.
Sustainability 2016, 8(6), 568; https://0-doi-org.brum.beds.ac.uk/10.3390/su8060568
Submission received: 28 April 2016 / Revised: 30 May 2016 / Accepted: 13 June 2016 / Published: 17 June 2016

Abstract

:
Salt-alkaline stress generally leads to soil compaction and fertility decline. It also restricts rice growth and phosphorus acquisition. In this pot experiment, two relatively salt-alkaline tolerant (Dongdao-4 and Changbai-9) and sensitive (Changbai-25 and Tongyu-315) rice genotypes were planted in sandy (control) and salt-alkaline soil to evaluate the characteristics of dry matter and phosphorus assimilation and translocation in rice. The results showed that dry matter and phosphorus assimilation in rice greatly decreased under salt-alkaline stress as the plants grew. The translocation and contribution of dry matter and phosphorus to the grains also increased markedly; different performances were observed between genotypes under salt-alkaline stress. D4 and C9 showed higher dry matter translocation, translocation efficiency and contribution of dry matter assimilation to panicles than those of C25 and T315. These changes in D4 and C9 indexes occurred at low levels of salt-alkaline treatment. Higher phosphorus acquisition efficiency of D4 and C9 were also found under salt-alkaline conditions. Additionally, the phosphorus translocation significantly decreased in C25 and T315 in the stress treatment. In conclusion, the results indicated that salt-alkaline-tolerant rice genotypes may have stronger abilities to assimilate and transfer biomass and phosphorus than sensitive genotypes, especially in salt-alkaline conditions.

1. Introduction

The global land area that is threatened by salinization and alkalization has exceeded 900 × 106 ha, which is 20% of the global cultivated land area [1]. Salinity is more serious in arid and semi-arid environments. There are approximately 233 × 104 ha with concentrated saline-alkaline soil in the Songnen plain of China [2]. Salt-alkaline soil could cause poor yields or very few surviving crops through serious ionic toxicity and osmotic stress. Rice is susceptible to salt-alkaline stress, but it has long been used in salt-alkaline soil remediation and improvement by irrigating and then flushing salt ions away [3]. Rice has been cultivated in the salt-alkaline soil in the Songnen plain of China for more than 50 years [4].
There are three principal strategies for plants to cope with stress conditions and enhance stress tolerance: selective ionic absorption and transportation, osmotic adjustment and increased antioxidase activity [5]. The exclusion and compartmentation of Na+ can maintain the ironic balance in membranes and tissues. Shabbir et al. [6] proposed that rice genotypes can dilute the salt irons by increasing tiller numbers. Accumulation of osmolytes such as proline, sugars, and compatible solutes are also important to balance the osmotic pressure [7]. The polarity and high solubility of these metabolites is helpful in rapidly reacting to stress conditions [8]. Furthermore, plants can enhance the activities of antioxidase including superoxide dismutase (SOD), ferredoxin (FD) and ascorbate peroxidase (APX) to ease the damage of reactive oxygen species [9]. All of these strategies are focused on the structural stability and metabolic balance of plants. However, the salinity also inhibits plant growth via nutritional deficiencies, which still remains largely unknown.
Rice genotypes are affected by not only ion toxicity and osmotic stress but also the high pH in a salt-alkaline environment [10]. The high pH conditions generally result in a decrease in plant biomass, an imbalance in ion absorption and reduced phosphorus absorption. Research has shown that Olsen-P is easily immobilized by Ca2+ or it competes with other salt ions, such as Na+, Cl and CO32− in salt-alkaline soil [11,12]. As the salt-alkaline stress increases in severity, the amount of Na+ content in the plant increases and the amount of phosphorus that the plant can acquire decreases [13]. As a result, a physiological phosphorus deficiency of crops always occurs after salt-alkalization. Papakosta [14] also found that crop development and nutrient acquisition and translocation were generally dependent on genotype, soil and environmental conditions. Phosphorus acquisition is easily decreased by salinity, but it changes less with low phosphorus fertilization [15]. This result indicates that salinity has a greater impact on phosphorus absorption in a crop than phosphorus deficiency.
The dry matter and phosphorus assimilation, distribution and translocation also dynamically change in different crop parts, and during different development stages and stress conditions. Karlen and Whitney [16] demonstrated that the phosphorus concentration alone decreased in the growth of winter wheat in whole plants. Strategies for improving the phosphorus efficiency of crops under stress environments were also observed. For example, phosphorus redistribution in cells, tissues and organs decreases the phosphorus expenditure of metabolism [17]. Winter wheat transferred more dry matter to reproductive parts during a mild drought stress, contributing to increased yields [18]. The phosphorus efficient genotypes can generally obtain a higher biomass but lower phosphorus content than the inefficient genotypes, especially in the harvested portion [19]. A higher crop biomass at heading may contribute to higher remobilization [20,21]. Yang et al. [22] found that the phosphorus acquisition efficiency of different phosphorus-sensitive rice genotypes was greatly affected by sodic stress. However, it changed less with the phosphate supplement under sodic treatment. In low-phosphorus conditions, phosphorus acquisition was more important than phosphorus utilization for grains [23]. Thus, the parameters should be defined in evaluating dry matter and phosphorus assimilation and translocation, which may contribute to future rice breeding in salt-alkaline soil.
Rice genotypes generally have different tolerance levels and phosphorus nutrient reactions to salt-alkaline stress with the mechanism obscured. In this study, two relatively salt-alkaline-tolerant genotypes and two relatively salt-alkaline-sensitive rice genotypes were planted into sandy and salt-alkaline soils. We investigated the effects of salt-alkaline stress on dry matter and phosphorus assimilation and translocation at three growth stages for these four rice genotypes. Different changes among the salt-alkaline tolerant and sensitive genotypes are also discussed.

2. Materials and Methods

2.1. Experimental Site

The pot experiment was conducted in 2014 at Da’ an-Sodic Land Experiment Station, Chinese Academy of Sciences, Da’ an, Jilin (45°35’ N; 123°50′ E) in Northeast China. The climate at this station is semi-arid and semi-humid with an average of 413.7 mm of precipitation. The rainy season occurs during July and August. There are 137 frost-free days and 2935 °C of effective accumulated temperature beyond 10 °C. All pots were placed in a glasshouse (day temperature 24–30 °C, night temperature 17–23 °C).

2.2. Experimental Treatment

Four early maturing japonica rice genotypes with similar flowering dates (65 ± 2 days after transplanting) were planted during the growing season (May to September). Among them, Dongdao-4 (D4) and Changbai-9 (C9) are relatively salt-alkaline-tolerant genotypes, whereas Changbai-25 (C25) and Tongyu-315 (T315) are relatively salt-alkaline-sensitive genotypes. Two types of wild soils (Table 1), sandy soil (SS) and salt-alkaline soil (SAS), were chosen and collected at 0–20 cm depth. They were then air-dried and passed through a 5 mm sieve.

2.3. Planting, Sampling and Plant Analysis

Fully developed and average-sized seeds were sown on April 14th. Forty days later, uniform seedlings were transplanted into plastic pots (24 cm diameter × 19 cm depth) filled with 8 kg of two types of soils. One plant was planted in each pot with three replications; the plantings were completely randomized. The fertilizer condition was 72 kg·ha−1 N as urea, 100 kg·ha−1 P2O5 as triple super phosphate and 56 kg·ha−1 K2O as K2SO4 fertilizer applied four days before transplanting, and 54 kg·ha−1 N as urea applied seventeen days after transplanting, then 54 kg·ha−1 N as urea and 24 kg·ha−1 K2O as K2SO4 applied fifty-two days after transplanting.
Sampling was conducted at the tilling stage (TS), the heading stage (HS) and the mature stage (MS) of rice. The overground parts were cut and washed in distilled water three times. Every plant was divided into stems, leaves and grains; plants were dried at 105 °C for 2 h and then kept at 80 °C until constant weight was reached before dry mass measurement and storage.
Every sample was shredded and digested completely by a mixture of H2SO4 and 30% H2O2 for the measurement of phosphorus (P). P was measured using an ultraviolet and visible spectrophotometer (T6-1650E, Beijing Purkinje General Instrument CO., LTD, Beijing, China).

2.4. Calculation of Dry Matter and Phosphorus Indicators

Dry matter and P movement of the four rice genotypes were calculated as follows [24,25,26]:
Dry matter translocation (DMT, g·pot−1) = dry matter at heading − (stem + leaf) dry matter at maturity.
Dry matter translocation efficiency (DMTE, %) = (DMT/dry matter at heading) × 100.
Contribution of dry matter assimilation to grains (CDMAG, %) = (DMT/grain dry matter) × 100.
Harvest index (HI) = grain dry matter/total aboveground biomass at maturity.
Phosphorus acquisition efficiency (PAE, mg) = P accumulation in shoot part.
Phosphorus utilization efficiency (PUE, g·mg−1) = aboveground biomass/PAE.
Phosphorus translocation (PT, mg·pot−1) = P content at heading − (stem and leaf) P content at maturity.
Phosphorus translocation efficiency (PTE, %) = (PT/P content at heading) × 100.
Contribution of phosphorus assimilation to grains (CPAG, %) = (PT/grain P content at maturity) × 100.
Phosphorus harvest index (PHI) = grain P at maturity/total P content of above ground biomass at maturity.

2.5. Statistical Analysis

Dry weight, P concentration and evaluated index treatments were subjected to a one-way analysis of variance (ANOVA) using SPSS 20.0. The ANOVA results were subjected to a DUNCAN test for the significance comparison (p < 0.05, p < 0.01). Tables were generated using Office 2007, and figures were generated using Origin 9.0.

3. Results

3.1. Dry Matter Accumulation

Differences between the dry matter of the stem, leaf, and grain at the three growth stages are shown in Table 2.
The dry matter of the stem, leaf, and grain at the three growth stages was significantly lower in the salt-alkaline soil than in the sandy soil. In the TS stage, the relative dry matter reductions (rDMR) of the stem and leaf in D4 (67.73%, 69.98%) and T315 (69.89%, 68.83%) were higher than the other two cultivars and were higher than in the other stages. These results show that the seedlings of D4 and T315 were more seriously affected than C9 and C25 in the TS stage. From the tilling to the heading stage, the rice genotypes focused on vegetative growth, with increases in the stem and leaf biomasses observed. Because reproductive stages occurred from heading to maturity, panicle development became the most important for rice. At the same time, the biomass of vegetative organs stopped increasing and even decreased, which was more significant in the salt-alkaline treatment (Table 2, stem and leaf dry matter at HS and MS). This result indicates that the crop genotypes transferred more nutrients and dry matter from the vegetative organs to the panicle. The rDWR of the grain for all genotypes in the mature stage were much higher than that of the stem and leaf and in the heading and mature stages. These results showed that the crop yields were highly affected by salt-alkaline stress. Despite all of these results, the rDWR of C9 and D4 were lower than those of C25 and T315. Moreover, the dry matter reduction of the grain was more obvious than that in the stem and leaf, especially at maturity; it changed from 16.40% (D4) to 51.87% (C25) in the stem, 10.32% (C9) to 42.85% (C25) in the leaf and 25.67% (D4) to 52.94% (C25) in the panicle. With the development of rice, the biomass decreased in the order TS > MS > HS under salt-alkaline stress. These results may illustrate that genotypes were more tolerant to salt-alkaline stress in the heading and mature stages than in tilling stage.

3.2. Phosphorus Concentration

The phosphorus concentrations in different plant parts and during different stages of growth are shown in Table 3.
The phosphorus concentrations in different plant parts and during different stages of growth are shown in Table 3. For all genotypes and treatments, the highest phosphorus concentrations occurred in the tilling stage, and P in the stem was much higher than P in the leaf, which may be good for P transportation. Then, the phosphorus concentration in the stem and leaf continued to decrease with the development of the rice, whereas P in the grain significantly increased from heading to maturity. The changes showed that the phosphorus translocated from the stem and leaf to the grain. The phosphorus concentration slightly decreased under salt-alkaline stress at the tilling stage only, at which the rPC ranged from 0.82 (C25) to 1 (T315). The phosphorus concentration was not significantly different among genotypes. In addition, the phosphorus concentrations of D4 and C9 were higher than that of C25 and T315 except heading stages in both crop parts and soil treatments. This result may show different performances between rice genotypes.

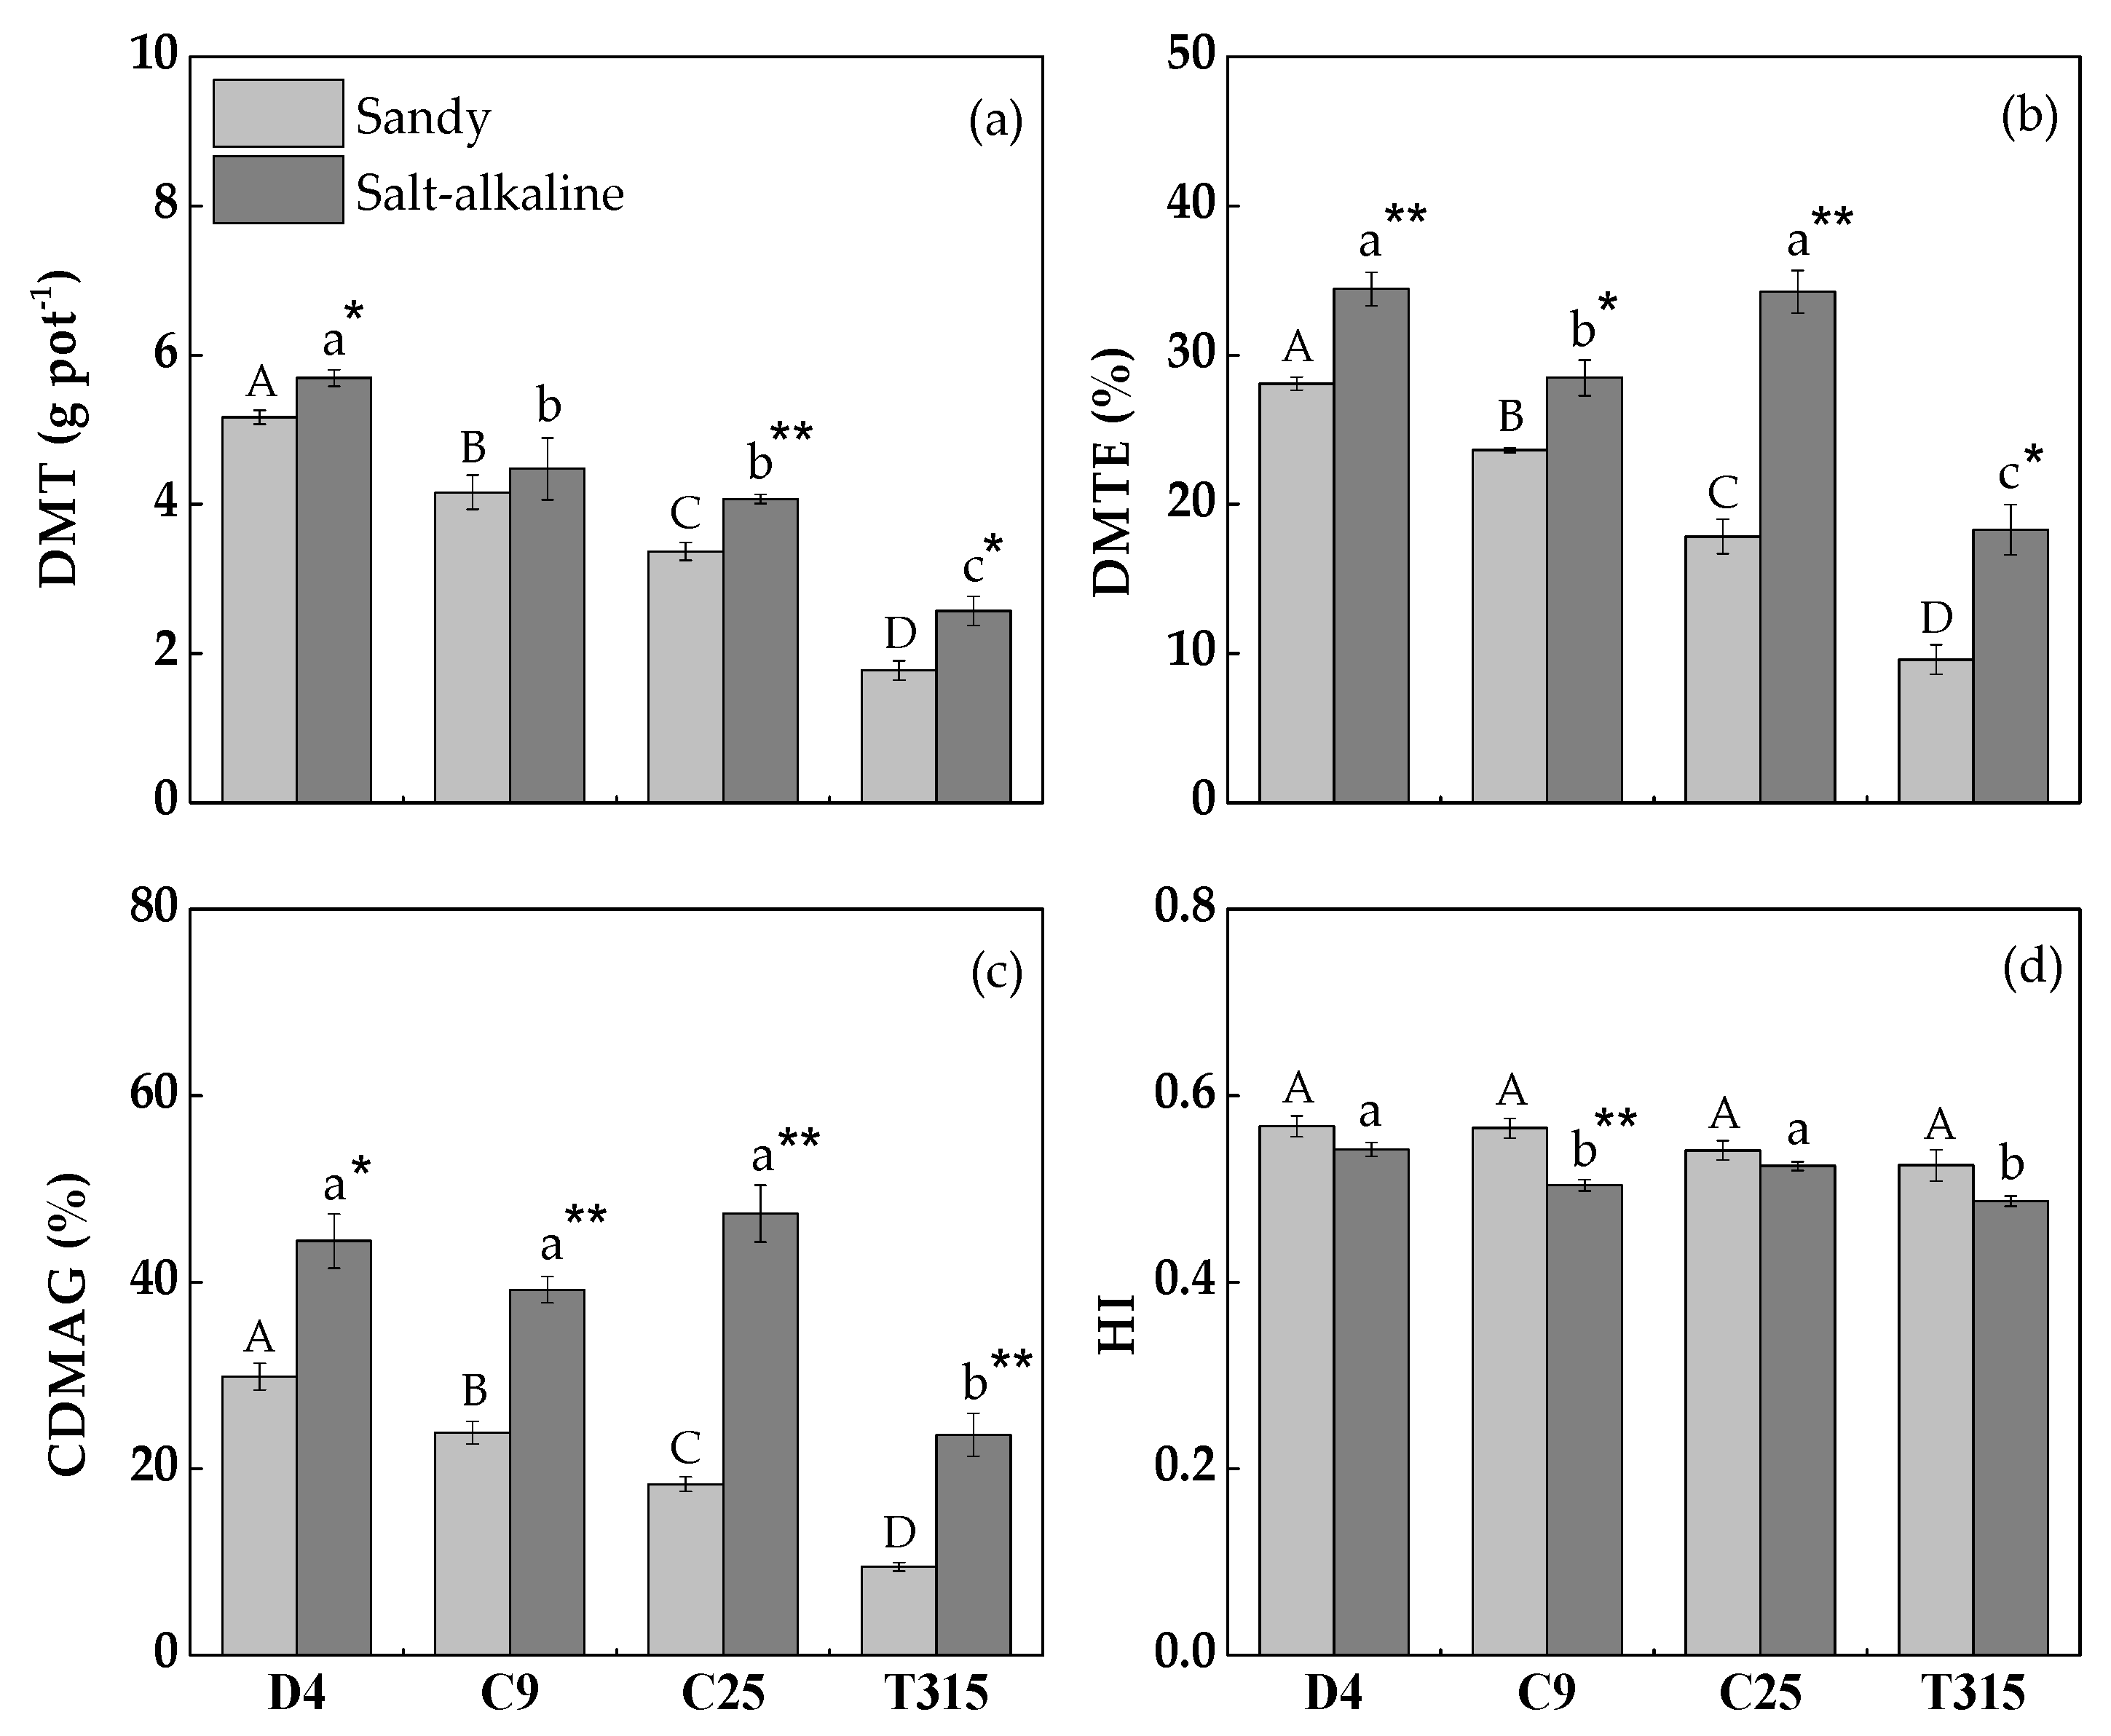
3.3. Dry Matter Translocation

As the turning point for vegetative growth and reproductive development, a large amount of dry matter and phosphorus in the grain depends on the accumulation before the heading stage. Thus, we used the dry matter and phosphorus concentration at the heading and mature stages to evaluate the crop dry matter and phosphorus utilization and translocation. Four indexes of dry matter translocation are shown in Figure 1.
The dry matter translocation (DMT), dry matter translocation efficiency (DMTE) and contribution of dry matter assimilation to grains (CDMAG) in the salt-alkaline treatment were all significantly higher than that in the sandy treatment. In addition, the three indexes showed significant differences between genotypes. D4 had the highest DMT (5.17 mg in sandy and 5.69 mg in salt-alkaline), whereas T315 had the lowest DMT (1.77 mg in sandy and 2.57 mg in salt-alkaline) (Figure 1a). The relative increase of DMT changed from 7.61% (C9) to 44.93% (T315). The relative increase of DMTE was higher than that of DMT (Figure 1b). The largest relative reduction occurred for C25 at 92.07% and the smallest occurred for C9 at 20.50%. A significant difference among treatments and genotypes was also observed in the CDMAG (Figure 1c). The relative increase of C25 (158.25%) and T315 (148.72%) was considerably larger than that of C9 (64.16%) and D4 (48.63). As a common point, D4 and C9 had much higher DMT, DMTE and CDMAG in sandy treatment and less relative increases than C25 and T315 in salt-alkaline treatment. The less DMT means that C25 and T315 transferred less dry matter from the stem and leaf to panicle. The largely increased DMTE and CDMAG of C25 and T315 means that their dry matter translocations were highly affected by the salt-alkaline stress. By contrast, the harvest index (HI) decreased under the salt-alkaline stress but showed similar behavior (approximately 0.55) between the genotypes and treatments (Figure 1d). The relative reduction ranged from 3.12% (C25) to 10.83% (C9). This result may mean that the HI was relatively stable and was less affected by the genotypes and salt-alkaline stress.

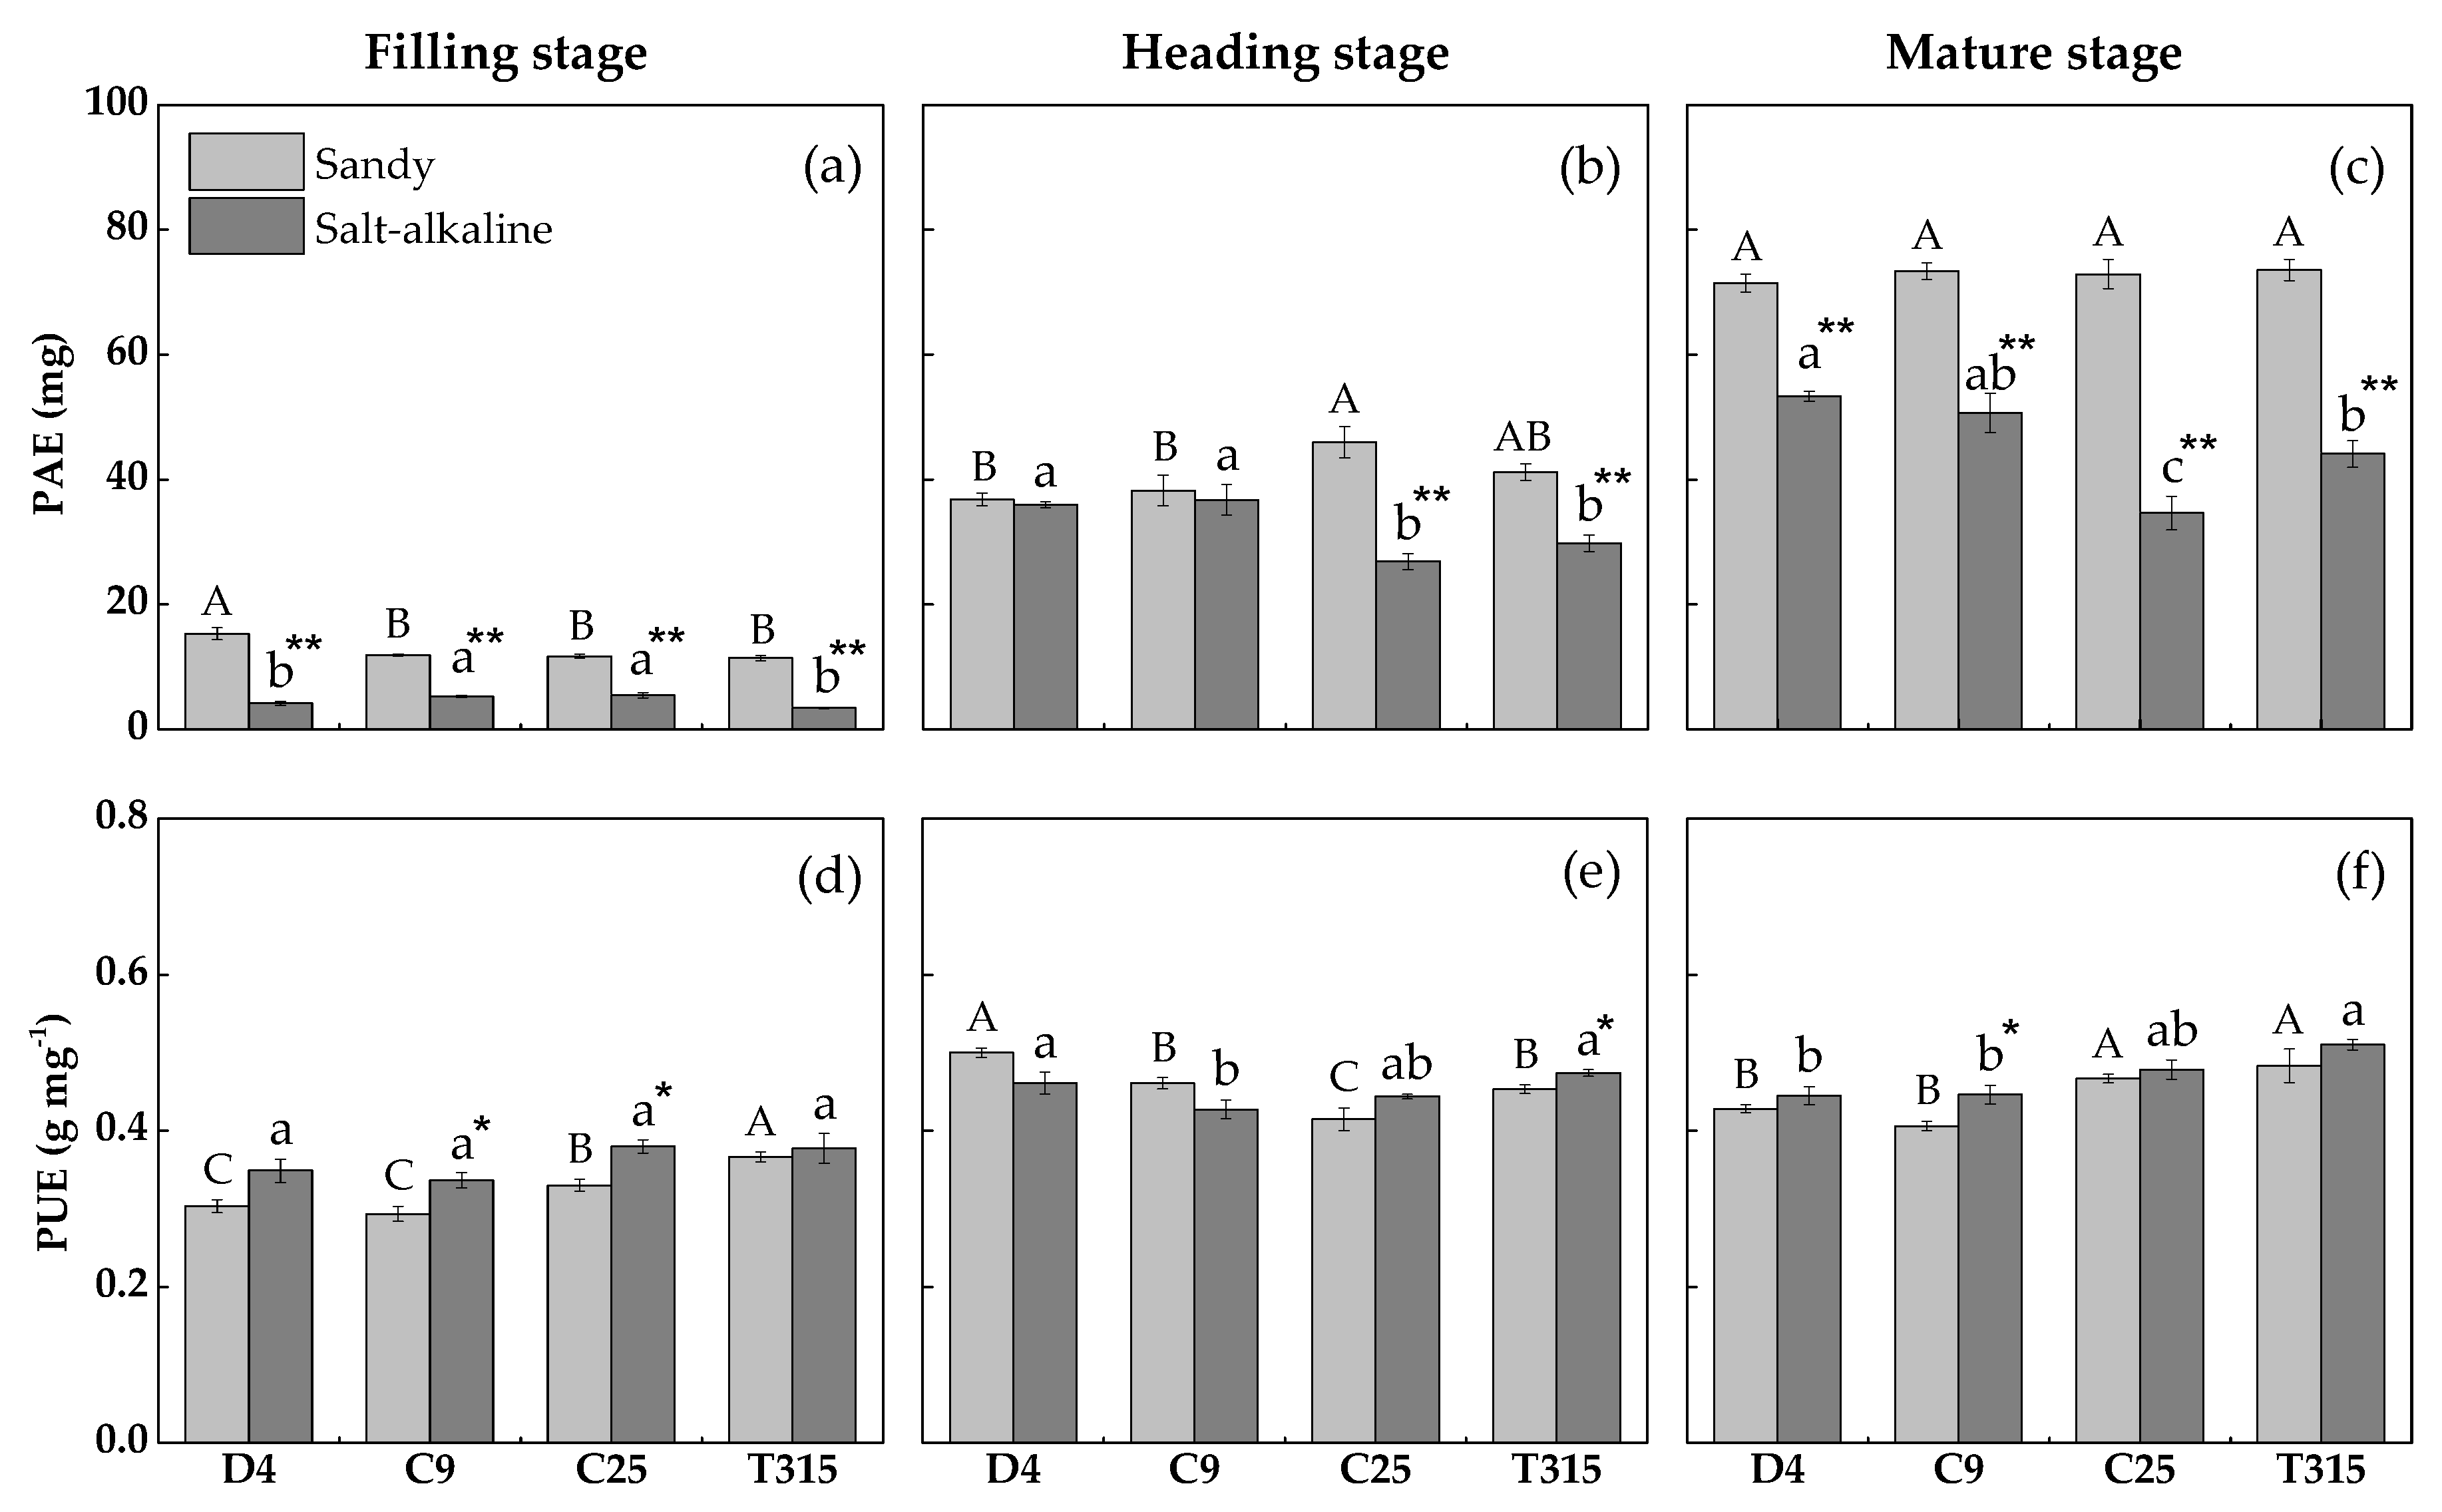
3.4. Phosphorus Acquisition and Utilization Efficiency

To analyze the ability of rice to absorb and utilize phosphorus, the phosphorus acquisition efficiency (PAE) and phosphorus utilization efficiency (PUE) were calculated and are shown in Figure 2.
The PAE of all genotypes continued to increase with rice development in both treatments (Figure 2a–c). This trend was similar for genotypes in the sandy treatment at the same stage. However, the reduction of PAE under salt-alkaline stress differed markedly among genotypes and developing stages. The PAE of D4 was the highest of all genotypes under sandy soil, but it showed the largest reduction (72.77%) under salt-alkaline stress at the tilling stage (Figure 2a), and the relative reduction of C25 (53.67%) was the least. From the heading stage, the PAEs of D4 and C9 were higher than C25 and T315 in the salt-alkaline treatment. The relative PAE reduction of D4 (2.37% at heading, 27.59% at maturity) and C9 (3.91% at heading, 25.35% at maturity) was significantly lower than C25 (41.48% at heading, 52.48% at maturity) and T315 (27.59% at heading, 40.05 at maturity) although the reductions of PAE at the mature stage were larger than in the heading stage, indicating that the mature stage of rice was more sensitive to salt-alkaline stress than the heading stage.
The PUE was approximately 0.35 at the tilling stage and increased to approximately 0.42 in the reproductive stages. A slight increase in salt-alkaline soil for the PUE was maintained for all genotypes except for that of D4 and C9 at the heading stage (Figure 2e). Significant increases in PUEs were observed in C9 (14.66%) and C25 (15.10%) at the tilling stage, T315 (4.00%) at the heading stage and C9 (9.85%) at the mature stage. Thus, the PUE was not seriously affected by the salt-alkaline stress because the proportion of changes in the phosphorus concentration was similar.

3.5. Phosphorus Translocation

Four phosphorus translocation indexes are shown in Figure 3.
The changes in phosphorus translocation (PT) and phosphorus assimilation to grains (CPAG) were significantly affected by salt-alkaline stress (Figure 3a,c). D4 (2.57%) and C9 (6.32%) showed minimal increase in the PT under salt-alkaline stress, whereas PT significantly decreased in C25 (39.97%) and T315 (29.79%). As a result, the phosphorus transfer abilities of C25 and T315 were affected by the salt-alkaline stress in spite of their higher PT in the sandy soil. The CPAG of genotypes significantly increased with salt-alkaline stress. With a lower CPAG of D4 and C9 in both the sandy soil and the salt-alkaline soil, the increasing CPAG was much larger than in C25 and T315. The relative increase of CPAG was 42.05% for D4, 68.42% for C9, 31.65% for C25 and 23.35% for T315. These results showed that the phosphorus transferring abilities of D4 and C9 were much stronger than that for C25 and T315, and more phosphorus might be transferred to the grains under salt-alkaline stress. However, the phosphorus translocation efficiency (PTE) of D4 and C9 increased slightly but did not show any significant difference between genotypes and soil types (Figure 3b). Similar to PTE, the phosphorus harvest index (PHI) did not exhibit much difference between genotypes, even though it was slightly higher in the sandy treatment (Figure 3d).

4. Discussion

The source–sink relationship plays a critical role in crop growth and yield [27]. As the most important nutrients, nitrogen and phosphorus are essential to the balance of the source–sink relationship by affecting the dry matter and nutrient assimilation and translocation [21]. However, salt-alkaline stress can suppress the ionic absorption through ionic and osmotic stress, oxidative effects and high pH conditions, which leads to physiological nutritional deficiency and poor phosphorus assimilation and translocation. Shoot growth of crops is quite affected by phosphorus acquisition, but it is mainly restricted by salt-alkaline stress [5,28]. When different tolerant genotypes suffered from salt stress initially, they reacted similarly, by lowering the water potential. When the stress conditions become more severe and continuous, however, salt-tolerant genotypes accumulate Na+ and Cl more slowly than sensitive genotypes [29]. They can also redistribute toxic ions from cytoplasm to vacuole and from leaf to root, which keep salt-tolerant genotypes from metabolic disturbance, growth inhibition and even plant death [30].
In this experiment, salt-alkaline stress significantly affected the four genotypes’ biomass, DMT, DMTE, CDMAG, PAE, PT, and CPAG. There were also significant differences between salt-alkaline-tolerant rice genotypes (D4 and C9) and -sensitive rice genotypes (C25 and T315) under salt-alkaline stress.

4.1. Dry Matter Accumulation and Translocation

Plant growth and dry matter assimilation can be seriously affected by salt-alkaline stress, primarily because of the acquisition of excessive sodium, decrease of potassium and increase of Na+/K+, which generally constitute ion toxicity to plants under salt or sodic stress [31,32]. The excessively accumulated Na+ and Cl inhibited the absorption of K+, Ca2+ and other nutrients [33,34]. In this study, dry matter from the four genotypes was significantly restricted by the salt-alkaline stress at three stages along with the development (Table 2). The tilling stage suffered the worst effect, with dry matter reduction of the stem and leaf of approximately 50% or even more in the salt-alkaline treatment. The spikelet differentiation was severely inhibited by the salt-alkaline stress, which led to the reduction of spikelet number and weight [35,36]. Thus, the serious effect occurred in the mature stage, and the dry matter reduction in the heading stage was the least for all genotypes. The dry matter reductions in D4 and C9 were significantly lower than C25 and T315 in the two later stages, especially in the grain in the mature stage. Shabbir et al. [6] found that salt stress significantly increased the pollen sterility of rice, especially to salt-sensitive genotypes. It may due to the disturbances and restriction of photosynthesis and sugars under salt stress condition [37]. These results shows that the tolerance for salt-alkaline is different for growth stages and genotypes [38]. Additionally, tilling and grain filling were more sensitive to stress conditions than the anthesis stage.
An ionic imbalance in cells, tissues and organs makes it difficult to absorb and transport water, leading to weakened photosynthesis and transpiration pull. Thus, the production and translocation of carbohydrates are easily affected by salt-alkaline stress [33,39]. In general, vegetative organs play an important role in transporting water and nutrients to the grain and even restore the excessive toxic ions, especially in the stem [40]. From the heading stage, the dry matter of the stem and leaf decreased with the grain filling, which meant that the stem and leaf remobilized carbohydrates to the panicle. In the sandy condition, the DMT, DMTE and CDMAG of rice genotypes were significantly lower than in the salt-alkaline condition (Figure 1). These phenomena may be a result of the changing strategies of the rice plant to stress. Fabre et al. [41] found that grain dry matter mainly comes from the carbohydrates produced by photosynthesis at grain filling stages than from the stem and leaf in appropriate conditions. However, the suppression of photosynthesis and reduction of carbohydrates promote greater dry matter translocation of the stem and leaf under stress conditions [42]. Van et al. [43] also obtained similar results indicating that the contribution of carbohydrate assimilation of grains reached 75%–100% for wheat under dry conditions. As in previous research, the dry matter in the stem and leaf had a higher translocation and contribution to the grain in salt-alkaline soil. The increasing DMT, DMTE and CDMAG of D4 and C9 were markedly lower than those of C25 and T315. This was because C25 and T315 had weaker photosynthesis and nutrient acquisition ability to support their panicle development under salt-alkaline stress. Arduini et al. [21] found that the higher dry matter assimilation in pre-anthesis stages may link to higher translocation. However, there was no positive relationship between dry matter and its translocation in our results. Conversely, C25 and T315 showed higher dry matter and lower translocation in sandy treatment. The HI did not show an obvious difference (below 60%) among genotypes but showed a slight decrease in the salt-alkaline treatment because the decrease of the stem and leaf was lower than that of the grain at maturity. In conclusion, the salt-alkaline-tolerant genotypes D4 and C9 have a greater capacity for growth and remobilizing carbohydrates.

4.2. Phosphate Accumulation and Translocation

Although the inorganic phosphorus content in crops is generally low, it plays an important role in stabilizing the pH and metabolic balance of the cellular protoplasm [44]. The low Ca-P mineral solubility and ionic competition with H2PO4 and HPO42− severely restricted the availability of phosphorus in salt-alkaline soils [45]. The effect of salinity on phosphorus absorption and utilization in crops seems to be more obscure [12].
In the two types of soil, the phosphorus concentration continued to decrease from the tilling stage to maturity in the stem and leaf but increased from the heading to mature stages in the grain (Table 3). This result may be because of the change in vegetative growth and translocation toward grains for reproductive development [46]. The phosphorus concentration in two soil treatments was similar at the same stage for the genotypes. Consistent with a previous study, NaCl salt stress had no significant effect on the concentration of leaf and grain phosphorus in rice [33]. Similar with the changing of dry matter, the relative reduction of PAE was higher at the tilling and mature stages under salt-alkaline treatment for all genotypes, which illustrated that phosphorus acquisition was severely affected by salt-alkaline stress at these two stages (Figure 2a–c). Grattan and Grieve [45] proved that saline soils can reduce the phosphorus availability and root absorption by the fixation and low solubility of Ca-P minerals. In addition, the PAE relative reduction of D4 and C9 was far less than that of C25 and T315 in the salt-alkaline treatment. However, in the sandy treatment, there was almost no significant difference on PAE among genotypes; this result is the same as the result reported by Masooni et al. [42]. The difference in dry matter and phosphorus assimilation between genotypes was far less than that between environments. We also propose that D4 and C9 have greater phosphorus acquisition ability with the higher PAE under salt-alkaline stress. The demand from plants was the vital factor for phosphorus uptake [14,47,48]. In addition, a higher phosphorus concentration can be helpful for cellular osmotic regulation and metabolic balance, and enhancing the crop salt-alkaline tolerance [49]. Zirbi et al. [50] also demonstrated that PAE increased significantly in salt-tolerant rice genotypes. Because of the relatively stable phosphorus concentration, the PUE did not show obvious differences among treatments (Figure 2d–f). While Wu et al. [25] found obvious higher PUE in low phosphorus conditions than in normal and higher phosphorus conditions. This may implied that the contribution of phosphorus to dry matter was the same with a sufficient phosphate supply in our experiment.
Compared to the translocation of dry matter, phosphorus had a greater amount of translocation (greater than 20 mg pot-1), a higher translocation efficiency (approximately 70%), a larger contribution to phosphorus in the grain (38.75%–72.43%) and a higher PHI (approximately 80%) (Figure 3). This result indicated that phosphorus is less affected than the dry matter under salt-alkaline stress. It also proved that the shoot biomass was more restricted by salt-alkaline stress than weak phosphorus acquisition. Masoni et al. [42] also found the same result between dry matter and nutrition translocation in durum wheat. Phosphorus in grain relies on the translocation from other vegetable organs and production of photosynthesis. A significant difference among genotypes occurred in the PT and CPAG under salt-alkaline stress. D4 and C9 showed lower PT than C25 and T315 in sandy soil, representing less remobilization and more photosynthesis for their grain filling. Thus, the CPAG of D4 and C9 was also lower than C25 and T315 in the same condition. In the salt-alkaline treatment, however, the PT and CPAG changed because of the photosynthetic inhibition and biomass reduction. Sensibility of the salt-alkaline stress led to an extremely significant PT decrease in C25 and T315 because of the greater dry matter reduction of C25 and T315 in both the heading and mature stages. D4 and C9 showed slightly higher PT under salt-alkaline stress. This is own to the relative metabolic stability and less reduction of dry matter. They can also redistribute Na+ and Cl from grains and leaves into stems and roots. Once the dry matter and phosphorus assimilation was restrained, contribution of the dry matter and phosphorus to the panicle at maturity increased [21,51]. The lower PT and relative increased CPAG of C25 and T315 reflected their seriously restrained photosynthetic abilities and phosphorus absorption under salt-alkaline stress. In addition, the higher PT and relative increased CPAG of D4 and C9 reflected their stronger abilities of photosynthetic adaption and phosphorus remobilization under salt-alkaline stress. The relative CPAG is come from the combined action of phosphorus acquired in metabolism and translocation from other organs, while the PT can represent the phosphorus remobilization more directly [42]. The PTE and PHI were similar in genotypes, showing that the percent of phosphorus translocation for genotypes was not affected by the salt-alkaline stress. In this study, with higher phosphorus acquisition efficiency and translocation, D4 and C9 may have greater ability to regulate the phosphorus absorption from soil to root and reasonable remobilization from vegetative organs to the reproductive organs under stress conditions.

5. Conclusions

Biomass and phosphorus were transferred from the vegetative organs to the yield components from the beginning of the reproductive stages. Our study showed that dry matter and phosphorus concentration kept decreasing in vegetative parts but increasing in the grain along with rice growth. The salt-alkaline stress seriously affected the dry matter and phosphorus assimilation and translocation. The total phosphorus acquisition of rice, the PAE, also increased with development. Because of ionic toxicity and osmotic stress, rice genotypes absorbed more Na+ and Cl than K+ and other useful ions, which led to the photosynthesis and the synthesis of carbohydrates being significantly affected under salt-alkaline stress. Growth restriction resulted in a poor source of assimilation, while pollen sterility resulted in a weak potential sink. The dry matter and phosphorus translocations in vegetable organs increased further to support grain filling under stress conditions. Results also demonstrated that the salt-alkaline-tolerant genotypes D4 and C9 can maintain stably higher dry matter assimilation and translocation in the salt-alkaline soil. They can also remobilize more phosphorus to the grain under stress conditions. As a result, we speculate that the salt-alkaline-tolerant rice genotypes may have greater biomass and phosphorus assimilation and translocation abilities than the salt-alkaline-sensitive rice genotypes, especially under stress conditions. This study can provide a basis for high resistance rice breeding and rational fertilization in salt-alkaline soil, which is also important for environment protection and food security. More rice genotypes should be used to support our speculation in future work.

Acknowledgments

This research was supported by the science and technology development project of Jilin province (20130303037-NY).

Author Contributions

All authors conceived and designed the experiments; Zhijie Tian and Jingpeng Li performed the experiments; Zhijie Tian and Xueying Jia analyzed the data and wrote the paper. All authors have read and approved the final manuscript.

Conflicts of Interest

All authors have no conflict of interests to any other parties.

References

  1. Flowers, T.J.; Yeo, A.R. Breeding for salinity resistance in crop plants: Where next? Aust. J. Plant Physiol. 1995, 22, 875–884. [Google Scholar] [CrossRef]
  2. Wang, C.Y.; Wu, Z.J.; Shi, Y.L.; Wang, R.Y. The resource of saline soil in the Northest China. Chin. J. Soil Sci. 2004, 5, 643–647. [Google Scholar]
  3. Munns, R.; Tester, M. Mechanisms of salinity tolerance. Annu. Rev. Plant Biol. 2008, 59, 651–681. [Google Scholar] [CrossRef] [PubMed]
  4. Yang, F.; Liang, Z.W.; Wang, Z.C.; Chen, Y. Strategic reflections on rice development in saline and alkalineArea in west Jilin, China. Notrh Rice 2007, 6, 7–12. [Google Scholar]
  5. Eraslan, F.; Inal, A.; Gunes, A.; Alpaslan, M. Impact of exogenous salicylic acid on the growth, antioxidant activity and physiology of carrot plants subjected to combined salinity and boron toxicity. Sci. Hortic Amst. 2007, 113, 120–128. [Google Scholar] [CrossRef]
  6. Shabbir, G.; Hussain, N.; Bhatti, M.; Ahmad, A.; Javed, M.; Shakir, M.A. Salt tolerance potential of some selected fine rice cultivars. Field Stud. 2001, 1, 1175–1177. [Google Scholar]
  7. Jampeetong, A.; Brix, H. Effects of NaCl salinity on growth, morphology, photosynthesis and proline accumulation of Salvinia natans. Aquat. Bot. 2009, 91, 181–186. [Google Scholar] [CrossRef]
  8. Sairam, R.; Tyagi, A. Physiology and molecular biology of salinity stress tolerance in plants. Curr. Sci. Bangalore 2004, 86, 407–421. [Google Scholar]
  9. Zhang, J.T.; Mu, C.S. Effects of saline and alkaline stresses on the germination, growth, photosynthesis, ionic balance and anti-oxidant system in an alkali-tolerant leguminous forage Lathyrus quinquenervius. Soil Sci. Plant Nutr. 2009, 55, 685–697. [Google Scholar] [CrossRef]
  10. Lv, B.S.; Li, X.W.; Ma, H.Y.; Sun, Y.; Wei, L.X.; Jiang, C.J.; Liang, Z.W. Differences in growth and physiology of rice in response to different saline-alkaline stress factors. Agron. J. 2013, 105, 1119–1128. [Google Scholar] [CrossRef]
  11. Wang, K.; Cui, K.H.; Liu, G.L.; Xie, W.B.; Yu, H.H.; Pan, J.F.; Huang, J.L.; Nie, L.X.; Shah, F.; Peng, S.B. Identification of quantitative trait loci for phosphorus use efficiency traits in rice using a high density SNP map. BMC Genet. 2014. [Google Scholar] [CrossRef] [PubMed]
  12. Hu, Y.; Schmidhalter, U. Drought and salinity: A comparison of their effects on mineral nutrition of plants. J. Plant. Nutr. Soil Sci. 2005, 168, 541–549. [Google Scholar] [CrossRef]
  13. Dahiya, S.; Singh, M. Effect of salinity, alkalinity and iron application on the availability of iron, manganese, phosphorus and sodium in pea (Pisum sativum L.) crop. Plant Soil 1976, 44, 697–702. [Google Scholar] [CrossRef]
  14. Papakosta, D.K. Phosphorus accumulation and translocation in wheat as affected by cultivar and nitrogen-fertilization. J. Agron. Crop Sci. 1994, 173, 260–270. [Google Scholar] [CrossRef]
  15. Zribi, O.T.; Barhoumi, Z.; Kouas, S.; Ghandour, M.; Slama, I.; Abdelly, C. Insights into the physiological responses of the facultative halophyte Aeluropus littoralis to the combined effects of salinity and phosphorus availability. J. Plant Physiol. 2015, 189, 1–10. [Google Scholar] [CrossRef] [PubMed]
  16. Karlen, D.L.; Whitney, D.A. Dry-matter accumulation, mineral concentrations, and nutrient distribution in winter-wheat. Agron. J. 1980, 72, 281–288. [Google Scholar] [CrossRef]
  17. Uhde-Stone, C.; Gilbert, G.; Johnson, J.M.F.; Litjens, R.; Zinn, K.E.; Temple, S.J.; Vance, C.P.; Allan, D.L. Acclimation of white lupin to phosphorus deficiency involves enhanced expression of genes related to organic acid metabolism. Plant Soil 2003, 248, 99–116. [Google Scholar] [CrossRef]
  18. Liu, E.K.; Mei, X.R.; Yan, C.R.; Gong, D.Z.; Zhang, Y.Q. Effects of water stress on photosynthetic characteristics, dry matter translocation and WUE in two winter wheat genotypes. Agr. Water Manag. 2016, 167, 75–85. [Google Scholar] [CrossRef]
  19. Richardson, A.E.; Simpson, R.J. Soil microorganisms mediating phosphorus availability. Plant. Physiol. 2011, 156, 989–996. [Google Scholar] [CrossRef] [PubMed]
  20. Przulj, N.; Momcilovic, V. Genetic variation for dry matter and nitrogen accumulation and translocation in two-rowed spring barley II. Nitrogen translocation. Eur. J. Agron. 2001, 15, 255–265. [Google Scholar] [CrossRef]
  21. Arduini, I.; Masoni, A.; Ercoli, L.; Mariotti, M. Grain yield, and dry matter and nitrogen accumulation and remobilization in durum wheat as affected by variety and seeding rate. Eur. J. Agron. 2006, 25, 309–318. [Google Scholar] [CrossRef]
  22. Yang, J.-F.; He, L.-Y.; Zuo, D.-X.; Liu, Y.-F.; Wu, Z.-H.; Zhang, A.-Q.; Zhao, H.-E.; Liu, W.; Yan, C.; Men, Y.-Y. Phosphorous nutritional characteristics of rice in P-deficient soils with different pH values. Plant Nutr. Fertil. Sci. 2009, 15, 62–68. [Google Scholar]
  23. Gemenet, D.C.; Hash, C.T.; Sanogo, M.D.; Sy, O.; Zangre, R.G.; Leiser, W.L.; Haussmann, B.I. Phosphorus uptake and utilization efficiency in West African pearl millet inbred lines. Field Crops Res. 2015, 171, 54–66. [Google Scholar] [CrossRef]
  24. Vance, C.P.; Uhde-Stone, C.; Allan, D.L. Phosphorus acquisition and use: Critical adaptations by plants for securing a nonrenewable resource. New Phytol. 2003, 157, 423–447. [Google Scholar] [CrossRef]
  25. Wu, Z.H.; He, L.Y.; Zuo, D.X.; Yang, J.F.; Men, Y.Y. Characteristics of phosphorus nutrition of different rice genotypes under low-P stress at different growth stages. Chin. J. Rice Sci. 2008, 22, 71–76. [Google Scholar]
  26. Darwish, E.; Testerink, C.; Khalil, M.; El-Shihy, O.; Munnik, T. Phospholipid signaling responses in salt-stressed rice leaves. Plant Cell Physiol. 2009, 50, 986–997. [Google Scholar] [CrossRef] [PubMed]
  27. Borras, L.; Slafer, G.A.; Otegui, M.E. Seed dry weight response to source-sink manipulations in wheat, maize and soybean: A quantitative reappraisal. Field Crops Res. 2004, 86, 131–146. [Google Scholar] [CrossRef]
  28. Turkan, I.; Demiral, T. Recent developments in understanding salinity tolerance. Environ. Exp. Bot. 2009, 67, 2–9. [Google Scholar] [CrossRef]
  29. Flowers, T.J.; Flowers, S.A. Why does salinity pose such a difficult problem for plant breeders? Agric. Water Manag. 2005, 78, 15–24. [Google Scholar] [CrossRef]
  30. Munns, R. Comparative physiology of salt and water stress. Plant Cell Environ. 2002, 25, 239–250. [Google Scholar] [CrossRef] [PubMed]
  31. Abdullah, Z.; Khan, M.A.; Flowers, T. Causes of sterility in seed set of rice under salinity stress. J. Agron. Crop Sci. 2001, 187, 25–32. [Google Scholar] [CrossRef]
  32. Nemati, I.; Moradi, F.; Gholizadeh, S.; Esmaeili, M.; Bihamta, M. The effect of salinity stress on ions and soluble sugars distribution in leaves, leaf sheaths and roots of rice (Oryza sativa L.) seedlings. Plant Soil Environ. 2011, 57, 26–33. [Google Scholar]
  33. Naheed, G.; Shahbaz, M.; Akram, N.A. Interactive effect of rooting medium application of phosphorus and NaCl on plant biomass and mineral nutrients of rice (Oryza sativa L.). Pak J Bot 2008, 40, 1601–1608. [Google Scholar]
  34. Elgharably, A. Wheat response to combined application of nitrogen and phosphorus in a saline sandy loam soil. Soil Sci. Plant Nutr. 2011, 57, 396–402. [Google Scholar] [CrossRef]
  35. Cui, H.; Takeoka, Y.; Wada, T. Effect of sodium chloride on the panicle and spikelet morphogenesis in rice [Oryza sativa], 2: Developmental morphology of the panicle. Jpn. J. Crop Sci. 1995, 64, 593–600. [Google Scholar] [CrossRef]
  36. Rao, P.S.; Mishra, B.; Gupta, S.; Rathore, A. Reproductive stage tolerance to salinity and alkalinity stresses in rice genotypes. Plant Breed. 2008, 127, 256–261. [Google Scholar] [CrossRef]
  37. Nieman, R.H.; Clark, R.A. Interactive effects of salinity and phosphorus nutrition on concentrations of phosphate and phosphate esters in mature photosynthesizing corn leaves. Plant Physiol. 1976, 57, 157–161. [Google Scholar] [CrossRef] [PubMed]
  38. Hakim, M.; Juraimi, A.S.; Begum, M.; Hanafi, M.; Ismail, M.R.; Selamat, A. Effect of salt stress on germination and early seedling growth of rice (Oryza sativa L.). Afr. J. Biotechnol. 2010, 9, 1911–1918. [Google Scholar]
  39. Khan, M.A.; Abdullah, Z. Salinity-sodicity induced changes in reproductive physiology of rice (Oryza sativa) under dense soil conditions. Environ. Exp. Bot. 2003, 49, 145–157. [Google Scholar] [CrossRef]
  40. Asch, F.; Dingkuhn, M.; Wittstock, C.; Doerffling, K. Sodium and potassium uptake of rice panicles as affected by salinity and season in relation to yield and yield components. Plant Soil 1999, 207, 133–145. [Google Scholar] [CrossRef]
  41. Fabre, D.; Siband, P.; Dingkuhn, M. Characterizing stress effects on rice grain development and filling using grain weight and size distribution. Field Crops Res. 2005, 92, 11–16. [Google Scholar] [CrossRef]
  42. Masoni, A.; Ercoli, L.; Mariotti, M.; Arduini, I. Post-anthesis accumulation and remobilization of dry matter, nitrogen and phosphorus in durum wheat as affected by soil type. Eur. J. Agron. 2007, 26, 179–186. [Google Scholar] [CrossRef]
  43. Van Herwaarden, A.F.; Angus, J.F.; Richards, R.A.; Farquhar, G.D. “Haying-off”, the negative grain yield response of dryland wheat to nitrogen fertiliser—II. Carbohydrate and protein dynamics. Aust. J. Agric. Res. 1998, 49, 1083–1093. [Google Scholar] [CrossRef]
  44. Qadir, M.; Qureshi, R.H.; Ahmad, N. Amelioration of calcareous saline sodic soils through phytoremediation and chemical strategies. Soil Use Manag. 2002, 18, 381–385. [Google Scholar] [CrossRef]
  45. Grattan, S.R.; Grieve, C.M. Salinity mineral nutrient relations in horticultural crops. Sci Hortic Amst. 1999, 78, 127–157. [Google Scholar] [CrossRef]
  46. Martinez, V.; Lächli, A. Phosphorus translocation in salt-stressed cotton. Physiol. Plant. 1991, 83, 627–632. [Google Scholar] [CrossRef]
  47. Bauer, A.; Frank, A.B.; Black, A.L. Aerial parts of hard red spring wheat 1. Dry-matter distribution by plant development stage. Agron. J. 1987, 79, 845–852. [Google Scholar] [CrossRef]
  48. Dordas, C. Dry matter, nitrogen and phosphorus accumulation, partitioning and remobilization as affected by N and P fertilization and source-sink relations. Eur. J. Agron. 2009, 30, 129–139. [Google Scholar] [CrossRef]
  49. Awad, A.; Edwards, D.; Campbell, L. Phosphorus enhancement of salt tolerance of tomato. Crop Sci. 1990, 30, 123–128. [Google Scholar] [CrossRef]
  50. Zribi, O.T.; Houmani, H.; Kouas, S.; Slama, I.; Ksouri, R.; Abdelly, C. Comparative study of the interactive effects of salinity and phosphorus availability in wild (Hordeum maritimum) and cultivated barley (H-vulgare). J. Plant Growth Regul. 2014, 33, 860–870. [Google Scholar] [CrossRef]
  51. Tahir, I.S.A.; Nakata, N. Remobilization of nitrogen and carbohydrate from stems of bread wheat in response to heat stress during grain filling. J. Agron. Crop Sci. 2005, 191, 106–115. [Google Scholar] [CrossRef]
Figure 1. The four dry matter translocation indexes for genotypes in two soil treatments. (a) DMT = dry matter translocation; (b) DMTE = dry matter translocation efficiency; (c) CDMAG = contribution of dry matter assimilation to grains; (d) HI = harvest index; *, ** = significant at 0.05, 0.01 levels between the two types of soils, respectively; A, B, C, D = significant differences between genotypes in sandy treatment; a, b, c, d = significant differences between genotypes in salt-alkaline treatment; bars represent ± S.E.
Sustainability 08 00568 g001
Figure 2. Phosphorus acquisition and utilization efficiency of four genotypes at three stages in two soil types. (a) PAE = phosphorus acquisition efficiency at filling stage; (b) PAE = phosphorus acquisition efficiency at heading stage; (c) PAE = phosphorus acquisition efficiency at mature stage; (d) PUE = phosphorus utilization efficiency at filling stage; (e) PUE = phosphorus utilization efficiency at heading stage; (f) PUE = phosphorus utilization efficiency at mature stage; *, ** = significant at 0.05, 0.01 levels between the two types of soils, respectively; A, B, C, D = significant differences between genotypes in sandy treatment; a, b, c, d = significant differences between genotypes in salt-alkaline treatment; bars represent ± S.E.
Sustainability 08 00568 g002
Figure 3. The four phosphorus translocation indexes for genotypes in two soil treatments. (a) PT = phosphorus translocation; (b) PTE = phosphorus translocation efficiency; (c) CPAG = contribution of phosphorus assimilation to grains; (d) PHI = phosphorus harvest index; *, ** = significant at 0.05, 0.01 levels between the two types of soils, respectively; A, B, C, D = significant differences between genotypes in sandy treatment; a, b, c, d = significant differences between genotypes in salt-alkaline treatment; bars represent ± S.E.
Sustainability 08 00568 g003
Table 1. Physical, chemical, and fertility characteristics of the two soil types used in this experiment.
SoilsEC 1:5 μS·cm−1pHTotal N·g·kg−1Total P g·kg−1Available P mg·kg−1Organic Matter %CEC cmol·kg−1ESPNa+ mg·kg−1HCO3− mg·kg−1
SS86.67.59461.8163.592.680.999.741.152.74292.8
SAS3588.81535.9254.639.391.2417.337.59347770.4
SS = sandy soil; SAS = salt-alkaline soil; CEC = cation exchange capacity; ESP = exchangeable sodium percentage.
Table 2. Stem, leaf and grain dry matter of four genotypes at three stages in two soil types.
GenotypesDry Matter (g)
StemLeafGrain
(TS)SSSASrDMRSSSASrDMRSSSASrDMR
D42.460.7967.73a **2.170.6569.98a **
C91.961.0148.55b **1.430.7646.90c **
C251.881.1638.18c **1.990.8656.58b **
T3152.350.7169.89a **1.830.5768.83a **
(HS)
D411.7710.4810.88a4.094.051.01c2.552.0220.33b *
C911.9610.6810.64c3.613.415.60c2.021.5622.89b
C2512.337.9235.78c **4.322.7935.57a **2.351.2347.60a **
T31512.209.0425.87a **4.193.4816.94b **2.231.5928.11b
(MS)
D49.618.0316.40c *3.632.8322.13d17.3412.8925.67c **
C910.398.4518.52c *3.042.7310.32c17.4211.3834.74bc **
C2511.985.7851.87a **3.652.0942.85a **18.398.6852.94a **
T31512.858.7431.91b **4.002.8030.01b **18.6310.9540.98b **
TS = tilling stage; HS = heading stage; MS = mature stage; SS = sandy soil; SAS = salt-alkaline soil; rDMR = (SAS-SS)/SS × 100%, relative dry matter reduction; *, ** = significant at 0.05, 0.01 levels between the two types of soils, respectively; a, b, c, d = significant at 0.05 levels between the four genotypes.
Table 3. Stem, leaf and grain phosphorus concentration of four genotypes at three stages in two soil types.
GenotypesPhosphorus Concentration (mg·g1)
StemLeafGrain
(TS)SSSASrPCSSSASrPCSSSASrPC
D43.783.140.83b2.762.570.93a
C93.633.250.89ab3.132.610.84a **
C253.452.820.82b **2.642.410.92a
T3153.013.001.00a2.382.250.95a
(HS)
D42.042.161.06ab2.082.291.11a *1.682.031.21a *
C92.152.481.15a2.462.180.89b1.761.761.01b
C252.622.330.89c2.172.161.00ab1.791.991.12ab
T3152.252.100.94bc *2.332.070.89b1.772.231.26a **
(MS)
D40.810.841.04a1.191.361.15a *3.433.330.97a
C90.940.900.96a1.231.050.86b3.663.530.96a
C250.800.841.05a0.921.041.13a *3.263.190.98a
T3150.620.681.11a0.720.911.26a **3.383.250.97a
TS = tilling stage; HS = heading stage; MS = mature stage; SS = sandy soil; SAS = salt-alkaline soil; rPC = SAS/SS, relative phosphorus concentration; *, ** = significant at 0.05, 0.01 levels between two types of soils, respectively; a, b, c = significant at 0.05 level between four genotypes.

