Article

Covering Indirect Emissions Mitigates Market Power in Carbon Markets: The Case of South Korea

Korea Energy Economics Institute, Jongga-ro 405-11, Jung-gu, Ulsan 44543, Korea
*
Author to whom correspondence should be addressed.
Sustainability 2016, 8(6), 583; https://0-doi-org.brum.beds.ac.uk/10.3390/su8060583
Submission received: 30 March 2016 / Revised: 16 June 2016 / Accepted: 17 June 2016 / Published: 21 June 2016
(This article belongs to the Section Economic and Business Aspects of Sustainability)

Abstract

:
One of the main concerns of policymakers regarding emissions trading markets is that some firms may well enjoy market power owing to their share of the emissions. This study shows that including indirect emissions within the coverage of an emissions trading scheme can help to reduce market power and thereby enhance social efficiency. In this study, the market concentration measured by the Herfindahl-Hirschman Index significantly drops after including indirect emissions in the South Korean emissions trading market. In addition, other market concentration measures are also considered to verify that the conclusion does not depend on the choice of concentration measures.

1. Introduction

In January 2015, the South Korean government launched the Emissions Trading Scheme (ETS), a key policy to achieve its goal of cutting greenhouse gases 30% below the business-as-usual (BAU) level by 2020. One notable feature in the South Korean ETS is that indirect emissions from electricity and heat consumption as well as direct emissions are regulated by the authorities while the EU Emissions Trading System (EU-ETS) and the California ETS cover only direct emissions. Here, “direct emissions” refers to the emissions from onsite combustion or processes while “indirect emissions” relates to the consumption of power and heat generated and supplied by a utility.
Covering both direct and indirect emissions is not a unique feature to the South Korean ETS. ETS schemes implemented by some other neighboring countries also share this feature. For example, the ETS of the Tokyo Metropolitan Area and other municipalities regulates indirect emissions caused by electricity consumption. China’s pilot ETSs running in five cities and two provinces regulate both direct and indirect emissions from consuming outsourced power or heat [1,2].
There are pros and cons as to whether it is desirable to include indirect emissions within the coverage of ETSs. Those who oppose including indirect emissions are concerned that covering indirect emissions could jeopardize the environmental integrity and price stability of the emissions trading market [3]. Including indirect emissions generates double counting of power sector emissions, which could be neither efficient nor equitable. For instance, power companies may enjoy windfall profits if their direct emissions become less than the grandfathered permits due to the drop in power demand caused by end users’ efforts such as energy conservation or energy efficiency activities. This provides power companies with incentives to free-ride and distorts efficient allocation. Furthermore, covering indirect emissions may impede the price stability of the emissions trading market because it could amplify excess supply or excess demand. For example, with a sluggish economy, electricity consumption tends to fall, which in turn generates the surplus of permits in both non-power sectors and power sectors under grandfathering allocation schemes. The amplified excess supply in an ETS can exacerbate the price reduction. In case of the economic boom, similar reasoning can be applied.
On the other hand, including indirect emissions can serve as a second-best option when electricity markets are heavily regulated and electricity prices are not determined purely by supply and demand in the market as in South Korea [4]. As is well known, the market intervention of the government, such as price control, may prevent the carbon price from being passed through completely in retail prices. For instance, as of June 2016 the electricity retail prices of South Korea have not changed at all since November 2013, although the ETS started in January 2015 [5]. Such intervention results in failing to provide consumers with sufficient incentives to reduce electricity consumption, in which an ETS may not achieve the expected socially efficient allocation. Arguably, the best way to fix this inefficiency may be to deregulate power sectors so as to let prices be guided purely by market forces. However, deregulation takes a long time to be realized and may fall in the mire of political impasse, and thus including indirect emissions can provide a partial incentive for covered sectors to enhance their electricity consumption efficiency. In this regard, the South Korean and Chinese governments have finally chosen to include indirect emissions within the coverage of their ETSs.
The main reason many economists are in favor of the ETS is that they believe it helps achieve greenhouse gas reduction goals cost-effectively. Such cost-effectiveness can be achieved only when several conditions are satisfied. There are numerous factors that distort a cost-effective allocation and thereby raise the effectiveness of the ETS in question. According to [6,7], allocative efficiency is guaranteed when the following factors do not exist in the allowance market: (1) transaction cost; (2) market power; (3) other regulations; and (4) uncertainty. When some of these factors are pervasive, allocative efficiency will be achieved only if the initial allocation happens to be efficient. This is possible only when a regulatory authority knows the true abatement costs of participating firms, which is not only nearly impossible but also against the original intent of ETSs. Minimizing the effect of each factor is equally important for the successful implementation of an ETS, and deserves separate in-depth study.
This study focuses on market power since there is concern over the market power in the South Korean emissions trading market. In the South Korean ETS, large shares of allowances are allocated to a handful of firms such as power, steel, and cement companies. The emissions of the top 10 major emitters account for 60% of the total emissions of companies covered by the ETS. The absence of market power is a critical condition for the success of an ETS because, as general lessons from economics teach, market power is likely to cause a market failure. In this sense, it is imperative to devise a policy to lessen the likelihood of market power in the allowance market.
There are, however, a few studies showing that market power in an ETS may not be a serious concern in the case of zero-cost pass-through. In particular, [8] convincingly argues that a dominant firm’s market power is substantially mitigated by a commitment problem when the firm becomes a net buyer. Still, it also finds that if the dominant firm becomes a net seller, it exercises market power no differently than a large supplier of a conventional exhaustible resource. Because the possibility that the dominant firm becomes a net seller cannot be excluded ex ante, especially when an ETS is in its nascent stage, market power remains one of the main concerns even in the zero-cost pass-through.
This study shows that covering both direct and indirect emissions has the additional advantage of mitigating market power in the emissions trading market, besides the aforementioned effect of managing the final consumers’ electricity demand. The direct-to-indirect emissions ratios of most heavy emitters, such as power, steel, and cement companies, are much higher than the overall average of the covered entities in the South Korean ETS. Thus, the inclusion of indirect emissions can contribute to the lessening market concentration, thereby mitigating market power by lowering the shares of allowances allocated to heavy emitters. This study, using the case of South Korea, shows that market power can be mitigated substantially by including indirect emissions. Following the literature, the Herfindahl-Hirschman Index (HHI), the most widely used measure in both theory and empirics, is used to quantify market power. In addition, other market concentration measures are considered to confirm that the conclusion is robust to the choice of measures.
The rest of this paper is organized as follows. Section 2 examines how market power causes inefficiency of ETSs and outlines the HHI. Section 3 verifies that including indirect emissions can mitigate market power in the Korean ETS using the HHI index. Section 4 considers three other concentration measures and checks the robustness of the result. Section 5 concludes the paper.

2. Market Power in an ETS

2.1. Market Power and Allocative Inefficiency

Theoretically, an ETS results in the allocative efficiency of the market equilibrium. This result depends on several conditions, one of which is that the allowance market is competitive. If this condition is violated so that there is market power in the allowance market, allocative efficiency is no longer ensured because firms can take advantage of their market power to pursue the excess profit.
The first study on the theory of market power in emissions markets is examined by [9]. Motivated by the emissions market in Los Angeles, he studies the case in which there is a single dominant firm and many small fringe firms. His result shows that the initial degree of misallocation determines the type of market power of the dominant firm, regardless of its position as a dominant seller or buyer, and the firm enjoys excessive gains by manipulating the inelastic parts of competitors’ demand curves. The author of [6] classifies market power exercised in the allowance market into two types. One type aims to maximize revenue or minimize abatement cost by manipulating the allowance prices. This type focuses on the allowance market itself. The other type exercises its market power in the allowance market in order to take competitive advantage in the product market in which it originally competes. This type is known as exclusionary price manipulation because market power in the allowance market is used as leverage to influence competition in the product market. This type of market power is in line with the strategy of “raising rival’s cost” in the sense that a firm attempts to be more dominant by increasing other firms’ costs, thereby deriving more profit on the product market [10,11].
As far as the South Korean ETS is concerned, the second type of market power is unlikely to arise because various industries including power, steel, electronic equipment, and cars, would be covered by the ETS. Note that the second type of market power would arise when most firms competing in the same product market also participate in the allowance market. If firms covered by an ETS are diverse, as is the case in South Korea, it is likely that exclusionary price manipulation would not occur. However, the first type of market power could arise in the South Korean ETS. Because small numbers of firms have large numbers of allowances, strategic price-setting behavior by these firms has been warned of in the debate over the introduction of the ETS.
When a dominant firm exercises its market power in the allowance market, the final allocation is not necessarily equal to the socially optimal outcome. If a dominant firm is allocated more than needed and becomes a monopoly in the allowance market, it cuts emissions less than the socially optimal level while other small firms should reduce emissions more. This would raise allowance prices in the market and the dominant firm would benefit from the price rise. The opposite scenario is also possible. In addition, in the presence of market power a final allocation depends on an initial allocation. The property that a final allocation is independent of an initial allocation is one of the most desirable characteristics of an ETS. This helps us to deal with equity concerns separately from efficiency. This property allows us to focus on equity concerns because a socially efficient allocation can be achieved for any initial allocation. As [6,7] point out, however, the final allocation varies according to an initial allowance allocation in the presence of market power. This market power creates inter-linkages between distributional and efficiency issues, which puts an extra burden on regulators to address the efficiency issues in the market. Since distributional issues are inter-linked with efficiency issues in the presence of market power, regulators have a larger burden in addressing efficiency issues as well as distributional issues simultaneously. In this regard, mitigating market power in an ETS is a necessary condition for a successful ETS.

2.2. Evaluating the Concerns of Market Power in an ETS

Market power is defined as the ability to control market price. The price-cost margin typically is used to identify the presence of market power in a market. In practice, however, when evaluating the concerns of market power, an index of market concentration represented as a functional form of market shares is usually used because it is difficult to find true marginal costs in many cases. Of course, the value of a market concentration index is not the only measurement to evaluate the concern of market power. Other factors, such as the number of market participants, the degree of product variety and the ease of coordinated interaction among firms, should be considered together. Nonetheless, the value of the market concentration index ought to be one very useful element in evaluating the concerns of market power. Most anti-trust authorities have used an index of market concentration as a screening device when assessing the level of constraints to market competition. This can be also applied to assessing the concerns of market power in an ETS. Several studies, including [12,13,14], suggest that the initial shares of allocation to the covered firms can evaluate the possibility of market power in the allowance market.
The most well-known concentration measure among several measures based on market shares is the HHI. The index is defined as
H H I = 10,000 × k = 1 n s k 2
where n is the number of firms in the market and (s1, s2, …, sn) are the market shares. One of the attractive features of the HHI is that it has foundations in oligopoly theory. It can be shown that the HHI is associated with a weighted average of firms’ price-cost margins from the Cournot solution [15].
The HHI is used widely as a measure of concentration in the literature on industrial organization and serves as a reference for the assessment of concentration indexes [16]. In the context of the EU-ETS, [13] calculate the HHI for each of the top 10 companies in the EU-ETS and conclude that no firm has market power in the emissions market. [14] also reach the same result. While a degree of concentration exists at the firm level, an analysis based on the HHI verifies that it does not present any threat to market power.
Following the literature, this study uses the HHI to assess the market concentration in the Korean ETS. Thereafter, other concentration measures are considered as well.

2.3. Criteria Based on the Herfindahl-Hirschman Index

The HHI is widely used as an indicator examining the concentration of a market in many regulation-related bodies. It is one of the most common assessment measures for the likely competitive effects from horizontal mergers. The anti-trust authorities consider both the absolute level of the HHI and the change of the HHI after a merger to evaluate the likely competitive concerns in a merger.
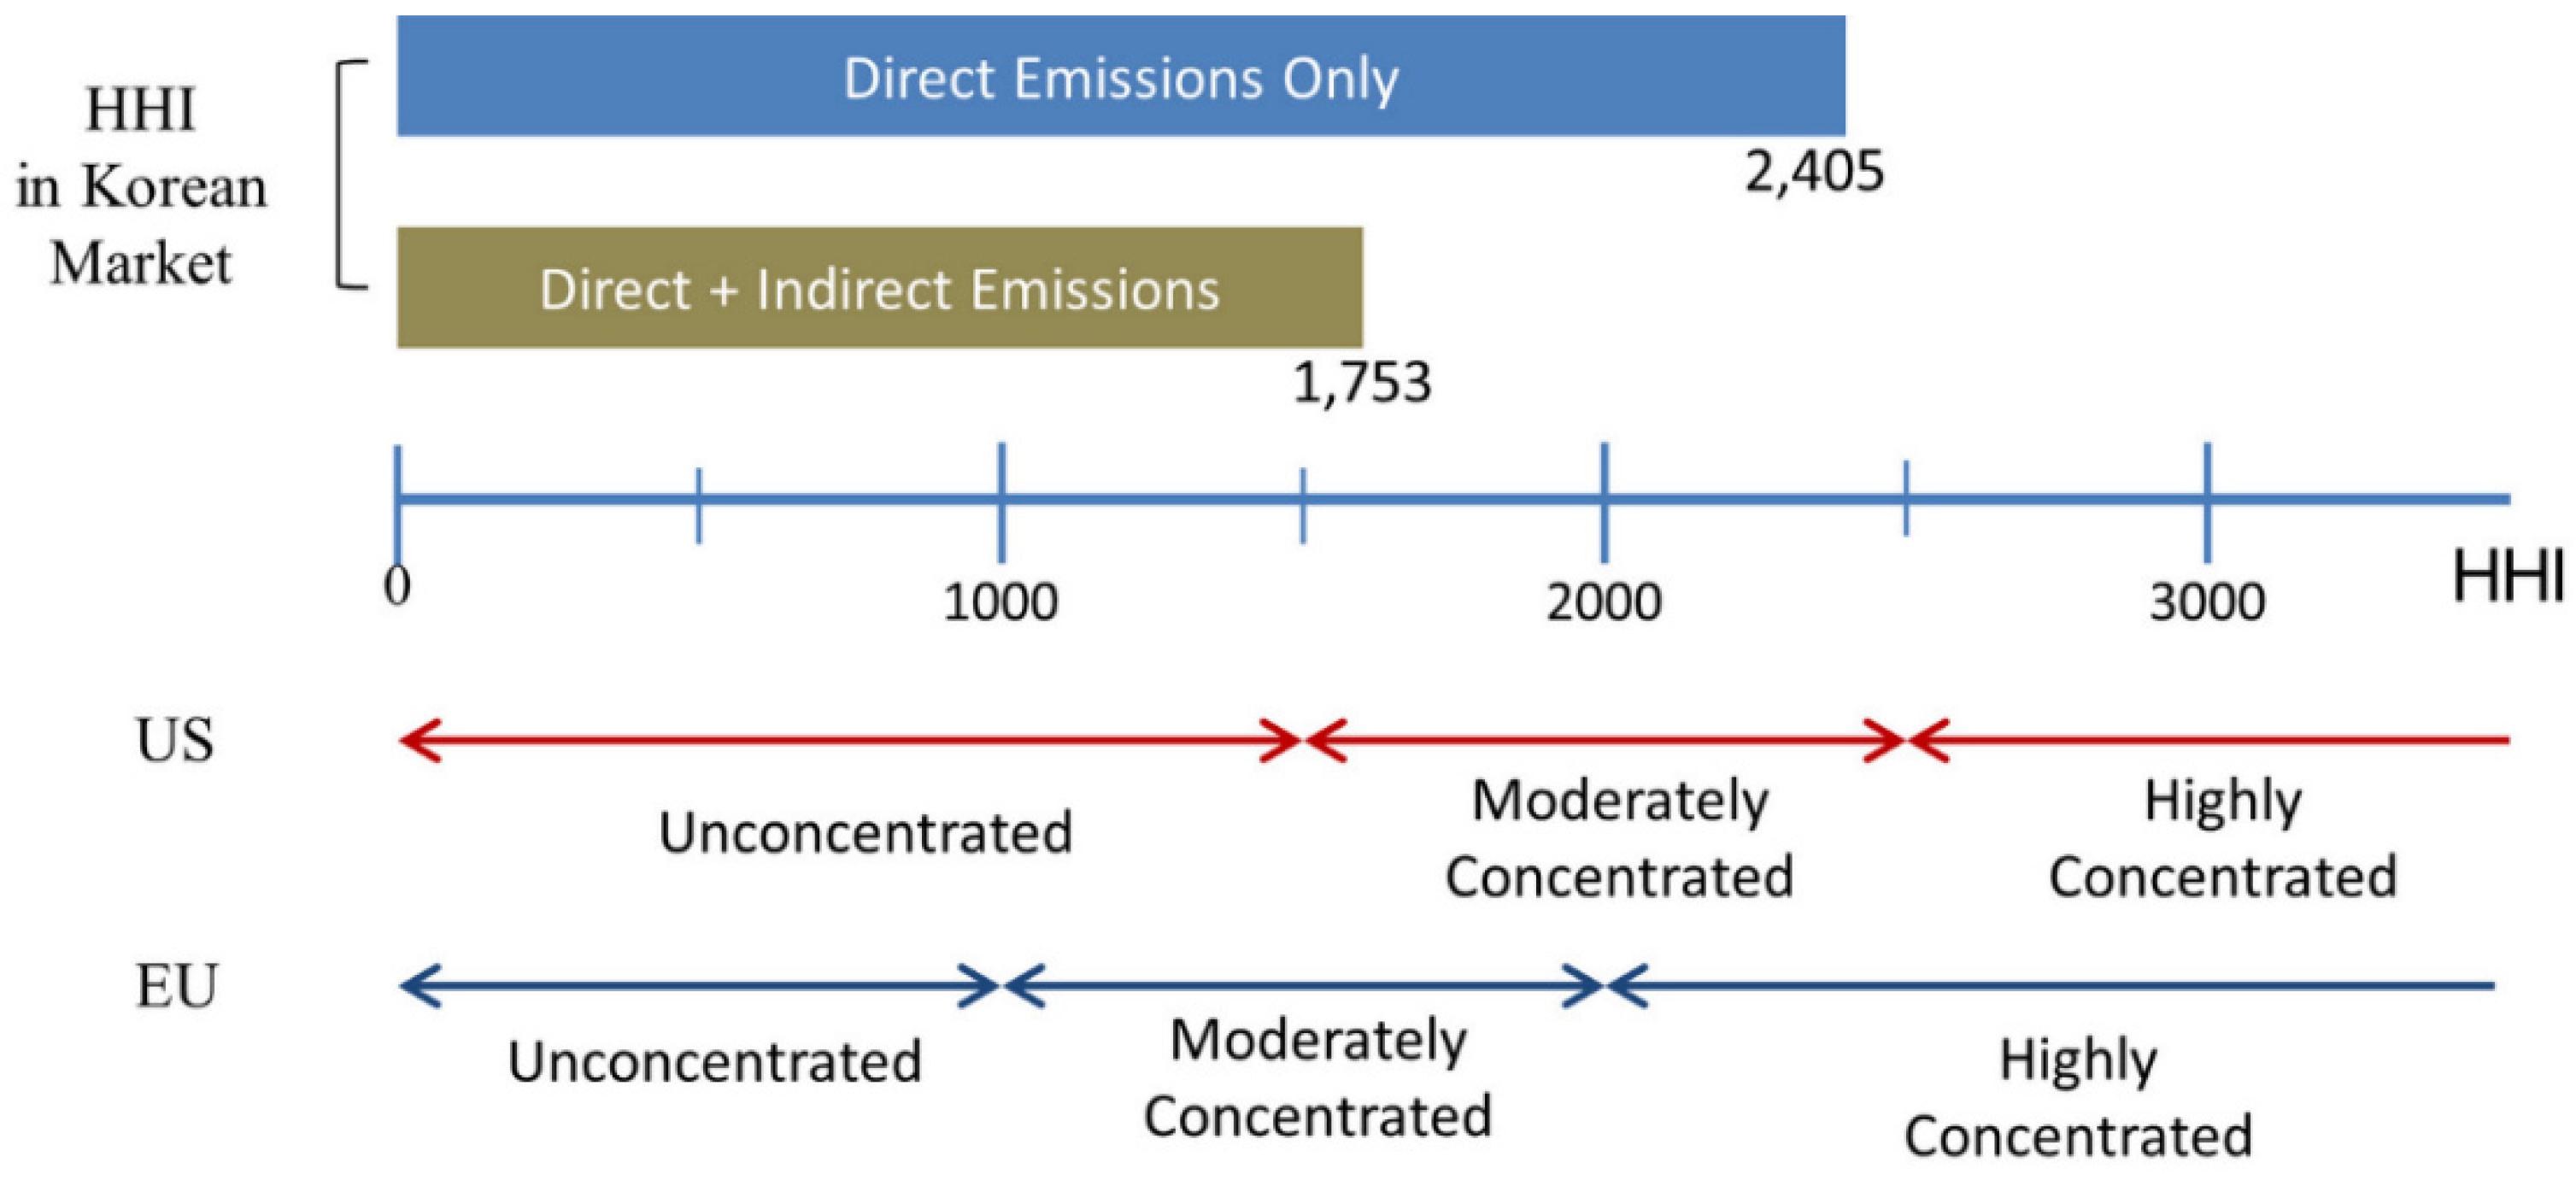
In the United States, the HHI serves a major role in the execution process of anti-trust laws. The Antitrust Division of the Justice Department and the Federal Trade Commission issued guidelines based on the HHI concerning their policy toward mergers [17]. According to the guidelines, there are three categories of market concentration: unconcentrated (HHI < 1500), moderately concentrated (1500 < HHI < 2500), and highly concentrated (HHI > 2500). If the value of the HHI after the merger falls into the unconcentrated market category, no negative effects are considered to limit market competition. In addition, a small change of the HHI, that below 100, is considered unlikely to have competitive concerns regardless of the absolute level of the HHI. If the HHI value falls into the moderately or highly concentrated market category and the change of the HHI is more than 100, there is the possibility of significant competitive concerns.
The EU also sets concentration thresholds of the HHI, although somewhat differently, and these have the practical effect of determining safe harbors. The guideline of the European Commission (EC) states that the EC is unlikely to recognize horizontal competition concerns in a market with a post-merger HHI of less than 1000 [18]. In addition, the guidelines are unlikely to recognize competition concerns in a merger with a post-merger HHI value of between 1000 and 2000 and a change in the HHI of less than 250, or a merger with a post-merger HHI of more than 2000 and a change in the HHI below 150. The guidelines of South Korea are very similar to those of the EC. The difference is that the HHI thresholds in South Korea are 1200 and 2500 while those in the EU are 1000 and 2000, respectively.
It should be noted here that the purpose of the criteria is not to judge the existence of market power. Rather, the criteria are used mainly to provide a safe harbor rule judging what is likely to be anti-competitive. They also provide a standard for screening what is likely to raise potential competitive concerns. Once possible competitive concerns are raised from the criteria, they should be reviewed more closely in conjunction with some other factors.

3. Evaluating the Concerns of Market Power in the Korean ETS

3.1. Allowance Allocation in the Korean ETS

In the Korean ETS, the National Allocation Plan (NAP) provides the principles of the allowance allocation in each commitment period. The NAP for the first commitment period (2015–2017) was finalized in September 2014. The plan states the total amount of emissions permits and sector-wise emission caps during the first commitment period. The emission caps, considering the historical emissions records and growth outlook of business entities were determined based on the National Greenhouse Gas Emissions Reduction Roadmap and Emissions Trading Scheme Basic Plan. The total amount of emissions allowed for the first commitment period is 1.687 billion tCO2e. Table 1 shows the sector-wise emission caps as well as the reserves during the period. A certain amount of emissions is saved in reserve as additional allocations to allow for new entrants and early reductions, the unexpected establishment or expansion of facilities, and market-stabilizing measures. The reserve size in the first commitment period is about 5.3% of the total amount of allowances.
In contrast with the EU-ETS in which allowances are allocated to each installation, the South Korean ETS allocates allowances to each business entity. The business entities whose annual emissions are more than 125 ktCO2e at company level or more than 25 ktCO2e at installation level are covered by the South Korean ETS. The allowances, excluding the reserve, have been allocated to each business entity on the basis of grandfathering. The allocated allowances basically depend on the annual average of their historical emissions record over the last three years. However, when a business entity has a predetermined plan to establish new facilities or expand its existing facilities, additional allowances are allocated to the business entity. The sum of the allowances in each sector is adjusted to be equalized to the sector’s emissions cap. For more details about the design of the South Korean ETS, refer to [20,21].

3.2. Data

To check possible concerns of market power in the South Korean ETS and examine whether covering indirect emissions helps mitigate the concerns, it is necessary to first assess the degree of market concentration with the HHI as in [13,14]. For this, the information about the amount of allocated allowances to each business entity is required. To examine the effects of the inclusion of indirect emissions, it is also necessary to know the amount of allocated allowances of each business entity associated with direct emissions. However, the information about the allowances allocated to each business entity is confidential.
As an alternative, the past emissions data of each business entity, which is open to the public, is used. The NAP indicates that the amount of allowances allocated to each business entity is essentially proportional to its past emissions. Hence, the past emissions data of business entities can be a good proxy for the amount of allocated allowances. The only limitation is that the public data show only total emissions without distinction between direct and indirect emissions. Fortunately, the Greenhouse Gas Inventory and Research Center of Korea provided the direct-to-indirect emissions ratios of each entity shown in the 2012 total emissions data of business entities under the Target Management System (TMS).
At present, indirect emissions from power and heat are calculated as the product of the total consumption amount, the annual average emission factor based on the latest years’ records. This method will suffer from measurement error because it fails to take into account the fact that the marginal power generator changes hour after hour. It is ideal to calculate indirect emissions based on real-time data of consumption and emissions, but such data unfortunately do not exist. Measurement error will create deadweight loss and should not be overlooked, but this study chooses to use the official data provided by the Greenhouse Gas Inventory and Research Center of Korea. The reason is twofold. First, there is no reliable way to fix measurement error because of data limitation. Second, the main focus of this paper is not how to exactly measure indirect emissions but how many allowances are additionally provided into the market due to the inclusion of indirect emissions.
The amounts of allowances allocated to each entity and the proportions associated with direct emissions are estimated in the following way. Let entity i belong to sector A. The number of allowances allocated with entity i is obtained by multiplying sector A’s cap in the NAP (Table 1) by entity i’s share in sector A’s total emissions in 2012. In fact, the allocation method in the South Korean ETS follows this procedure. Then, we estimate the proportion associated with direct emissions using the direct-to-indirect emissions ratio in 2012.
This study regards the Korea Electric Power Corporation (KEPCO) and its power-generating subsidiaries as one corporate group in order to reflect a distinct characteristic of the power sector in South Korea. KEPCO, which monopolizes the whole retail electricity market in Korea, including power transmission and distribution, owns 100% of the shares of the subsidiaries whose shares are unlisted on the stock market. The five power-generating subsidiaries occupy a considerable part of the total emissions covered by the ETS. Their marginal abatement cost structures are similar to each other because most power-generating facilities are fossil fuel–oriented ones. Hence, KEPCO and its power-generating subsidiaries should be considered as one corporate group practically. Table 2 shows the estimated entity-by-entity shares of the allowances when only direct emissions are considered and those when both emissions are considered.

3.3. Assessment of Market Power Concern

3.3.1. Market Concentration

The degree of market concentration in the South Korean ETS is investigated with the HHI, as in [13,14]. The values of the HHI are then calculated using the data in Table 2. The index’s value is 2405 when only direct emissions are included. If indirect emissions are included, the value decreases substantially to 1753. Refer to Figure 1.
According to the guidelines of the US Department of Justice and the Federal Trade Commission, both values of the HHI in the South Korean ETS fall in the interval (1500, 2500), which is the “moderately concentrated” range, and thus, the inclusion of indirect emissions does not lower the HHI sufficiently to belong to the “unconcentrated” range. However, notice that the HHI before including indirect emissions almost reaches the upper limit of the range, while it drops down to the lower limit after inclusion. Hence, it is true that market concentration is mitigated significantly by the inclusion of indirect emissions.
The EC guidelines assure that the inclusion of indirect emissions moderates the market concentration. Since one HHI is more than 2000 and the change in the HHI is around 600, by including the indirect emissions, competitive concerns can be mitigated. Even though the EC guidelines do not explicitly describe the concentration range as do the US guidelines, the range in which the value of the HHI is more than 2000 can be considered as corresponding to the “highly concentrated” range of the US. Similarly, if the value of the HHI is between 1000 and 2000, the market would correspond to the “moderately concentrated” range of the US. In this regard, according to the EC standard, the inclusion of indirect emissions significantly lowers the degree of the market concentration from a “highly concentrated” market to a “moderately concentrated” market. Therefore, the policy including indirect emissions to the ETS substantially reduces the market concentration.
This result should come as no surprise under the grandfathering allocation scheme. Since the power sector is the largest emitter in South Korea, as in other countries, it receives the largest share of allowances, and naturally has substantial market power in the allowance market. In particular, as KEPCO and its power-generating subsidiaries de facto monopolize the power industry in South Korea, the market concentration becomes severe. In such a case, the inclusion of indirect emissions to some extent reduces such market power because, for one unit of electricity, both power producers and final consumers of electricity under the ETS receive the same amount of allowances. That is, the shares of the power sector in the ETS are diluted and the degree of market concentration becomes weaker.

3.3.2. Other Considerations

Even though the degree of market concentration is a crucial factor in evaluating the concerns of market power, market concentration is insufficient evidence to conclude whether or not there are market power concerns. In order to examine the concerns of market power, anti-trust authorities typically evaluate other available evidence, such as market share and ease of entry, in combination with the degree of market concentration.
First, market shares traditionally have a significant role in assessing the concerns of market power. According to the EC guidelines, dominant market positions are assumed by market shares of more than 50%. Market shares of less than 25% are presumed not to impede market competition. In practice, the EC normally considers that market power concerns arise when a firm occupies more than 40% of a market [22]. When both emissions are included, the share of allowances that the largest corporate holds would be around 38% in the South Korean ETS. By contrast, when considering only direct emissions, the estimated share of allowances would amount to around 46%. Hence, the inclusion of indirect emissions substantially lessens market power concerns.
Second, the ease or likelihood of entry is, in general, another important factor in the assessment of market power because the threat by potential entrants impedes the exercise of market power. However, voluntary entry into an emissions trading market is not likely to occur because the ETS essentially regulates emissions of companies. In particular, the South Korean ETS strictly constrains the market participation of financial firms or agencies in order to avoid potential disturbance of the market from speculators. The relatively high entry barrier to the South Korean ETS strengthens the concerns of market power.
In summary, covering only direct emissions may create substantial concerns of market power in the South Korean ETS when considering not only market concentration but also market shares and entry barriers. Although the inclusion of indirect emissions does not eliminate these concerns completely, it can at least reduce the concerns significantly.

4. Discussion

The previous section concludes, using the HHI, that market concentration in the Korean ETS is lessened by including indirect emissions. However, this result may seem inconclusive to cautious readers because it is derived based on only a single concentration measure, although the chosen measure is the most widely used one. Hence, it is natural to ask whether the result is indeed robust to the choice of measures. To address this question, three other concentration measures are considered. In all measures below, s i denotes the initial share of allocation to firm i.

4.1. Hall-Tideman Index

Hall and Tideman (1967) [23] provide several desirable properties for concentration measures and they find that the HHI satisfies those properties. In addition, they claim that the number of firms in an industry needs to be included in a concentration measure, since it indicates to some degree the entry conditions of the industry. Their index, the Hall-Tideman Index (HTI), takes the form
H T I = 1 2 k = 1 n k s k 1
where each firm’s market share is weighted by its ranking to guarantee that the absolute number of firms is highlighted and that the biggest firm has the weight k = 1. The HTI, like the HHI, equals 1/n for an industry in which there are n equally sized firms. It lies in the interval (0, 1]. It becomes unity in the case of a monopoly while it goes close to 0 as the number of equally sized firms increases.

4.2. Comprehensive Industrial Concentration Index

The comprehensive industrial concentration index (CCI) is motivated by the observation that changes in market structure occurring among small firms are overlooked in earlier indexes. To remedy this shortcoming and to capture both absolute magnitude and relative dispersion, [24] introduces the CCI. It is defined as
C C I = s 1 + k = 2 n s k 2 ( 2 s k )
The index adds the largest firm’s share and the sum of the squared shares of the rest multiplied by (2 − sk). Here, the multiplier mirrors the shares of the remaining small firms. Hence, the CCI is more responsive to the changes in the smaller shares than the HHI [24]. The literature on equilibrium subset cartels provides a theoretical justification for the different treatment of two groups of firms, that is, the emphasis of the largest firm at the expense of the others [16].

4.3. Entropy Measure

The entropy measure, initially devised by [25], has its theoretical foundations in the theory of information. It gauges the amount of information that is missing before reception. White (1982) [26] adopts the entropy measure in the context of market concentration. When there are n firms and their market share is given as (s1, s2, …, sn), entropy E is defined as
C E = k = 1 n s k log 2 s k
The index’s range is [0, log2 n]. The level of the entropy is in inverse proportion to the degree of concentration, unlike the other two measures presented in Section 4.1 and Section 4.2. The value goes to its maximum if all firms’ market shares are the same, and so market concentration is at its lowest level. The value reaches zero when the market of interest is a monopoly.

4.4. Analysis

In contrast to the HHI, there is no official guideline for the HTI, CCI and entropy measure that authorities use to judge competitive concerns. One natural alternative is to observe how much the value of each index changes as indirect emissions are included. If the change in the value of a chosen index is large enough, this can be strong evidence that market power is mitigated substantially.
The values of each index and its changes by including indirect emissions are shown in Table 3. It shows that market concentration is mitigated by 20%–47%, according to the index. The HHI, HTI, and CCI decrease by 27.1%, 45.7%, and 20.2%, respectively, and the entropy index rises by 21.5%. The superiority of each measure is not a subject of this study, but one can safely state that the market becomes less concentrated by at least 20%. This implies that the conclusion based on the HHI remains valid when using other measures. Therefore, it can be concluded that the result that market concentration is mitigated is robust to the selection of market concentration measures.

5. Conclusions

Some ETSs cover both direct and indirect emissions while others cover only direct emissions. The main argument favoring the inclusion of indirect emissions is that it can be a second-best option when the retail prices of electricity cannot properly adjust to reflect the cost of carbon due to the government’s intervention in the power industry. This study presents an additional argument in support of the inclusion of indirect emissions: it can help to mitigate market power concerns. The HHI, the major concentration measure, in the South Korean ETS substantially decreases in the case of covering both direct and indirect emissions. A similar level of the moderation of market concentration is also observed using different concentration measures. Such an effect of including indirect emissions carries over into other ETSs that do not have as many players as the EU-ETS or the California ETS, and thus is exposed to the risk of market power.
The findings in this study have important policy implications because one of the main concerns of policymakers is that some firms may well enjoy market power owing to their share of emissions. In economies with regulated electricity prices, covering indirect emissions may not only open another channel for cost pass-through but may also lower market power concerns. Given that many national and regional governments are currently considering launching ETSs to cut greenhouse gas emissions, this finding is worth considering in the initial stage of the ETS design.
However, it should not be ignored that including indirect emissions will incur costs due to double counting. Since this paper mainly focuses on its positive effect of mitigating market power, the costs associated with double counting are beyond the scope of this paper. To conclude whether it is desirable to include indirect emissions, more research is needed to reach a fuller understanding involving all benefits and costs.

Acknowledgments

The authors would like to thank two anonymous referees as well as participants of the 2015 summer Conference of the Korean Society of Climate Change Research and the 2015 Conference of the Korean Resource Economics Association for their helpful comments and suggestions.

Author Contributions

Jiwoong Lee gave the idea and conceived the framework; Sunghee Shim analyzed the data; and Jiwoong Lee and Sunghee Shim wrote the paper.

Conflicts of Interest

The authors declare no conflict of interest.

Abbreviations

The following abbreviations are used in this manuscript:
ETSEmissions trading scheme
EU-ETSEU Emissions Trading System
BAUBusiness-as-usual
HHIHerfindahl-Hirschman index
NAPNational allocation plan
TMSTarget management system
KEPCOKorea electric power corporation
HTIHall-Tideman index
CCIComprehensive industrial concentration index

References

  1. Duan, M.; Pang, T.; Zhang, X. Review of carbon emissions trading pilots in China. Energy Environ. 2014, 25, 527–550. [Google Scholar]
  2. Zhang, D.; Karplus, V.J.; Cassisa, C.; Zhang, X. Emissions trading in China: Progress and prospects. Energy Policy 2014, 75, 9–16. [Google Scholar] [CrossRef]
  3. Chatterton, R. Indirect Emissions in ETS: More Harm than Good? Available online: http://about.bnef.com (accessed on 15 June 2016).
  4. Kim, Y.-G.; Lim, J.-S. An emissions trading scheme design for power industries facing price regulation. Energy Policy 2014, 75, 84–90. [Google Scholar] [CrossRef]
  5. Electric Rates Table of KEPCO. Available online: https://home.kepco.co.kr/kepco/EN/F/htmlView/ENFBHP00101.do?menuCd=EN060201 (accessed on 15 June 2016).
  6. Tietenberg, T. Emissions Trading: Principles and Practice, 2nd ed.; RFF Press: Washington, DC, USA, 2006. [Google Scholar]
  7. Hahn, R.W.; Stavins, R.N. The effect of allowance allocations on cap- and-trade system performance. J. Law Econ. 2011, 54, S267–S294. [Google Scholar] [CrossRef]
  8. Liski, M.; Montero, J.-P. Market power in an exhaustible resource market: The case of storable pollution permits. Econ. J. 2010, 121, 116–144. [Google Scholar] [CrossRef]
  9. Hahn, R.W. Market power and transferable property rights. Q. J. Econ. 1984, 99, 753–765. [Google Scholar] [CrossRef]
  10. Salop, S.C.; Scheffman, D.T. Raising Rivals’ Costs. Am. Econ. Rev. 1983, 73, 267–271. [Google Scholar]
  11. Salop, S.C.; Scheffman, D.T. Cost-raising strategies. J. Ind. Econ. 1987, 36, 19–34. [Google Scholar] [CrossRef]
  12. Cramton, P.; Kerr, S. Tradeable carbon permit auctions: How and why to auction not grandfather. Energy Policy 2002, 30, 333–345. [Google Scholar] [CrossRef]
  13. Convery, F.J.; Redmond, L. Market and price developments in the European Union emissions trading scheme. Rev. Environ. Econ. Policy 2007, 1, 88–111. [Google Scholar] [CrossRef]
  14. Ellerman, A.; Convery, F.; de Perthuis, C. Pricing Carbon: The European Union Emissions Trading Scheme; Cambridge University Press: Cambridge, UK, 2010. [Google Scholar]
  15. Viscusi, W.; Vernon, J.; Harrington, J. Economics of Regulation and Antitrust, 4th ed.; MIT Press: Cambridge, MA, USA, 2005. [Google Scholar]
  16. Bikker, J.; Haaf, K. Measures of Competition and Concentration in the Banking Industry: A Review of the Literature; Research Series Supervision 27; Netherlands Central Bank: Amsterdam, The Netherlands, 2000; Available online: http://www.dnb.nl/en/binaries/ot027_tcm47-146045.pdf (accessed on 15 June 2016).
  17. US Department of Justice and the Federal Trade Commission. Horizontal Merger Guidelines; US Department of Justice and the Federal Trade Commission: Washington, DC, USA, 2010. Available online: https://www.ftc.gov/sites/default/files/attachments/merger-review/100819hmg.pdf (accessed on 15 June 2016).
  18. European Commission. Guidelines on the Assessment of Horizontal Mergers under the Council Regulation on the Control of Concentrations between Undertakings; European Commission: Brussels, Belgium, 2004. [Google Scholar]
  19. Korean Ministry of Environment. National Allocation Plan; Korean Ministry of Environment: Sejong, Korea, 2014. (In Korean)
  20. Chatterton, R.; Sjardin, M.; Rietz, A.D.; Yoon, J.H.; Yoo, J.; Chun, H.R. South Korea’s Emissions Trading Scheme. Available online: http://about.bnef.com (accessed on 15 June 2016).
  21. Park, H.; Hong, W.K. Korea’s emission trading scheme and policy design issues to achieve market-efficiency and abatement targets. Energy Policy 2014, 75, 73–83. [Google Scholar] [CrossRef]
  22. UK Office of Telecommunications. Oftels Market Review Guidelines: Criteria for the Assessment of Significant Market Power; UK Office of Telecommunications: London, UK, 2002. [Google Scholar]
  23. Hall, M.; Tideman, N. Measures of concentration. J. Am. Stat. Assoc. 1967, 62, 162–168. [Google Scholar] [CrossRef]
  24. Horvath, J. Suggestion for a comprehensive measure of concentration. South. Econ. J. 1970, 36, 446–452. [Google Scholar] [CrossRef]
  25. Shannon, C.E. A mathematical theory of communication. Bell Syst. Tech. J. 1948, 27, 379–423, 623–656. [Google Scholar] [CrossRef]
  26. White, A.P. A note on market structure measures and the characteristics of markets that they “measure”. South. Econ. J. 1982, 49, 542–549. [Google Scholar] [CrossRef]
Figure 1. Change in the HHI when indirect emissions are included.
Sustainability 08 00583 g001
Table 1. Sector-wise allowance allocation for 2015–2017 in the Korean ETS (Emissions Trading Scheme). (Unit: ktCO2e).
Year201520162017Total
Total573,460562,183550,9061,686,549
Reserves 88,822
Power and Heat250,190245,284240,379735,853
Mining245241236722
Food and Beverages2535248524357455
Textiles and Clothes47014609451713,828
Wood3843773691130
Pulp, Paper and Paperboard76307481733122,443
Refined Petroleum19,15318,77818,40256,334
Chemicals and Petrochemicals48,85747,89946,941143,698
Glass and Glass Products62646141601818,423
Cement43,51942,66541,812127,996
Iron and steel103,960101,92199,883305,764
Non-ferrous metals68886753661820,260
Machinery1416138813614165
Semi-conductors10,45510,25010,04530,749
Displays91448964878526,893
Electronics2877282127658463
Motor Vehicles42434160407612,479
Shipbuilding2683263125787892
Water supply7667517362254
Waste89208745857026,234
Buildings71066967682820,901
Aviation1290126412393793
Source: Korean Ministry of Environment [19].
Table 2. Estimated emissions and shares of major emitters in the Korean ETS. (Unit: MtCO2e).
Direct EmissionsDirect and Indirect Emissions
KEPCO and its subsidiaries618.3 (45.9%)621.3 (38.9%) 1
Firm B218.4 (16.2%)229.2 (14.3%)
Firm C33.4 (2.5%)35.4 (2.2%)
Firm D29.5 (2.2%)41.6 (2.6%)
Firm E22.4 (1.7%)23.5 (1.5%)
Firm F21.5 (1.6%)21.5 (1.4%)
Sum of the other firms403 (29.9%)625.3 (39.1%)
Total sum of shares1346.4 (100%)1597.7 (100%) 2
1 KEPCO and its subsidiaries’ indirect emissions come from power station internal consumption; 2 It excludes the reserve from the total amount of allowances.
Table 3. Changes in market concentration.
HHIHTICCIEntropy 1
Direct Emissions24050.03410.49373.8778
Direct + Indirect Emissions17530.01850.39404.7109
Changes in Index (%)−27.1−45.7−20.221.5
1 The less concentrated the market is, the higher the entropy is.

