Article

Assessing Urban Forest Structure, Ecosystem Services, and Economic Benefits on Vacant Land

Landscape Architecture Program, Arizona State University, PO Box 871605, Tempe, AZ 85287-1605, USA
Sustainability 2016, 8(7), 679; https://0-doi-org.brum.beds.ac.uk/10.3390/su8070679
Submission received: 5 March 2016 / Revised: 8 July 2016 / Accepted: 13 July 2016 / Published: 16 July 2016
(This article belongs to the Special Issue Decision Support for Forest Ecosystem Management Sustainability)

Abstract

:
An urban forest assessment is essential for developing a baseline from which to measure changes and trends. The most precise way to assess urban forests is to measure and record every tree on a site, but although this may work well for relatively small populations (e.g., street trees, small parks), it is prohibitively expensive for large tree populations. Thus, random sampling offers a cost-effective way to assess urban forest structure and the associated ecosystem services for large-scale assessments. The methodology applied to assess ecosystem services in this study can also be used to assess the ecosystem services provided by vacant land in other urban contexts and improve urban forest policies, planning, and the management of vacant land. The study’s findings support the inclusion of trees on vacant land and contribute to a new vision of vacant land as a valuable ecological resource by demonstrating how green infrastructure can be used to enhance ecosystem health and promote a better quality of life for city residents.

1. Introduction

All the trees that are located in urban areas are part of an urban forest. This forest includes urban park systems, natural areas, and street trees, as well as the trees around residences. Any vegetation growing on vacant land is part of this urban forest, including trees, shrubs, and ground cover. Assessments of an urban forest can be performed to estimate the environmental benefits and ecosystem services provided, thus improving our understanding of the role trees play in creating healthy, livable and sustainable cities.
Vacant urban land covers a significant amount of the urban landscape. According to a 2000 Brookings Institution study, vacant land comprised an average of 15% of the land area in 70 U.S. cities [1]. Vacant land can provide ecosystem services and benefits, acting as green infrastructure that can be used to enhance ecosystem health and promote a better quality of life for city residents [2]. It supports many different types of ecosystem services; the benefits obtained depend on the environmental conditions, uses, and management practices involved. No matter whether natural systems are established through ecological succession or intentional human intervention, ecosystem services are produced [3].
Different types of vacant land habitats, such as vacant lots, abandoned industrial areas, the edges of parking lots, and areas alongside rail roads, highways, and other right-of-way can support highly diverse plant and animal populations [4]. In Europe, many different sorts of vacant land have received attention, including refuse tips [5], railway sites [6], road verges [7], wasteland [8], and old town centers [9] among others. In North America, remnant natural habitats tend to be the focus of attention for urban ecologists, who regard them as more than uniquely urban plant communities [10]. The development of different types of ecosystem services and benefits will thus inevitably also vary depending on the environmental conditions of the land, any surrounding natural habitats, the current and historical uses of the lot, and the management practices utilized [11].
Vacant land is not normally thought of as green infrastructure, partly because the potential community benefits provided by these spaces are not widely recognized. There have been relatively few studies on the ecology of vacant land [11] and for the most part it is not managed for its environmental benefits. Most urban vacant land is viewed only from an economic perspective of highest and best use, so it tends to simply remain unmanaged until it is economically viable to develop it. However, vacant land does contribute ecosystem services and benefits and could potentially contribute more if managed appropriately [2]. One way of addressing this failure is to conduct a comprehensive assessment of urban forests to estimate the environmental benefits and ecosystem services they provide and thus improve our understanding of the role trees play in supporting urban sustainability by improving environmental quality and consequently the health of those who live and work in the area.
The extent to which land use can provide ecosystem services depends on the current urban forest structure (e.g., tree species, number, tree canopy cover, height, health, composition, tree size, location, health), which can provide useful information for estimating trees’ structural characteristics such as leaf biomass and total leaf area, and quantifying multiple ecosystem services and forest functions [12]. Urban forest assessments are essential in supporting urban forest management and planning to improve environmental quality and human health in cities [12]. Due to the limited resources available and an inability to demonstrate and quantify all urban forest structures, functions, and economic benefits through standard data analyses, at present few of these benefits and functions are quantifiable [13].
Different forest structures result in different ecosystem values and services among land uses [14]. However, land use planners often lack a comprehensive set of benchmarks for ecosystem productivity when setting planning goals or expectations. One possible expectation for ecosystem benefits from the management of vacant land is that it should meet or exceed the ecosystem benefits produced by other land uses—for example residential, commercial, and industrial land. The vegetative structure of commercial and industrial land is significantly altered by human activities and tends to be a mosaic of different land covers and forest patches of different sizes. Human interventions shaping commercial and industrial land include the deforestation of existing urban forest patches, the linearization of features, reductions in patch size, and the elimination of patches. The resulting increases in patch isolation and fragmentation mean that many wildlife habitats lose a great deal of the connectivity between urban patches. In forested regions, it might be reasonable to expect vacant land to at least produce similar or greater ecosystem benefits than other urban land uses on a per hectare basis. However, research is needed to determine the extent to which residential, commercial, industrial, and vacant land are actually comparable, both in terms of forest structure and ecosystem benefits. Before ecosystem benefits can be assessed, it is important to understand the forest structures of both vacant land and other urban land uses. Differences in ecosystem productivity will most likely be due to differences in forest structure, so determining these characteristics is a vital first step in providing the type of detailed evaluation needed for effective urban forest management and accurate estimates of the green infrastructure value of vacant sites.
Clearly, we need a way to assess vacant land forest structure and ecosystem services that will demonstrate precisely how vacant land functions as a part of our green infrastructure to provide ecosystem services. The goal here is to understand how the forest structure and ecosystem services associated with vacant land differ from those provided by other urban land uses in order to help determine how urban vacant land can function more effectively as part of a city’s green infrastructure. Vacant land may also offer alternative creative open spaces and landscape design opportunities, especially in an otherwise built-up city environment.
Managing an urban forest includes tree maintenance, policy development, and budgetary decisions—all of which depend on understanding the current urban forest conditions [15]. Urban forest assessments are also essential for developing a basis from which to measure changes and trends. This allows change to be detected using indicators of forest health or structure such as the number of plants, their location, species mix, and age distribution [15]. Cities across the United States have undertaken urban forest assessment using both on-the-ground measurements and remote sensing analyses [15]. An accurate quantification of urban forest can help to understand the multiple ecosystem function, services, and benefits it provides, especially its ecological and social benefits in supporting urban sustainability [
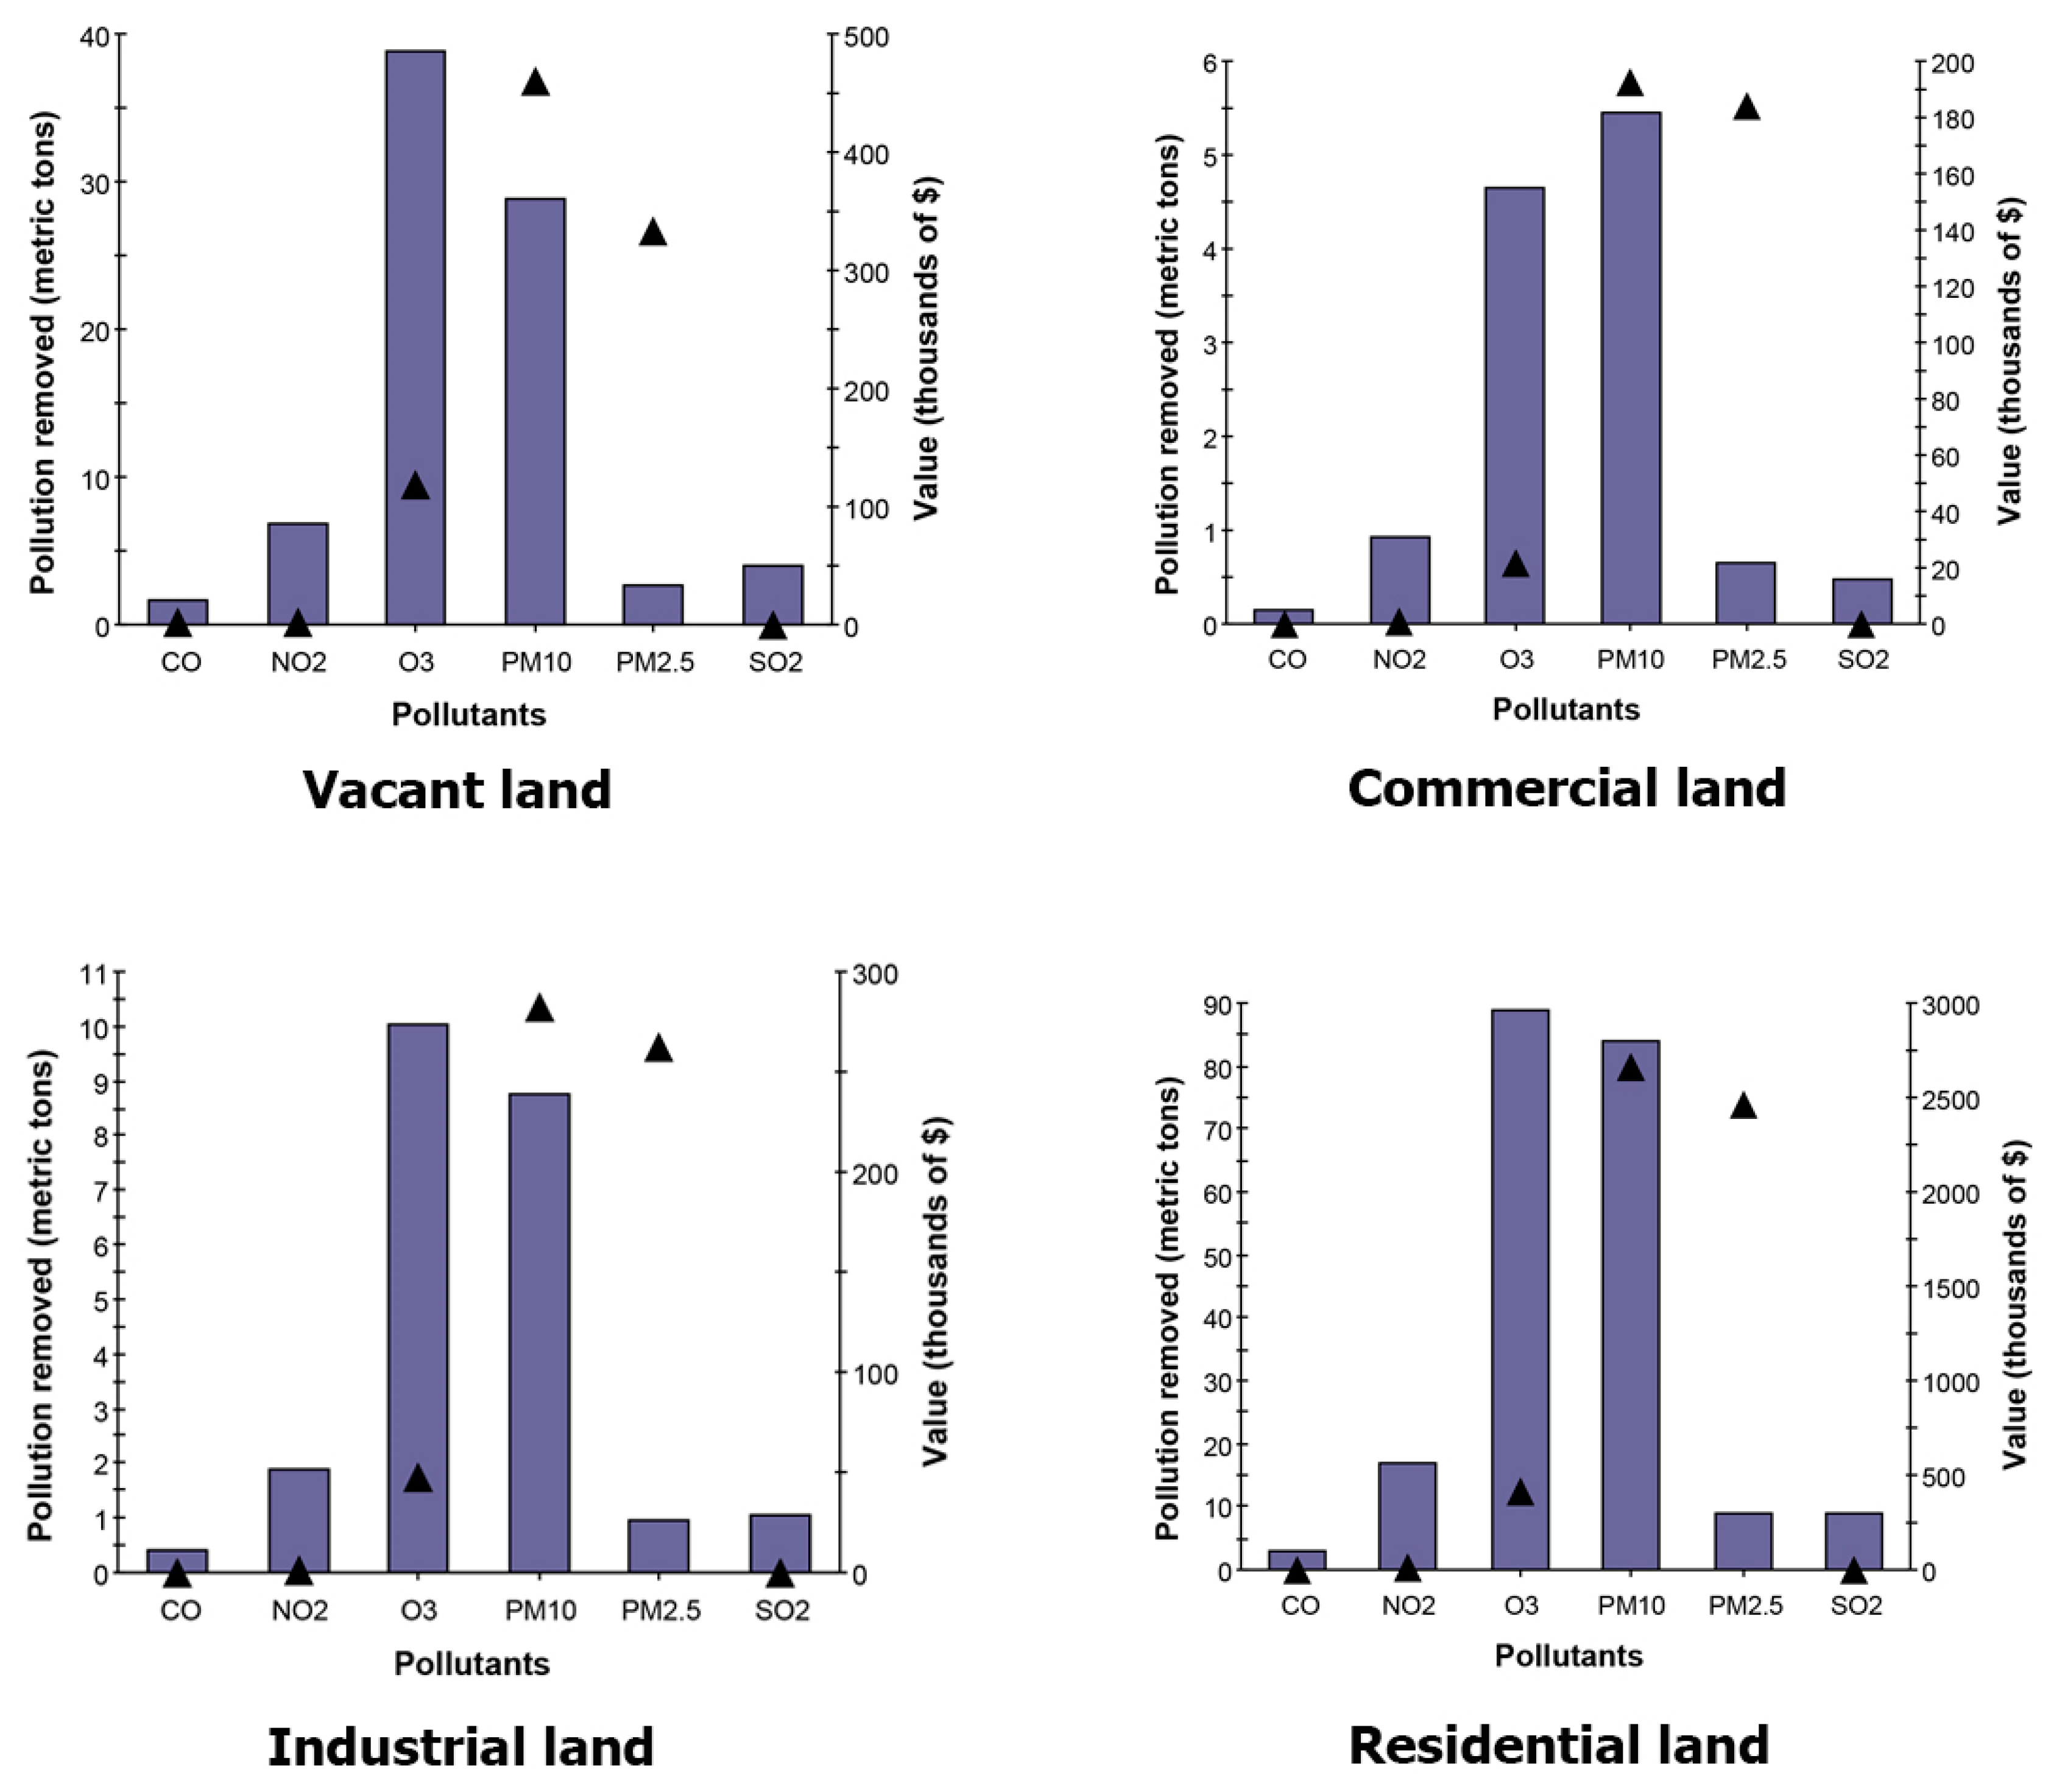
16]. Trees have been shown to provide services such as air pollution removal, carbon sequestration and storage, energy saving, rainfall interception, and ameliorating the urban heat island effect, as well as adding structural value and other socio-cultural benefits for city residents [17]. Given accurate information on the urban forest structure (i.e., tree species, number, tree canopy cover, height, health, composition, tree size, location, health) and how this structure affects the benefits gained, managers and planners can implement more effective urban forest management by engaging in better site selection, tree planting, maintenance, and removal to maximize these benefits in the future [16].
The most accurate approach to quantifying an urban forest structure is to conduct a field inventory that measures and records every tree on a site. Although such an inventory can work well for small tree populations (e.g., street trees and those in small parks), it is expensive for larger tree populations so random sampling is generally applied as a cost-effective way to assess urban forest structure, function, and value for large-scale assessments [12]. There are various sampling techniques to assess urban forests, but most use a form of random sampling (e.g., [18,19,20,21,22,23]). The U.S. Forest Service has developed a specialized tool to perform such evaluations, the i-Tree Eco model (formerly known as the Urban Forest Effects (UFORE) model) (www.itreetools.org). This model incorporates protocols to measure and monitor urban forest structure and estimate ecosystem functions and economic values [24]; the associated software utilizes standardized field data from randomly located plots (or tree inventories) and local hourly air pollution and meteorological data to quantify urban forest structure and its numerous effects [12]. The i-Tree Eco model has been used in hundreds of cities across the globe to assess urban forest structure and its numerous ecosystem services using a standardized field sampling method (e.g., [23,25,26]).
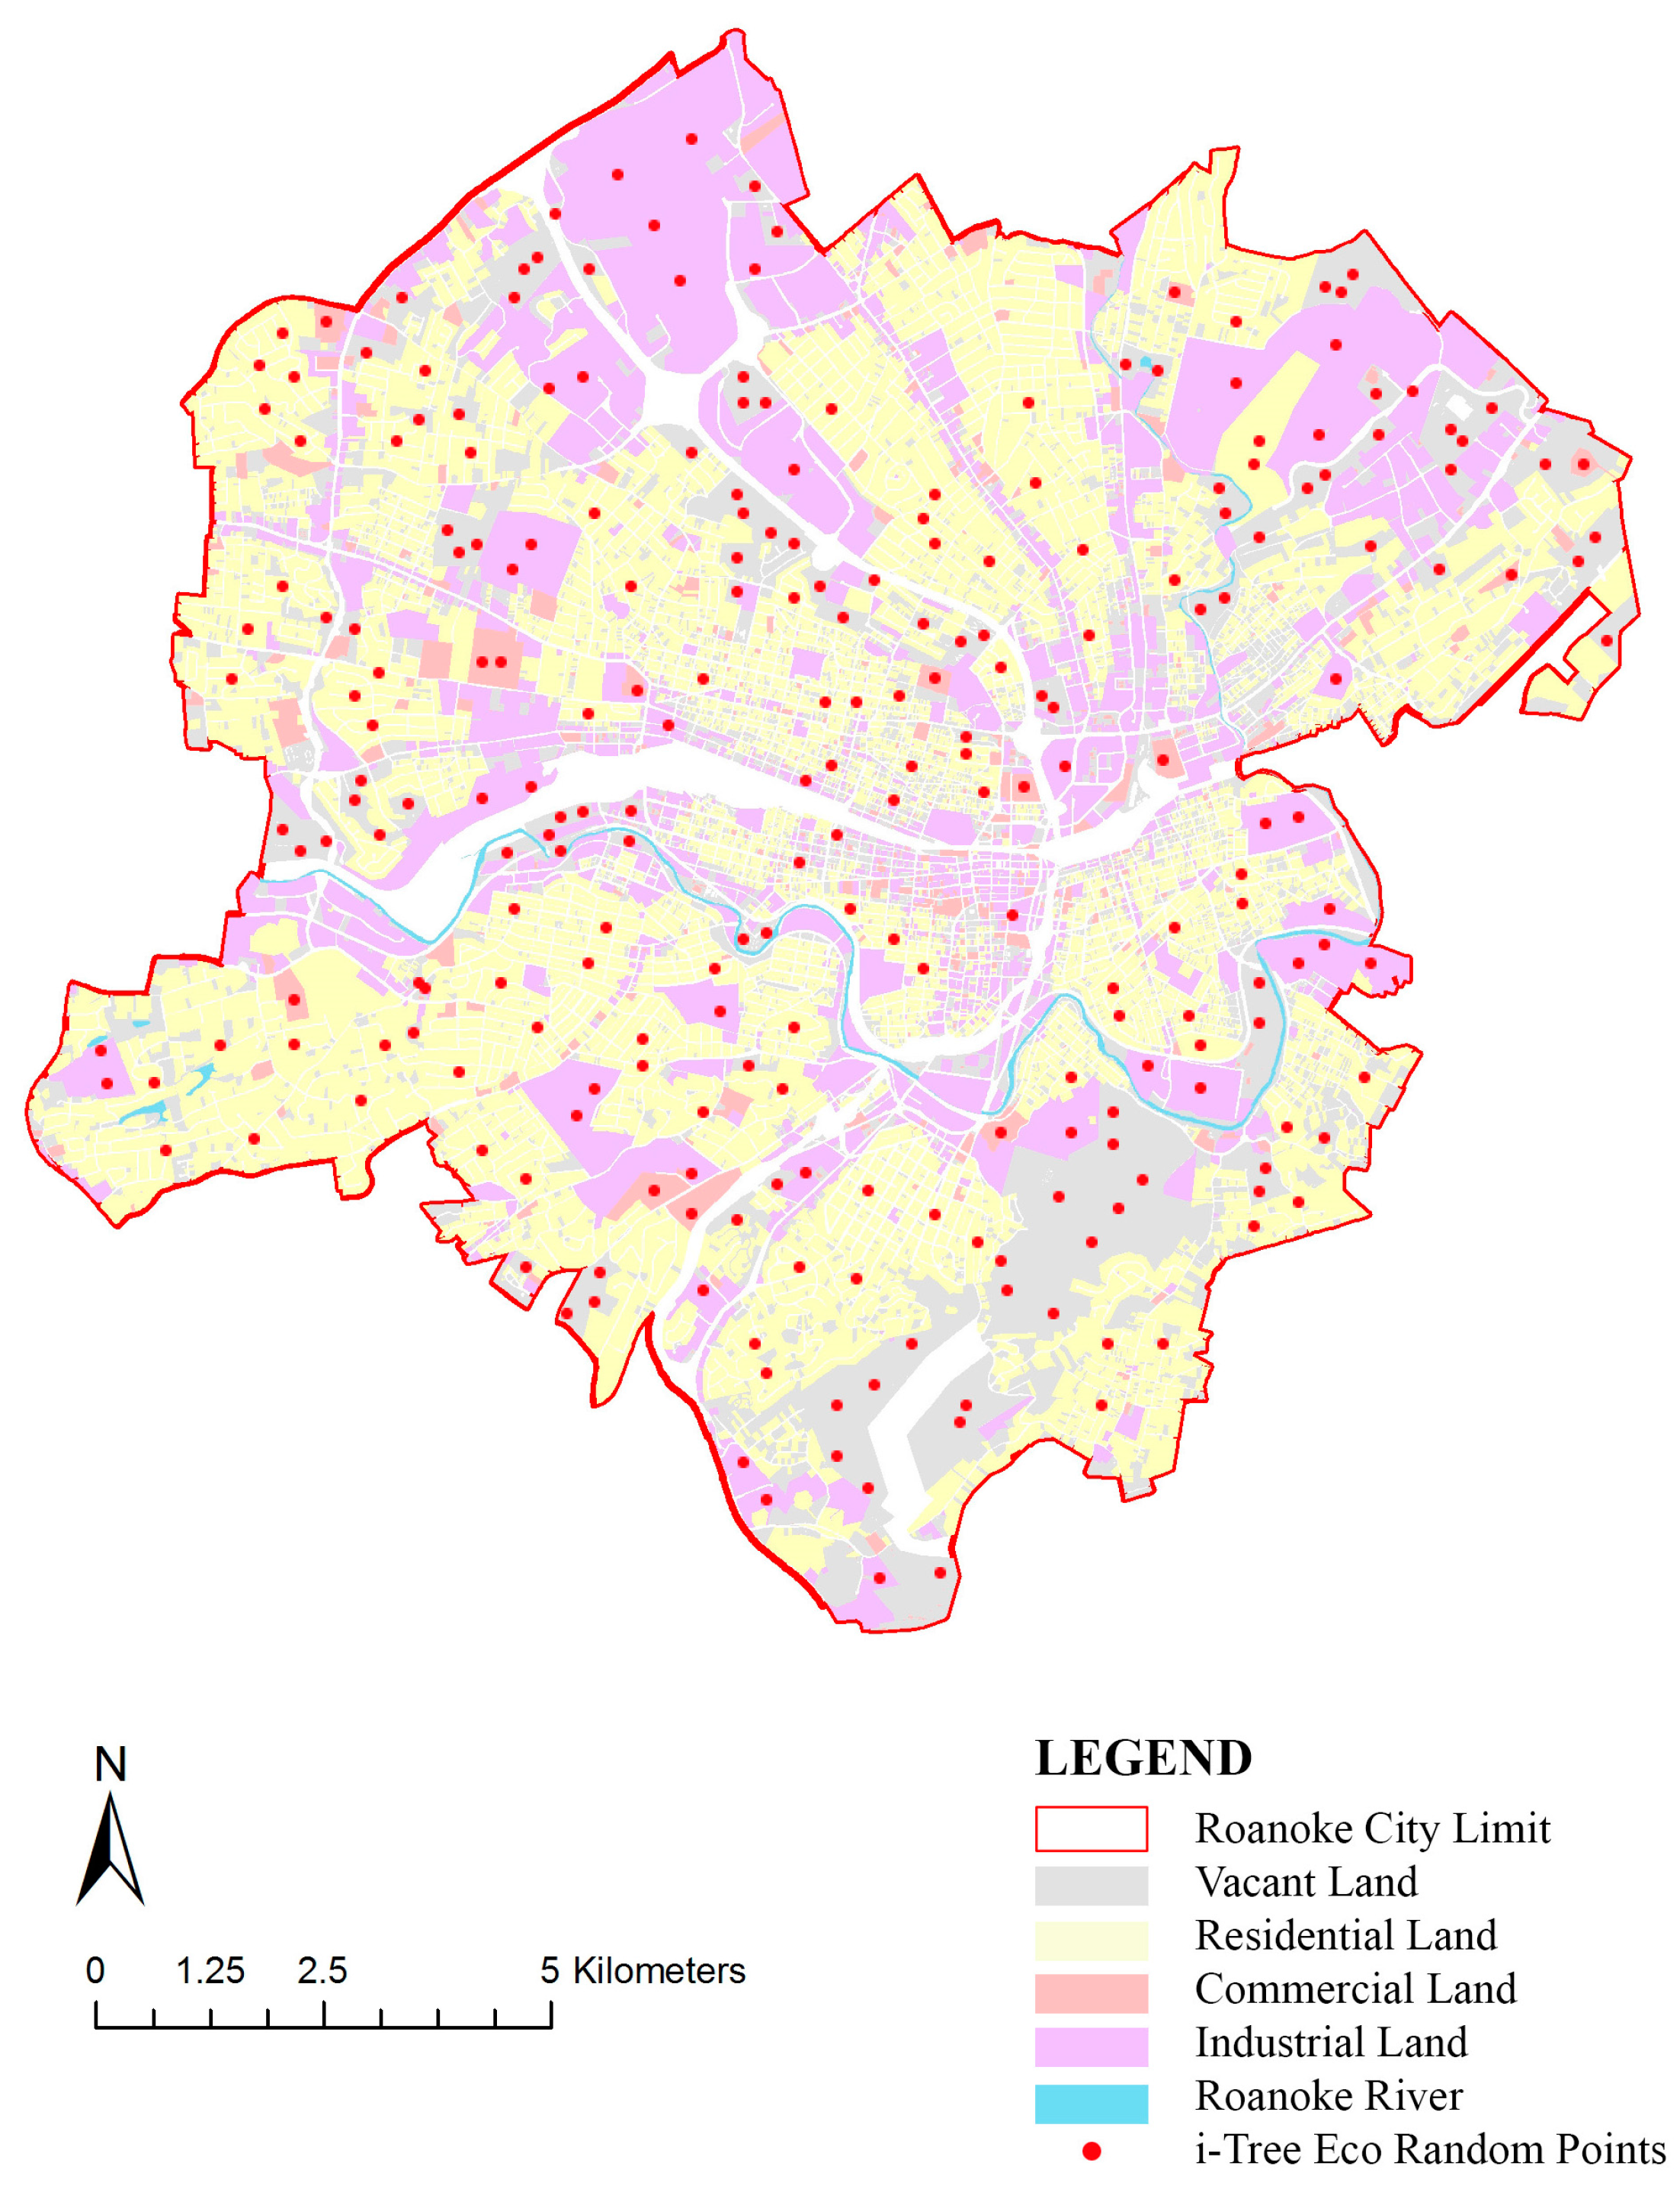
The purpose of this study is to compare the urban forest structure, ecosystem services, and economic values of vacant land to those of other land uses. The research conducted for this study utilized i-Tree Eco to assess vacant land forest structure and ecosystem services in the City of Roanoke, Virginia. Urban vacant land has a different forest structure from other land uses in terms of the number of trees, species composition, tree sizes, tree health, tree canopy cover, and ground cover types, so it is not surprising that the ecosystem services provided by these sites such as air pollution removal, carbon storage and sequestration, avoided runoff, and energy savings are also different, along with the significantly different structural value of their forests.

2. Methods

2.1. Study Area

The City of Roanoke was selected as the site for this study due to its large number and wide variety of urban vacant land sites. As a case study site, the city’s age and industrial heritage provide a useful opportunity to identify and explore a range of typologies of urban vacant land. Roanoke’s role as a railroad hub and center for other industrial activities in the first half of the 20th century increased its population from 21,495 in 1900, to 91,921 in 1950 [27]. However, due to economic and technological changes, many of the city’s traditional manufacturing operations and industries became obsolete and have closed in recent years, leaving many industrial corridors with underused or derelict properties. In many cases these blight local neighborhoods, posing a threat to residents and to the environment [27]. The city’s size and climate also made it suitable for this study; it is small enough to be studied in the time available, and its moderate climate is similar to that of many other American cities. The city has a population of 97,032 [28], and covers an area of 42.9 square miles. Its mild climate is subtropical and humid, with a monthly high temperature of 7.6 °C (45.6 °F) in January and 28.6 °C (83.4 °F) in June. It has a mean annual precipitation of 1047.7 mm (41.24 inches) [29]. The City of Roanoke is located in SW Virginia, at about 37°16′N and 79°56′W, in the valley and ridge region of the state.

2.2. A Field Inventory of Vacant Land

The i-Tree Eco model (www.itreetools.org) was used to assess urban forest structure, ecosystem services, and economic benefits on vacant land in this study. Vacant land ecosystem services were compared to other land uses, namely commercial, industrial, and residential, measured in a previous i-Tree sample for the entire city that was conducted during 2012 [30]. For randomly selected 0.04 ha field plots around the city, the percentage tree cover, shrub cover, plantable space, and ground cover types were measured. Trees on each plot were also measured for total height, diameter at breast height (dbh; 1.37 m from the base of the tree), crown width (measured in feet along the N-S and E-W axes), percentage of canopy missing and dieback, crown light exposure, and, for trees that were near buildings, their distance and direction from the trees. A total of 114 plots of vacant land were sampled across the city; plots on both public and private property were included. All field data were collected during the 2013 vegetation period (June–July) to properly assess the tree canopies. Field data were input to the i-Tree Eco model to assess forest structure and the associated ecosystem services and values [12].
To compare the ecosystem services provided by vacant, commercial, industrial, and residential land, an additional 137 0.04 ha plots were measured using a stratified random sample across three land use types: commercial (14 plots), industrial (40 plots), and residential (83 plots) during 2012 using the standard i-Tree Eco sampling protocols. Plots were assigned proportional to the tree canopy cover and land area within each stratum based on existing canopy data and land use zoning (Figure 1) [30].
Importance values (IV), calculated as the sum of relative leaf area and relative composition, are generally used to provide a measure of the relative dominance of species in a forest community. Importance values rank species within a site based upon three criteria: (1) how commonly a species occurs across the entire forest; (2) the total number of individuals of the species; and (3) the total amount of forest area occupied by the species [31]. To compare the composition of forest communities that differ in size or that were sampled at different intensities, importance values are calculated using relative rather than absolute values [31].
The calculated hourly tree-canopy resistance for ozone and a hybrid big-leaf and multi-layer canopy deposition model for sulfur and nitrogen were applied to estimate the air pollution removal value [32,33]; air pollutant removal rates (deposition velocities) for carbon monoxide and particulate matter are not directly related to transpiration [34,35]. Air pollution removal by trees was based on field data and 2011 pollution and weather data.

3. Results

3.1. Urban Forest Structure

The urban forest on Roanoke’s vacant land was estimated to have a population of 210,250 trees and a tree cover of 30.6%. The most common tree species growing in this area were Ulmus americana (American Elm) (16.4%), Ailanthus altissima (Tree of Heaven) (12.3%), and Acer negundo (Box elder) (6.7%) (Figure 2). The trees growing on the vacant land with diameters less than 15.2 cm constituted 40.8% of the tree population (Figure 3), which suggests that these are relatively young trees and thus likely to be helpful in sustaining the urban ecosystem in Roanoke for years to come. While they are small today, they have the potential to increase in size considerably over time, depending upon the species. The overall tree density on the vacant land was 63.4 trees per ha, the lowest of any of the land use types (Table 1).
About 69% of the trees growing on Roanoke’s vacant land are species that are native to North America, and 60% are native to the state (Figure 4). Exotic species from outside North America make up 31% of the population. Most of Roanoke’s vacant land exotic tree species are indigenous to Asia (20.2% of the species).
Roanoke’s vacant land contains about 210,263 trees, which is low relative to the number growing on residential land but higher than either commercial or industrial land (Table 1). However, there are 62 species of trees growing on the vacant land, which is high compared to commercial or industrial land; residential land was found to have 90, the highest number of tree species overall (Table 2).

3.2. Urban Forest Cover and Leaf Area on Vacant Land

Tree canopy covers about 30.6% of Roanoke’s vacant land area, which is the second highest value among the four land uses (Table 1). The three dominant tree species in terms of leaf area were American elm, black walnut, and sycamore spp. (Table 3).
An importance value (IV) over 10 for certain types of plant may make a patch of land over-reliant on a particular species for structural and functional benefits, depending on the local ecosystem. The functional benefits considered in this study included the air pollution removal value, carbon sequestration and storage, avoided runoff, energy saving, and structural value of trees on vacant land. Structural values are based on the valuation procedures developed by the Council of Tree and Landscape Appraisers, which uses tree species, diameter, condition, and location information (e.g., the cost of having to replace a tree with a similar tree) [25]. Roanoke’s vacant land has four species with an IV exceeding 10, the most important of which is the American elm with an IV of 42.6. The 10 most important species of trees growing on vacant land in the city are listed in Table 3.
Impervious surfaces such as roads, buildings and, to a lesser degree, maintained grass reduce water infiltration and increase runoff, affecting residential water quality. Along with vegetation ground cover, urban forests reduce the impact of impervious surfaces and storm water by intercepting rainfall, slowing water movement, and increasing infiltration in the ground. The two dominant ground cover types growing on the city’s vacant land are grass (39.5%) and wild grass (24.8%) (Table 4), both of which are permeable, making vacant land strategically important for controlling urban storm water. As the data presented in Figure 5 and Table 4 show, three impervious ground cover classes (buildings, cement, and rock) cover 15.1% of the city’s total area. If the ground space available for tree planting, about 59.2% of the vacant land area, were to be fully utilized, this would significantly increase Roanoke’s tree canopy cover and provide valuable additional ecosystem benefits.

3.3. Air Pollution Removal

Poor air quality is a major problem in most cities, negatively affecting human health, ecosystem health, and visibility. Although trees have been shown to influence ozone formation by emitting volatile organic compounds (VOCs) [36], urban trees, particularly low VOC emitting species, decrease urban ozone levels overall through tree functions such as removing air pollutants (dry deposition to plant surfaces), reducing air temperatures (transpiration), and altering building energy consumption (and hence power plant emissions) by providing shade and shelter from the wind [37,38]. As shown in Figure 6, in 2011 83 t of air pollutants (CO, NO2, O3, PM10, and SO2) were removed by trees growing on vacant land in Roanoke, with a value to the city of $916,000. Of these, ozone (O3) provided the greatest pollution removal value. Vacant land is thus an important component of Roanoke’s green infrastructure and is responsible for removing a significant fraction of the city’s air pollution, creating a markedly cleaner environment for residents.

3.4. Carbon Storage and Sequestration

Climate change is a major issue across the world. Trees not only remove carbon dioxide through photosynthesis in their tissue, which can help counteract climate change, but also alter energy consumption by reducing carbon dioxide emissions from the fossil-fuels burned by power plants [39]. Increasing tree size and the health of trees can thus support annual carbon sequestration. The trees growing on vacant land in Roanoke sequester an estimated 2091 t of gross carbon per year with an economic value of $163,000 (Table 5). Net carbon sequestration from vacant land in the city amounted to around 1959 tons annually, which is high value relative to other land uses (Table 5).
Either estimated or customized local carbon values can be used to estimate carbon storage and carbon sequestration values. A value of $78.5 per metric ton of carbon was used when estimating carbon sequestration and storage values for Roanoke in a recent EPA survey [40]. The carbon storage provided by the city’s vacant land is thus about 97,500 t, with an associated value of $7.6 million. This is relatively high compared to other land uses (Table 5).
Among the tree species growing on vacant land in the city, the American elm captures the most carbon (approximately 19% of the total carbon stored and 18.8% of all sequestered carbon) (Figure 7). The overall tree density on vacant land in the city is 63.4 trees per ha, which is the lowest relative to other land uses. Given that the gross sequestration of Roanoke’s vacant land trees is about 630.7 kg of carbon per ha annually, trees on the city’s vacant land are estimated to be accumulating 29,410 kg of carbon per ha, which is high relative to other land uses ().

3.5. Avoided Runoff

Surface runoff is a cause for concern in many urban areas as it can increase pollution in streams, wetlands, rivers, lakes, and oceans. When it rains, some portion of the precipitation is intercepted by vegetation (trees and shrubs), while the remainder reaches the ground. The portion of the precipitation that reaches the ground and does not infiltrate into the soil becomes surface runoff [41]. In urban areas, the extensive area covered by impervious surfaces increases the amount of surface runoff. In Roanoke, vacant land contains three impervious ground cover classes (buildings, cement, and rock), making up 15.1% of the total ground cover (Table 4), which is low relative to other land uses, and 30.6% of the tree canopy cover, which is high relative to other land uses (Table 1). The plantable space available on this vacant land is about 59.2%, which is high relative to other land uses and offers considerable potential for reducing surface runoff if planting on this otherwise unused land is increased.
This suggests that vacant land may be a valuable ecological resource that can be strategically utilized as part of the city’s green storm water infrastructure through urban forests, including trees, shrubs, and pervious ground cover classes; in addition to the forest’s role in intercepting precipitation, vegetation root systems promote infiltration and storage in the soil. The trees growing on Roanoke’s vacant land are thus already helping to reduce runoff by an estimated 120,000 cubic meters a year, with an associated value of $283,000, as shown in Table 6 and Figure 8, even though vacant land has fewer impervious ground cover classes than other land uses (Table 4). The environmental benefits provided by vacant land are seldom recognized, but the results of this study suggest that vacant land can be a valuable ecological resource that can absorb much of the surface runoff in urban areas.

3.6. Building Energy Use

Trees on vacant land can reduce energy consumption in nearby buildings via evaporative cooling as well as providing shade and blocking winter winds, although this does depend on the location and health of the trees. Estimates of tree effects on building energy consumption can be calculated by field-based assessments that measure tree distance and direction for residential buildings [42]. Based on state-wide energy costs for Virginia ($106.10 per MWh as of 2012), the trees growing on vacant land in Roanoke are reducing energy consumption for residential buildings by around $185,000 annually (Table 7 and Table 8); they are also reducing the amount of carbon released every year by fossil-fuel based power plants in the state by about 358 t, with an associated value of $28,103.

3.7. Structural and Functional Values

Roanoke’s vacant lands are structural assets with economic value, just like other infrastructure in the city. This value is based on the price of replacing existing trees with other similar types of trees. The trees also have functional ecosystem service values (both positive and negative) based on their size and health. The structural values applied here are based on the valuation procedures laid down by the Council of Tree and Landscape Appraisers [43], which uses tree species, condition, diameter, condition, and location information [25]; the number and size of healthy trees represent the structural and functional value of an urban forest [44]. At the time this study was conducted, the structural value of Roanoke’s vacant land trees was $169 million, with a carbon storage value of $7.6 million; the annual functional values of Roanoke’s vacant land trees were: carbon sequestration ($164,000); air pollutant removal ($916,000); and energy saving costs and carbon emissions reduction ($239,000).
The results of this comparison of the effects and values of urban forests by land use suggest that residential land use offers the greatest current and potential future ecosystem benefits on a per ha basis. However, the city totals for Roanoke’s carbon storage and carbon removal value due to the trees and other vegetation growing on vacant land are quite high relative to other land uses (Table 9). Urban vacant land has more large individual trees, with low density and high percent cover (Table 1), representing a greater above-ground biomass (carbon storage) than on other types of land (Table 9, Table 10 and Table 11).

4. Discussion

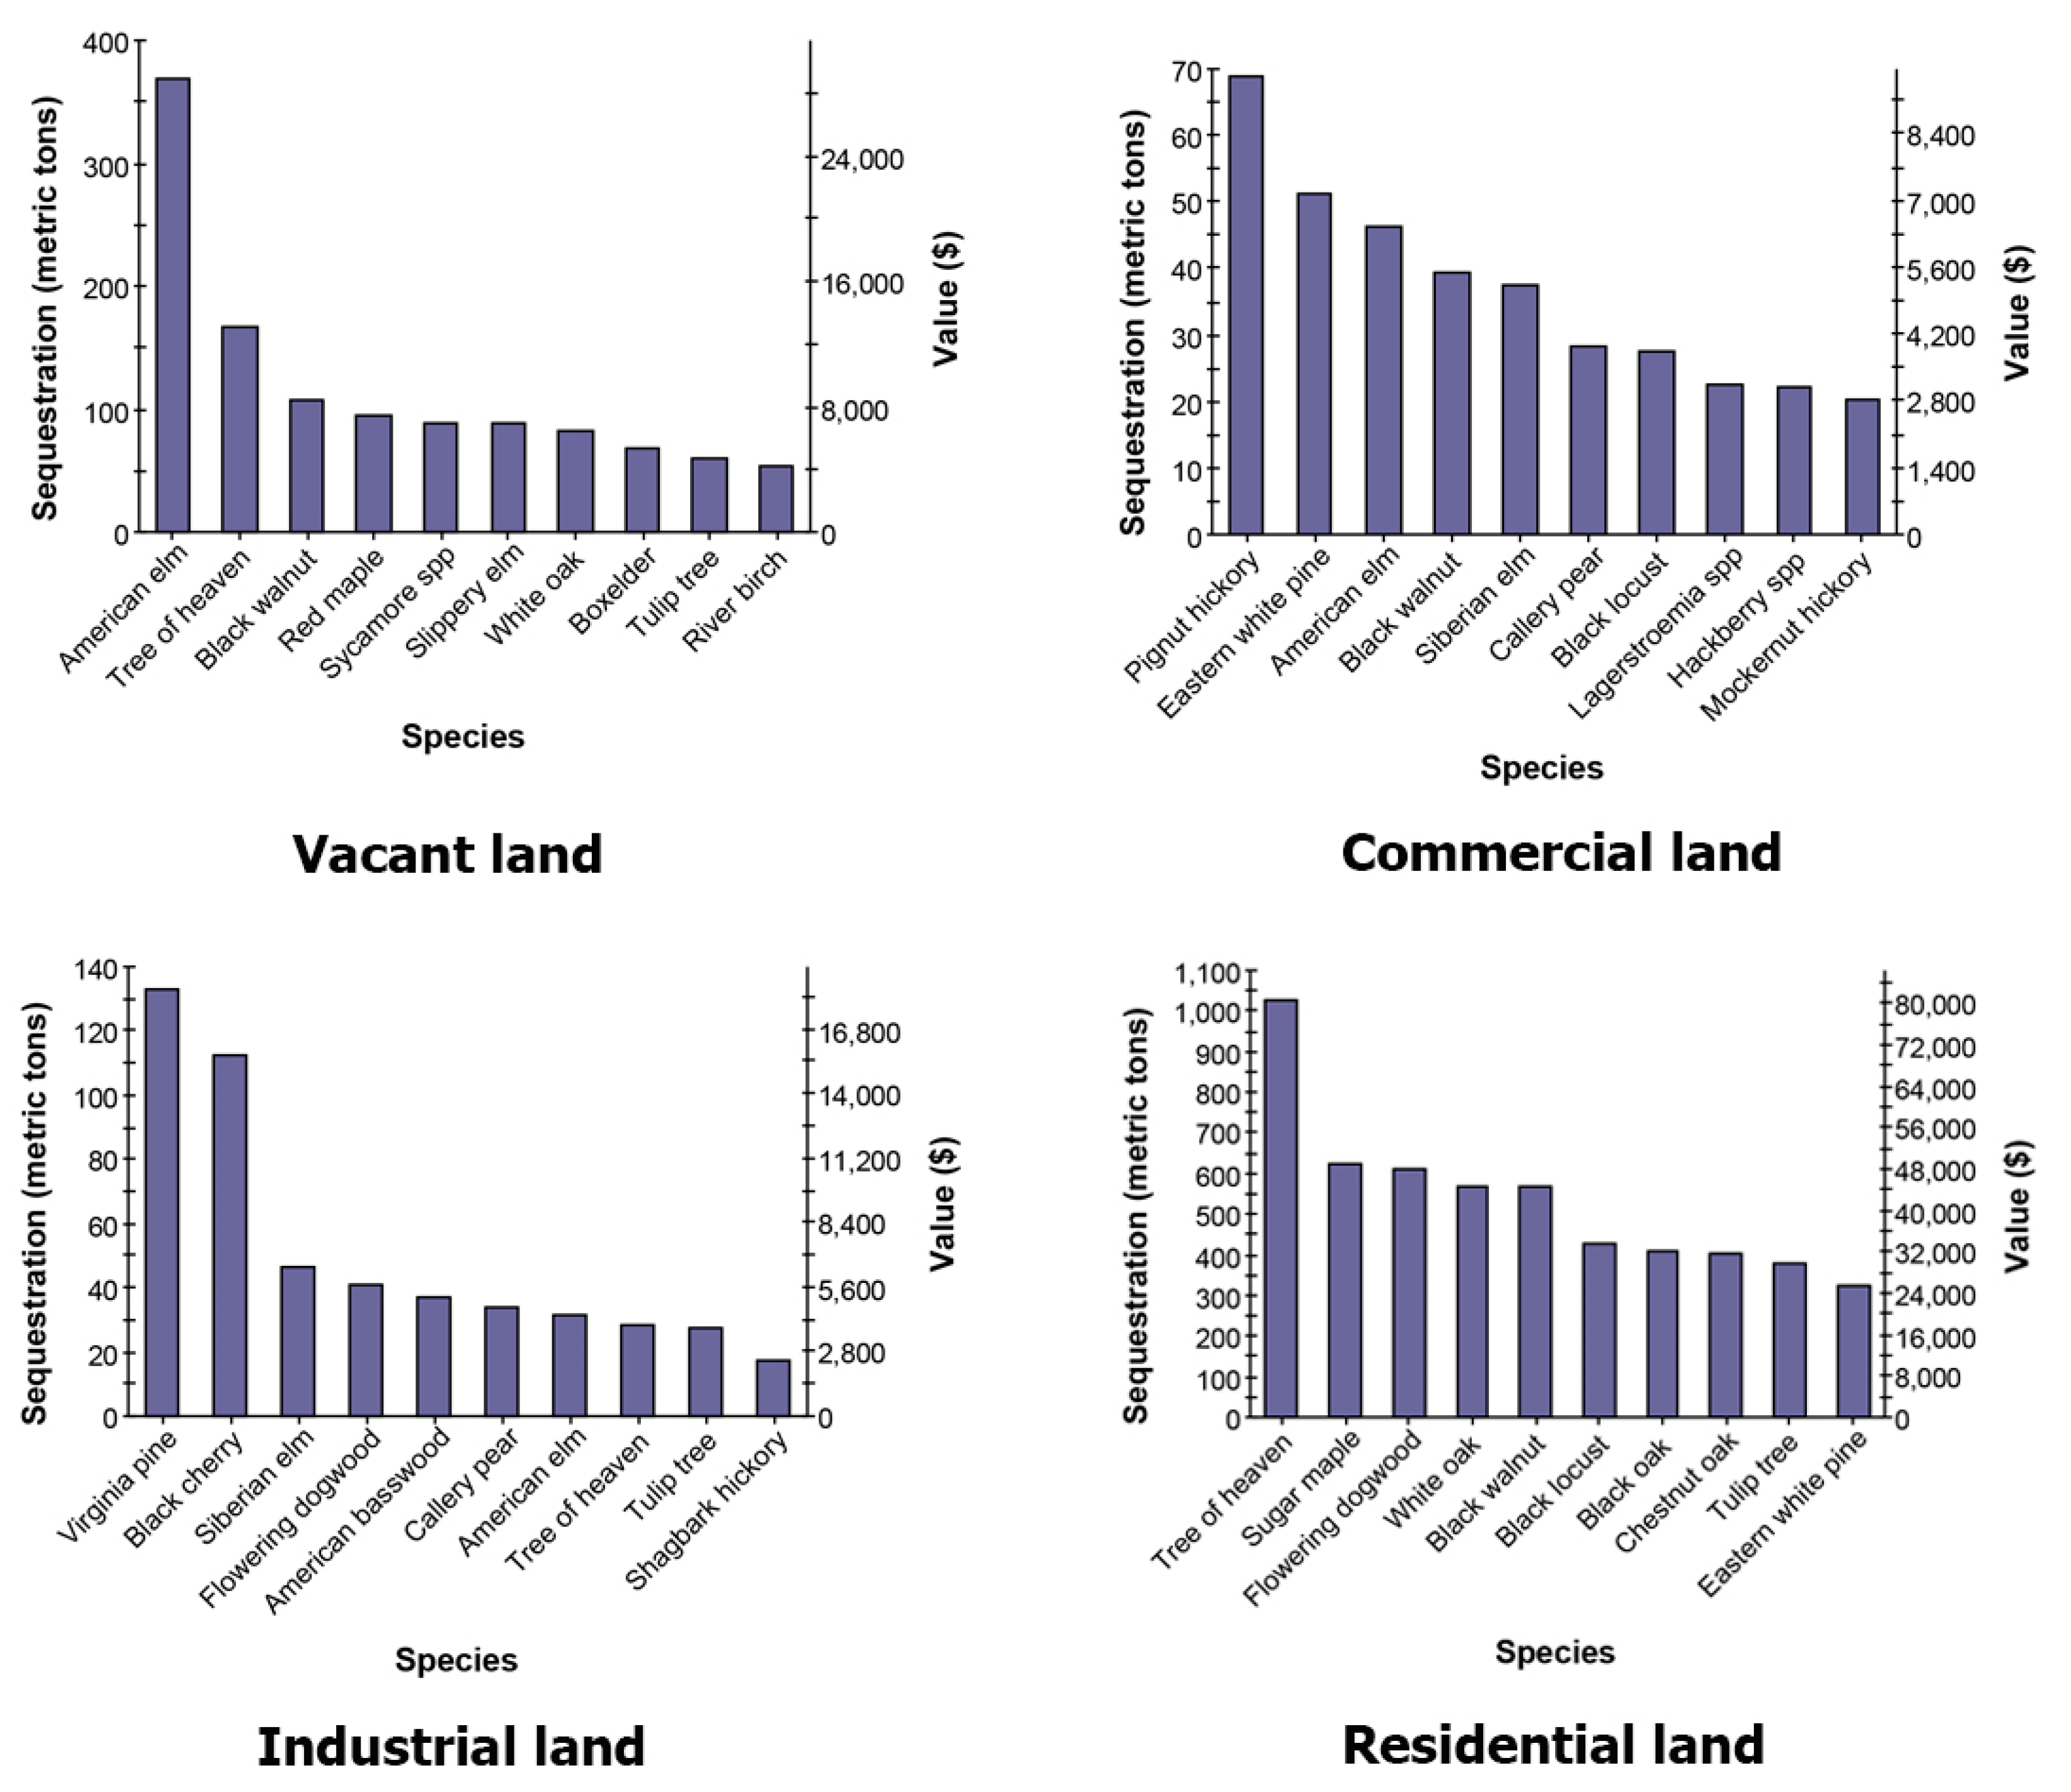
Large trees provide substantially greater ecosystem services, including air pollution removal, carbon sequestration and storage, energy saving, rainfall interception, a decreased urban heat island effect, and climate change adaptation structural value than smaller trees [45]. Although there are some large trees on vacant land, the far more numerous smaller trees on these sites can still collectively play an important role in providing ecosystem benefits. Urban forests are composed of a mix of native and exotic tree species, so often have higher species diversity than surrounding native landscapes [30]. High species diversity helps minimize ecosystem vulnerability to species-specific pests and disorders, but may also pose a risk to ecosystem health if the exotic species present are invasive plants that can potentially out-compete and displace native species [30]. Additional exotic species may also fail to provide the habitat needed to support native fauna. Biodiversity boosts ecosystem productivity, as each species, no matter how small, has an important role to play and greater species diversity supports natural sustainability, thus providing a healthy ecosystem that can better withstand and recover from a variety of natural hazards [46]. The highly diverse vegetation growing on Roanoke’s vacant land will contribute to healthy ecosystem services in the city, although in some instances this species richness may also cause habitat fragmentation.
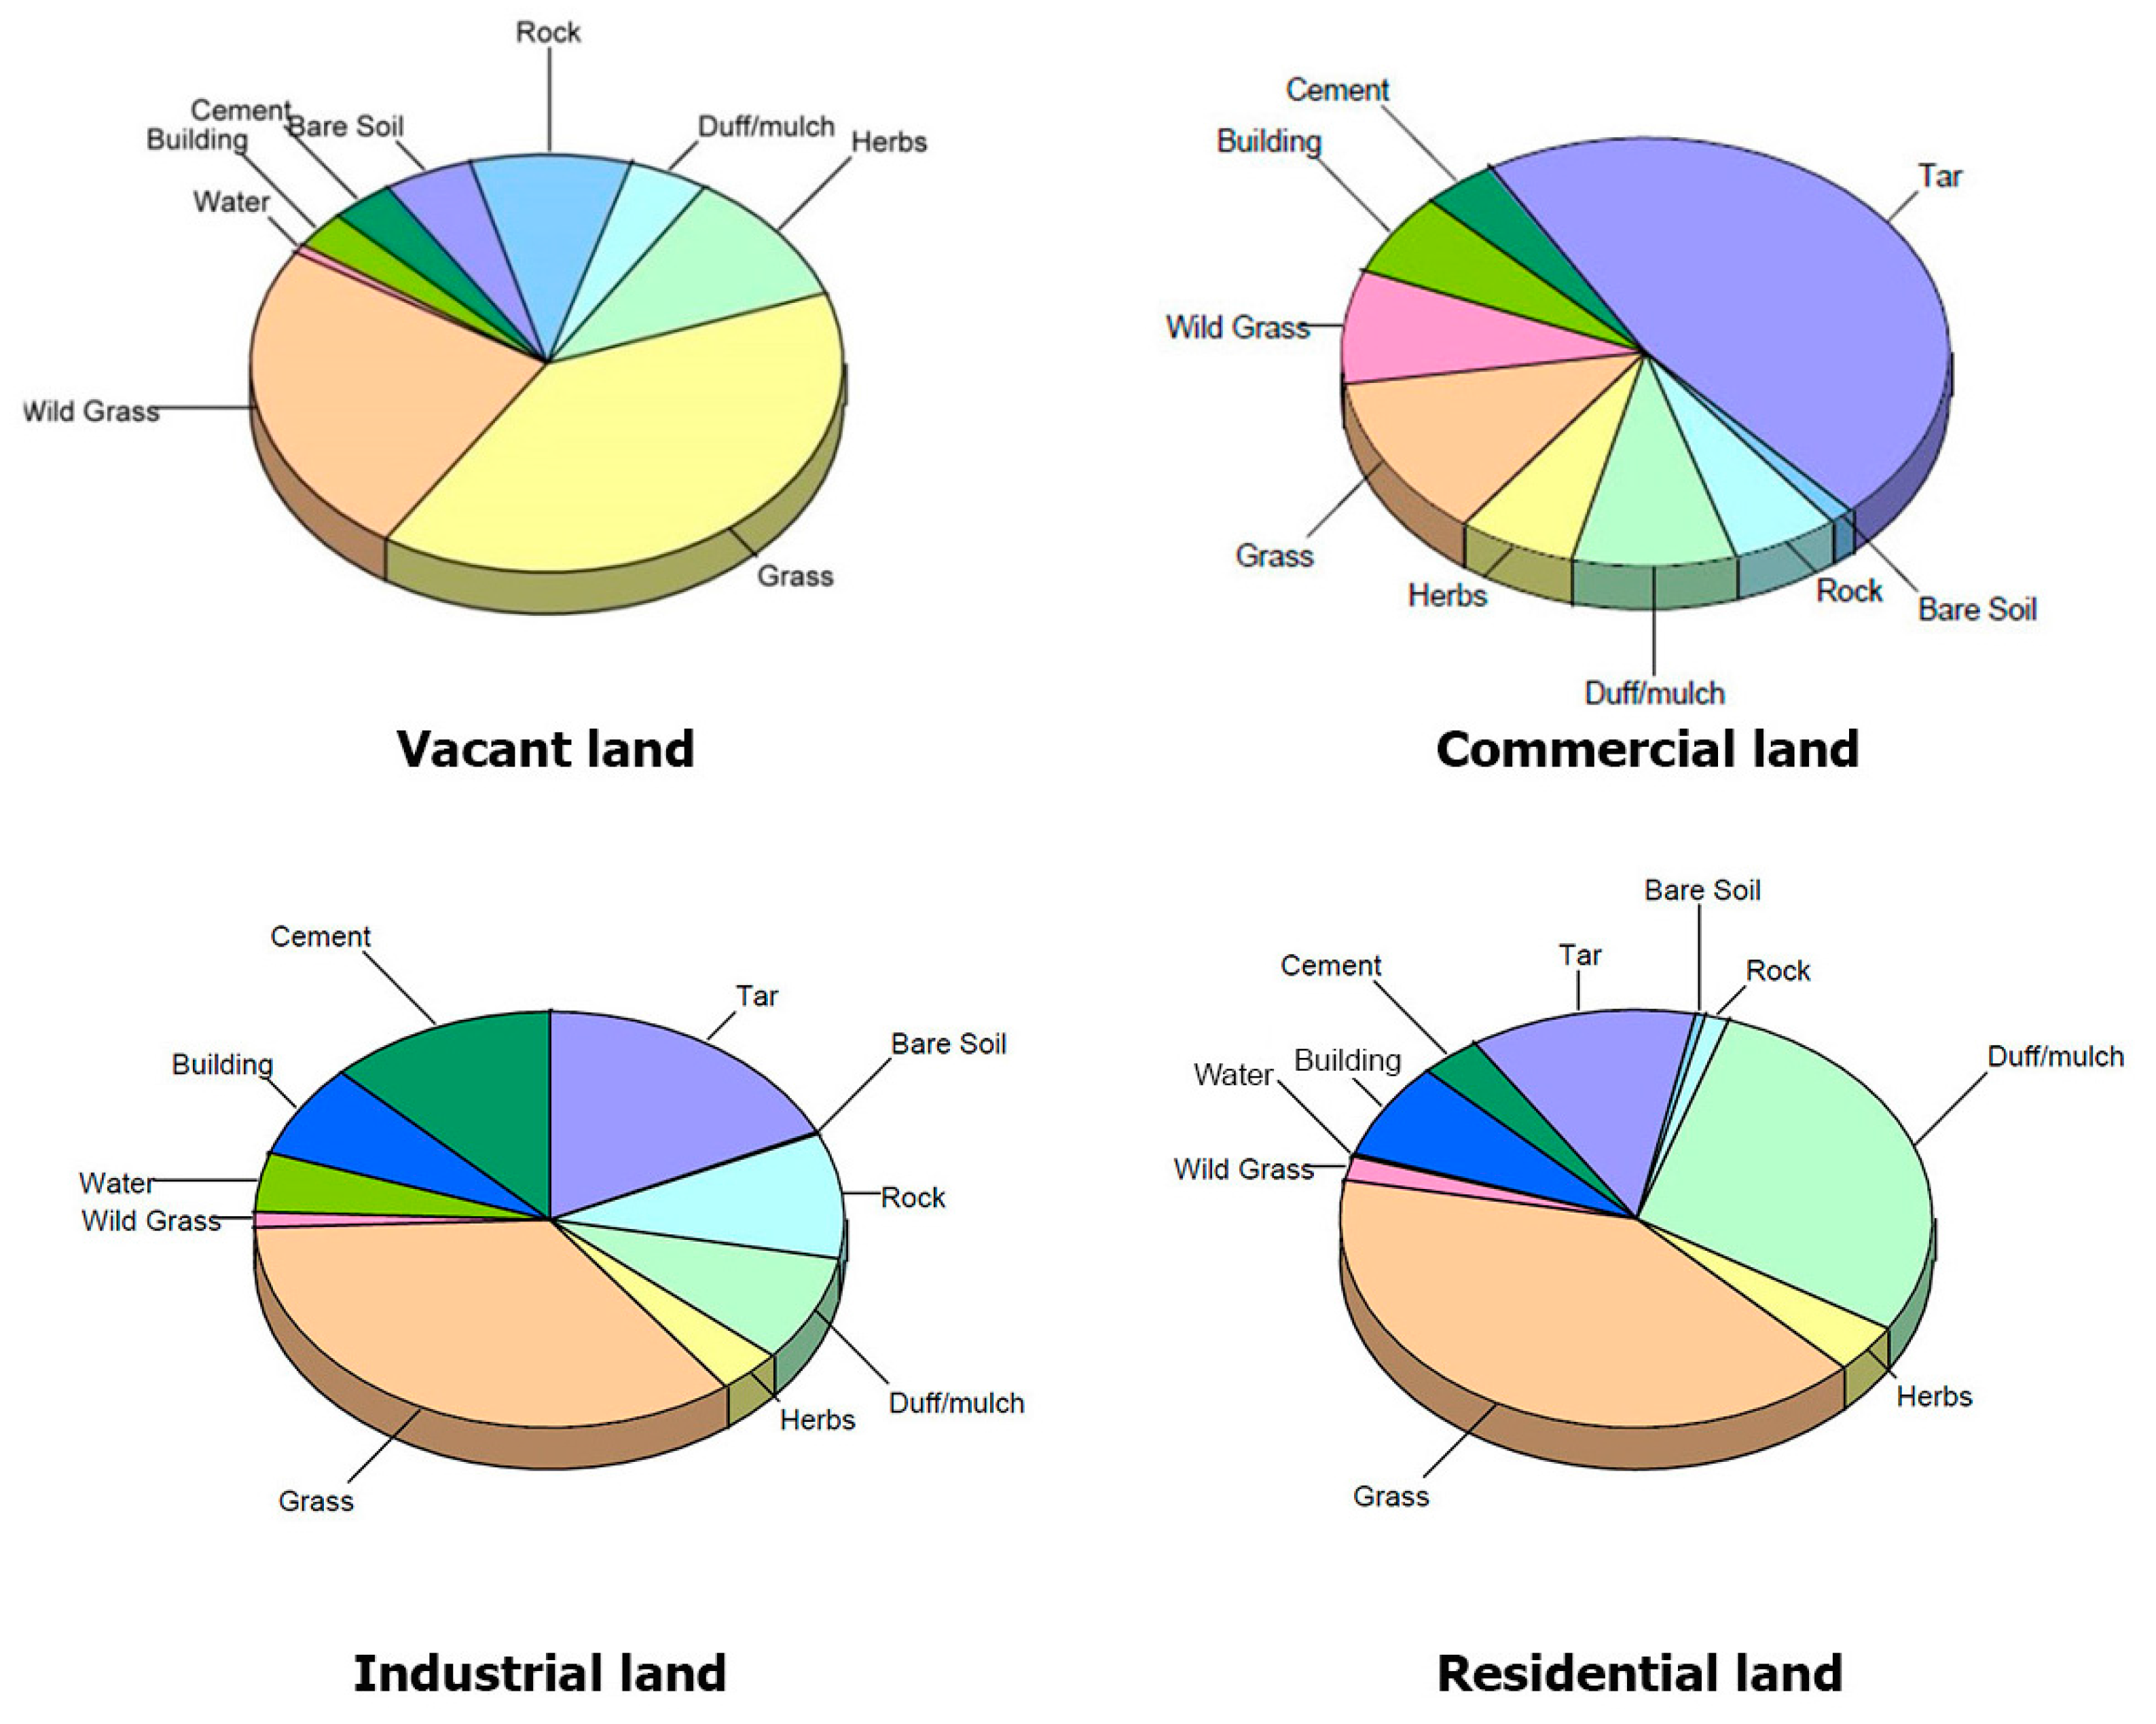
A major driver of the type and quantity of ecosystem services in urban areas is land cover [3]; vegetation and bare soil provide more provisioning services (e.g., food production, water supply), regulating services (e.g., climate regulation, air pollution removal), and supporting services (e.g., nutrient cycling, soil building) than non-vegetated and impervious surfaces [3,47], and many tree benefits are directly proportional to the healthy leaf surface area [30]. Vacant land can thus potentially become a very useful component of a city’s storm water infrastructure and many cities are now greening vacant land as an important element of their storm water management strategy. Vacant land forest structure can be a very cost-effective way of reducing the need for expensive storm water management infrastructure such as retention tanks and sewer systems. Vegetation uses storm water as a resource, capturing a significant percentage of the run off. The current forest structure on vacant land can help cities manage urban storm water to prevent residential floods and filter the polluted water running off impervious paving areas such as parking lots and road systems to recharge clean ground water systems. As an important component of urban green infrastructure systems, vacant land can significantly improve the health of the local urban ecosystem, providing enduring value for the community.
The results of the comparison of urban forests effects and values by land use conducted for this study show that residential land use offers the greatest current and potential future ecosystem benefits on a per ha basis. Residential land has more trees (1,683,000) than any other land use, due in large part to the differences in land area. However, city totals for Roanoke’s carbon storage and carbon removal value of vacant land are very high relative to other land uses (Table 9).
These results also suggest that the high ecosystem values of vacant sites with vegetation should be protected, although the sites could be developed for a variety of uses while still protecting their ecosystem values. Less sensitive vacant sites that have low ecosystem values could be developed for many different types of land use (e.g., housing, commercial, industry, and green re-use options) as they have the most potential for improvement and increasing ecosystem benefits. These sites may currently have buildings or houses that are empty or unused. Other less sensitive vacant sites have no structures, but are often unsafe or being used for illegal activities. These sites are effectively wasted, being underused or under-appreciated compared to other types of vacant land. This could be addressed by implementing tax incentive structures that impose high taxation rates on unimproved land; lower rates could be levied for infill development on vacant land, and tax credits provided for vacant land forest structures and rehabilitation abatement to increase the value of vacant land. Those vacant residential, commercial, and industrial sites with historical significance that have remediation potential could be developed in a manner that preserves their historical value with a historically appropriate use. If other vacant residential, commercial, and industrial sites with low ecosystem values are not threatened by development, their current low ecosystem values could be enhanced through proper management.
Roads, parking lots, and building footprints are conspicuous and pervasive impervious surface components of commercial and industrial land that can cause the loss and fragmentation of habitat and also increase the input of pollutants such as non-point pollutant sources, chemicals, and dust into the surrounding air, soil, vegetation, and water. This often directly affects vegetation mortality and creates barriers to wildlife movement. The space to grow and maintain large trees on commercial and industrial land is limited, and smaller trees collectively play an important role in improving commercial and industrial urban habitats. In addition, certain characteristics are desirable in commercial and industrial land vegetative structure, such as straight growth, resistance to diseases, tolerance of urban air and soil conditions, and lack of litter, so the vegetative structure on commercial and industrial land rarely includes larger diameter tree species.
The main advantages of the i-Tree Eco model are its use of consistent, peer-reviewed procedures and locally measured field data to assess urban forest structure and ecosystem services and benefits [12]. The program is publically available, and technical support is available through i-Tree [12]. However, i-Tree Eco also suffers from a number of limitations. Chief among these is that urban forest ecosystem functions often cannot be readily measured in the field and require modeling procedures to quantity and demonstrate urban forest effects and values [12]. Model outputs are dependent upon accurate field and ancillary (e.g., pollution) data inputs, and as urban forest conditions are changeable, so the model value is not absolute. The number of samples and the plot size utilized also determine the precision and cost of the field data collected. Generally, 200 plots will yield a 12% relative standard error for a study [16]; as the number or size of plots increases, the standard error will decrease and more precise population estimates will be obtained. However, increasing the number of plots requires more time and imposes higher costs for field data collection. As the standard error of strata estimates is partially dependent upon sample size, vacant land classifications with relatively few plots (e.g., 15 plots) will have a relatively high percent standard error. However, as these vacant lands are relatively small in area, the absolute standard error can be minimal. The estimates of urban forest structure, ecosystem services, and economic benefits obtained here are in good agreement with those reported by other ground-based assessments of urban forest structure and ecosystem services [48,49].
Urban forests provide not only the many ecosystem services described earlier but also disservices. Although they raise the levels of the volatile organic compounds (VOC) known to contribute to the production of smog [36], overall researchers agree that the physical effects of urban trees are more important than the associated chemical effects in terms of affecting ozone concentrations [50]. However, urban forests also support nuisance or losses and, sometimes, catastrophic events and can be used by disease vectors to reach urban populations. This duality is not unique to urban forests on vacant land, however; green roofs increase water waste and alien species can spread from gardens. It is thus critical that landscape architects, planners, and policy-makers implement a carefully considered integrated approach for urban forest management in order to provide the optimum balance and maximize the advantages to be gained through the management of vacant land as part of a city’s green infrastructure [51].

5. Conclusions

The extent to which land use provides ecosystem services depends on the current urban forest structure. Different forest structures result in different green ecosystem benefits and infrastructure values for different land uses. This study’s assessment of the forest structure of Roanoke’s vacant land provides a picture of the current extent and condition of the city’s vacant land. As urban forest conditions are changeable, model values must be continually updated by remeasuring plots when needed. Understanding urban forest characteristics will provide planners with the details needed for effective urban forest management and give them a sound basis for estimating green infrastructure values. This study sought to gain a deeper understanding of the role and functions of the forest structure on vacant land in urban areas to aid our understanding of the way vacant land acts as green infrastructure, leading to the better utilization of vacant land. Vacant land offers immense opportunities for creative alternative uses for open spaces and landscape design within our cities.

Acknowledgments

This research was supported by funds provided by the APS Endowment for Sustainable Design Research Fund (Arizona State University’s Herberger Institute for Design and the Arts).

Conflicts of Interest

The author declares no conflict of interest.

References

  1. Pagano, M.A.; Bowman, A.O.M. Vacant Land in Cities: An Urban Resource; Brookings Institution, Center on Urban and Metropolitan Policy: Washington, DC, USA, 2000. [Google Scholar]
  2. Kim, G.; Miller, P.A.; Nowak, D.J. Assessing urban vacant land ecosystem services: Urban vacant land as green infrastructure in the City of Roanoke, Virginia. Urban For. Urban Green. 2015, 14, 519–526. [Google Scholar] [CrossRef]
  3. Kremer, P.; Hamstead, Z.A.; McPhearson, T. A social-ecological assessment of vacant lots in New York City. Landsc. Urban Plan. 2013, 120, 218–233. [Google Scholar] [CrossRef]
  4. Robinson, S.L.; Lundholm, J.T. Ecosystem services provided by urban spontaneous vegetation. Urban Ecosyst. 2012, 15, 545–557. [Google Scholar] [CrossRef]
  5. Darlington, A. Ecology of Refuse Tips; Heinemann Educational: London, UK, 1969. [Google Scholar]
  6. Jehlík, V. The Vegetation of Railways in Northern Bohemia (Eastern Part); Academia: Praha, Czech Republic, 1986. [Google Scholar]
  7. Klimeš, L. Succession in road bank vegetation. Folia Geobot. Phytotaxon. 1987, 22, 435–440. [Google Scholar] [CrossRef]
  8. Sukopp, H.; Blume, H.P.; Kunick, W. The soil, flora, and vegetation of Berlin’s waste lands. In Nature in Cities: The Natural Environment in the Design and Development of Urban Green Space; Wiley: New Jersy, NY, USA, 1979; pp. 115–132. [Google Scholar]
  9. Brandes, D. The flora of old town centers in Europe. In Urban Ecology as the Basis for Urban Planning; Sukoop, H., Numata, M., Huber, A., Eds.; SPB Academic Publishing: Amsterdam, The Netherlands, 1995. [Google Scholar]
  10. Hope, D.; Gries, C.; Zhu, W.; Fagan, W.F.; Redman, C.L.; Grimm, N.B.; Kinzig, A. Socioeconomics drive urban plant diversity. Proc. Natl. Acad. Sci. USA 2003, 100, 8788–8792. [Google Scholar] [CrossRef] [PubMed]
  11. Burkholder, S. The new ecology of vacancy: Rethinking land use in shrinking cities. Sustainability 2012, 4, 1154–1172. [Google Scholar] [CrossRef]
  12. Nowak, D.J.; Crane, D.E.; Stevens, J.C.; Hoehn, R.E.; Walton, J.T.; Bond, J. A Ground-Based Method of Assessing Urban Forest Structure and Ecosystem Services. Arboric. Urban For. 2008, 34, 347–358. [Google Scholar]
  13. Nowak, D.; Hoehn III, R.; Crane, D.; Weller, L.; Davila, A. Assessing Urban Forest Effects and Values, Los Angeles' Urban Forest; Resource Bullet NRS-47; US Department of Agriculture, Forest Service, Northern Research Station: Newtown Square, PA, USA, 2011; p. 30. [Google Scholar]
  14. Kim, G.; Miller, P.A.; Nowak, D.J. The value of green infrastructure on vacant and residential land in Roanoke, Virginia. Sustainability 2016, 8, 296. [Google Scholar] [CrossRef]
  15. Ciecko, L.; Tenneson, K.; Dilley, J.; Wolf, K. Seattle’s Forest Ecosystem Values Analysis of the Structure, Function, and Economic Benefits; USDA Forest Service Pacific Northwest Research Station: Portland, OR, USA, 2012; p. 26. [Google Scholar]
  16. Nowak, D.J.; Walton, J.T.; Stevens, J.C.; Crane, D.E.; Hoehn, R.E. Effect of plot and sample size on timing and precision of urban forest assessments. Arboric. Urban For. 2008, 34, 386–390. [Google Scholar]
  17. Nowak, D.J.; Dwyer, J.F. Understanding the benefits and costs of urban forest ecosystems. In Urban and Community Forestry in the Northeast; Kuser, J.E., Ed.; Springer: New York, NY, USA, 2007; pp. 25–46. [Google Scholar]
  18. McBride, J.; Jacobs, D. Urban forest development: A case study, Menlo Park, California. Urban Ecol. 1976, 2, 1–14. [Google Scholar] [CrossRef]
  19. McBride, J.R.; Jacobs, D.F. Presettlement forest structure as a factor in urban forest development. Urban Ecol. 1986, 9, 245–266. [Google Scholar] [CrossRef]
  20. Miller, P.R.; Winer, A.M. Composition and dominance in Los Angeles Basin urban vegetation. Urban Ecol. 1984, 8, 29–54. [Google Scholar] [CrossRef]
  21. Nowak, D.J. Urban Forest Development and Structure: Analysis of Oakland, California. Ph.D. Thesis, University of California, Berkeley, CA, USA, 1991. [Google Scholar]
  22. McPherson, E.G. Structure and sustainability of Sacramento's urban forest. J. Arboric. 1998, 24, 174–190. [Google Scholar]
  23. Nowak, D.J.; O’Connor, P.R. Syracuse urban forest master plan: Guiding the city’s forest resource into the 21st century. 2001. Available online: http://www.fs.fed.us/ne/newtown_square/.../gtrne287.pdf (accessed on 14 July 2016).
  24. Nowak, D.J.; Crane, D.E. The Urban Forest Effects (UFORE) Model: Quantifying urban forest structure and functions. In Integrated Tools for Natural Resource Inventories in the 21st Century; US Department of Agriculture, Forest Service, North Central Research Station: St. Paul, MN, USA, 2000. [Google Scholar]
  25. Nowak, D.J.; Crane, D.E.; Dwyer, J.F. Compensatory value of urban trees in the United States. J. Arboric. 2002, 28, 194–199. [Google Scholar]
  26. Ham, D.L. Analysis of the urbanizing of the South Carolina Interstate 85 corridor. In Proceedings of the 2003 National Urban Forest Conference, San Antonio, TX, USA, 17–20 September 2003; p. 67.
  27. Blakeman, C.; Brown, B.; Fitzpatrick, B.T.; Shaw, I.; Williamson, A. City-Wide Brownfield Redevelopment Plan; City Council: Roanoke, VA, USA, 2008. [Google Scholar]
  28. U.S. Census Bureau. 2010 Census Interactive Population Search. Available online: http://www.census.gov/2010census/popmap/ipmtext.php?fl=51 (assessed on 20 November 2013).
  29. National Oceanic and Atmospheric Administration. NowData—NOAA Online Weather Data (1981–2010). Available online: http://w2.weather.gov/climate/xmacis.php?wfo=rnk (accessed on 14 July 2017).
  30. Wiseman, E.; King, J. i-Tree Ecosystem Analysis Roanoke; College of Natural Resources and Environment: Blacksburg, VA, USA, 2012; p. 27. [Google Scholar]
  31. Kuers, K. Ranking Species Contribution to Forest Community Composition: Calculation of Importance Value. 2005. Available online: http://static.sewanee.edu/Forestry_Geology/watershed_web/Emanuel/ImportanceValues/ImpVal_SET.html (assessed on 19 June 2016).
  32. Baldocchi, D. A multi-layer model for estimating sulfur dioxide deposition to a deciduous oak forest canopy. Atmos. Environ. 1988, 22, 869–884. [Google Scholar] [CrossRef]
  33. Baldocchi, D.D.; Hicks, B.B.; Camara, P. A canopy stomatal resistance model for gaseous deposition to vegetated surfaces. Atmos. Environ. 1987, 21, 91–101. [Google Scholar] [CrossRef]
  34. Bidwell, R.G.S.; Fraser, D.E. Carbon monoxide uptake and metabolism by leaves. Can. J. Bot. 1972, 50, 1435–1439. [Google Scholar] [CrossRef]
  35. Lovett, G.M. Atmospheric deposition of nutrients and pollutants in North America: An ecological perspective. Ecol. Appl. 1994, 4, 630–650. [Google Scholar] [CrossRef]
  36. Chameides, W.L.; Lindsay, R.W.; Richardson, J.; Kiang, C.S. The role of biogenic hydrocarbons in urban photochemical smog: Atlanta as a case study. Science 1988, 241, 1473–1475. [Google Scholar] [CrossRef] [PubMed]
  37. Cardelino, C.A.; Chameides, W.L. Natural hydrocarbons, urbanization, and urban ozone. J. Geophys. Res. Atmos. 1990, 95, 13971–13979. [Google Scholar] [CrossRef]
  38. Taha, H. Modeling impacts of increased urban vegetation on ozone air quality in the South Coast Air Basin. Atmos. Environ. 1996, 30, 3423–3430. [Google Scholar] [CrossRef]
  39. Abdollahi, K.K.; Ning, Z.H.; Appeaning, A. Gulf Coast Regional Climate Change Council. In Global Climate Change & the Urban Forest; Franklin Press: Baton Rouge, LA, USA, 2000. [Google Scholar]
  40. Interagency Working Group on Social Cost of Carbon United States Government. Technical Support Document: Social Cost of Carbon for Regulatory Impact Analysis under Executive Order 128666. 2010. Available online: http://www.epa.gov/oms/climate/regulations/scc-tsd.pdf (accessed on 20 April 2016). [Google Scholar]
  41. Hirabayashi, S.; Kroll, C.N.; Nowak, D.J. i-Tree Eco precipitation interception model descriptions. 2015. Available online: https://www.itreetools.org/eco/resources/iTree_Eco_Dry_Deposition_Model_Descriptions.pdf (accessed on 19 June 2016).
  42. McPherson, E.G.; Simpson, J.R. Carbon Dioxide Reduction through Urban Forestry. Available online: http://www.fs.fed.us/psw/publications/documents/gtr-171/gtr-171.pdf (accessed on 14 July 2016).
  43. Council of Tree and Landscape Appraisers. Guide for Plant Appraisal; International Society of Arboriculture: Urbana, IL, USA, 1992. [Google Scholar]
  44. Nowak, D.J.; Crane, D.E.; Stevens, J.C.; Ibarra, M. Brooklyn's Urban Forest; Citesser: University Park, PA, USA, 2002; Volume 290. [Google Scholar]
  45. Rosenthal, J.K.; Crauderueff, R.; Carter, M. Urban Heat Island Mitigation Can Improve New York City’s Environment; Sustainable South Bronx: New York, NY, USA, 2008. [Google Scholar]
  46. Shah, A. Why Is Biodiversity Important? Who Cares? Available online: http://www.globalissues.org/article/170/why-is-biodiversity-important-who-cares (accessed on 12 September 2013).
  47. Millennium Ecosystem Assessment. Ecosystems and Human Well-Being: Synthesis; Island Press: Washington, DC, USA, 2005. [Google Scholar]
  48. Nowak, D.J.; Greenfield, E.J.; Hoehn, R.E.; Lapoint, E. Carbon storage and sequestration by trees in urban and community areas of the United States. Environ. Pollut. 2013, 178, 229–236. [Google Scholar] [CrossRef] [PubMed]
  49. Morani, A.; Nowak, D.; Hirabayashi, S.; Guidolotti, G.; Medori, M.; Muzzini, V.; Fares, S.; Scarascia Mugnozza, G.; Calfapietra, C. Comparing i-Tree modeled ozone deposition with field measurements in a periurban Mediterranean forest. Environ. Pollut. 2014, 195, 202–209. [Google Scholar] [CrossRef] [PubMed]
  50. Nowak, D.J.; Civerolo, K.L.; Rao, S.T.; Sistla, G.; Luley, C.J.; Crane, D.E. A modeling study of the impact of urban trees on ozone. Atmos. Environ. 2000, 34, 1601–1613. [Google Scholar] [CrossRef]
  51. Baró, F.; Chaparro, L.; Gómez-Baggethun, E.; Langemeyer, J.; Nowak, D.J.; Terradas, J. Contribution of ecosystem services to air quality and climate change mitigation policies: The case of urban forests in Barcelona, Spain. Ambio 2014, 43, 466–479. [Google Scholar] [CrossRef] [PubMed]
Figure 1. Project area boundaries, plot locations, and city limits.
Sustainability 08 00679 g001
Figure 2. Tree species for different land use types in Roanoke. Overall, the most common urban forest tree species in the city are American elm (16.4%), tree of heaven (12.3%), and box elder (6.7%).
Sustainability 08 00679 g002
Figure 3. Percentage of tree population by diameter class for each land use type (dbh = stem diameter at 1.37 m above the ground line). Trees growing on Roanoke’s vacant land with diameters less than 15.2 cm constitute 40.8% of the tree population.
Sustainability 08 00679 g003
Figure 4. Geographic origin of live tree species growing on vacant land in Roanoke.
Sustainability 08 00679 g004
Figure 5. Percentage of ground cover on vacant land in Roanoke.
Sustainability 08 00679 g005
Figure 6. Pollution removal (bars) and associated economic value (▲) for trees on land use, City of Roanoke, Virginia. Pollution removal value was calculated based on the following prices: $1252 per metric ton (CO, carbon monoxide), $3048 per metric ton (O3, ozone), $315 per metric ton (NO2, nitrogen dioxide), $112 per metric ton (SO2, sulfur dioxide), $15,984 per metric ton (PM10, particulate matter less than 10 microns and greater than 2.5 microns), $124,499 per metric ton (PM2.5, particulate matter less than 2.5 microns). Pollutants are CO, NO2, O3, PM10, and SO2.
Sustainability 08 00679 g006
Figure 7. Carbon sequestration and value for species with greatest overall carbon sequestration in Roanoke for each land use type. Among the tree species, the American elm captures and reduces the most carbon (approximately 19% of the total carbon stored and 18.8% of all sequestered carbon).
Sustainability 08 00679 g007
Figure 8. Avoided runoff and values for tree species with the greatest overall impact on runoff that grow on vacant urban land in Roanoke.
Sustainability 08 00679 g008
Table 1. Comparison of urban forests in Roanoke: percentage tree cover and number of trees by land use type.
Land UseArea (km2)Percentage Tree Cover (SE)Number of Trees (SE)Number of Trees per ha (SE)
Vacant32.430.6 (2.5)210,263 (23,979)63.4 (7.2)
Commercial10.687.9 (1.0)165,996 (101,460)153.3 (94.9)
Industrial24.519.7 (0.6)195,355 (70,208)79.7 (28.6)
Residential57.931.4 (0.7)1,626,880 (240,005)280.7 (41.4)
SE = Standard error of total.
Table 2. Comparison of urban forests in Roanoke: tree biodiversity by land use.
Land UseNumber of Tree SpeciesNumber of Native SpeciesNumber of Non-Native Species
Vacant624319
Commercial21183
Industrial32284
Residential906525
Table 3. Most important tree species growing on vacant land in Roanoke.
Species NameSpecies OriginPercentage of PopulationPercentage of Leaf AreaImportance Value (IV)
American elmNative16.426.142.6
Tree of heavenExotic12.37.119.4
Black walnutNative4.79.013.7
Box elderNative6.73.310.0
Sycamore spp.Native2.17.39.4
Slippery elmNative2.34.66.9
Tulip treeNative1.55.06.5
Silver mapleNative2.14.06.1
Sumac spp.Native2.74.06.1
Red mapleNative2.03.35.3
Table 4. Citywide totals for percentage of coverage by land use in Roanoke.
Ground Cover (%)
Land UsePlant SpaceCementBare SoilRockDuff/MulchHerbsGrassWild GrassWaterBuildingsTrees
Vacant59.23.45.08.84.410.539.524.80.72.930.6
Commercial20.53.91.35.78.76.312.48.606.47.9
Industrial27.712.60.39.78.23.434.51.34.67.49.7
Residential29.217.20.51.427.83.640.11.80.37.331.4
Ground cover totals 100% and includes cement, bare soil, rock, duff/mulch, herbs, grass, wild grass, water, and buildings. Plant space and tree cover overlap with ground cover.
Table 5. Comparison of urban forests in Roanoke: city totals for tree effects by land use.
Land UsePercentage Tree Cover (SE)Number of Trees (SE)Accumulated Carbon Storage (t) (SE)Net Carbon Sequestration (t/year) SEGross Carbon Sequestration (t/year) (SE)
Vacant30.6 (2.5)210,263 (23,979)97,508 (16,274)1959.9 (266.9)2091 (287)
Commercial7.9 (1.0)165,996 (101,460)11,311 (4807)812.7 (423.6)913 (483)
Industrial9.7 (0.6)195,355 (70,208)17,930 (5939)1079.9 (305.3)1186 (342)
Residential31.4 (0.7)1,626,880 (240,005)214,089 (27,439)9254.7 (1787.5)13,207 (1684)
SE = Standard error of the total.
Table 6. City totals for avoided runoff for trees in different land use types in Roanoke.
Land UseNumber of Trees (SE)Leaf Area (km2) (SE)Avoided Runoff (m3/year)Avoided Runoff Value ($)
Vacant 210,263 (23,979)39.90 (5.10)120,498.56283,307.93
Commercial165,996 (101,460)9.7 (3.74)20,997.2649,367.31
Industrial195,355 (70,208)12.31 (3.43)38,626.2490,815.37
Residential1,626,880 (240,005)144.50 (19.90)338,096.28794,908.74
SE = Standard error of total; Avoided runoff is calculated assuming a cost of $2351/m3.
Table 7. Annual energy conservation and carbon avoidance due to trees on different land uses near residential buildings in Roanoke.
Land UseCoolingHeatingTotal
Vacant
Energy (MWh)1705411746
Carbon avoided (mt)32137358
Commercial
Energy (MWh)141731
Carbon avoided (mt)31417
Industrial
Energy (MWh)124−3094
Carbon avoided (mt)24−240
Residential
Energy (MWh)35591503709
Carbon avoided (mt)757157914
Negative numbers indicate an increase in energy use or carbon emissions. MWh = Megawatt-hour; mt = Metric ton.
Table 8. Estimated annual savings in residential energy expenditure in Roanoke during the heating and cooling seasons.
Land TypeCoolingHeatingTotal
Vacant
Energy (MWh)180,9014350185,251
Carbon avoided (mt)25,199290528,103
Commercial
Energy (MWh)156218973460
Carbon avoided (mt)41819512369
Industrial
Energy (MWh)13,838−334810,490
Carbon avoided (mt)3344−33440
Residential
Energy (MWh)377,61015,915393,525
Carbon avoided (mt)52,51711,38363,899
Based on state-wide energy costs for Virginia of $106.1 per MWh in 2012; negative numbers indicate an increased cost due to higher energy use or carbon emissions. MWh = Megawatt-hour; mt = Metric ton.
Table 9. Comparison of urban forests: city total for trees’ structural and functional value by land use in Roanoke.
Land UseNumber of Trees (SE)Carbon Storage (t) (SE)Carbon Storage Value (US$) (SE)Carbon Sequestration (t/year) (SE)Carbon Removal Value (US$) (SE)Structural Value (US$) (SE)
Vacant210,263 (23,979)97,508 (16,274)7,605,624 (1,269,372)2091 (287)163,098 (22,386)168,911,300 (24,340,915)
Commercial165,996 (101,460)11,311 (4807)882,258 (374,946)913 (483)71,214 (37,674)104,290,019 (53,666,145)
Industrial195,355 (70,208)17,930 (5939)1,398,540 (463,242)186 (342)92,508 (26,676)149,105,020 (43,096,984)
Residential1,626,880 (240,005)214,089 (27,439)16,698,942 (2,140,242)13,207 (1684)1,030,146 (131,352)1,397,770,766 (177,354,411)
SE = Standard error of the total.
Table 10. Statistical analyses showing significant differences between vacant lots and other land uses’ ecosystem services using a two sample t-test.
Land Use (1)Land Use (2)Number of Trees (T, P)Carbon Storage (t) (T, P)Carbon Storage Value (US$) (T, P)Carbon Sequestration (t/year) (T, P)Carbon Removal Value (US$) (T, P)Structural Value (US$) (T, P)
VacantCommercial258.3, 0.000 *1626.4, 0.000 *14,363, 0.000 *94.3, 0.000 *833.1, 0.000 *15,849.8, 0.000 *
Industrial129.1, 0.000 *1603.4, 0.000 *14,160.8, 0.000 *100.6, 0.000 *888.3, 0.000 *6567.9, 0.000 *
Residential−8378.1, 0.000 *−1731, 0.000 *−15,287.5, 0.000 *−764, 0.000 *−6747, 0.000 *263,513.8, 0.000 *
* = Statistically significant at p < 0.01
Table 11. Comparison of urban forests: per ha values of trees’ structural and functional values by land use in Roanoke.
Land UseNumber of Trees per ha (SE)Carbon Storage (kg/ha) (SE)Carbon Storage Value (US$) per has (SE)Carbon Sequestration (kg/year/ha) (SE)Carbon Removal Value (US$) per ha SEStructural Value (US$) per ha (SE)
Vacant63.4 (7.2)29,407 (4908)2293.7 (382.8)630.7 (86.7)49.2 (6.7)50,943 (7341)
Commercial153.3 (94.9)10,585 (4499)825.6 (350.9)854.8 (452.2)66.7 (35.2)97,599 (50,223)
Industrial69.7 (28.6)7314 (2422)570.5 (188.9)483.8 (139.5)37.7 (10.8)60,822 (17,580)
Residential280.7 (41.4)36,997 (4735)2885.8 (369.3)2279.0 (290.5)177.8 (22.6)241,202 (30,605)
SE = Standard error of the total.

