Case Report

Spatiotemporal Characteristics of Urban Sprawl in Chinese Port Cities from 1979 to 2013

1
Renewable Resources Division, Institute of Remote Sensing and Digital Earth, Chinese Academy of Sciences, No. 20 DaTun Road, Beijing 100101, China
2
University of Chinese Academy of Sciences, No. 19A Yuquan Road, Beijing 100049, China
3
UMR TETIS Maison de la Télédétection, La Recherche Agronomique pour le Développement, 500 Rue Jean François Breton, 34000 Montpellier, France
4
Department of Earth System Science, University of California, Irvine, 3200 Croul Hall, Irvine, CA 92697, USA
*
Author to whom correspondence should be addressed.
Sustainability 2016, 8(11), 1138; https://0-doi-org.brum.beds.ac.uk/10.3390/su8111138
Submission received: 5 August 2016 / Revised: 26 October 2016 / Accepted: 28 October 2016 / Published: 5 November 2016

Abstract

:
China has been through a period of remarkable urban sprawl since the reform and opening-up policy in 1978, with the highest urbanization occurring in the coastal zones. Sustainable urban development requires a better understanding of the spatiotemporal characteristics of urbanization. This study systematically explored urban sprawl in Chinese coastal cities with a visual interpretation method from 1979 to 2013. The results show that urban built-up areas kept increasing at a faster pace during the study period (i.e., increased about 9-fold in 34 years), especially in the first decade of the 21st century. Spatially, urban sprawl intensity generally peaked in the urban fringe. Urban built-up areas expanded mostly at a cost to cultivated land and non-urban built-up land, and became more irregular and less compact through the study period. Land-use policies, economic development levels, port developments and locations are all closely related with urban sprawl in these port cities. The results also suggest that improving the utilization efficiency of urban land and coordinating the development of city and port are necessary and important for sustainable development in coastal cities.

1. Introduction

Urban land sprawl and population migration from rural to urban areas have resulted in rapid global urbanization over the last several decades [1]. The urban population is expected to rise to more than 60% in developing countries and 80% in developed regions by 2050 [2]. Urbanization has led to unprecedented wealth and economic growth, and to social advances in many parts of the world [3,4]. On the other hand, drastic urbanization has generated many challenges and problems. For example, it can affect the urban environment and climate at local or global scales, bring about traffic jams, decrease employment opportunities, and jeopardize biodiversity [5,6,7]. As a developing country and the most populous country, China experienced a dramatic increase (+230%) in urban area from the 1990s to 2010 [8,9]. It is imperative to monitor urbanization because a long record of urban land use change is of significant value for future urban planning and management [10].
Generally speaking, urban expansion has two forms: urban sprawl and the compact city. Urban sprawl, often found in North America, is defined as urban expansion that creates new low-density suburbs, is unordered, and has detached housing and commercial strips. Differing from urban sprawl, the compact city appears more in European countries, characterized by high density, being ordered, short distances, and a better quality of city life. A compact city is generally regarded as the most sustainable urban expansion form [11,12,13,14]. In recent years, urban sprawl has been developed to the new forms of “Smart Growth Movement” and “New Urbanism Movement,” which are similar to the compact city.
In China, urban sprawl generally refers to urban expansion with low-density areas linking together urban built-up areas, including industrial parks and university towns [15]. As the most populated emerging country, China has been through remarkable urban sprawl since the reform and opening-up policy in the late 1970s. The three largest urban agglomerations, the Jing-Jin-Ji region, the Yangtze River Delta and the Pearl River Delta, all distribute in the coastal zone and underwent faster urbanization processes in the past decades.
Landscape metrics and socioeconomic indicators are two kinds of indices used to account for urban form changes in general. Landscape metrics were developed by landscape ecologists and could be used as spatial metrics outside the field of landscape ecology, such as in urban studies [16]. The statistical package FRAGSTATS [17] was widely applied to urban sprawl and urban form changes with corresponding metrics at patch, class, and landscape levels [14,18,19,20]. Socioeconomic indicators, such as the population density and the gross domestic product (GDP), were also used for measuring urban form changes and urban development levels in many studies [13,21,22]. These indices and indicators have been fully taken into account in our study.
Relative to the well-documented demographic urbanization, physical urbanization needs to be paid more attention. In particular, the studies on physical urbanization at regional scales are limited [13,18,23]. For example, Kuang et al. (2014) analyzed the megacity expansions in China and the USA in terms of patterns, rates, and driving forces based on time-series impervious surface area data [10]. Huang et al. (2007) made a global comparative analysis of urban forms to explore the differences in urban forms between developed and developing countries [18]. Some other studies focused on certain Chinese coastal cities [7,24,25,26,27,28] or individual coastal regions [29,30,31]. For instance, Li et al. (2010) [32] analyzed the overall spatiotemporal characteristics of urban expansion in Shanghai, and explored the urbanization of its major satellite cities and their interactions by employing a combination of remotely sensed data, urbanization metrics and GIS-based buffer gradient analysis. Tian et al. (2011) [33] explored the urban growth, size distribution, and spatiotemporal dynamic pattern of Yangtze River Delta Region of China. The spatiotemporal characteristics of urban sprawl in the coastal zone as a whole are important for understanding the urbanization situation and landscape changes in coastal China, but have not been explored systematically [34].
Remote sensing and Geographic Information System (GIS) techniques have been used widely in studies on urban sprawl [35,36,37]. Remote sensing has recently become an effective and popular means in such studies because of its macroscopic, objective, and repeatable characteristics. Based on multiple remote sensing products with high quality and fine resolution, we take advantage of a visual interpretation method (see Section 2.2 for more details) and are able to show urban sprawl on the map dynamically. In addition, we integrate GIS techniques and statistical methods to further explore the features of urban sprawl.
This study aims to fill the gap of previous studies with a focus on quantitatively describing the characteristics of spatiotemporal urban sprawl in coastal China and further evaluating its impact on associated land use changes and the features of urban forms using landscape metrics. Specifically, Section 2 introduces the study area, data sources, and methodology. Section 3 presents the results and their implications on the characteristics of urban sprawl, urban dynamic changes within buffer zones, the impact on other land use changes, and urban form patterns. Section 4 discusses the effects of land use policies, socioeconomic factors, and port locations on urban sprawl. Section 5 summarizes the characteristics of urban sprawl in specific Chinese coastal cities and makes conclusions based on the findings.

2. Methodology

2.1. Study Area and Data Sources

The Chinese coastal zone can be divided into three regions: the north coastal zone, the central coastal zone, and the south coastal zone [38]. Each zone constitutes the administrative regions with similar environmental conditions, opening-up, and national economy invigoration policies. Our study domain contains thirteen major coastal cities that are well distributed along the coast of China: Dalian, Tangshan, Tianjin, Qingdao, Shanghai, Ningbo, Fuzhou, Xiamen, Guangzhou, Shenzhen, Zhuhai, Fangchenggang, and Haikou (Figure 1).
The spatiotemporal process of urban sprawl can be observed in high-resolution remote sensing images. Considering availability, spatial resolution, and data quality, Landsat Multi Spectral Scanner (MSS) images, Landsat Thematic Mapper (TM) and Enhanced Thematic Mapper Plus (ETM+), China-Brazil Earth Resources Satellite (CBERS) Charge-coupled Device (CCD), Huanjing-1 (HJ-1) CCD, and Operational Land Imager (OLI) of Landsat Data Continuity Mission (LDCM) data in 1979, 1987, 1996, 2000, 2002, 2004, 2006, 2008, 2010, 2011, 2012, and 2013, across almost 40 years, are the most suitable data (Table 1). Landsat TM/ETM+, LDCM OLI, and HJ-1 CCD data have a spatial resolution of 30 m, which accounted for approximately 85% of images used. Landsat MSS images and CBERS CCD images have a spatial resolution of 60 m and 19.5 m, respectively, which are resampled to 30 m for filling gaps where no Landsat TM/ETM+, LDCM OLI, and HJ-1 CCD data are available. Remote sensing data are generally acquired during cloud-free days at the beginning or end of the growing season [39].
In order to quantitatively identify the relationship of urban sprawl and economic development, we use GDP and population data from the China City Statistical Yearbook [40,41] and statistical data of port cargo throughput [42] as indirect indicators of the economic development levels in these port cities.

2.2. Image Processing and Dynamic Change of Urban Built-Up Area

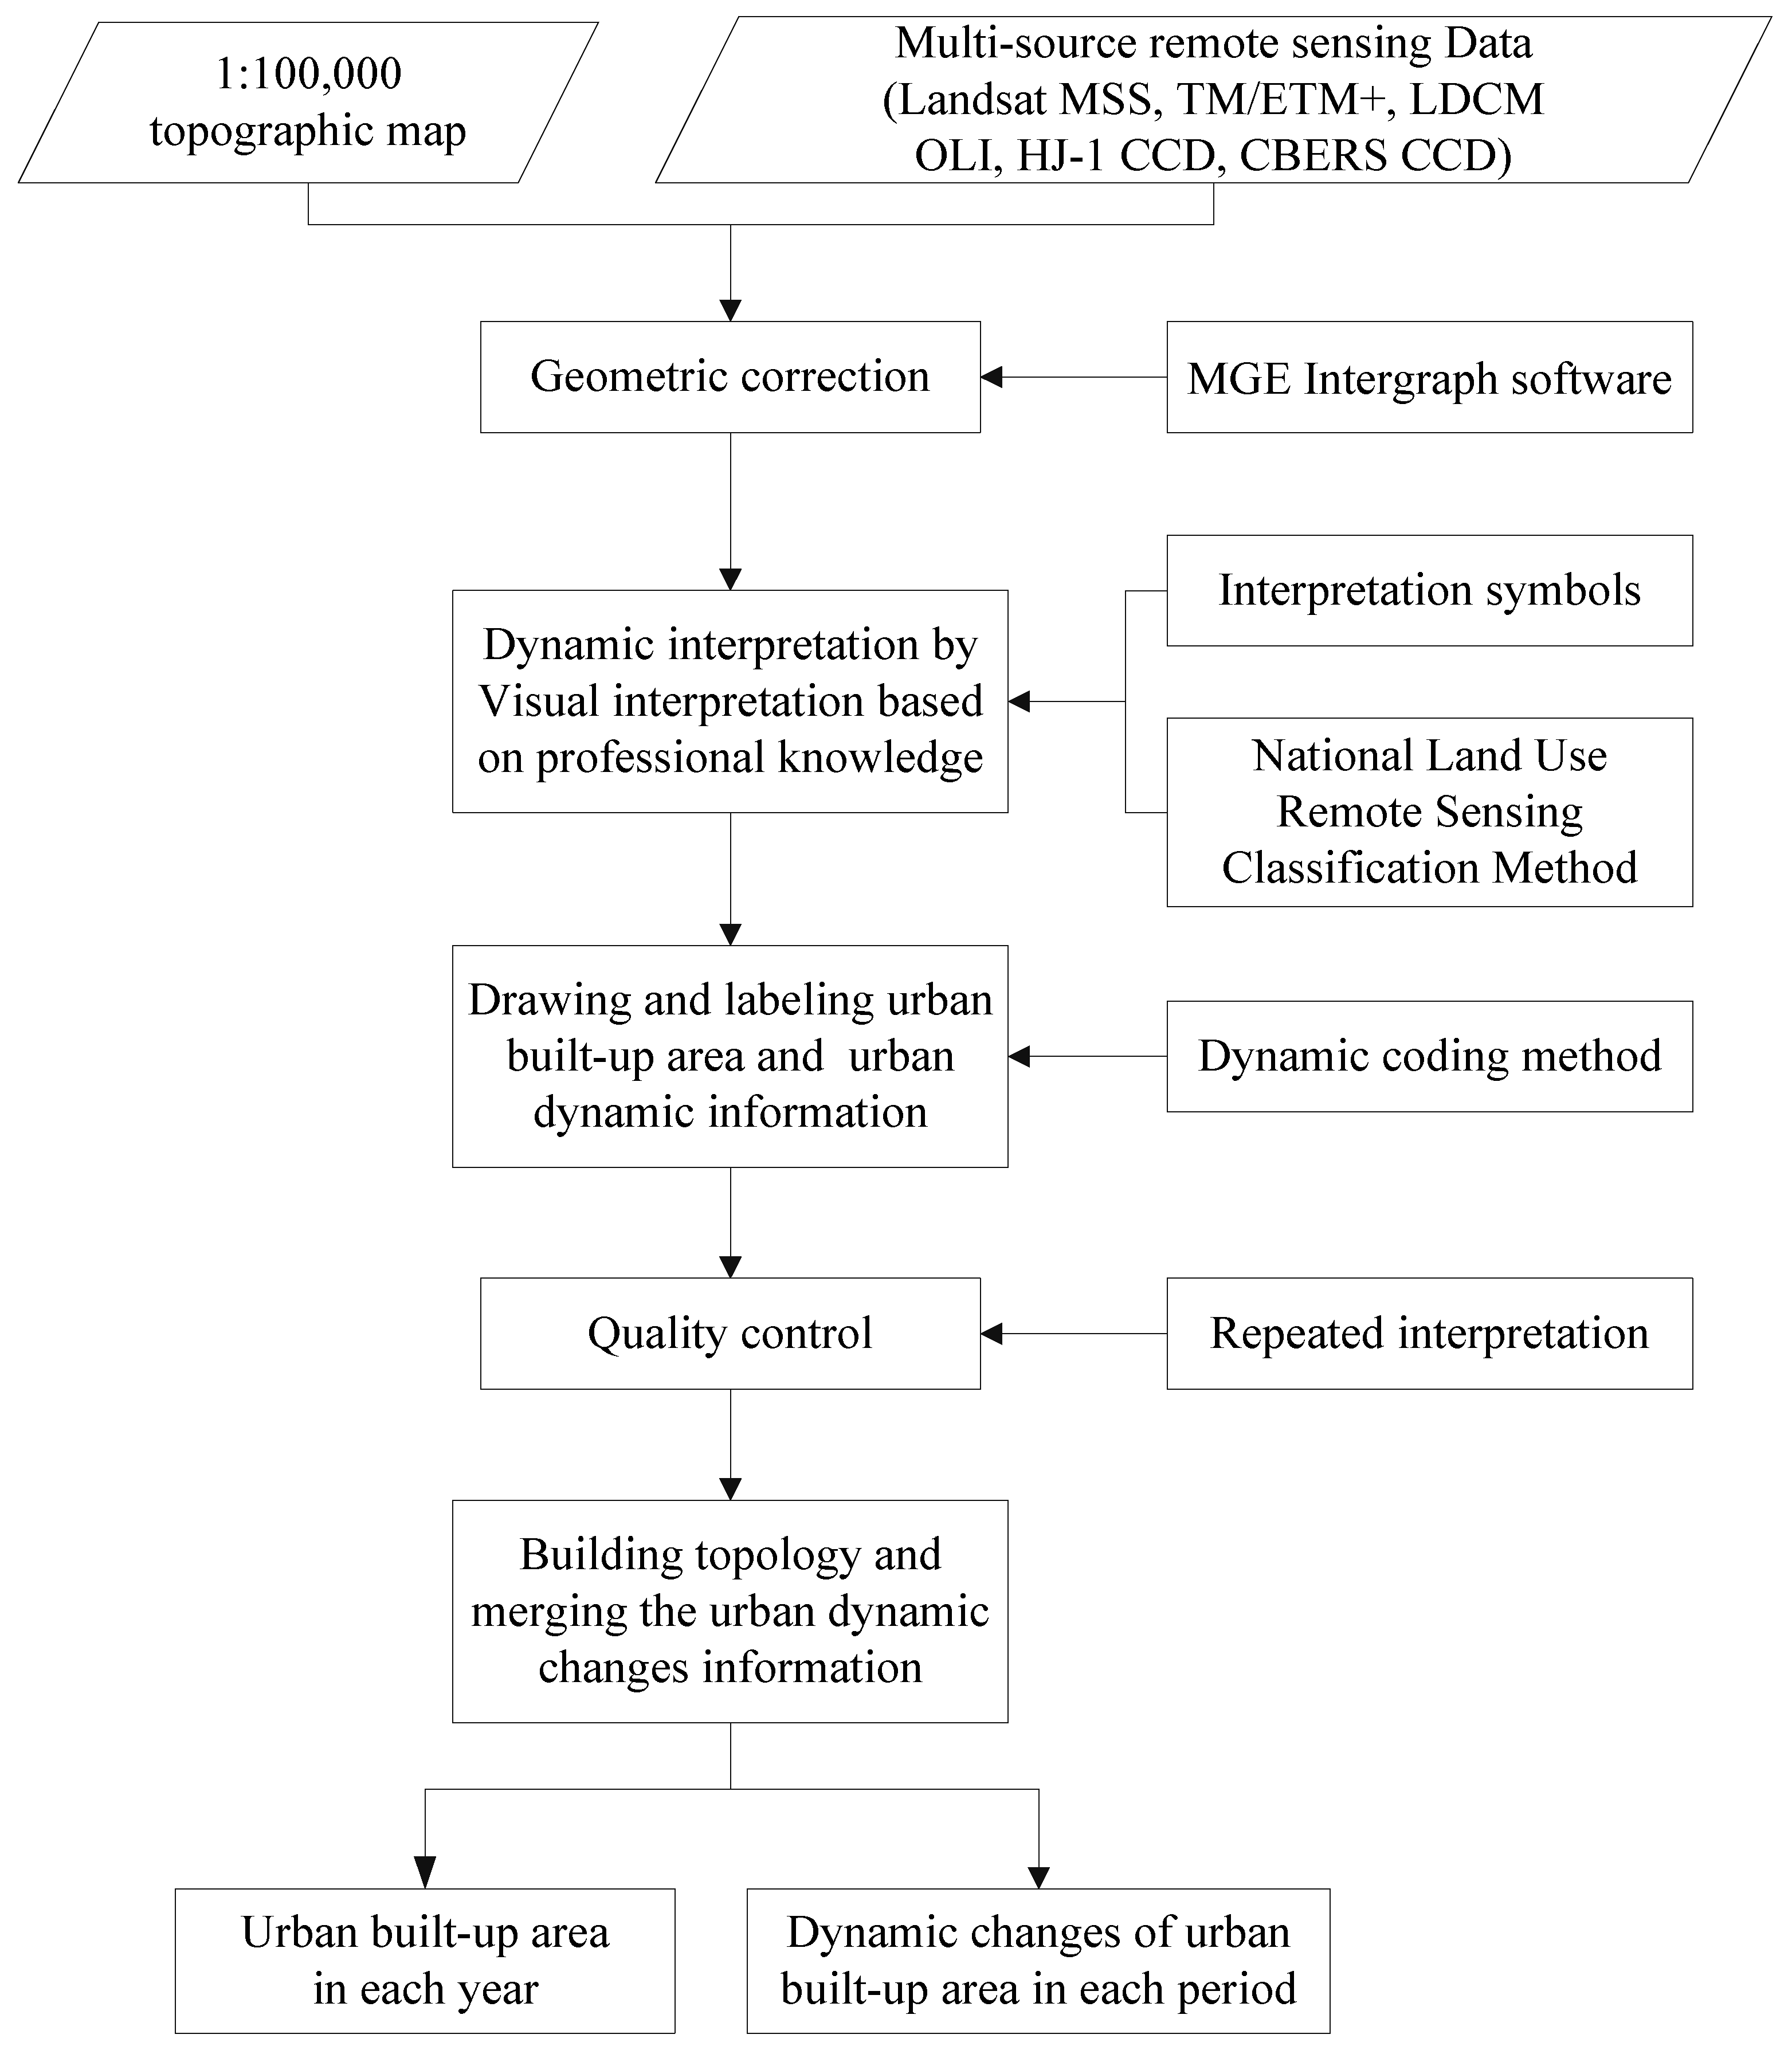
2.2.1. Image Processing

At a scale of 1:100,000, remote sensing images covering the port cities were geometrically corrected using MGE Intergraph. All images were composited using standard false-color synthesis. We prohibited image processing methods such as radiometric correction, atmospheric correction, color balance, and enhancement for better visual interpretation. Geometric correction of the images using ground control points was manually performed. The accuracy of geometric correction was set so that the relative position error of the same feature points does not exceed two pixels [39]. Figure 2 depicts the procedures of the image processing, identification of urban built-up area and dynamic change, and quality control.

2.2.2. Definition of Urban Built-Up Area

In the context of urban sprawl, an urban built-up area generally refers to the total urban area, although different studies might define the term slightly differently according to their specific research purposes [43]. In this study, focusing on the coastal area in China, we adopt the definition of urban built-up area described in “Standards for Basic Terminology of Urban Planning” (GB/T 50280-98), which considers a spatial unit in an urban administrative district to be a part of the urban built-up area if most of its area has already been developed, and furnished with municipal utilities and public facilities [44].

2.2.3. Identification of Urban Built-Up Area and Its Dynamic Changes

Visual interpretation methods can identify important characteristics of urban sprawl accurately in spite of being more time-consuming than automatic methods [45]. Readers are referred to Zhang et al. (2014) [39] for more details in terms of the advantages of visual interpretation over automatic methods. Visual interpretation methods allow us to explicitly quantify urban built-up area and the associated effects on surrounding land-use types in the process of urban sprawl.
It is necessary to set up a series of interpretation symbols for each land-use type in order to reduce the error caused by the interpretation of technicians. Interpretation symbols are built based on interpretation elements of land-use types in remote sensing image such as size, shape, color, hue, texture, and shadow. We follow Zhang et al. (2014) [39] for the set-up of interpretation symbols.
The steps of extracting urban built-up area and its dynamic changes are as follows: (1) according to interpretation symbols to interpret and establish the initial monitoring status of urban built-up area in 1979; (2) based on the National Land Use Remote Sensing Classification Method of the Chinese Academy of Sciences (see Appendix A) and the dynamic coding method [39], completion of quantifying the urban built-up area sprawl from 1979 to 1987, that is, how much of other land-use types converted into the urban land; (3) starting from the urban built-up area of 1987, repeat step 2 to obtain the urban built-up area sprawl from 1987 to 1996; (4) repeat the above steps on the following years (1996–2000, 2000–2002, …) until urban built-up area sprawl from 2012 to 2013 is obtained. Thus three vector layers were obtained for each of the 11 periods, corresponding to the status of urban built-up area at the beginning (i) and the end (ii) of the period, and the dynamic changes over that period (iii).

2.2.4. Quality Control

In a visual interpretation method, the classification accuracy depends on the professional background and interpretation ability of the researchers. Repeated interpretation by different professionals was applied for the sake of quality control and accuracy assessment in the study.
The outlines of quality control are as follows: (1) Consistent application of nomenclature: correct codes, sufficient details, and correct application of the generalization rules; (2) accurate delineation of changes: thematic accuracy of cultivated and built-up land should reach 90%, and accuracy for other land types should reach 80%, the location accuracy of all land types should be controlled within two pixels (60 m); (3) mapping accuracy: the short side length of the minimum strip polygon of urban dynamic changes should be more than four pixels; (4) topological consistency of data layers: no invalid codes, all polygons are closed, with only a single code per polygon, and no neighbor polygons with the same code. See Zhang et al. (2014) [39] for more details.

2.3. Expansion Intensity Index

The expansion intensity index has been widely used to reflect the intensity variations of urban expansion. It refers to the ratio of extended urban built-up area to the initial urban land area during a certain period [46]. The expansion intensity index can be calculated as follows:
β i , t     t   +   n = ( U L A i , t   +   n U L A i , t ) / n / T L A i × 100 %
where β i , t     t   +   n is the expansion intensity index of the spatial unit i during time period n, U L A i , t   +   n is the urban land area in year t + n, U L A i , t is the urban land area in year t, and T L A i is the urban land area of the spatial unit i at the initial time. In this study, we use an expansion intensity index to quantify urban sprawl intensity in different decades and compare the intensity across the coastal cities over the same time period. Jiao (2015) recently proposed an inverse S-shaped function to quantify urban land intensity, and characterized urban form and urban sprawl with the parameters in the function [47]. We use an urban expansion intensity index instead of urban land intensity in this study since the expansion intensity index provides direct-viewing intensity of urban sprawl. More importantly, the parameters in the inverse S-shaped function are ill-posed when interpreting urban sprawl in cities that are linear or multinucleated (i.e., not monocentric) [47], while our study focuses on coastal cities where urban expansion is usually not in a monocentric form due to terrain constraints.

2.4. Spatial Metrics

Urban sprawl directly increases the urban built-up area, and occupies other surrounding land at the same time [20]. Spatial metrics are often used to quantify the characteristics of urban sprawl. In general, spatial metrics are defined as measurements derived from the digital analysis of categorical maps exhibiting spatial heterogeneity at a specific scale and resolution [16].
Many spatial metrics have been developed and used previously [48], which have been classified into three general categories (density, diversity, and spatial structure pattern) [49]. Our purpose here is to quantify the overall urban shape and characteristics of urban sprawl in terms of landscape. Thus, we select the urban compactness index (BCI), the area weighted mean shape index (AWMSI), and the Shannon’s Diversity Index (SHDI) in this study and calculate these indices with the software program Fragstats [17]. These indices are relatively easy to calculate and have been used in our early studies.
The compactness of the urban outer contour is an important indicator for reflecting urban morphology [50]. There are many ways to calculate urban spatial compactness, and the formula proposed by Boyce and Clark [51] is used widely [52,53]. Specifically, it is calculated as follows:
B C I = 2 π A / P
where BCI is the urban compactness ratio, A is the urban built-up area, and P is the perimeter of urban built-up area. The value of BCI is between 0 and 1. Larger BCI indicates that the city is more compact. The compactness of a circle is 1.
AWMSI [14] is calculated as follows:
A W M S I = i = 1 i = N P i / 4 S i N × S i i = 1 i = N S i
where S i and P i are the area and the perimeter of patch i , and N is the total number of patches. AWMSI is equal to or larger than 1, with AWMSI = 1 when all patches are squares. AWMSI describes the shape irregularity of the urban built-up area and the complexity of urban form in each period. Larger AWMSI indicates a higher irregularity of the urban area. Urban sprawl extending further from the city fringe generally increases AWMSI, while urban sprawl embedding between the patches decreases AWMSI.
SHDI [54] is calculated as follows:
S H D I = i = 1 i = M [ P i l n ( P i ) ]
where P i is the ratio of the lost area of each type of landscape patch to the total lost area of landscape and M is the number of landscape types lost to urban sprawl. SHDI is equal to or larger than 0, with SHDI = 0 when there is only one type of landscape patch. SHDI accounts for the abundance and evenness of each element. In our case, it indicates the diversity of landscape types that are lost to urban sprawl in a certain period. A larger SHDI implies more landscape types are occupied by urban built-up area and there is an equalization trend among these landscape types. The classification of landscape types is introduced later in Section 3.3.
These spatial metrics, combined with the expansion intensity index, are able to describe the density and diversity features of urban sprawl in port cities. The spatial structure pattern of urban sprawl is not the emphasis of this study, but could be an interesting topic in future research. A Multi-order Landscape Expansion Index (MLEI) has recently been developed and is useful for the recognition of spatial structure of urban expansion [55].

3. Results

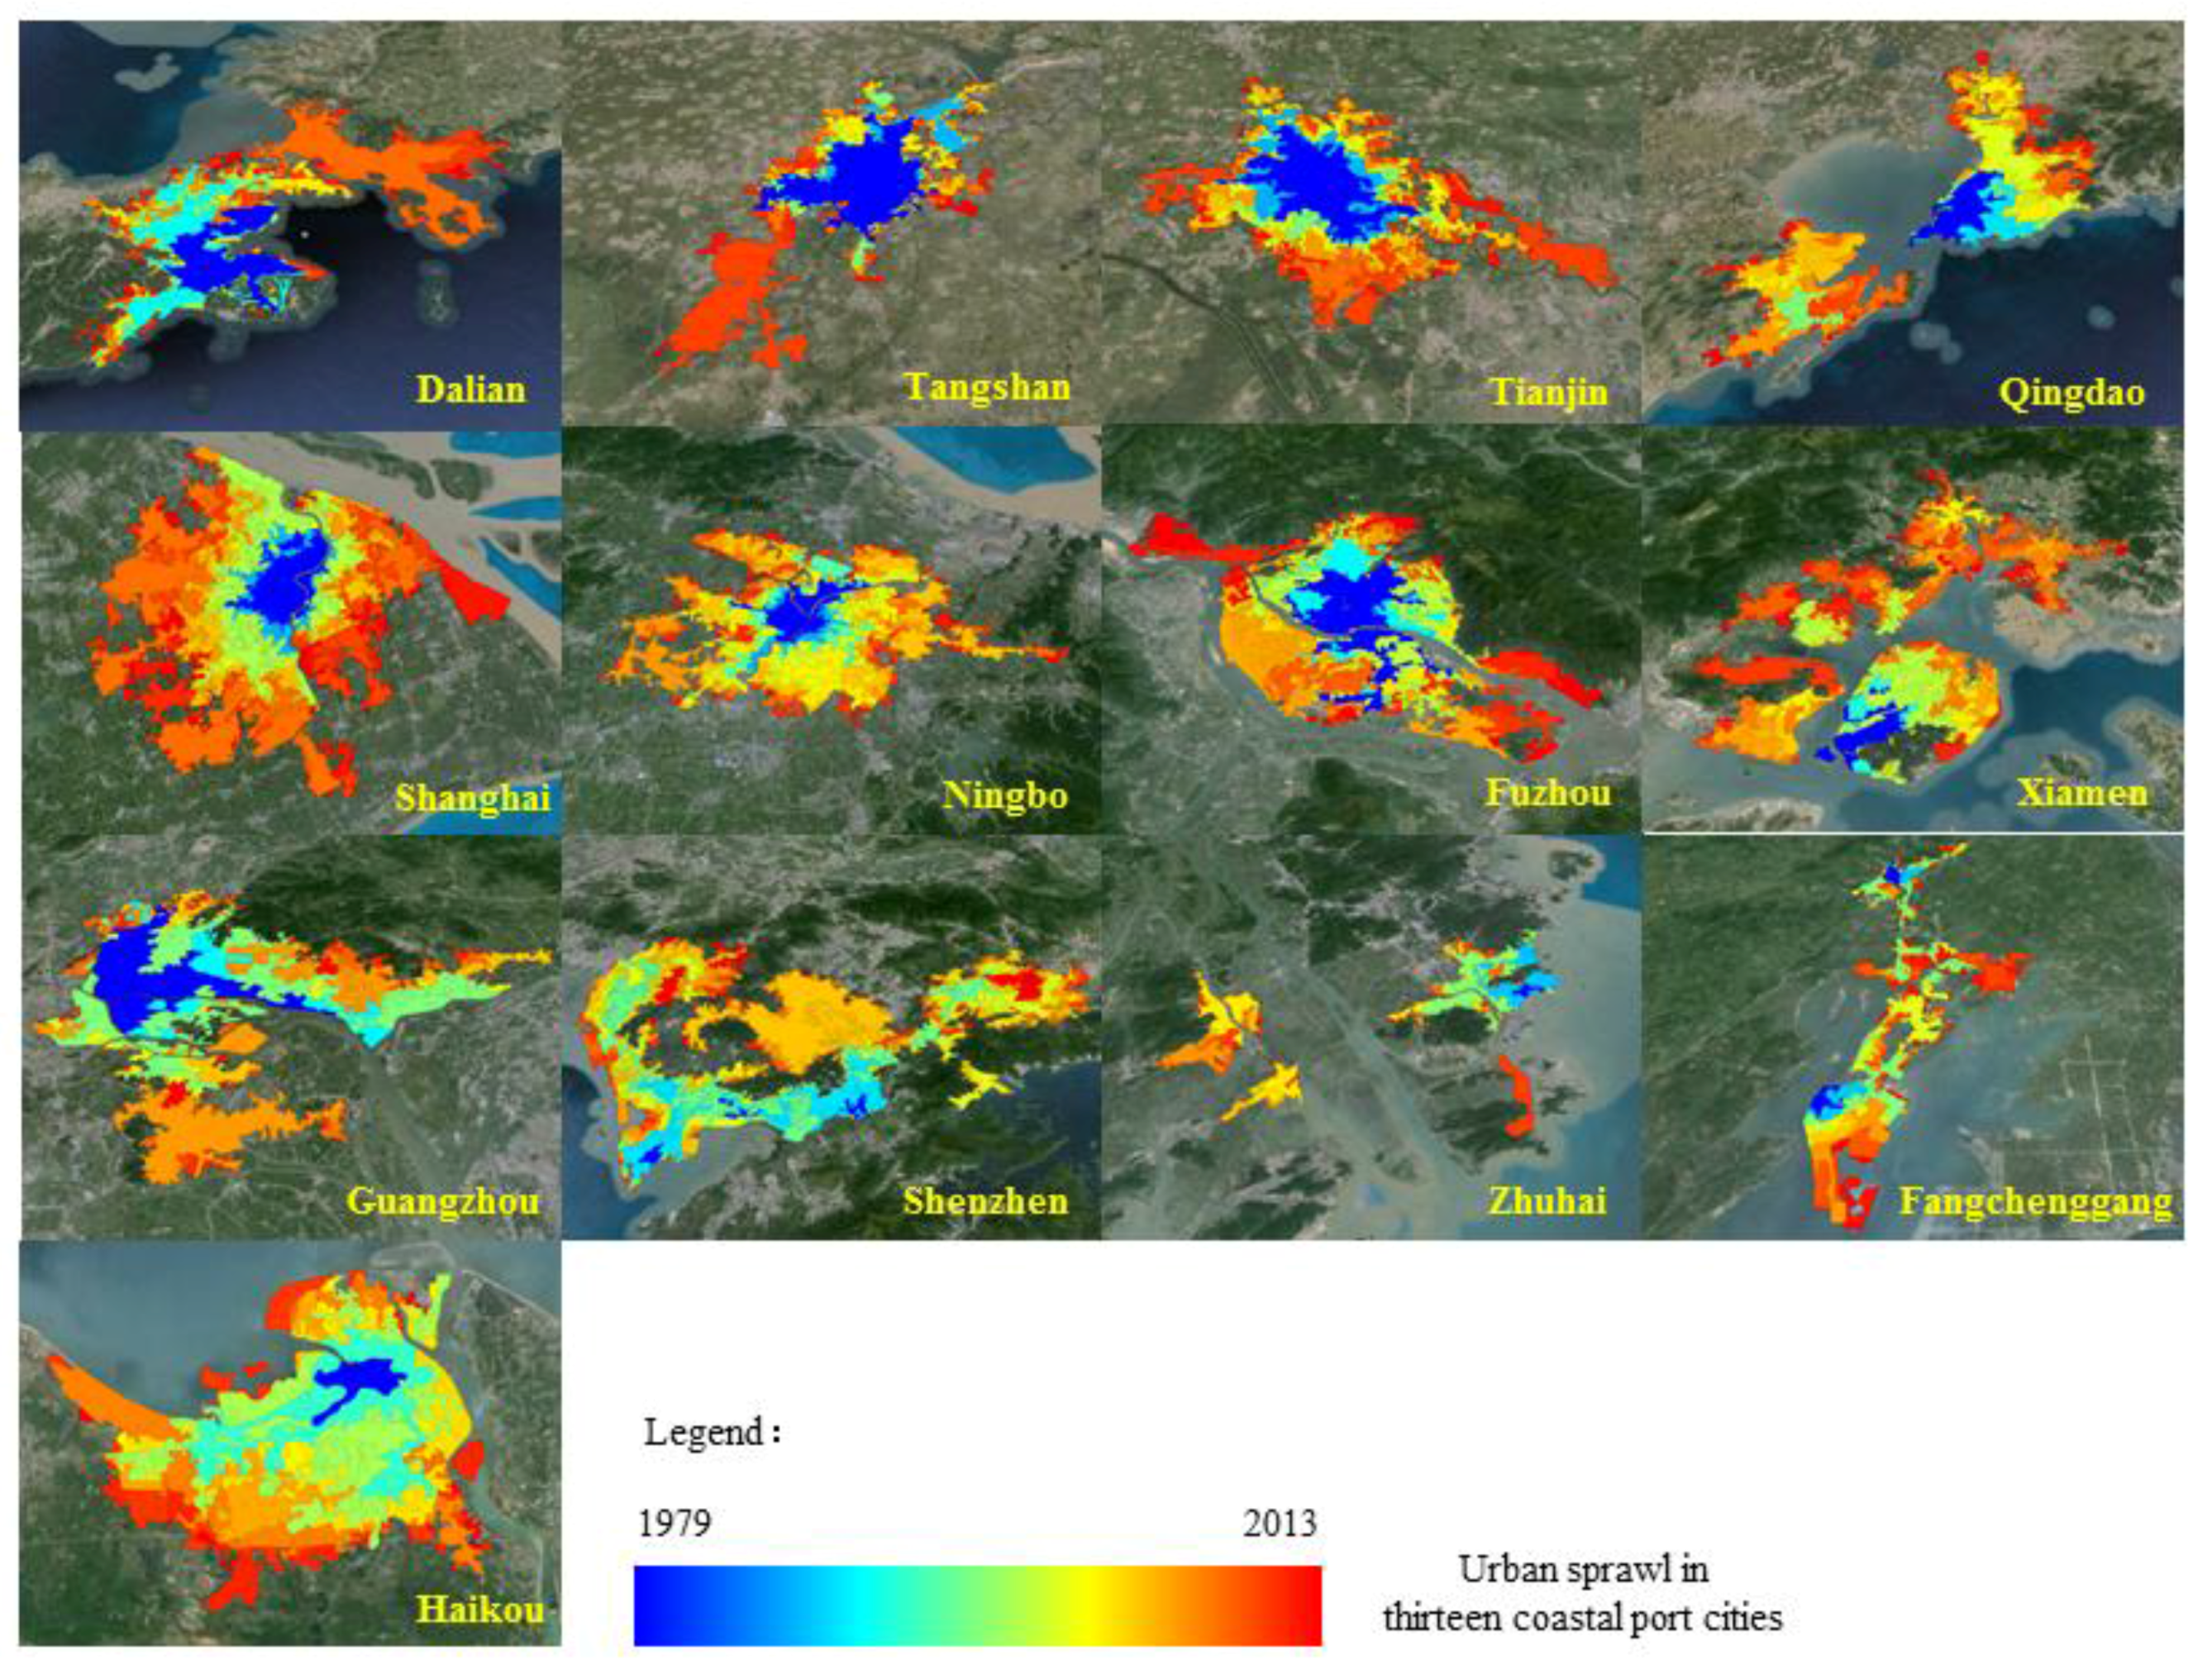
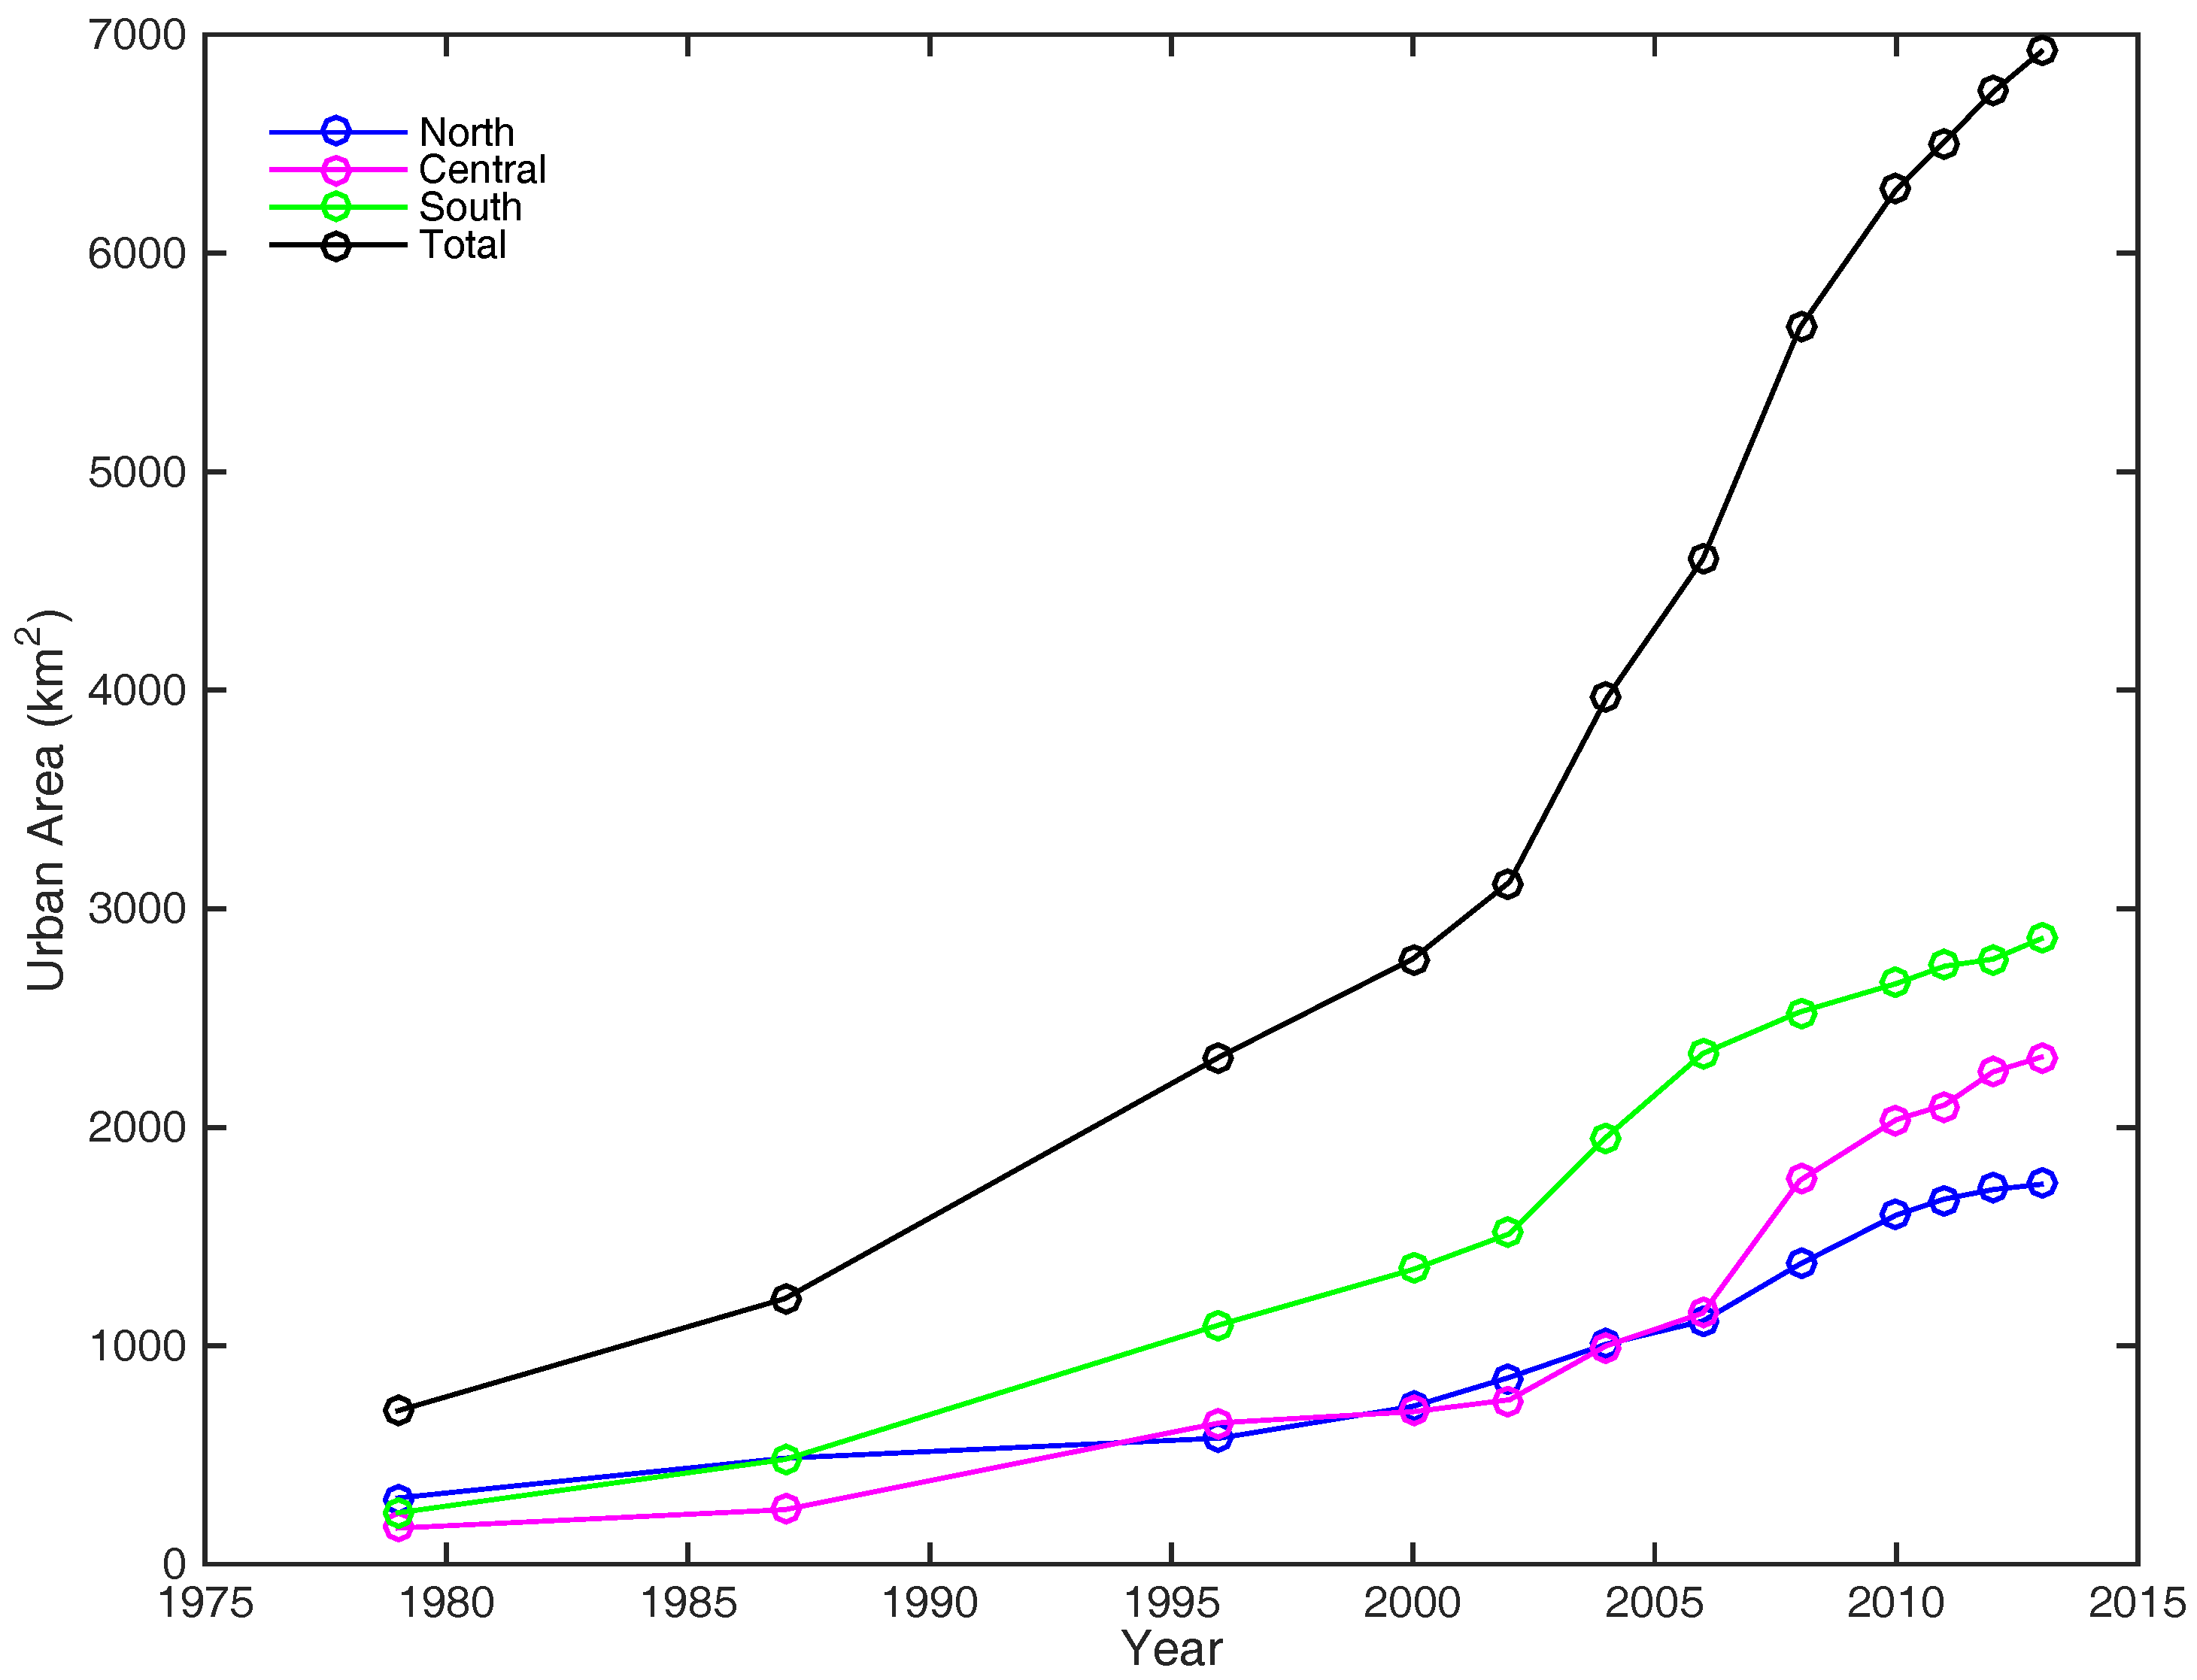
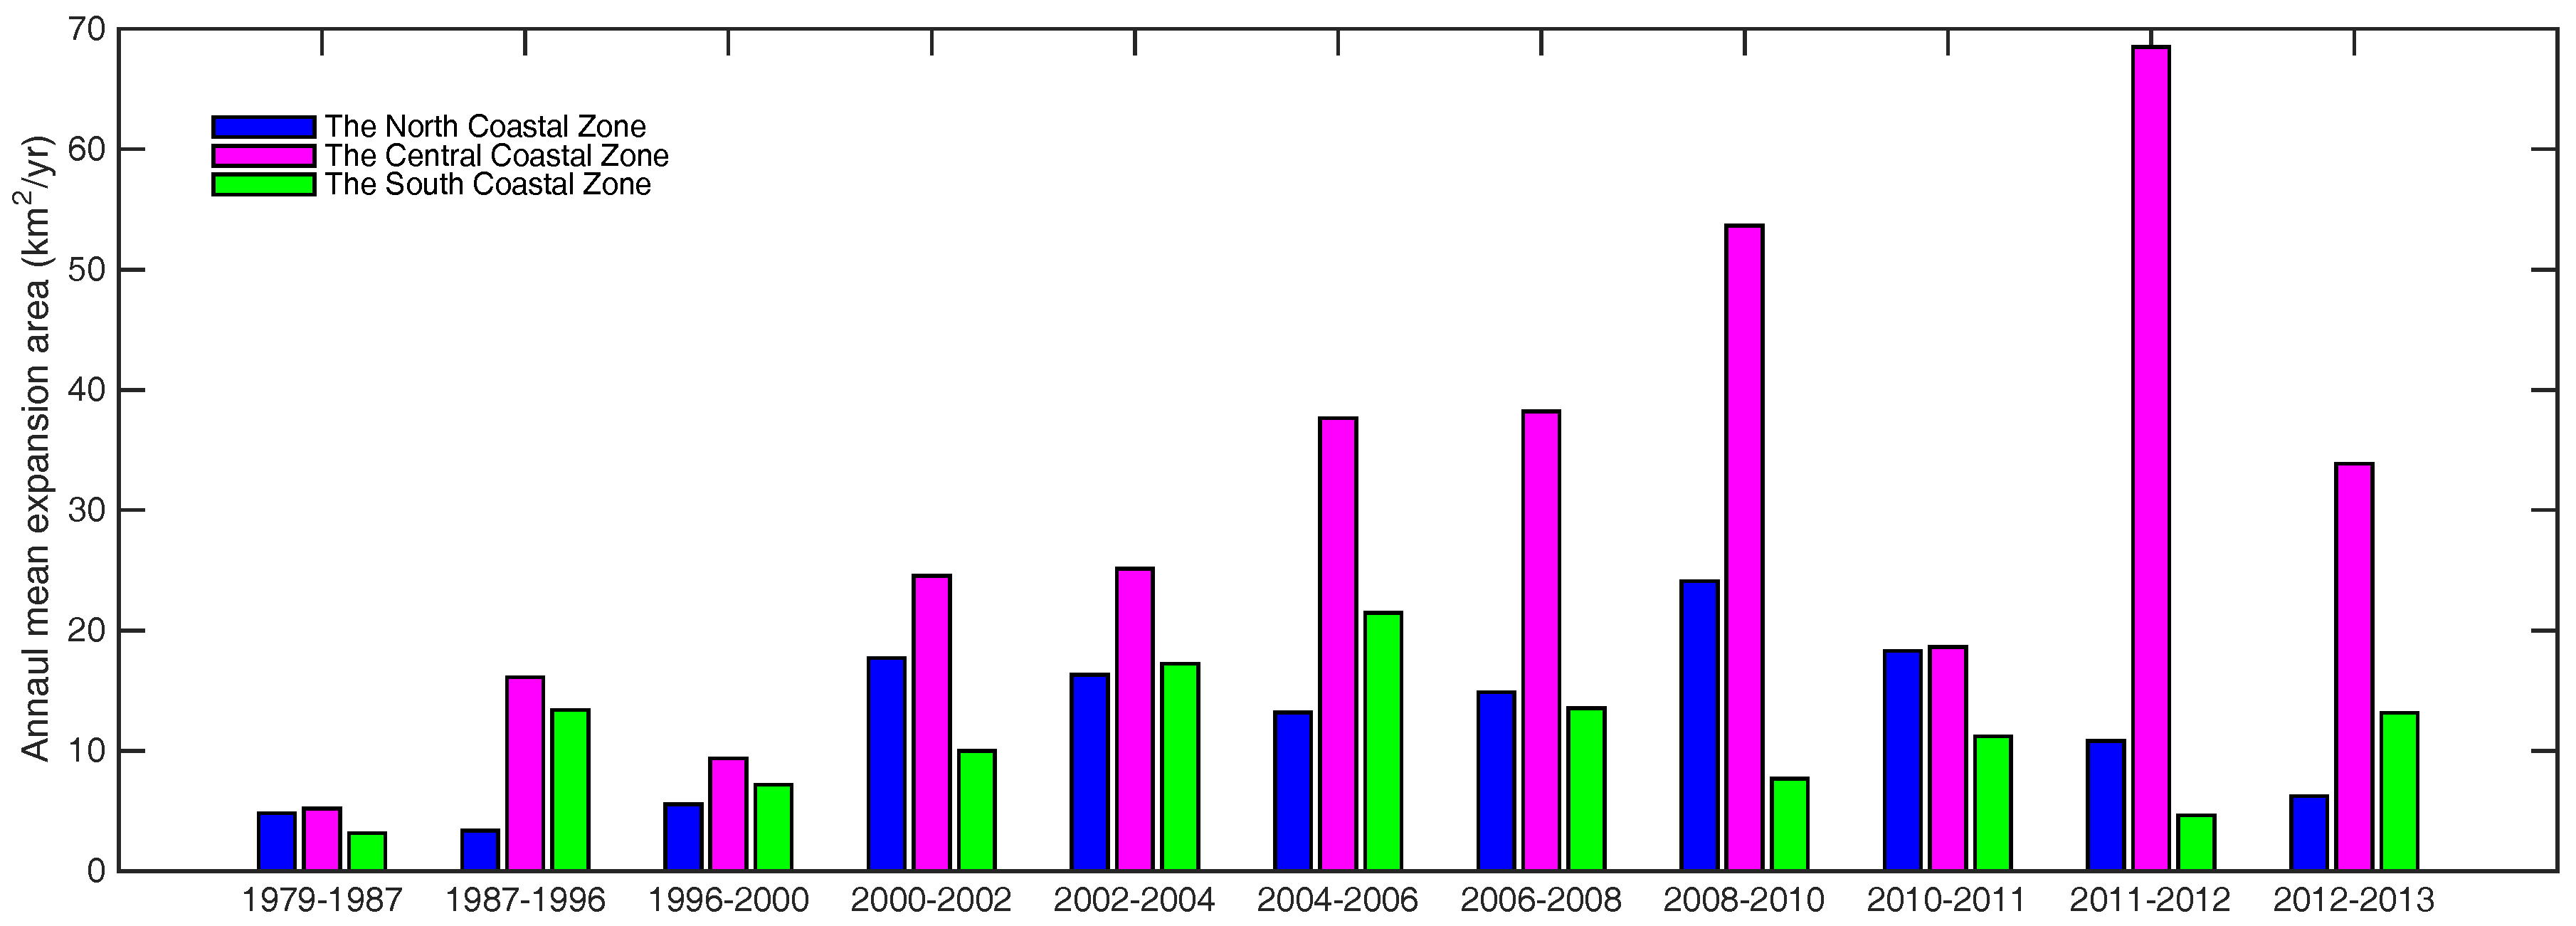
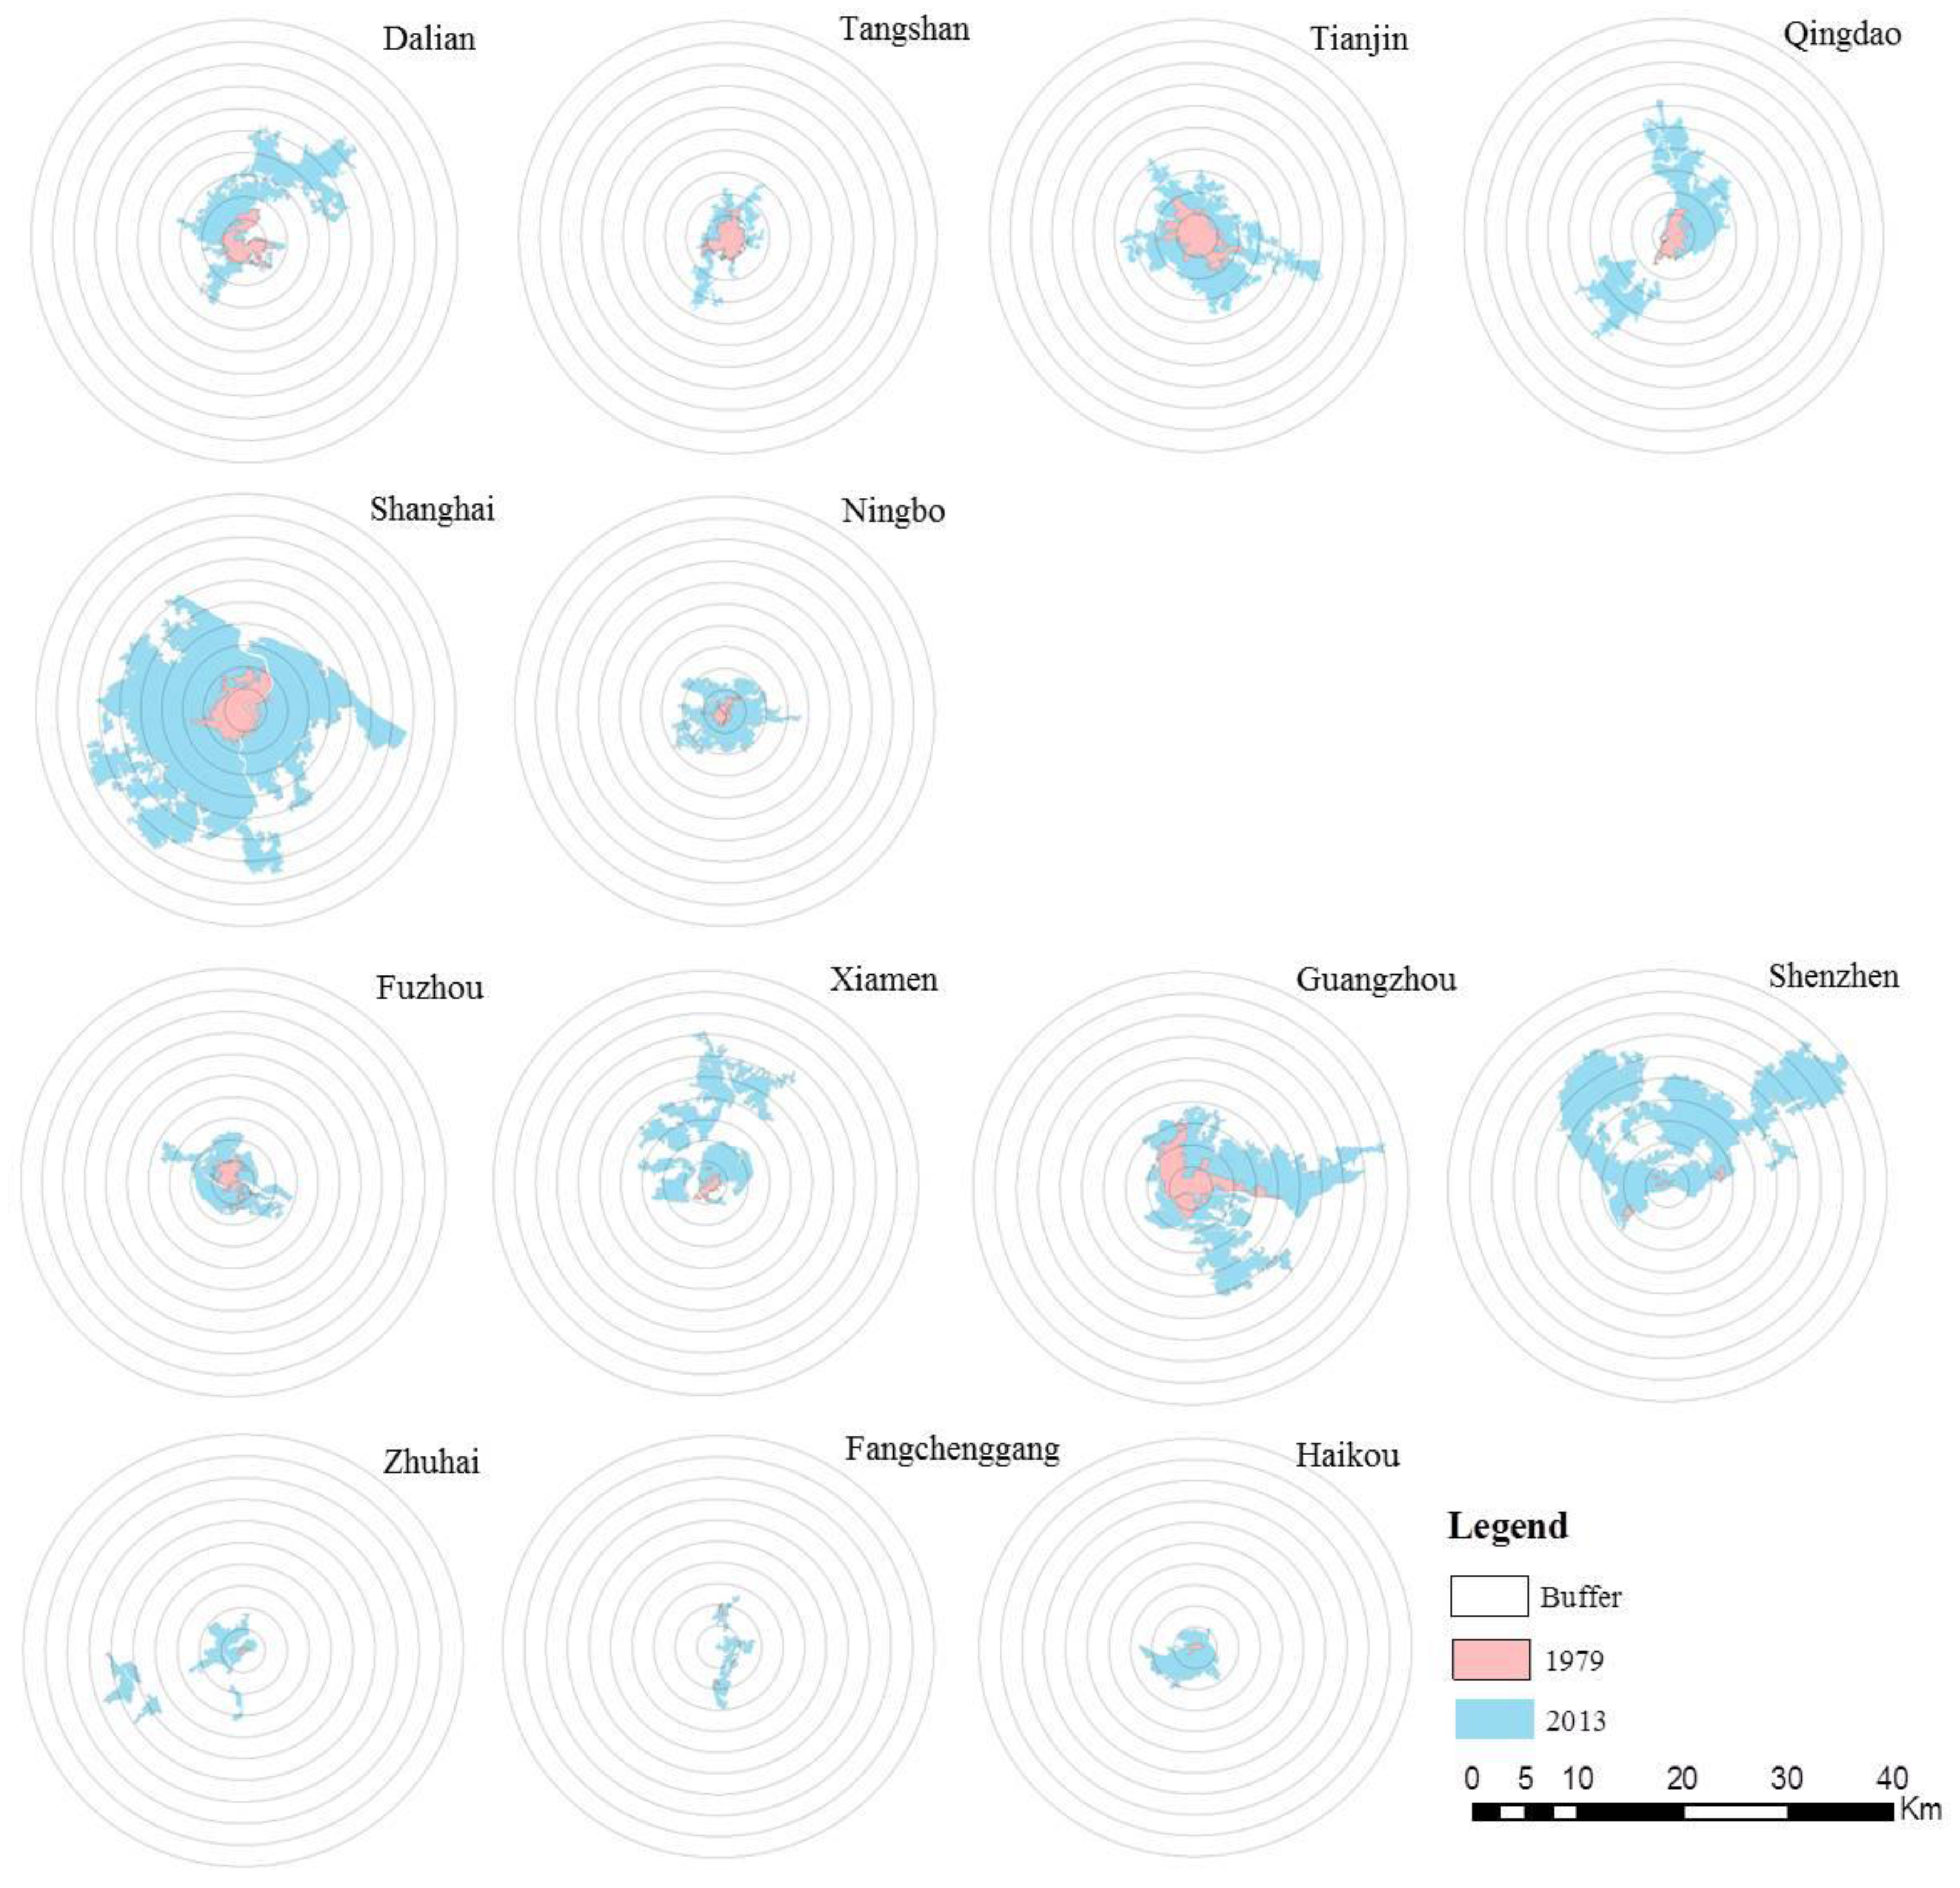
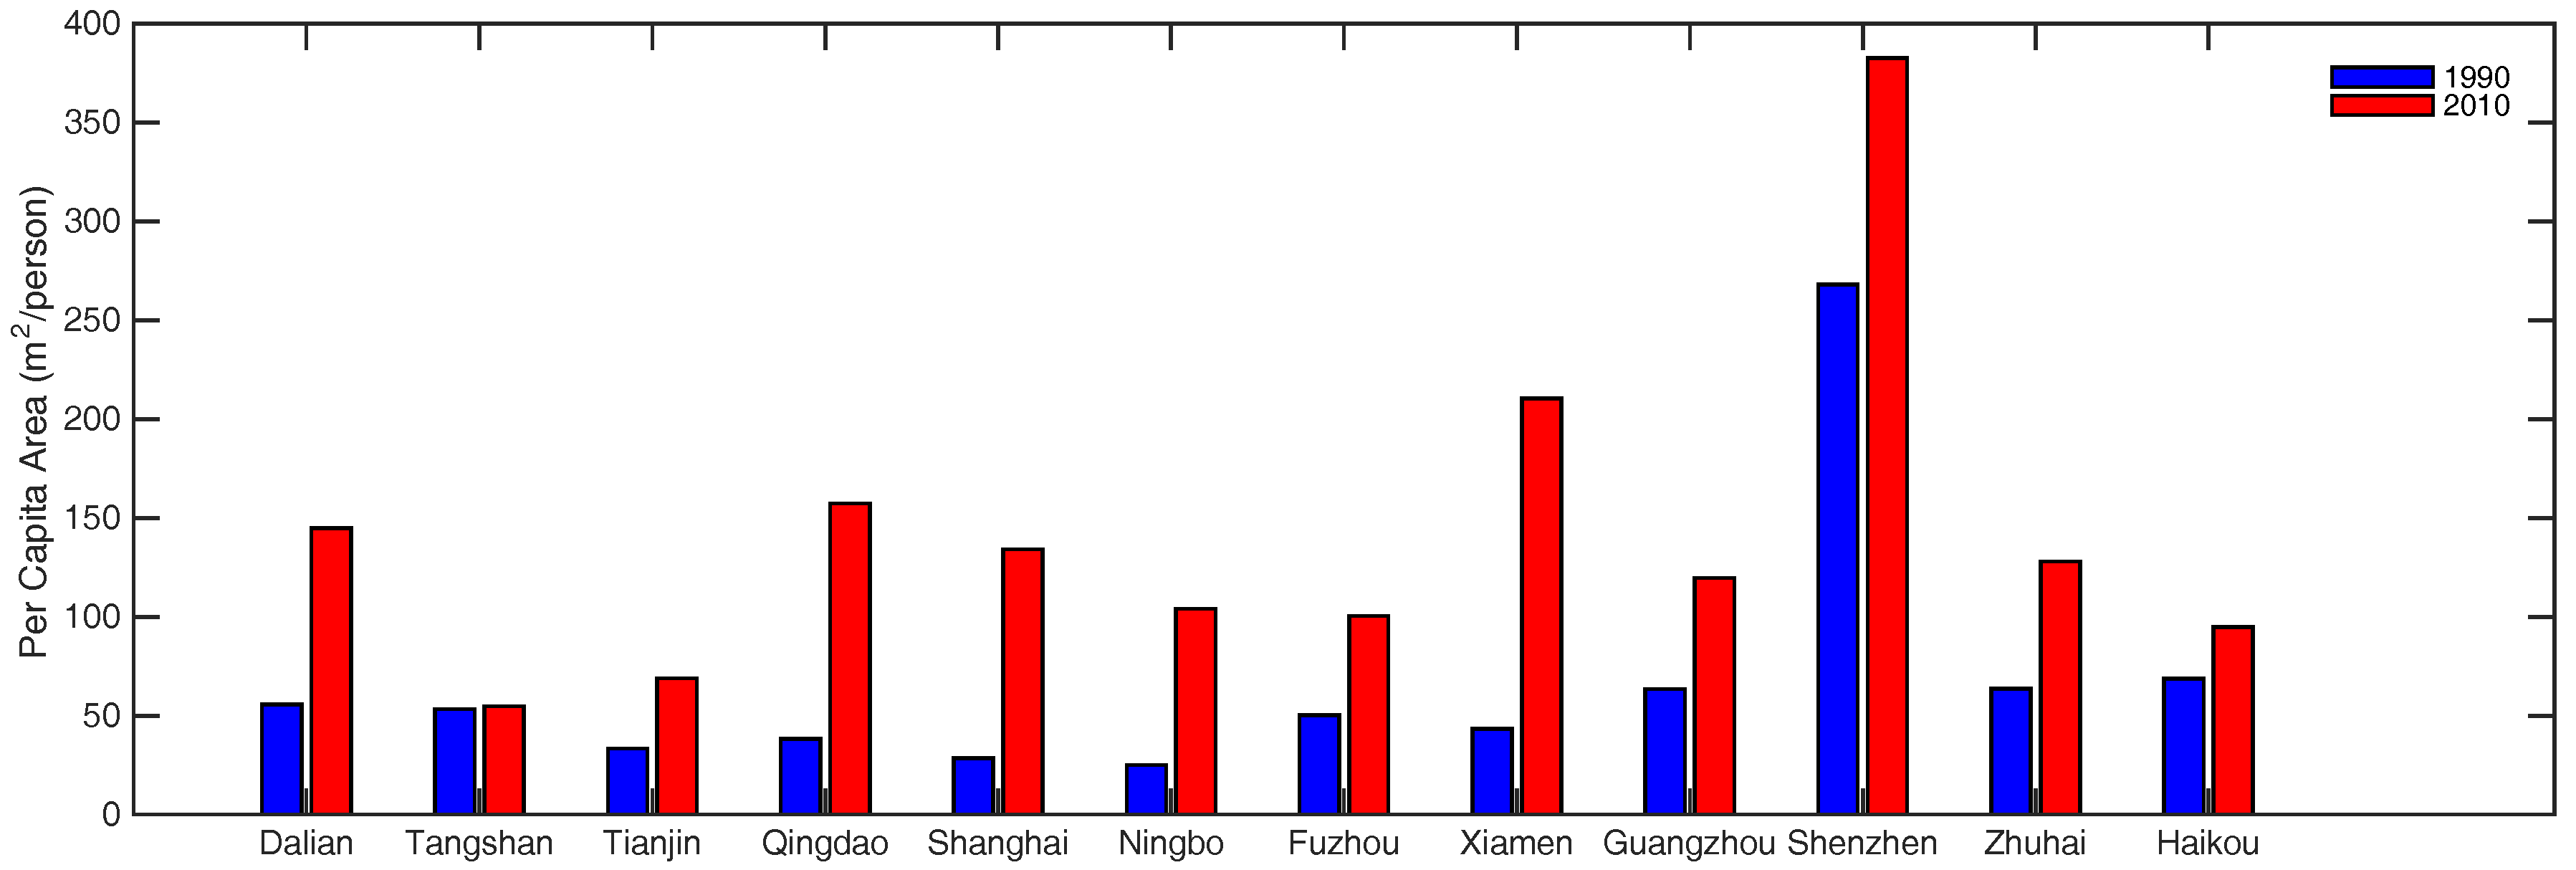
3.1. General Trends of Urban Sprawl in Port Cities

Urban sprawl can be displayed dynamically in space and time in Google Earth (Figure 3, schematic diagram only), with different colors representing the urban built-up area across the time period. There was an increasing urban trend in all 13 coastal cities from 1979 to 2013. The total urban area in these cities was only 703 km2 in 1979 and increased to 6922 km2 in 2013: an expansion of almost 9 times in less than 40 years, with an average annual growth rate of 183 km2. In 2013, Shanghai was the largest port city with an urban area of 2075 km2, and Shenzhen was the second largest port city with an urban area of 1054 km2. The urban areas of the other port cities were all below 1000 km2.
Figure 4 shows the overall growth in built-up area in all 13 coastal cities and the growth of that in each coastal zone. The total urban built-up area increased gradually from 1979 to 2002 (~105 km2/year), then accelerated between 2002 and 2010 (~396 km2/year). Urban sprawl slowed down since 2010, but remained at a relatively high level (~210 km2/year). That is, the urbanization process was fastest during the first decade of the 21st century in these coastal cities. Urban sprawl displayed different patterns when considering the three coastal zones separately. The urban area growth was accelerated in the south coastal zone earlier than the central and north coastal zones. This is possibly due to a policy giving priority to the development of the southeast coastal cities. Benefitting from the following comprehensive urbanization strategy, the urban area growth in the central and north coastal zones accelerated several years later than in the south coastal zone.
Different characteristics of urban sprawl are manifested in the three coastal zones shown in Figure 5. The annual mean expansion area (city average) in the central coastal zone was distinctly larger than those in the north coastal zone and the south coastal zone across all 11 periods, especially after 2000, with the exception of 2010–2011. The annual mean expansions were compatible in the north and south coastal zones, although their magnitudes were very different in some particular periods (e.g., 1987–1996 and 2008–2010). Generally speaking, there was an increasing trend of the annual mean expansion area in the central coastal zone until 2010, and then it started dropping. There was an extraordinary expansion in 2011–2012 in the central coastal zone, because Shanghai Pudong International Airport was included in urban built-up area and the surrounding rural settlements were occupied. On the other hand, the annual mean expansion peaked in the middle of the study period in both the north and south coastal zones.
Urban sprawl occurred at different paces among the coastal cities from 1979 to 2013 (Table 2). The annual mean expansion area indicates the speed of urban sprawl. Shanghai was the fastest-growing city with an urban area expansion of 38.40 km2/year. Relative expansion was calculated as the expansion area (from 1979 to 2013) divided by the initial urban built-up area (in 1979). The relative expansion was most dramatic in Shenzhen with urban built-up area increasing by about 85 times.

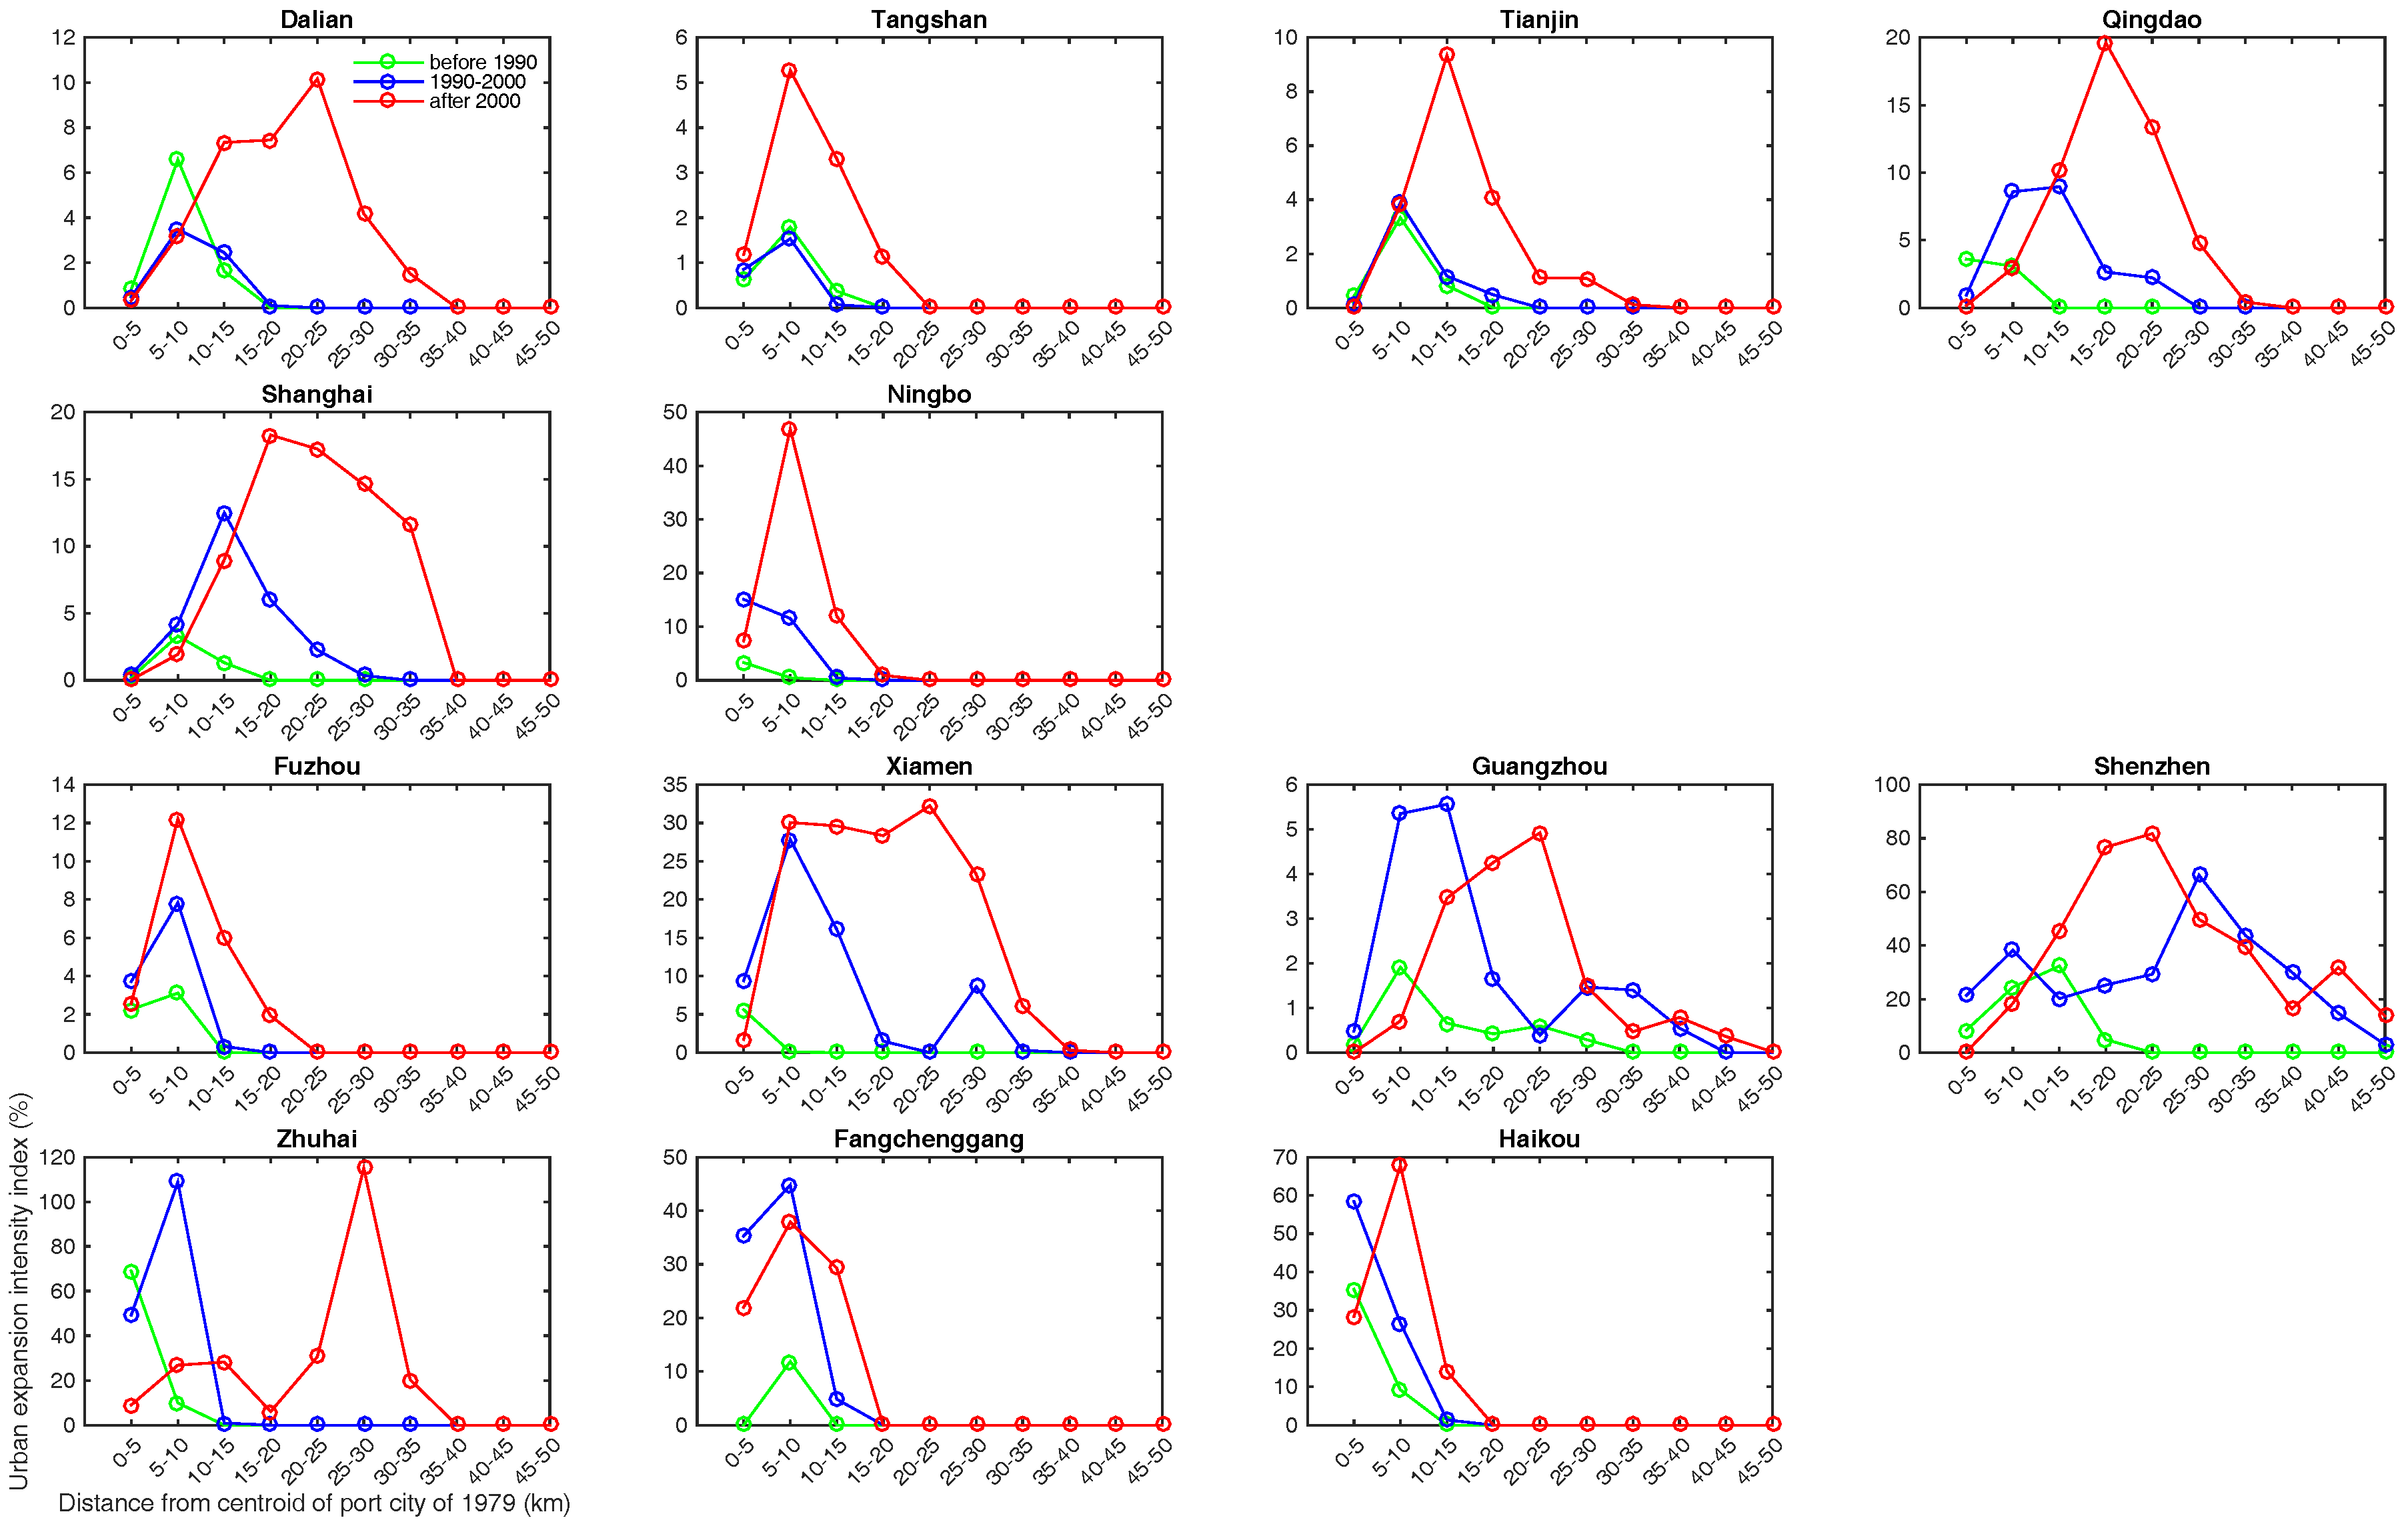
3.2. Analysis of Urban Dynamic Changes within Buffer Zones

Urban sprawl usually occurs from a town center outward to the suburbs according to a concentric structure. The ring theory has been widely used in studies on land use change, especially those related with urban sprawl [33,56]. Based on the ring theory and urban size, we take the center of each port city in 1979 as the center of a circle and create 10 buffer zones with equal radius (5 km) for each city with a total distance of 50 km from the center (Figure 6). These buffer zones are able to cover most of the urban built-up areas in the 13 port cities of China from 1979 to 2013.
The directional patterns of urban sprawl from 1979 to 2013 are different among the port cities. Urban sprawl occurred in all directions and followed the ring theory in Tianjin, Shanghai, Ningbo, and Fuzhou. Urban built-up area extended to the north and the south in Tangshan, Qingdao, and Fangchenggang, while the rest of the cities mainly displayed one-directional expansion. Specifically, the urban area was mostly expanded to the north in Dalian, Xiamen, and Shenzhen, to the south in Haikou, to the east in Guangzhou, and to the west in Zhuhai. The directions of urban sprawl were mostly affected by terrain, economic growth, and changes in land use policies and regulations [8,10]. For example, urban sprawl in Shenzhen was limited to the north as to the south of the city is ocean.
Figure 7 shows the relationship between the urban expansion intensity index and the distance from the center of each city in three decades of the study period (i.e., 1979–1990, 1991–2000, and 2001–2013). It allows us to identify the period and location that urban sprawl occurred most. Temporally, the most intense urban sprawl happened in the first decade of the 21st century in almost every city (represented by the red lines in Figure 7), especially in the cities of the north and central coastal zones. In some cities of the south coastal zone (e.g., Guangzhou, Shenzhen, and Zhuhai), urban sprawl displayed a similarly higher magnitude in the second and third decades in the study period. This is again related to the fact that the cities of the south coastal zone generally began their rapid development stage earlier due to the policy support. Spatially, urban sprawl generally happened most in the urban fringe. That is, the expansion intensity index was small around the urban center (the first buffer zone from city centroid), peaked in the urban fringe that varied in different time periods, and decreased as one moves further away from the center. Some cities (e.g., Qingdao, Ningbo, Haikou, etc.) displayed peaks of expansion intensity index in the first buffer zone from the city center (mainly in the first two decades), because urbanization was relatively low at the early stages and 5 km was too coarse for showing the peaks in the urban fringe. In general, the later the decade, the further (from the city center) the urban sprawl peaked and was extended. Among all the cities, Zhuhai, Shenzhen, and Haikou were the cities showing peaks of expansion intensity index larger than 50% in the last two decades of the study period.

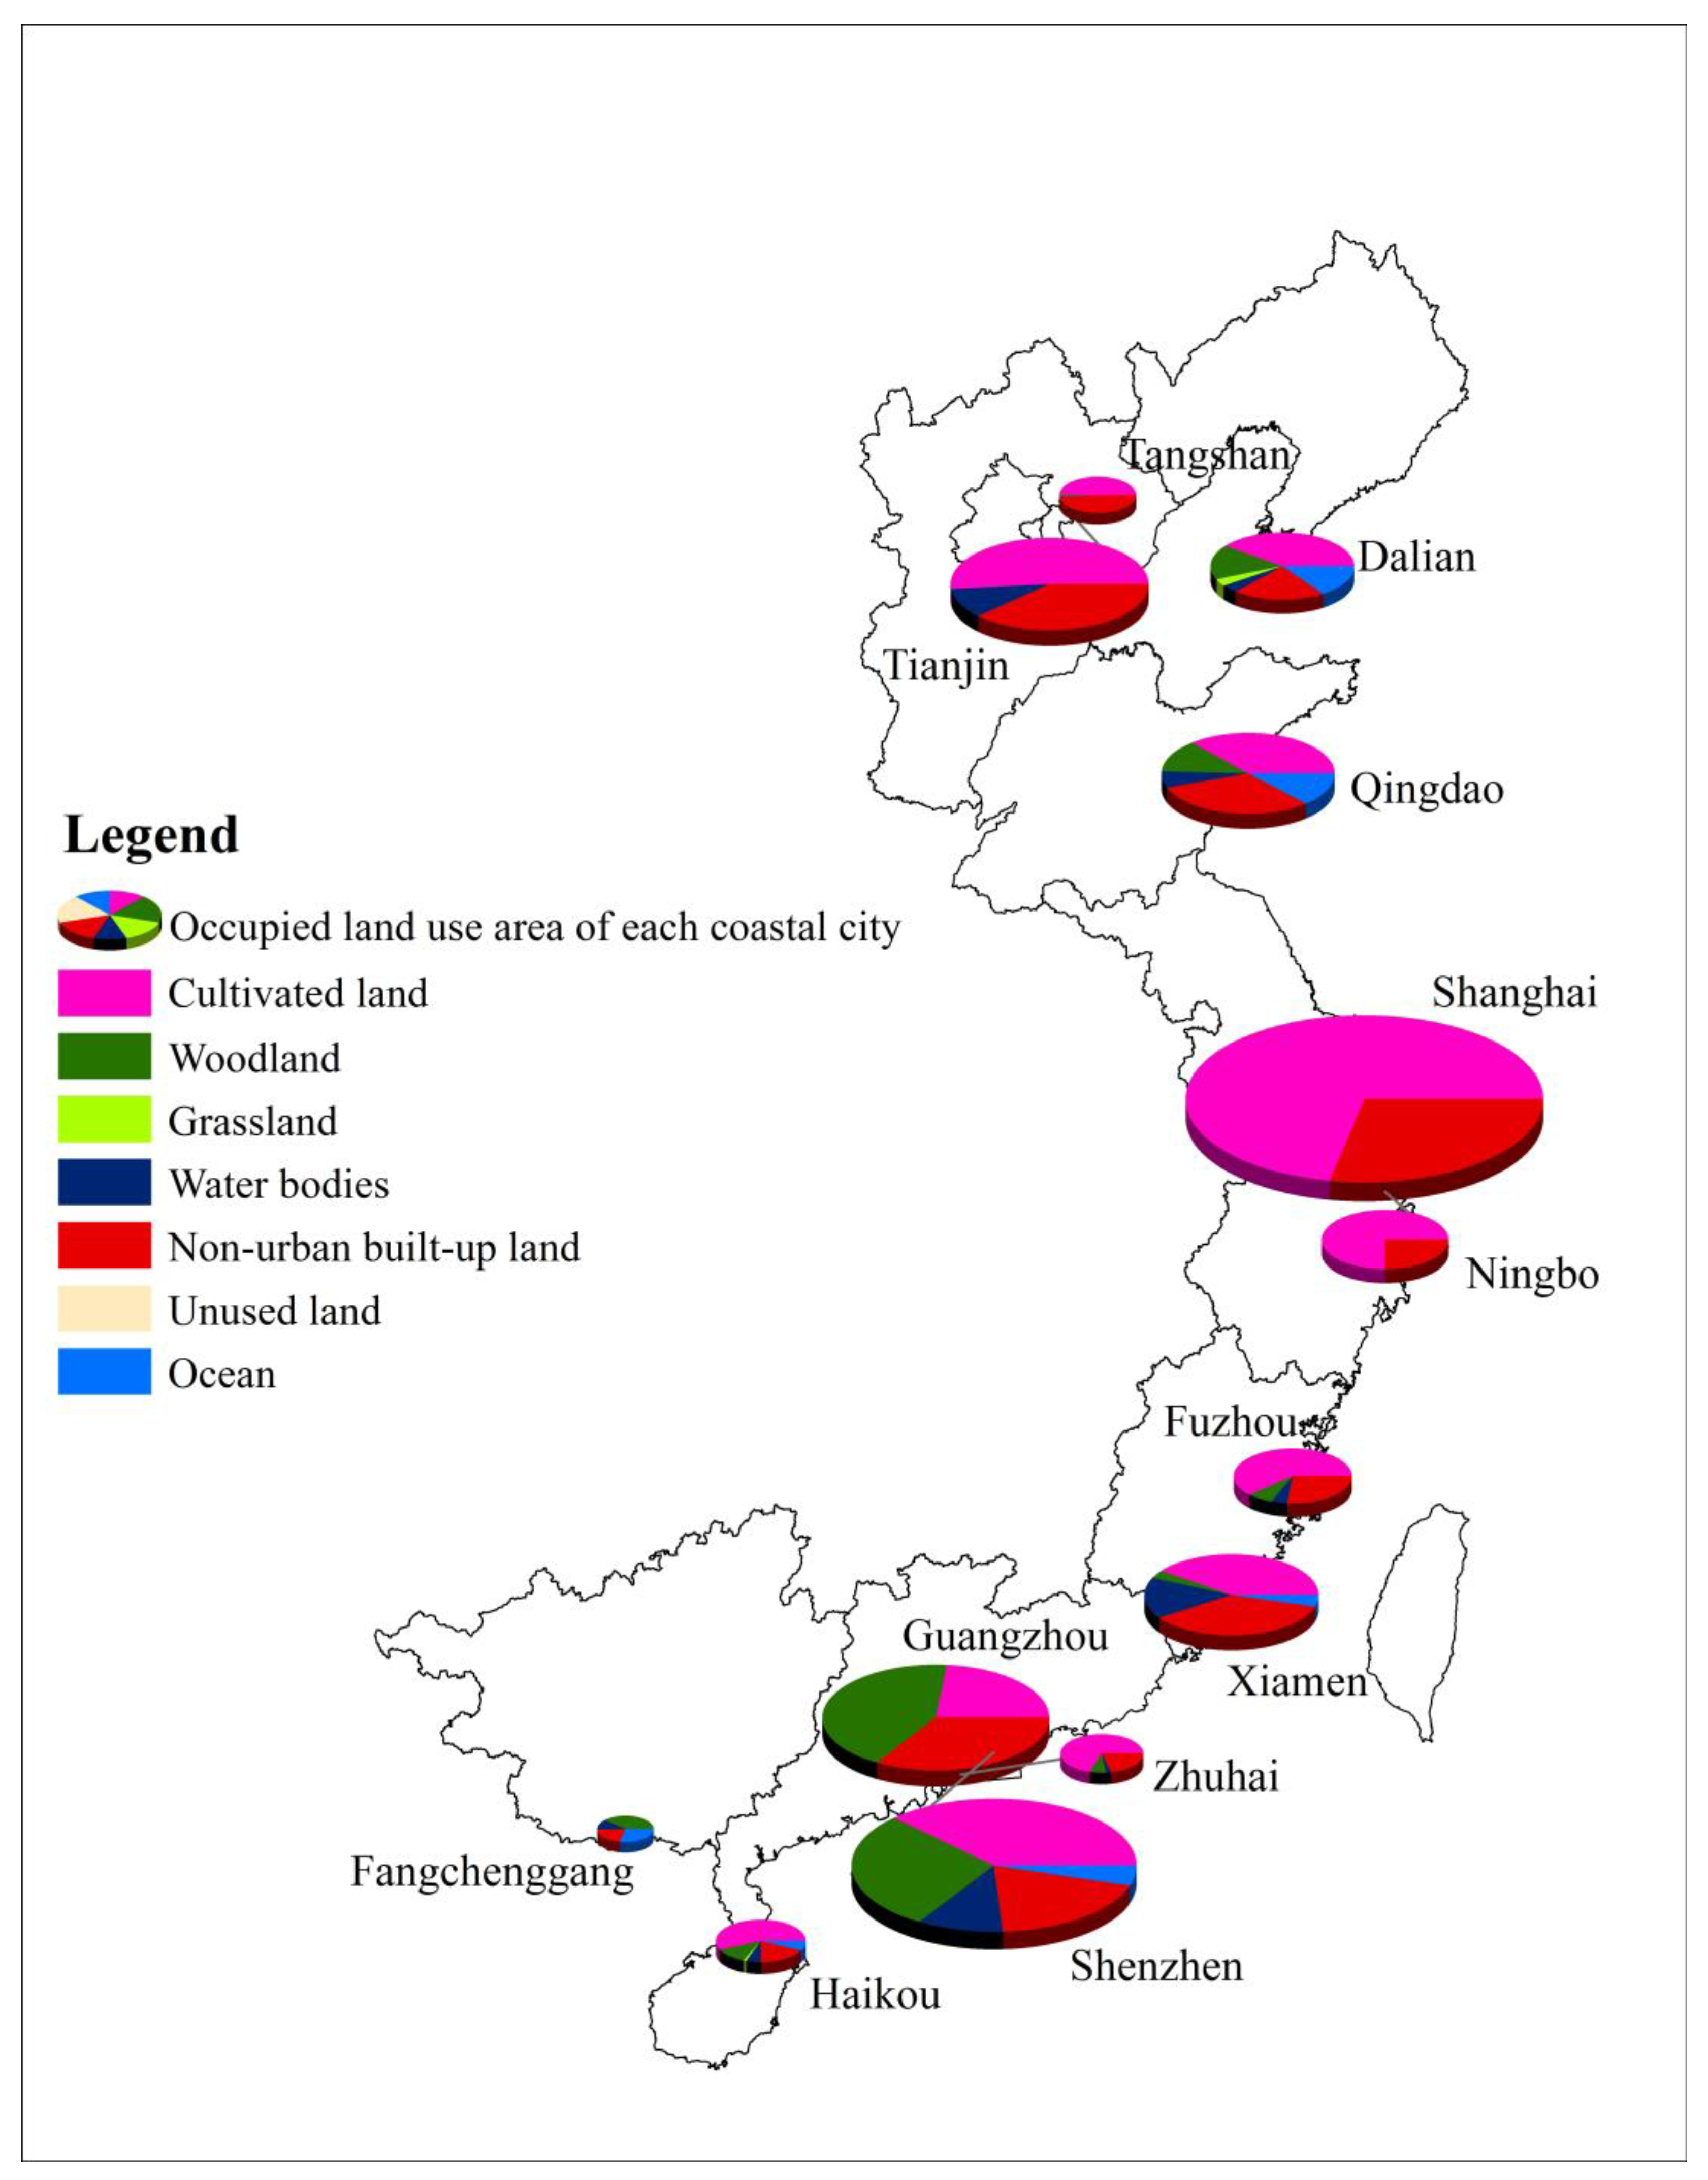
3.3. Urban Sprawl Impacts on Land Use Change

Urban sprawl could significantly influence the surrounding land. Based on the Chinese Academy of Sciences National Land Use Remote Sensing Classification Method, we divided land-use types (occupied by urban built-up area) into seven classes: cultivated land, woodland, grassland, water bodies, built-up land (excluding urban), unused land, and ocean. For convenience, we named the type of built-up land (excluding urban) as non-urban built-up land in this study. The definitions of each land-use type are documented in detail in Appendix A. The dynamic changes of land-use types are identified following the same image processing procedure documented in Section 2.2.
Figure 8 shows the portions of land-use types lost to urban sprawl in the 13 port cities from 1979 to 2013. Cultivated land lost the most areas (2497 km2) overall, accounting for 49.9% of total expanded urban area in all the cities. In addition, urban sprawl occupied 1504 km2 of non-urban built-up land, which accounted for 30.1% in the total. The remainder of the lost land was about 998 km2 and 20.0% of the total expanded urban area.
The percentages of land-use types lost to urban sprawl in each port city are given in Table 3. Cultivated land lost the most (more than 50%) among the land-use types in all cities except Guangzhou and Fangchenggang. Urban sprawl occupied only 22.37% of cultivated land in Guangzhou, and there was no loss of cultivated land due to urban sprawl in Fangchenggang. The non-urban built-up land was the second largest land-use type lost to urban sprawl in all cities except Shenzhen. The non-urban built-up land lost 20.07% in Shenzhen, lower than the loss of cultivated land and woodland.
Generally speaking, cultivated land and non-urban built-up land were the two major land-use types that lost to urban sprawl. The total loss of the two land-use types was around or above 60% in every port city except Fangchenggang. In addition, woodland and water bodies were lost in relatively large magnitude in these port cities. In Fangchenggang, there was no loss of cultivated land (no cultivated land at all in this city) but a great amount of woodland (about 41%) and ocean (about 30%) occupied by urban built-up area.
Figure 9 shows the areas of land-use types lost to urban sprawl in the three coastal zones. Again, cultivated land and non-urban built-up land were the dominant land-use types lost to urban sprawl in all three coastal zones. In the coastal cities, they were also the most important land-use types for human livings. The woodland lost a relatively large amount in the south coastal zone, which was possibly due to the fact that forest resources are mainly distributed in the southern coastal area. In addition, there were some portions of water bodies and ocean lost in the north and south coastal zones, but nearly none in the central coastal zone. This indicates that urban sprawl led to the loss of wetland resources in the north and south coastal zones.

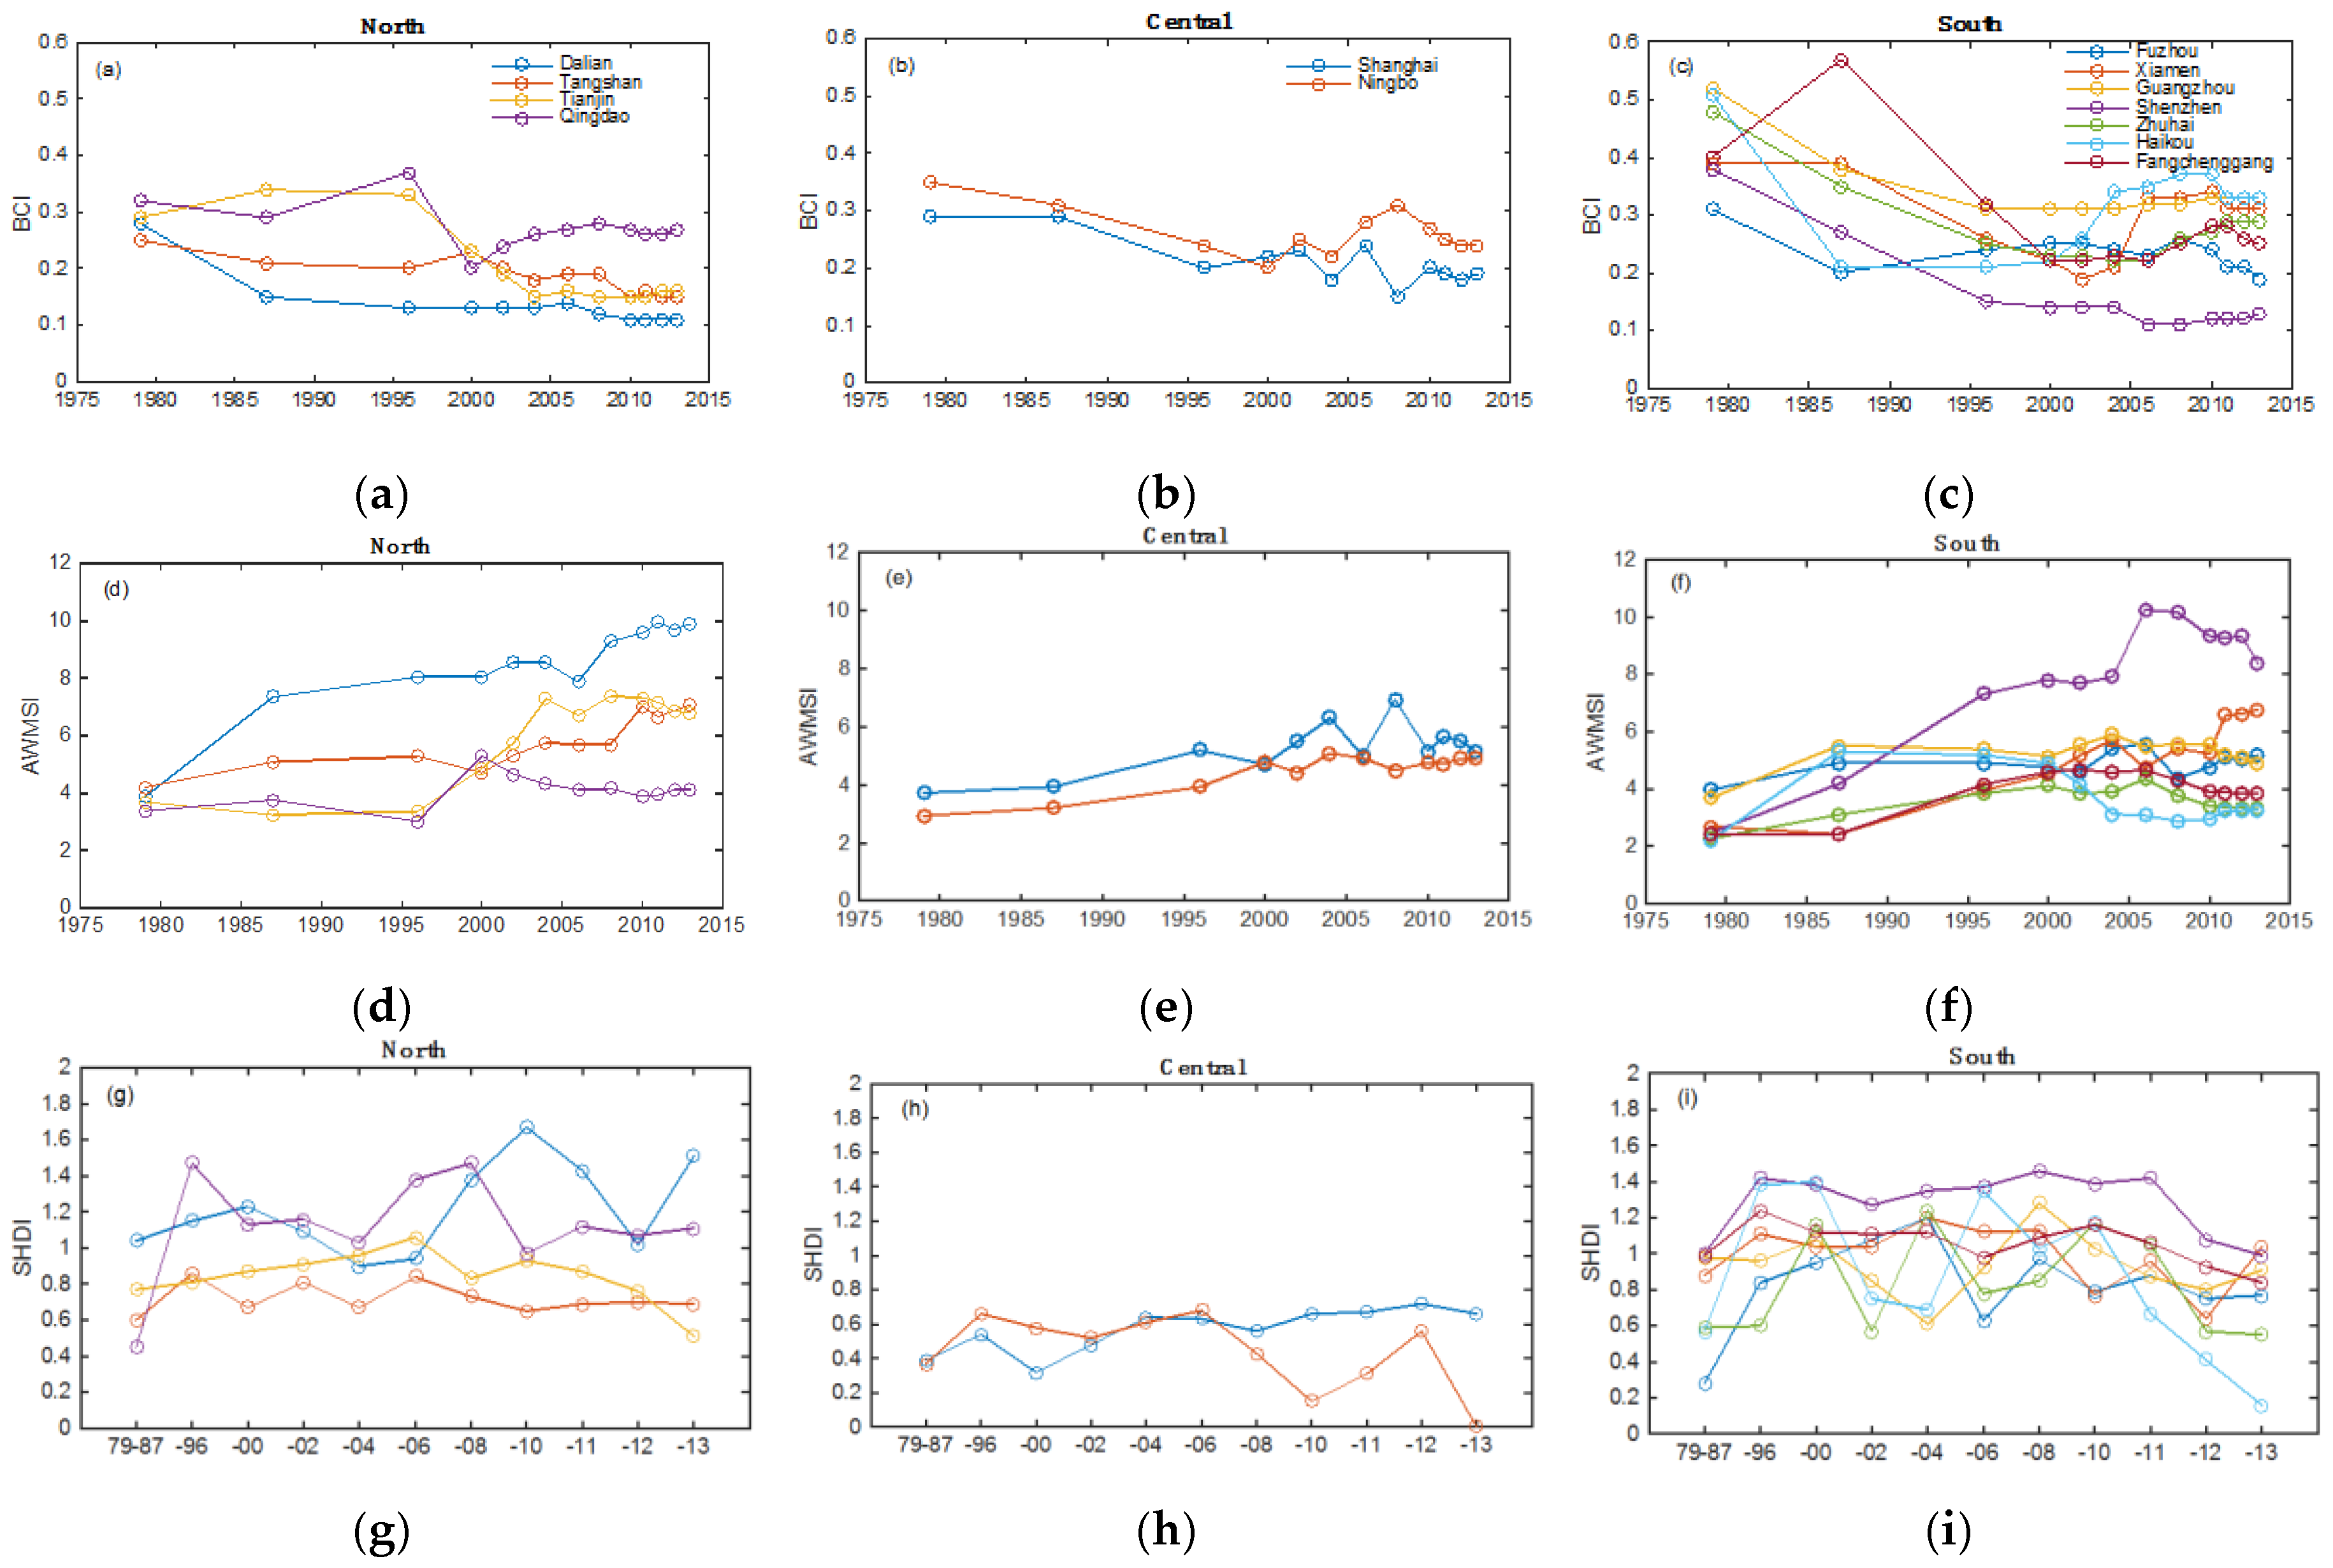
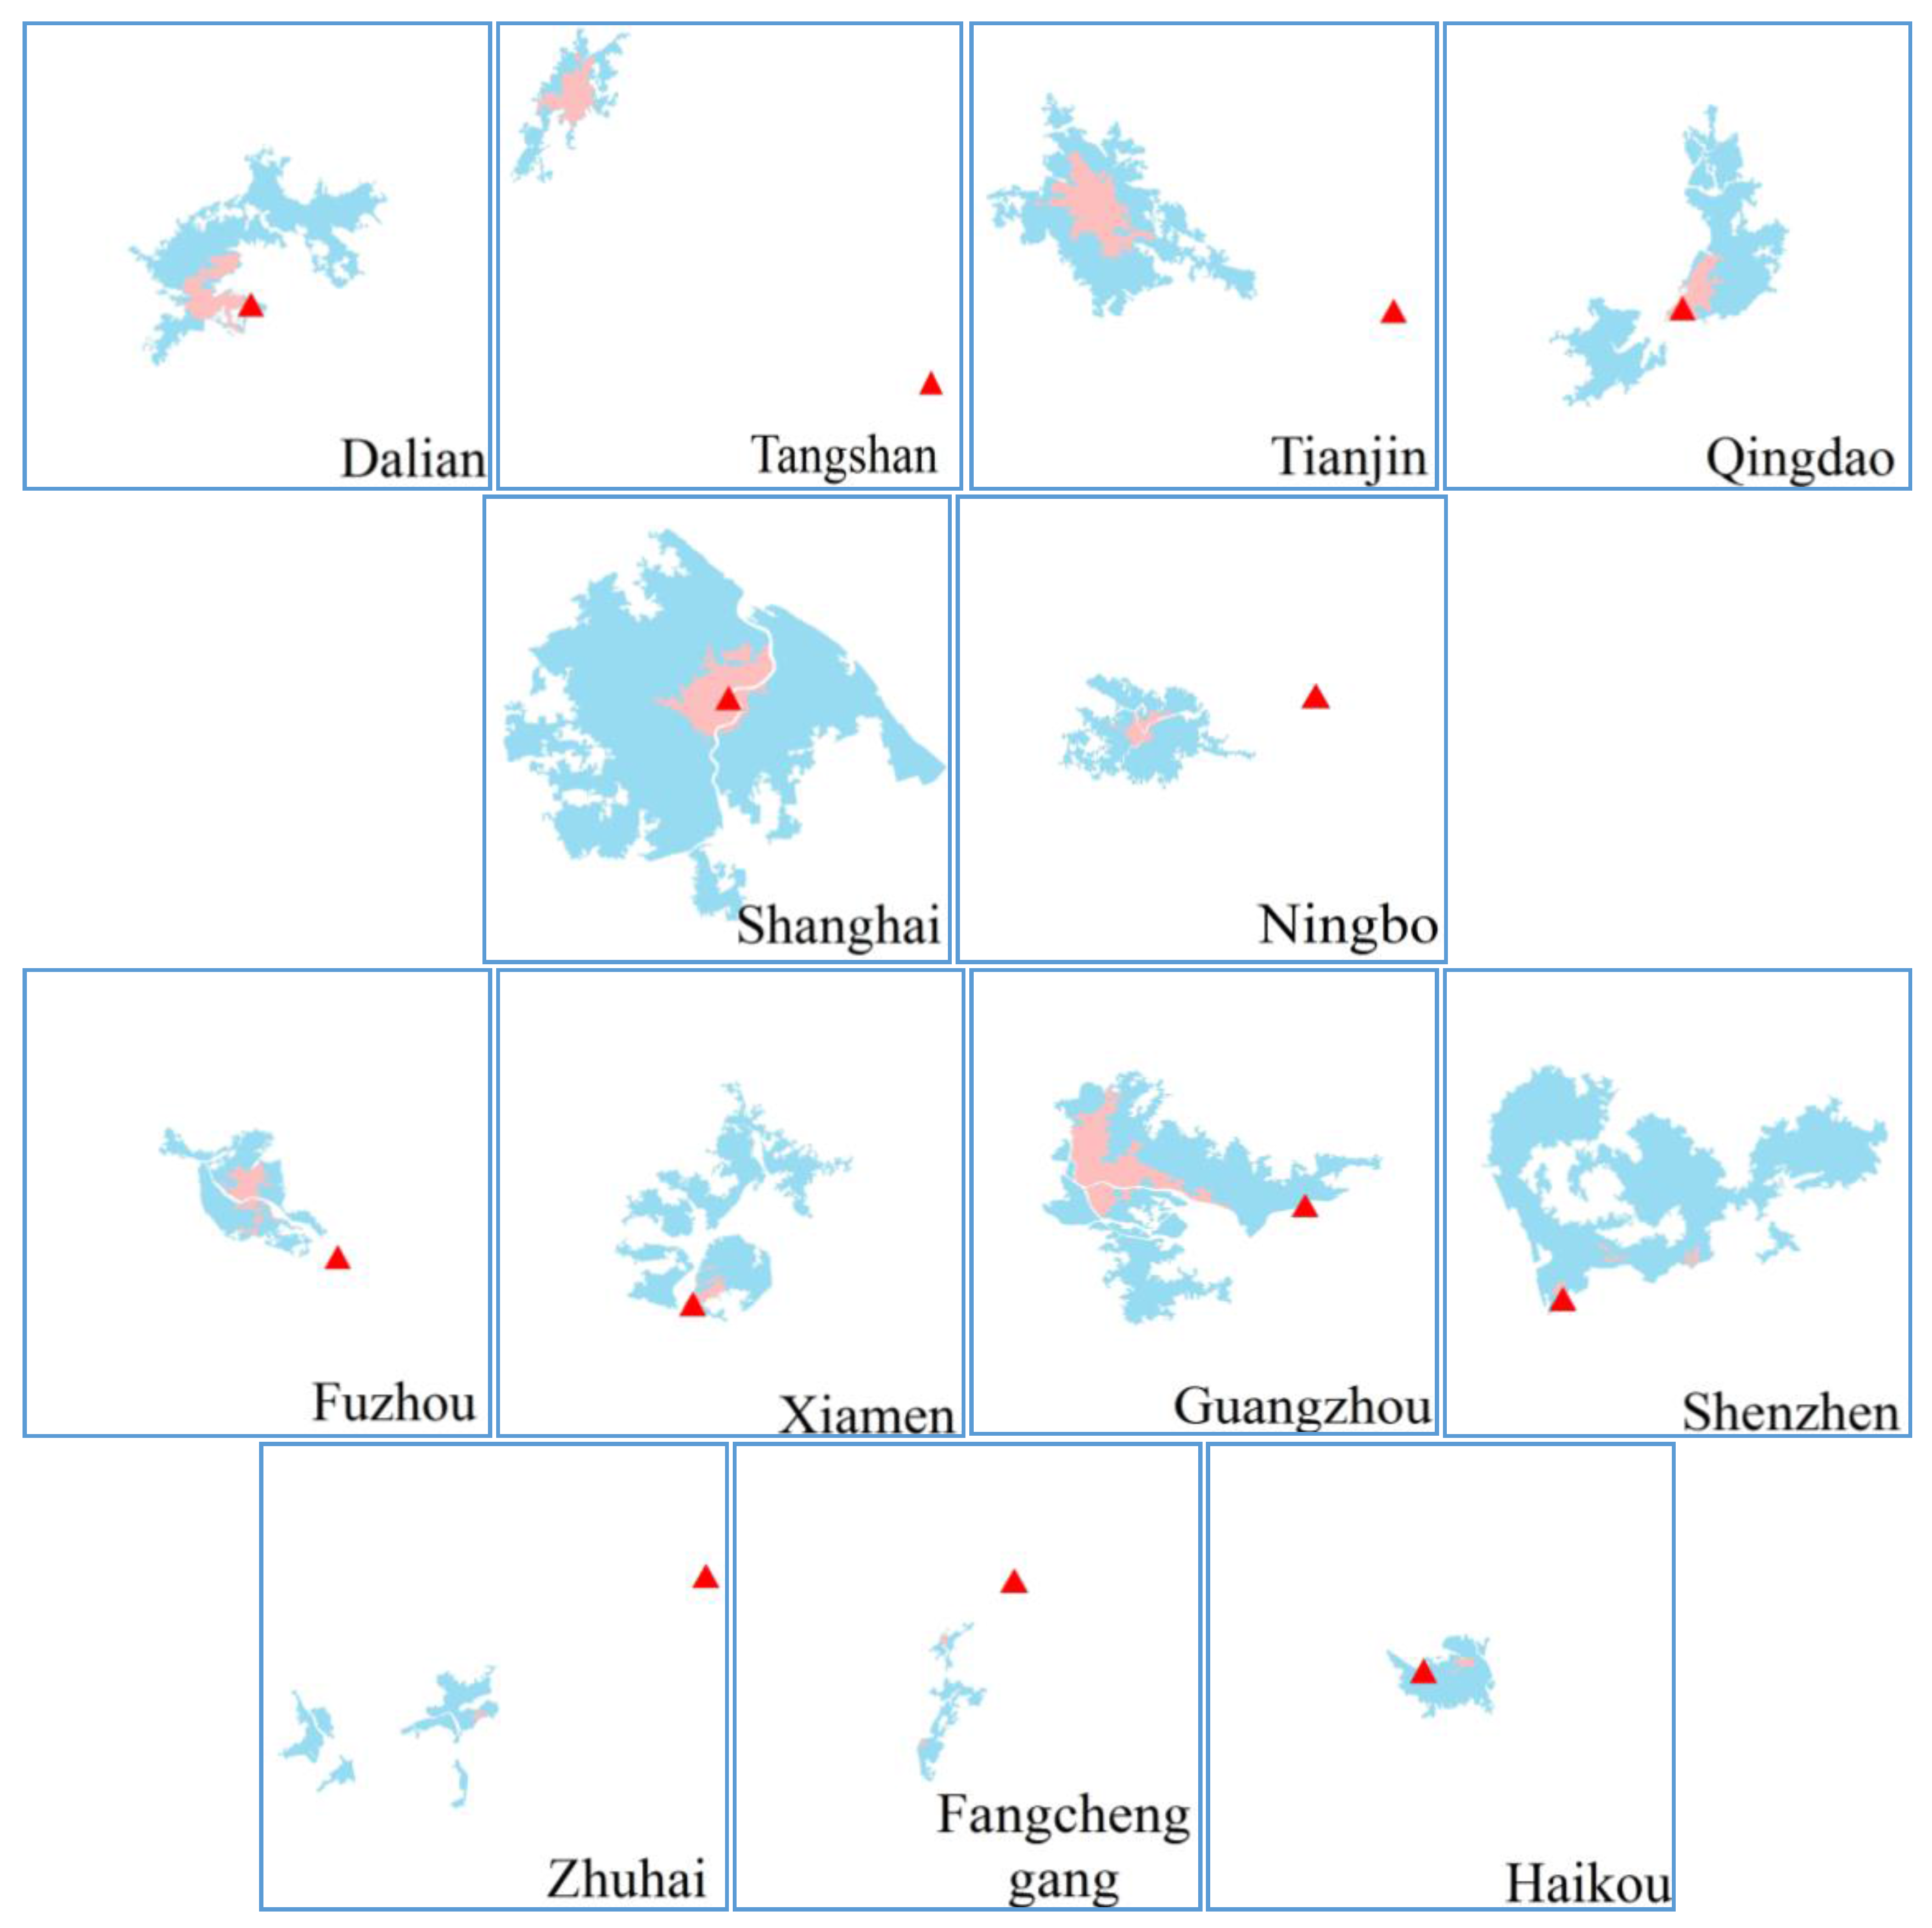
3.4. Characteristics of Urban Forms

Urban sprawl affects the complexity of urban forms. As urban built-up area changed dramatically, the shape of the urban area has changed accordingly, which was reflected in the landscape metric of BCI (Figure 10a–c) and AWMSI (Figure 10d–f) in the three coastal zones. Overall, there was an increasing (decreasing) trend of AWMSI (BCI) in the port cities from 1979 to 2013, meaning the urban shapes became more irregular (less compactness) through the study period. Specifically, AWMSI increased dramatically from 1979 to 2000, and then increased slowly, oscillated, or decreased after 2000. BCI displayed similar pattern behaviors but the opposite trend. The faster increase of AWMSI (or decrease of BCI) before 2000 indicates that urbanization had not been strictly following urban planning and has been developing in an extensive way at the early stage. Since then, urban sprawl has become more standardized and orderly, as reflected by the smaller variability of AWMSI and BCI. In addition, the smaller variability of AWMSI and BCI are partly due to the change in the urban sprawl pattern (i.e., increase of patch embedding).
In the north coastal zone, Dalian displayed the highest irregularity and lowest compactness (Figure 10a,d). In addition, AWMSI kept increasing at the relatively fast rate even after 2000. Qingdao had the lowest shape irregularity and highest compactness with nearly no variability of AWMSI and BCI after 2000. In the central coastal zone, Shanghai and Ningbo had relatively similar magnitudes of AWMSI and BCI through the time period (Figure 10b,e). In the south coastal zone, Shenzhen stood out as having the highest irregularity (largest AWMSI) and lowest compactness (smallest BCI) nearly all the time (Figure 10c,f). This was possibly related with the largest relative expansion in Shenzhen among all port cities (see Table 2).
Urban sprawl could occupy many landscape types at the same time. SHDI was used to show the diversity of landscape types lost to urban sprawl (Figure 10g–i). In general, SHDI were lower in the central coastal zone than the north and south coastal zones, implying that there were more landscape types lost to urban sprawl in the north and south coastal zones (also seen in Figure 8). Within the north coastal zone, Dalian and Qingdao displayed larger values and higher temporal variability of SHDI than those in Tangshan and Tianjin. In the central coastal zone, SHDI in Shanghai was comparable to that in Ningbo, but with much less temporal variability in the second half of the period. Most cities in the south coastal zone displayed larger temporal variability of SHDI. Again, Shenzhen lost more landscape types to urban sprawl than the other cities in the south coastal zone, which was indicated by the largest SHDI in Shenzhen.
To summarize, the urban built-up areas in these coastal cities became more irregular and less compact in general through the study period, while their impacts on other landscape types were not significantly alleviated. The compactness and irregularity of urban built-up areas play a big role in terms of traffic efficiency, energy use, and quality of life in modern cities [57]. For example, a lack of compactness and regularity will lower the efficiency of urban infrastructure and increase transportation costs. It is important to take into account the regularity of urban form and urban sprawl impacts on other landscape types in urban planning in order to achieve the goal of sustainable development.

4. Discussion

4.1. Policies and Urban Sprawl

Urban land use planning, managements, and policies are essential in analyzing urban sprawl [58]. When China implemented its famous “open door” policy in 1979, the planning-oriented urban land use policy was transformed into a market-oriented policy serving the purpose of economic efficiency improvement [59]. Since 1987, land reform re-introduced land values in China through land leasing and charging land use fees. As a result, the property market was created, which stimulated housing construction [8,29]. In order to provide legal guidance, the government announced ‘‘The Provisional Regulation on the Granting and Transferring of the Land Rights over State-Owned Land in Cities and Towns’’ in 1991. Thus, land users can rent and transfer land use rights [60]. Following the promulgation and implementation of these land use policies, China stepped into a faster stage of urbanization, especially in coastal areas.
From 1979 to 1990, China went through an imbalanced development stage, with the focus mainly on Eastern China. In this period, special economic zones (SEZs) were established, which covered a few provinces in the south coastal zone. The port cities opened up to the world for the first time. The coastal zones remained the foremost development regions, although Central and Western China have attracted more attention since 1991. After 1998, China has undergone comprehensive development following the strategies of “Western Development Program,” “Northeast Area Revitalization,” and “Rise of Central China Plan” [61]. Accordingly, urban sprawl was accelerated in the south coastal zone earlier than the central and north coastal zones due to a policy giving priority to the development of the southeast coastal cities. The urban area growth in the central coastal zone was mainly contributed by the built-up of Shanghai Pudong New Area in the 1990s. The benefits of the “Northeast Old industrial Base Reconstruction” policy expedited urban sprawl in the north coastal zone in the early 21st century.
The coastal zone has been a key point in national evolution. Urban sprawl was persistent overall in port cities from 1979 to 2013 because of favorable development policies. The sprawl increased dramatically until 2010 and then slowed down in order to match the urbanization and economic levels to those of China as a whole. Urban sprawl led to the loss of much farmland and non-urban built-up land before 2010. Zhang (2000) [62] indicated that the rapid growth of urbanized areas in China resulted in the loss of cultivated land, especially the cultivated land in the city fringe with the most agricultural productivity and best accessibility to the market. Benefitting from the “Basic Farmland Protection Regulations,” a large amount of agricultural land and woodland was protected after 2010. It also made urban form less irregular and land-use types more diverse [9,37,63]. Previous studies either reported such results qualitatively or gave the overall changes in a roughly quantitative way. Our study described the spatiotemporal changes of urban sprawl dynamically and their impacts on the cultivated land and other land use types in a detailed manner.

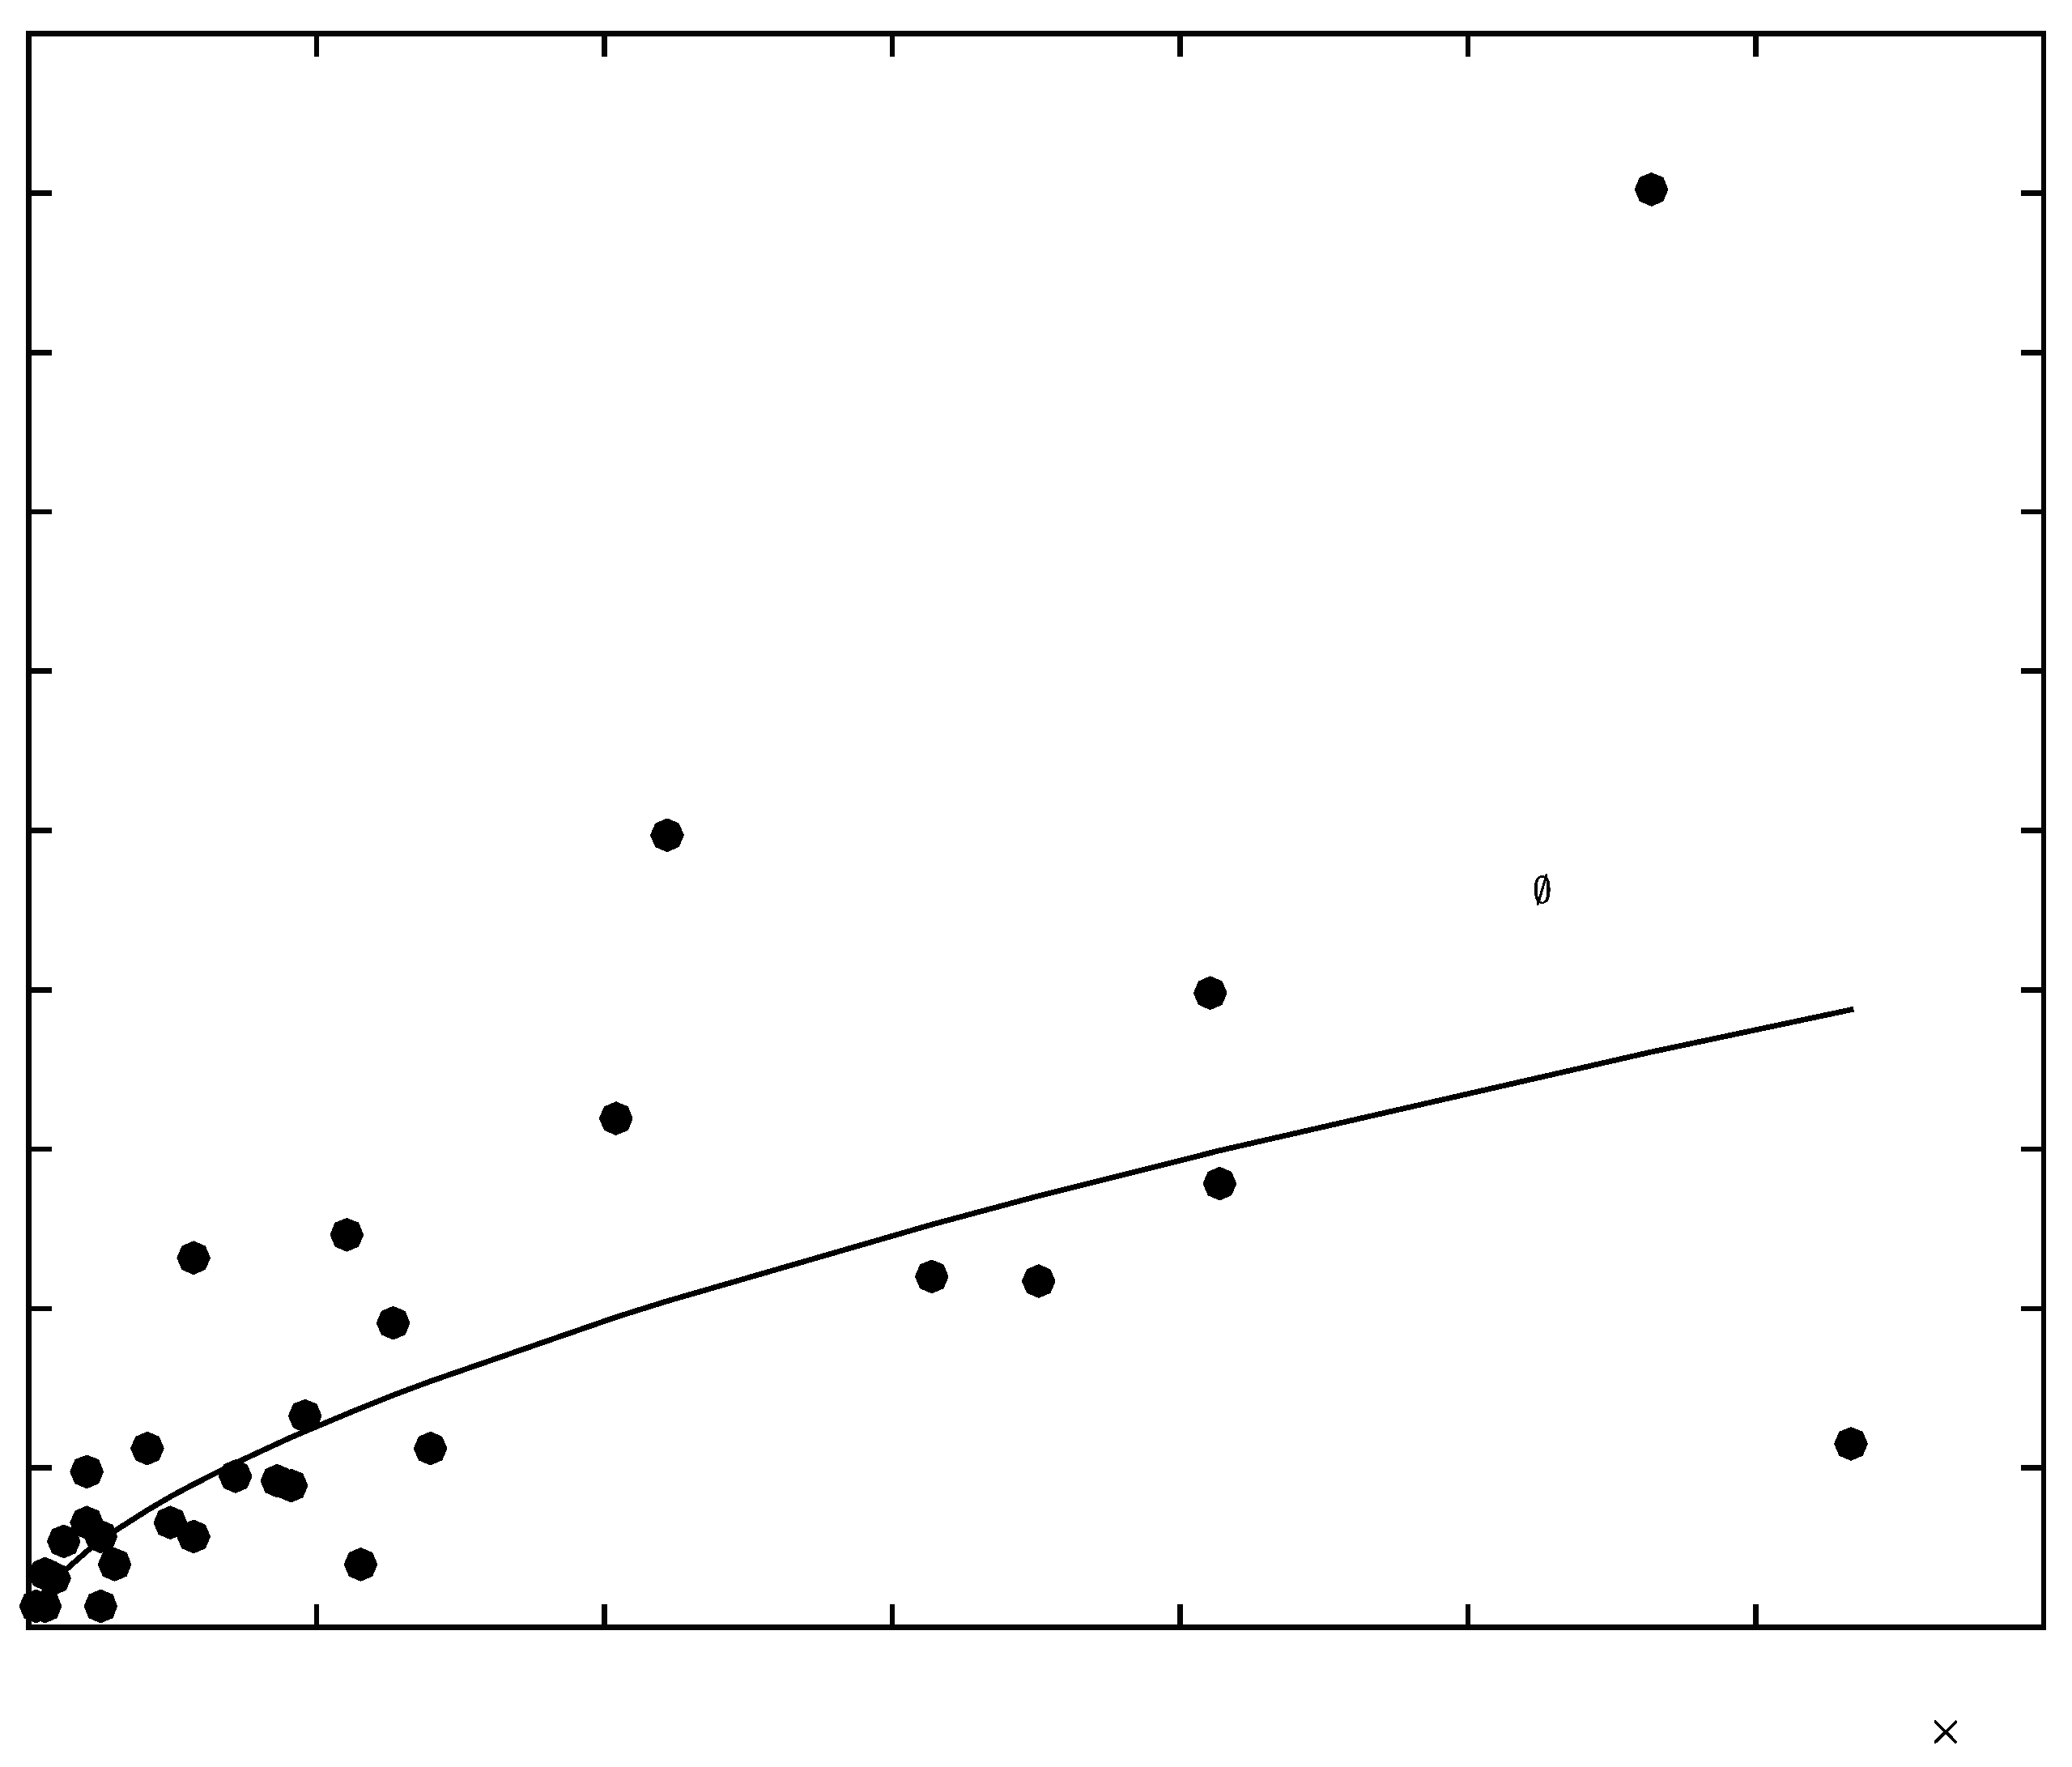
4.2. Urban Sprawl and Economic Development

An important feature of urban development in recent decades is that urban sprawl and urbanization are heavily dependent on economic development and globalization [64]. Figure 11a displays the GDP of all port cities in 1990 and 2010 except Fangchenggang (lack of data). The GDP increased dramatically in all cities from 1990 to 2010, especially in such bigger cities as Shanghai, Guangzhou, Shenzhen, and Tianjin. As the largest port city, Shanghai displayed the biggest increase of GDP, over 1.5 trillion Yuan. Guangzhou, Shenzhen, and Tianjin showed the second largest increase of GDP, with over 800 billion Yuan but less than 1000 billion Yuan. The increase of GDP in the rest of the coastal cities was lower than 400 billion Yuan. The economic growth is well correlated with urban sprawl, with R2 about 0.9 (Figure 11b). It is reasonable that the development of the economy requires more urban built-up area for infrastructure, transportation, factories, living places, etc.
The utilization efficiency of urban land is possibly affected by urban sprawl and economic growth. Per capita area is generally used to account for the utilization efficiency. Figure 12 displays the per capita area of each port city in 1990 and 2010. In 1990, the per capita area was under 100 m2 in all cities except Shenzhen (about 268 m2), while it was under 100 m2 only in Tianjin, Tangshan, and Haikou in 2010. This implied that the utilization efficiency of urban land decreased (as indicated by the increase of per capita area) along with urban sprawl from 1990 to 2010 in the 13 port cities. Among the port cities, Shenzhen displayed the lowest utilization efficiency (the highest per capita area) during the process of urban sprawl from 1990 to 2010. Shenzhen was initially a small county and then changed to a special economic zone after 1979. It had unique characteristics and the highest per capita area in both 1990 and 2010.
In 1990, the per capita area was 45.22 m 2 , 26.73 m 2 and 92.96 m 2 in the north, central, and south coastal zones, respectively, which increased to 106.47 m 2 , 119.13 m 2 , and 172.69 m 2 respectively in 2010. From 1990 to 2010, the land utilization efficiency decreased in all three coastal zones, with the central coastal zone displaying the largest degradation (an increase of more than four times in per capita area).
Chinese port cities have experienced unprecedented development under the reform and opening-up policy and possess the highest urbanization and economic development levels in China. Chen et al. (2014) studied the provincial pattern of the relationship between urbanization and economic development in China using the urbanization rate (the proportion of urban population to total population) and per capita GDP, which indicated that the coastal regions of municipalities are over-urbanized because of the prominent advantages of policy endowment and development conditions [65]. The demographic data, however, sometimes lack accuracy in describing the characteristics of urbanization. Based on the physical and dynamic changes of urban sprawl instead, our study more accurately demonstrated the dependence of urbanization on the economic development and illustrated the lower utilization efficiency of urban land during the process of urban sprawl by exploring the relationship of urban built-up area and GDP. The low efficiency of the urban land, in addition to the loss of cropland in these areas, will jeopardize sustainable development by wasting a large amount of idle land and resources [62]. Because of continuous and intense land development and low efficiency of urban land, the Chinese government formulated a system of cultivated land protection with emphasis on controlling the urban land scales in the eastern region, especially in Beijing-Tianjin-Hebei, the Yangtze River Delta, and the Pearl River Delta zone in 2014. In particular, it stipulated that the per capita urban area should be strictly within the range of 100 m2 per person [66]. Thus, we might expect that urban sprawl would slow down and the urban land utilization would improve in the near future.

4.3. Relationship between Port and Urban Sprawl

A port city is a combination of a port and a city. Urban sprawl in port cities will possibly accelerate port development to some extent. On the other hand, port construction will also advance the urbanization level of these port cities. Nowadays, three major international shipping centers have been built up in China: the Bohai Rim, the Yangtze River Delta, and the Pearl River Delta [67].
Cargo throughput is not only the basic production index for measuring port development, but also a significant reference to the economic situation and development level of the port city. Figure 13 displays an exponential relationship between the port cargo throughputs and the urban areas in the 13 port cities. All available data during the study period (i.e., 1990, 2000, 2002, 2004 and 2006) are included. The relationship implies the relatively close connection (R2 is about 0.7) between the port development (represented by cargo throughput) and urban sprawl in the coastal zone. As Song (2013) indicated, the integration of the port and the city has become a major trend when constructing port cities in China [67]. Our intention here is to simply examine the relationship of port development and urban sprawl, while other studies have explored the development model of port and city combinations [68,69,70], and the methods relating the port cargo throughput with city GDP [71,72,73,74] in detail.
Figure 14 shows the major port location relative to urban built-up area in the 13 port cities. In addition to terrain, the port location affected urban sprawl in some degree. If the port was located close to the urban area in 1979 (pink areas in Figure 14), urban sprawl extended away from the port towards the directions without terrain constraints. For example, Shanghai is located in a flat area with the port centered in the urban area in 1979, thus the urban built-up area extended in all directions in Shanghai. In Qingdao, urban sprawl mainly developed to the northeast and southwest of the port because of the terrain constraints (tidal flat and ocean in the other directions). Dalian, Xiamen, and Shenzhen are in similar situations to Qingdao. The urban expanded areas were relatively large in these cities. On the other hand, if the port was far away from the urban built-up area in 1979, urban sprawl generally extended to the port if there were no terrain constraints (e.g., Tianjin, Guangzhou, Fuzhou, Haikou, etc.). Urban sprawl in smaller cities mainly followed this pattern. In general, the city and port developed together. Port location is important to city development, as the port is conducive to urban sprawl from the perspective of transportation.

5. Conclusions

In this study, we explored the spatiotemporal characteristics of urban sprawl in Chinese port cities in the past several decades. Overall, urban built-up area in these cities kept increasing at a faster pace in the study period, especially in the first decade of the 21st century. There was an earlier acceleration of urban sprawl in the south coastal zone because of a policy giving priority to development in Southeast China. The city-averaged urban sprawl in the central coastal zone was much larger than that in the north and south coastal zones. Combining the ring theory and expansion intensity index, we identified that the most intense urban sprawl happened in the 21st century, and urban sprawl generally peaked in the urban fringe in most cities. The cultivated land and non-urban built-up land dominated the land-use types lost to urban sprawl in the entire coastal zone. The spatial metrics implied that urban irregularity increased (compactness decreased) along with urban sprawl in most port cities through the study period, and the landscape types lost to urban sprawl were more diverse in the north and south coastal zones.
Land-use policies appeared to be the main driver of urban sprawl in the port cities. Economic development was well correlated with urban sprawl in these cities during the study period. However, the utilization efficiency of urban land decreased in all cities, and the central coastal zone experienced the largest decline. Our results indicated that the port developments and locations were both related with urban sprawl in Chinese port cities.
This study sheds light on the features of urban sprawl and their relations with surroundings in Chinese coastal cities. Our results provide useful information in terms of the general trend, dynamic change, and form characteristics of urban sprawl in these cities over the past several decades. The results also suggest that improving the utilization efficiency of urban land and coordinating the development of city and port might be important in the sustainable development of port cities. The decision-makers could take advantage of such information to make better judgments on urban planning and sustainable development in these regions or other similar areas. In addition, this research throws up some unresolved questions, and several further steps could be taken next. For example, it is worth exploring the irregularity of urbanization: the reasons behind it, its consequences, and methods for improving the balance. How does the internal urban infrastructure affect the environment besides urban area expansion? Remote sensing images with finer resolution might be helpful in answering this question as satellite technology improves.

Acknowledgments

The authors are grateful for the Land Use Products Application and Analysis Project of “One-Three-Five” Strategic Planning of the Institute of Remote Sensing and Digital Earth, CAS (Y4SG0300CX) and CAS-Agreenium Joint Doctoral Promotion Program (DPP). The authors also thank Fang Liu and Jinyong Xu for their support in data processing.

Author Contributions

Minmin Li conceived and designed the research, and did most of the analysis; Zengxiang Zhang and Xiaoli Zhao contributed extensively to data processing and preparation; Danny Lo Seen and Jian Sun have given many suggestions for improving and modifying this article.

Conflicts of Interest

The authors declare no conflict of interest.

Appendix A

Table A1. National land use remote sensing classification method of the Chinese Academy of Sciences.
First Level TypesSecond Level TypesCodeDescriptions
Cultivated landPaddy11Cropland that has sufficient water supply and irrigation facilities for planting paddy rice, lotus, etc., including land that is rotated for paddy field rice and dry-farming crops
Dry land12Cropland for cultivation without water supply and irrigation facilities; cropland that has water supply and irrigation facilities and planting dry farming crops; cropland planting vegetables; fallow land
WoodlandForest21Natural or planted forests with canopy cover greater than 30%
Shrub22Land covered by trees less than 2 m in height, with canopy cover greater than 40%
Sparse woods23Land covered by trees with canopy cover of 10%–30%
Other woods24Land such as tea gardens, orchards, groves, and nurseries
GrasslandDense grass31Grassland with canopy cover greater than 50%
Moderate grass32Grassland with canopy cover of 20% and 50%
Sparse grass33Grassland with canopy cover of 5% and 20%
Water bodiesRiver and canal41Land covered by rivers, including canals
Lake42Land covered by lakes
Reservoir and pond43Man-made facilities for water reservation
Ice and snow44Land covered by perennial snowfields and glaciers
Tidal flat45Land between high-tide level and low-tide level
Bottomland46Land between normal water level and flood level
Built-up landUrban51Land used for urban settlement
Rural settlement52Land used for village settlements
Industry-traffic land53Land used for factories, quarries, mining, oil-field slattern outside cities, and land for special uses, such as transportation and airports
Unused landSandy land61Sandy land covered with less than 5% vegetation cover
Gobi62Gravel-covered land with less than 5% vegetation cover
Saline alkali land63Land with saline and alkali accumulation and sparse vegetation
Swampland64Land with a permanent mixture of water and herbaceous or woody vegetation that covers extensive areas
Bare soil65Bare exposed soil with less than 5% vegetation cover
Bare rock66Bare exposed rock with less than 5% vegetation cover
Other67Other land types such as alpine desert and tundra

References

  1. Wu, W.; Zhao, S.; Zhu, C.; Jiang, J. A comparative study of urban expansion in Beijing, Tianjin and Shijiazhuang over the past three decades. Landsc. Urban Plan. 2015, 134, 93–106. [Google Scholar] [CrossRef]
  2. Heilig, G.K. World Urbanization Prospects: The 2011 Revision; United Nations, Department of Economic and Social Affairs (DESA), Population Division, Population Estimates and Projections Section: New York, NY, USA, 2012. [Google Scholar]
  3. Bai, X.; Chen, J.; Shi, P. Landscape urbanization and economic growth in China: Positive feedbacks and sustainability dilemmas. Environ. Sci. Technol. 2011, 46, 132–139. [Google Scholar] [CrossRef] [PubMed]
  4. Deng, X.; Huang, J.; Rozelle, S.; Zhang, J.; Li, Z. Impact of urbanization on cultivated land changes in China. Land Use Policy 2015, 45, 1–7. [Google Scholar] [CrossRef]
  5. Bolund, P.; Hunhammar, S. Ecosystem services in urban areas. Ecol. Econ. 1999, 29, 293–301. [Google Scholar] [CrossRef]
  6. Seto, K.C.; Güneralp, B.; Hutyra, L.R. Global forecasts of urban expansion to 2030 and direct impacts on biodiversity and carbon pools. Proc. Natl. Acad. Sci. USA 2012, 109, 16083–16088. [Google Scholar] [CrossRef] [PubMed]
  7. Zhao, S.; Da, L.; Tang, Z.; Fang, H.; Song, K.; Fang, J. Ecological consequences of rapid urban expansion: Shanghai, China. Front. Ecol. Environ. 2006, 4, 341–346. [Google Scholar] [CrossRef]
  8. Liu, J.; Zhan, J.; Deng, X. Spatio-temporal patterns and driving forces of urban land expansion in China during the economic reform era. AMBIO 2005, 34, 450–455. [Google Scholar] [CrossRef] [PubMed]
  9. Wang, L.; Li, C.; Ying, Q.; Cheng, X.; Wang, X.; Li, X.; Hu, L.; Liang, L.; Yu, L.; Huang, H. China’s urban expansion from 1990 to 2010 determined with satellite remote sensing. Chin. Sci. Bull. 2012, 57, 2802–2812. [Google Scholar] [CrossRef]
  10. Kuang, W.; Chi, W.; Lu, D.; Dou, Y. A comparative analysis of megacity expansions in China and the US: Patterns, rates and driving forces. Landsc. Urban Plan. 2014, 132, 121–135. [Google Scholar] [CrossRef]
  11. Dieleman, F.; Wegener, M. Compact city and urban sprawl. Built Environ. 2004, 30, 308–323. [Google Scholar] [CrossRef]
  12. Ewing, R. Is los angeles-style sprawl desirable? J. Am. Plan. Assoc. 1997, 63, 107–126. [Google Scholar] [CrossRef]
  13. Schneider, A.; Woodcock, C.E. Compact, dispersed, fragmented, extensive? A comparison of urban growth in twenty-five global cities using remotely sensed data, pattern metrics and census information. Urban Stud. 2008, 45, 659–692. [Google Scholar] [CrossRef]
  14. Schwarz, N. Urban form revisited—Selecting indicators for characterising European cities. Landsc. Urban Plan. 2010, 96, 29–47. [Google Scholar] [CrossRef]
  15. Yue, W.; Liu, Y.; Fan, P. Measuring urban sprawl and its drivers in large Chinese cities: The case of Hangzhou. Land Use Policy 2013, 31, 358–370. [Google Scholar] [CrossRef]
  16. Herold, M.; Couclelis, H.; Clarke, K.C. The role of spatial metrics in the analysis and modeling of urban land use change. Comput. Environ. Urban Syst. 2005, 29, 369–399. [Google Scholar] [CrossRef]
  17. McGarigal, K.; Cushman, S.; Ene, E. Fragstats v4: Spatial Pattern Analysis Program for Categorical and Continuous Maps. 2012. Computer Software Program Produced by the Authors at the University of Massachusetts, Amherst. Available online: http://www.umass.edu/landeco/research/fragstats/fragstats.html (accessed on 2 November 2016).
  18. Huang, J.; Lu, X.X.; Sellers, J.M. A global comparative analysis of urban form: Applying spatial metrics and remote sensing. Landsc. Urban Plan. 2007, 82, 184–197. [Google Scholar] [CrossRef]
  19. Inostroza, L.; Baur, R.; Csaplovics, E. Urban sprawl and fragmentation in Latin America: A dynamic quantification and characterization of spatial patterns. J. Environ. Manag. 2013, 115, 87–97. [Google Scholar] [CrossRef] [PubMed]
  20. Sudhira, H.; Ramachandra, T. Characterising urban sprawl from remote sensing data and using landscape metrics. In Proceedings of 10th International Conference on Computers in Urban Planning and Urban Management, Iguassu Falls, Brazi, 11–13 July 2007.
  21. Gao, J.; Wei, Y.D.; Chen, W.; Chen, J. Economic transition and urban land expansion in provincial China. Habitat Int. 2014, 44, 461–473. [Google Scholar] [CrossRef]
  22. Huang, Z.; Wei, Y.D.; He, C.; Li, H. Urban land expansion under economic transition in China: A multi-level modeling analysis. Habitat Int. 2015, 47, 69–82. [Google Scholar] [CrossRef]
  23. Galster, G.; Hanson, R.; Ratcliffe, M.R. Wrestling Sprawl to the Ground: Defining and measuring an elusive concept. Hous. Policy Debate 2001, 12, 681–717. [Google Scholar] [CrossRef]
  24. Chen, L.; Nuo, W. Dynamic simulation of land use changes in port city: A case study of Dalian, China. Procedia-Soc. Behav. Sci. 2013, 96, 981–992. [Google Scholar] [CrossRef]
  25. Zhang, H.; Qi, Z.F.; Ye, X.Y.; Cai, Y.B.; Ma, W.C.; Chen, M.N. Analysis of land use/land cover change, population shift, and their effects on spatiotemporal patterns of urban heat islands in metropolitan Shanghai, China. Appl. Geogr. 2013, 44, 121–133. [Google Scholar] [CrossRef]
  26. Quan, B.; Bai, Y.; Römkens, M.; Chang, K.T.; Song, H.; Guo, T.; Lei, S. Urban land expansion in Quanzhou city, China, 1995–2010. Habitat Int. 2015, 48, 131–139. [Google Scholar] [CrossRef]
  27. Gong, J.; Liu, Y.; Chen, W. Optimal land use allocation of urban fringe in Guangzhou. J. Geogr. Sci. 2012, 22, 179–191. [Google Scholar] [CrossRef]
  28. Ma, Y.; Xu, R. Remote sensing monitoring and driving force analysis of urban expansion in Guangzhou city, China. Habitat Int. 2010, 34, 228–235. [Google Scholar] [CrossRef]
  29. Tan, M.; Li, X.; Xie, H.; Lu, C. Urban land expansion and arable land loss in China—A case study of Beijing–Tianjin–Hebei region. Land Use Policy 2005, 22, 187–196. [Google Scholar] [CrossRef]
  30. Chen, J.; Chang, K.T.; Karacsonyi, D.; Zhang, X. Comparing urban land expansion and its driving factors in Shenzhen and Dongguan, China. Habitat Int. 2014, 43, 61–71. [Google Scholar] [CrossRef]
  31. Lv, Z.Q.; Dai, F.Q.; Sun, C. Evaluation of urban sprawl and urban landscape pattern in a rapidly developing region. Environ. Monit. Assess. 2012, 184, 6437–6448. [Google Scholar] [CrossRef] [PubMed]
  32. Li, X.; Zhang, L.; Liang, C. A GIS-based buffer gradient analysis on spatiotemporal dynamics of urban expansion in Shanghai and its major satellite cities. Procedia Environ. Sci. 2010, 2, 1139–1156. [Google Scholar] [CrossRef]
  33. Tian, G.; Jiang, J.; Yang, Z.; Zhang, Y. The urban growth, size distribution and spatio-temporal dynamic pattern of the Yangtze River Delta megalopolitan region, China. Ecol. Model. 2011, 222, 865–878. [Google Scholar] [CrossRef]
  34. Kong, F.; Yin, H.; James, P.; Hutyra, L.R.; He, H.S. Effects of spatial pattern of greenspace on urban cooling in a large metropolitan area of eastern China. Landsc. Urban Plan. 2014, 128, 35–47. [Google Scholar] [CrossRef]
  35. Li, X.; Gong, P.; Liang, L. A 30-year (1984–2013) record of annual urban dynamics of Beijing city derived from landsat data. Remote Sens. Environ. 2015, 166, 78–90. [Google Scholar] [CrossRef]
  36. Li, X.; Zhou, W.; Ouyang, Z. Forty years of urban expansion in Beijing: What is the relative importance of physical, socioeconomic, and neighborhood factors? Appl. Geogr. 2013, 38, 1–10. [Google Scholar] [CrossRef]
  37. Xu, X.; Min, X. Quantifying spatiotemporal patterns of urban expansion in China using remote sensing data. Cities 2013, 35, 104–113. [Google Scholar] [CrossRef]
  38. Yang, J.S.; Liang, X.X.; Huang, M.L. Ocean Development Strategy in China; Huazhong University of Science and Technology Press: Wuhan, China, 1990. (In Chinese) [Google Scholar]
  39. Zhang, Z.; Wang, X.; Zhao, X.; Liu, B.; Yi, L.; Zuo, L.; Wen, Q.; Liu, F.; Xu, J.; Hu, S. A 2010 update of national land use/cover database of China at 1:100000 scale using medium spatial resolution satellite images. Remote Sens. Environ. 2014, 149, 142–154. [Google Scholar] [CrossRef]
  40. National Bureau of Statistics. China City Statistical Yearbook; China Statistical Publisher House: Beijing, China, 1991. (In Chinese)
  41. National Bureau of Statistics. China City Statistical Yearbook; China Statistical Publisher House: Beijing, China, 2011. (In Chinese)
  42. China, M.O.T. Port Cargo and Passenger Throughput. Available online: http://www.mot.gov.cn/zhuzhan/tongjigongbao/tongjishuju/gonglushuiyunyewu/gangkouhuowu_LKTTL/ (accessed on 16 March 2016). (In Chinese)
  43. Xu, Q.; Hua, C. Establishing a uniform standard for calculation of urban built-up area: With Hangzhou central city zone as an example. Planners 2005, 4, 88–91. [Google Scholar]
  44. GB/T50280_98. Standards for Basic Terminology of Urban Planning [s]. 1998. Available online: http://www.mohurd.gov.cn/wjfb/200611/t20061101_156680.html (accessed on 4 November 2016). (In Chinese)
  45. Wen, Q.; Zhang, Z.; Shi, L.; Zhao, X.; Liu, F.; Xu, J.; Yi, L.; Liu, B.; Wang, X.; Zuo, L.; et al. Extraction of basic trends of urban expansion in China over past 40 years from satellite images. Chin. Geogr. Sci. 2016, 26, 129–142. [Google Scholar] [CrossRef]
  46. Liu, S.; Chen, T.; Zhang, W. Temporal and Spatial Patterns of Urban Land Use Growth in Coastal Areas; The Commercial Press: Shanghai, China, 2008. [Google Scholar]
  47. Jiao, L. Urban land density function: A new method to characterize urban expansion. Landsc. Urban Plan. 2015, 139, 26–39. [Google Scholar] [CrossRef]
  48. Luck, M.; Wu, J. A gradient analysis of urban landscape pattern: A case study from the Phoenix metropolitan region, Arizona, USA. Landsc. Ecol. 2002, 17, 327–339. [Google Scholar] [CrossRef]
  49. Tsai, Y. Quantifying urban form: Compactness versus ‘sprawl’. Urban Stud. 2005, 42, 141–161. [Google Scholar] [CrossRef]
  50. Huang, H.; Yun, Y. Urban expansion in the core area of Tianjin based RS and GIS. J. Arid Land Resourc. Environ. 2012, 7, 165–171. [Google Scholar]
  51. Boyce, R.R.; Clark, W.A. The Concept of Shape in Geography. Geogr. Rev. 1964, 54, 561–572. [Google Scholar] [CrossRef]
  52. Shang, Z.; Zhang, X.; Zhou, X. Study on urban spatial expansion and external morphology evolution based on RS/GIS: A case of Huai’an city. Econ. Geogr. 2012, 08, 64–70. [Google Scholar]
  53. Wu, G.; Shen, H.; Pan, C. Study on the space expansion and optimization Zhengzhou city based on GIS. Territ. Nat. Resour. Stud. 2012, 02, 1–3. [Google Scholar]
  54. Shannon, C. A Mathematical Theory of Communication. Bell Syst. Tech. J. 1948, 27, 623–656. [Google Scholar] [CrossRef]
  55. Jiao, L.; Mao, L.; Liu, Y. Multi-order Landscape Expansion Index: Characterizing urban expansion dynamics. Landsc. Urban Plan. 2015, 137, 30–39. [Google Scholar] [CrossRef]
  56. Seto, K.C.; Fragkias, M. Quantifying spatiotemporal patterns of urban land-use change in four cities of China with time series landscape metrics. Landsc. Ecol. 2005, 20, 871–888. [Google Scholar] [CrossRef]
  57. Wang, Q.; Zhang, Z.; Yi, L.; Tan, W.; Wang, C. Research on urban expansion in Nanjing, China using RS and GIS. Resour. Environ. Yangtze Basin 2007, 05, 554–559. [Google Scholar]
  58. Agency, E.E. Land Use. Available online: http://www.eea.europa.eu/themes/landuse/intro (accessed on 16 March 2016).
  59. Ding, C. Land policy reform in China: Assessment and prospects. Land Use Policy 2003, 20, 109–120. [Google Scholar] [CrossRef]
  60. Valletta, W. The land administration law of China of 1998 and its impacts on urban development. In Proceedings of the 2001 World Congress of Urban Planning, Shanghai, China, 11–15 July 2001.
  61. Wei, H.K. National strategy: Evaluation and prospect of Chinese regional policy changes. Chin. Econ. 2010, 8, 1–18. (In Chinese) [Google Scholar]
  62. Zhang, T. Land market forces and government’s role in sprawl : The case of China. Cities 2000, 17, 123–135. [Google Scholar] [CrossRef]
  63. Liu, Y.; Wang, L.; Long, H. Spatio-temporal analysis of land-use conversion in the eastern coastal China during 1996–2005. J. Geogr. Sci. 2008, 18, 274–282. [Google Scholar] [CrossRef]
  64. Cohen, B. Urban growth in developing countries: A review of current trends and a caution regarding existing forecasts. World Dev. 2004, 32, 23–51. [Google Scholar] [CrossRef]
  65. Chen, M.; Huang, Y.; Tang, Z.; Lu, D.; Liu, H.; Ma, L. The provincial pattern of the relationship between urbanization and economic development in China. J. Geogr. Sci. 2014, 24, 33–45. [Google Scholar] [CrossRef]
  66. China, M.L.R. Implementing and Controlling the System of Protection of Arable Land. Available online: http://www.mlr.gov.cn/zwgk/zytz/201402/t20140220_1304242.htm (accessed on 16 March 2016). (In Chinese)
  67. Song, J.K. The urban space value assessment of Chinese port cities 2012. Urban Insight 2013, 2, 69–104. (In Chinese) [Google Scholar]
  68. Guo, J.K.; Han, Z.L. The port-city spatial system evolution theory and empirical study of Chinese seaport city. Scient. Geogr. Sin. 2013, 33, 1285–1292. (In Chinese) [Google Scholar]
  69. Huang, S.Z. The development of Chinese port cities. J. Geogr. Sci. 1951, 18, 21–40. (In Chinese) [Google Scholar]
  70. Wu, C.J.; Gao, X.Z. A model of port city development. Geogr. Res. 1989, 8, 9–15. (In Chinese) [Google Scholar]
  71. Gosasang, V.; Chandraprakaikul, W.; Kiattisin, S. A comparison of traditional and neural networks forecasting techniques for container throughput at bangkok port. Asian J. Ship. Logist. 2011, 27, 463–482. [Google Scholar] [CrossRef]
  72. Notteboom, T.E.; Rodrigue, J.P. Port regionalization: Towards a new phase in port development. Marit. Policy Manag. 2005, 32, 297–313. [Google Scholar] [CrossRef]
  73. Seabrooke, W.; Hui, E.C.; Lam, W.H.; Wong, G.K. Forecasting cargo growth and regional role of the port of Hong Kong. Cities 2003, 20, 51–64. [Google Scholar] [CrossRef]
  74. Zhang, C.; Huang, L.; Zhao, Z. Research on combination forecast of port cargo throughput based on time series and causality analysis. J. Ind. Eng. Manag. 2013, 6, 124. [Google Scholar] [CrossRef]
Figure 1. Map of China showing coastal cities in the study area.
Sustainability 08 01138 g001
Figure 2. Flow chart of identifying urban built-up area and its dynamic changes.
Sustainability 08 01138 g002
Figure 3. Urban sprawl in 13 port cities from 1979 to 2013, displayed in Google Earth.
Sustainability 08 01138 g003
Figure 4. Urban built-up area growth in all 13 port cities and in each coastal zone from 1979 to 2013.
Sustainability 08 01138 g004
Figure 5. Annual mean expansion of urban built-up area in three coastal zones.
Sustainability 08 01138 g005
Figure 6. Buffer zones at 5 km intervals up to 50 km from the city center in 13 port cities.
Sustainability 08 01138 g006
Figure 7. Relationship of urban expansion intensity index and distance from the city center of 13 port cities in three decades of the study period (1979–2013).
Sustainability 08 01138 g007
Figure 8. Land-use types lost to urban sprawl in 13 port cities from 1979 to 2013.
Sustainability 08 01138 g008
Figure 9. Land-use types lost to urban sprawl in three coastal zones.
Sustainability 08 01138 g009
Figure 10. BCI (ac), AWMSI (df), and SHDI (gi) in three coastal zones.
Sustainability 08 01138 g010
Figure 11. Relationship between urban sprawl and economic development levels: (a) GDP of all port cities in 1990 and 2010; (b) difference in GDP vs. difference in urban built-up area (difference is calculated as the value in 2010 minus that in 1990).
Sustainability 08 01138 g011
Figure 12. Per capita area in 13 port cities in 1990 and 2010.
Sustainability 08 01138 g012
Figure 13. Relationship between urban built-up area and port cargo throughput.
Sustainability 08 01138 g013
Figure 14. Relationship between urban sprawl and port locations. Pink areas indicate the urban built-up area in 1979, blue areas indicate the urban built-up area in 2013, and the red triangle indicates the port location.
Sustainability 08 01138 g014
Table 1. Remote sensing data used for interpretation on urban sprawl.
CityMSSTM and ETM+CBERSHJ-1OLI
Dalian19781990, 1995, 2000, 2002, 2006, 20102004, 20082011, 20122013
Tangshan19791987, 1996, 2000, 2002, 2004, 2006, 2008, 20102011, 20122013
Tianjin19791987, 1996, 2000, 2001, 2004, 2006, 201020082011, 20122013
Qingdao19791989, 1996, 2000, 2002, 2006, 2008, 201020042011, 20122013
Shanghai19791987, 1998, 2001, 2004, 20102006, 20082011, 20122013
Ningbo19791987, 1994, 2000, 2002, 2006, 20102004, 20082011, 2012, 2013
Fuzhou19731986, 1996, 2000, 2001, 2004, 2006, 201020082011, 20122013
Xiamen19731988, 1996, 2000, 2002, 2004, 2006, 201020082011, 20122013
Guangzhou19791990, 1996, 2000, 20042006, 20082010, 2011, 2012, 2013
Shenzhen19791989, 1995, 2000, 2002, 2004, 200620082010, 2011, 20122013
Zhuhai19781987, 1996, 2000, 2002, 2004, 2006, 201020082011, 2012, 2013
Fangchenggang19791988, 1996, 2000, 2002, 2004, 2006, 20092010, 2011, 20122013
Haikou19731989, 1995, 2000, 2001, 2004, 2007, 2010200620112013
Table 2. Annual mean expansion area and relative expansion of urban sprawl in individual port cities from 1979 to 2013.
Port CityAnnual Mean Expansion Area (km2/year)Relative Expansion
Dalian7.586.08
Tangshan2.621.97
Tianjin13.673.61
Qingdao10.819.76
Shanghai38.4013.20
Ningbo6.2711.83
Fuzhou4.704.72
Xiamen9.3025.56
Guangzhou17.334.27
Shenzhen25.7885.48
Zhuhai2.8955.24
Fangchenggang1.5221.39
Haikou2.9227.89
Table 3. Percentage of seven land-use types lost to urban sprawl in each city (%).
Port CityCultivated LandWood-LandGrass-LandWater BodiesNon-Urban Built-Up LandUnused LandOcean
Dalian42.2312.422.663.6026.370.0012.72
Tangshan50.031.280.000.4848.210.000.00
Tianjin50.960.250.008.1640.450.180.00
Qingdao39.0210.390.004.6735.410.0010.50
Shanghai70.150.490.020.1129.220.000.00
Ningbo74.660.080.020.1325.090.030.00
Fuzhou59.137.740.005.9727.170.000.00
Xiamen42.402.580.0012.1039.650.003.27
Guangzhou22.3740.300.680.7335.900.020.00
Shenzhen40.1323.330.0512.9220.070.003.50
Zhuhai67.998.930.072.5419.850.000.63
Fangcheng-gang0.0040.760.009.5920.060.0029.59
Haikou54.7711.571.277.3619.280.395.36

