1. Introduction
With the decentralisation and evolution from monocentric to polycentric urban spatial structure that substantial cities have experienced in recent decades, scholars have focused their attention on polycentric urban development [
1,
2,
3]. According to Giuliano and Small [
4] and McDonald [
5], employment is the key to understanding the formation of urban centres. In both developed and developing countries, the decentralisation of urban employment, resulting in polycentric urban development, has profound implications for people’s commuting patterns [
6]. Shen [
7] argued that the main ingredients of an urban spatial structure are the people’s spatial distribution, the spatial distribution of socio-economic opportunities, especially employment, and the people’s commuting behaviour that links to opportunities.
Previous studies have shown that land use patterns such as urban sprawl, density and jobs-housing balance impact on people’s travel patterns [
8,
9,
10,
11]. In particular, the study of how employment decentralisation in polycentric metropolitan areas affects patterns of daily trips has created many intense debates in the fields of planning and geography. There are two major issues of contention. One issue is whether the evolution of a polycentric spatial structure in mega cities could provide more opportunities to enhance spatial matches between the jobs and housing location selections of employees and thus improve workers’ commuting patterns [
12,
13,
14,
15,
16,
17]. Another issue is whether and how jobs-housing balance policies reduce employees’ commuting trip duration in metropolitan areas [
8,
18,
19,
20].
Hanson [
21] argued that for most types of travel patterns, socio-demographic factors may be more significant than the factors of urban spatial patterns. Strong links between transportation indicators and urban form on the city level may exist, but causal mechanisms cannot be readily explained. To explain causality, the perspectives of individuals and their households at the micro-level should be included. When individual socio-demographic factors (e.g., income, education and occupation) are considered, the impacts of urban structure on travel behaviour appear to be much reduced in importance [
14,
22,
23]. For example, income status is a vital variable largely associated with certain commuting behaviours among employees, but the evidence is still unconvincing. Some research (e.g., [
24,
25,
26]) has suggested that there is a positive correlation between income and commuting times. However, one study has shown that the higher the household income, the less the commuting time [
27]. Most research pertaining to the relationship between polycentric urban development and patterns of commuting among various socio-demographic groups refers to cities in developed countries of Europe and North America [
8,
28,
29,
30]. However, there has been comparatively little research in cities of China. Due to the fact that socio-economic characteristics in China, at both the urban and individual levels, are different from those of Western countries, as well as the fact that China’s cities are experiencing a transformation period thanks to market-oriented economic reform, we cannot simply apply findings from European and North American cities to China’s cities. Accordingly, this research, using Beijing as a case study, provides updated information on the impacts of polycentric urban development and jobs-housing balance on workers’ commuting behaviour in a Chinese city that is undergoing rapid transformation. In addition, the findings of the paper also provide key information about how commuting patterns vary among various income groups in a polycentric city of China.
In recent years, there have been a number of studies in China that have investigated the influence of urban form on travel behaviour, using small-scale disaggregated data. For example, Pan, Shen and Zhang [
31] examined the influence of urban form on travel behaviour, based on a survey of residents in four representative neighbourhoods in Shanghai. Based on a survey of residents who moved to Shanghai’s three suburban neighbourhoods, Cervero and Day [
32] examined the impacts of housing relocation to the suburbs on job accessibility and commuting times in Shanghai. Similarly, Day and Cervero [
33] examined the impacts of housing relocation to four neighbourhoods on commuting times, based on a 2006 household survey in Shanghai. Yang [
34] found that commuting time increased by 30% as households moved from previous housing locations and from central districts to suburban districts, based on a household relocation survey in Beijing in 1996. He concluded that the changing land use patterns and increased jobs-housing imbalance due to a transition toward a market economy resulted in increased travel time. A study by Wang, Song and Xu [
35], using the spatial mismatch hypothesis to measure jobs-housing relationships in Beijing, showed that the spatial imbalance between population and employment has become increasingly pronounced over time across urban districts. Næss [
36] examined the influence of residential location on travel behaviour in the Hangzhou Metropolitan Area. All of the above-mentioned studies, which investigated how people’s travel behaviour was affected by urban form and residential relocation to suburbs, were based on surveys of residents or households. To the author’s knowledge, however, no research has been done and published about how polycentric urban development has impacted on workers’ commuting behaviour among various income groups, based on a survey of employees at their workplaces in China’s cities. Based on recent data, this research provides information about how workers’ commuting times and travel mode choices vary in different income groups in a Chinese polycentric city. Accordingly, the findings of this research contribute to the advancement of knowledge on this topic and address significant gaps in this research field.
2. Methods
In China, the evolution of urban spatial structure has been profoundly driven by the conversion from a centrally planned system to a market-oriented system after the launch of the market-oriented economic reforms in the 1980s. Urban land reform introduced land values to China’s cities, resulting in a market environment for urban land use rights. Urban land reform that allowed land use rights to be transferred along with rents and fees established the institutional context for rapid urban development in China since the 1980s [
37,
38,
39]. The formation of an urban land market began to reduce governments’ overwhelming dominance in land use and building investment [
39]. Since then, land use rights can be granted by the appropriate city government through negotiations or competitive bidding [
38]. Currently, all land needs to be transacted through an open bidding process in the market [
39]. This shift in land use is significant in stimulating property-led urban growth. Urban land reform has been the key driver restructuring the land development patterns of China’s cities, as land values are allowed to be determined by the market, according to factors such as location, supply and demand. The significance of geographic location of urban land has resulted in the appearance of a land-rent gradient similar to that of Western cities [
38]. There are large gaps in land prices between the city centre with prime locations, and the suburbs. Specifically, this gap drives residential and industrial decentralisation, the formation of major employment centres such as the Central Business District, knowledge-intensive suburban downtowns, high-tech edge cities, and the development of massive affordable housing projects in the suburbs. Accordingly, China’s urban spatial change has been significantly influenced by how urban land use rights are transferred and allocated to developers through the market, and this has resulted in a change of urban structure from a monocentric city form to a more dispersed one, through polycentric urban development and suburbanisation.
Rapid development of market-oriented real estate and infrastructure, following government-led industrial development, is strongly shaping China’s suburbanisation process. In relation to employment decentralisation, the focus has changed from the decentralisation of manufacturing sectors in the primary development stage of economic forms, to the decentralisation of the real estate, finance and education sectors. With regard to residential decentralisation, most wealthy people in China still tend to live in city centres, due to traditional cultural considerations and convenience to urban services, while most low-income earners settle in the urban periphery because they cannot afford the expensive accommodation in the city centres. Accordingly, urban polycentric development and decentralisation of employment may bring benefits by enhancing the commuting efficiency of low-income earners in China.
It has been widely acknowledged that all post-industrial cities are in fact polycentric [
40]. Beijing is the first post-industrial city in Mainland China. Beijing has been transformed from a monocentric city to a polycentric urban structure based on the development of high-tech industrial zones and knowledge-intensive service clusters. Economic-clusters-induced development in Beijing tends to have two key features. On one hand, the urban economic functions are becoming gradually specialised in industries mainly characterised by knowledge-based economy growth. On the other hand, these knowledge-based economic activities appear increasingly clustered in distinct geographical areas [
39].
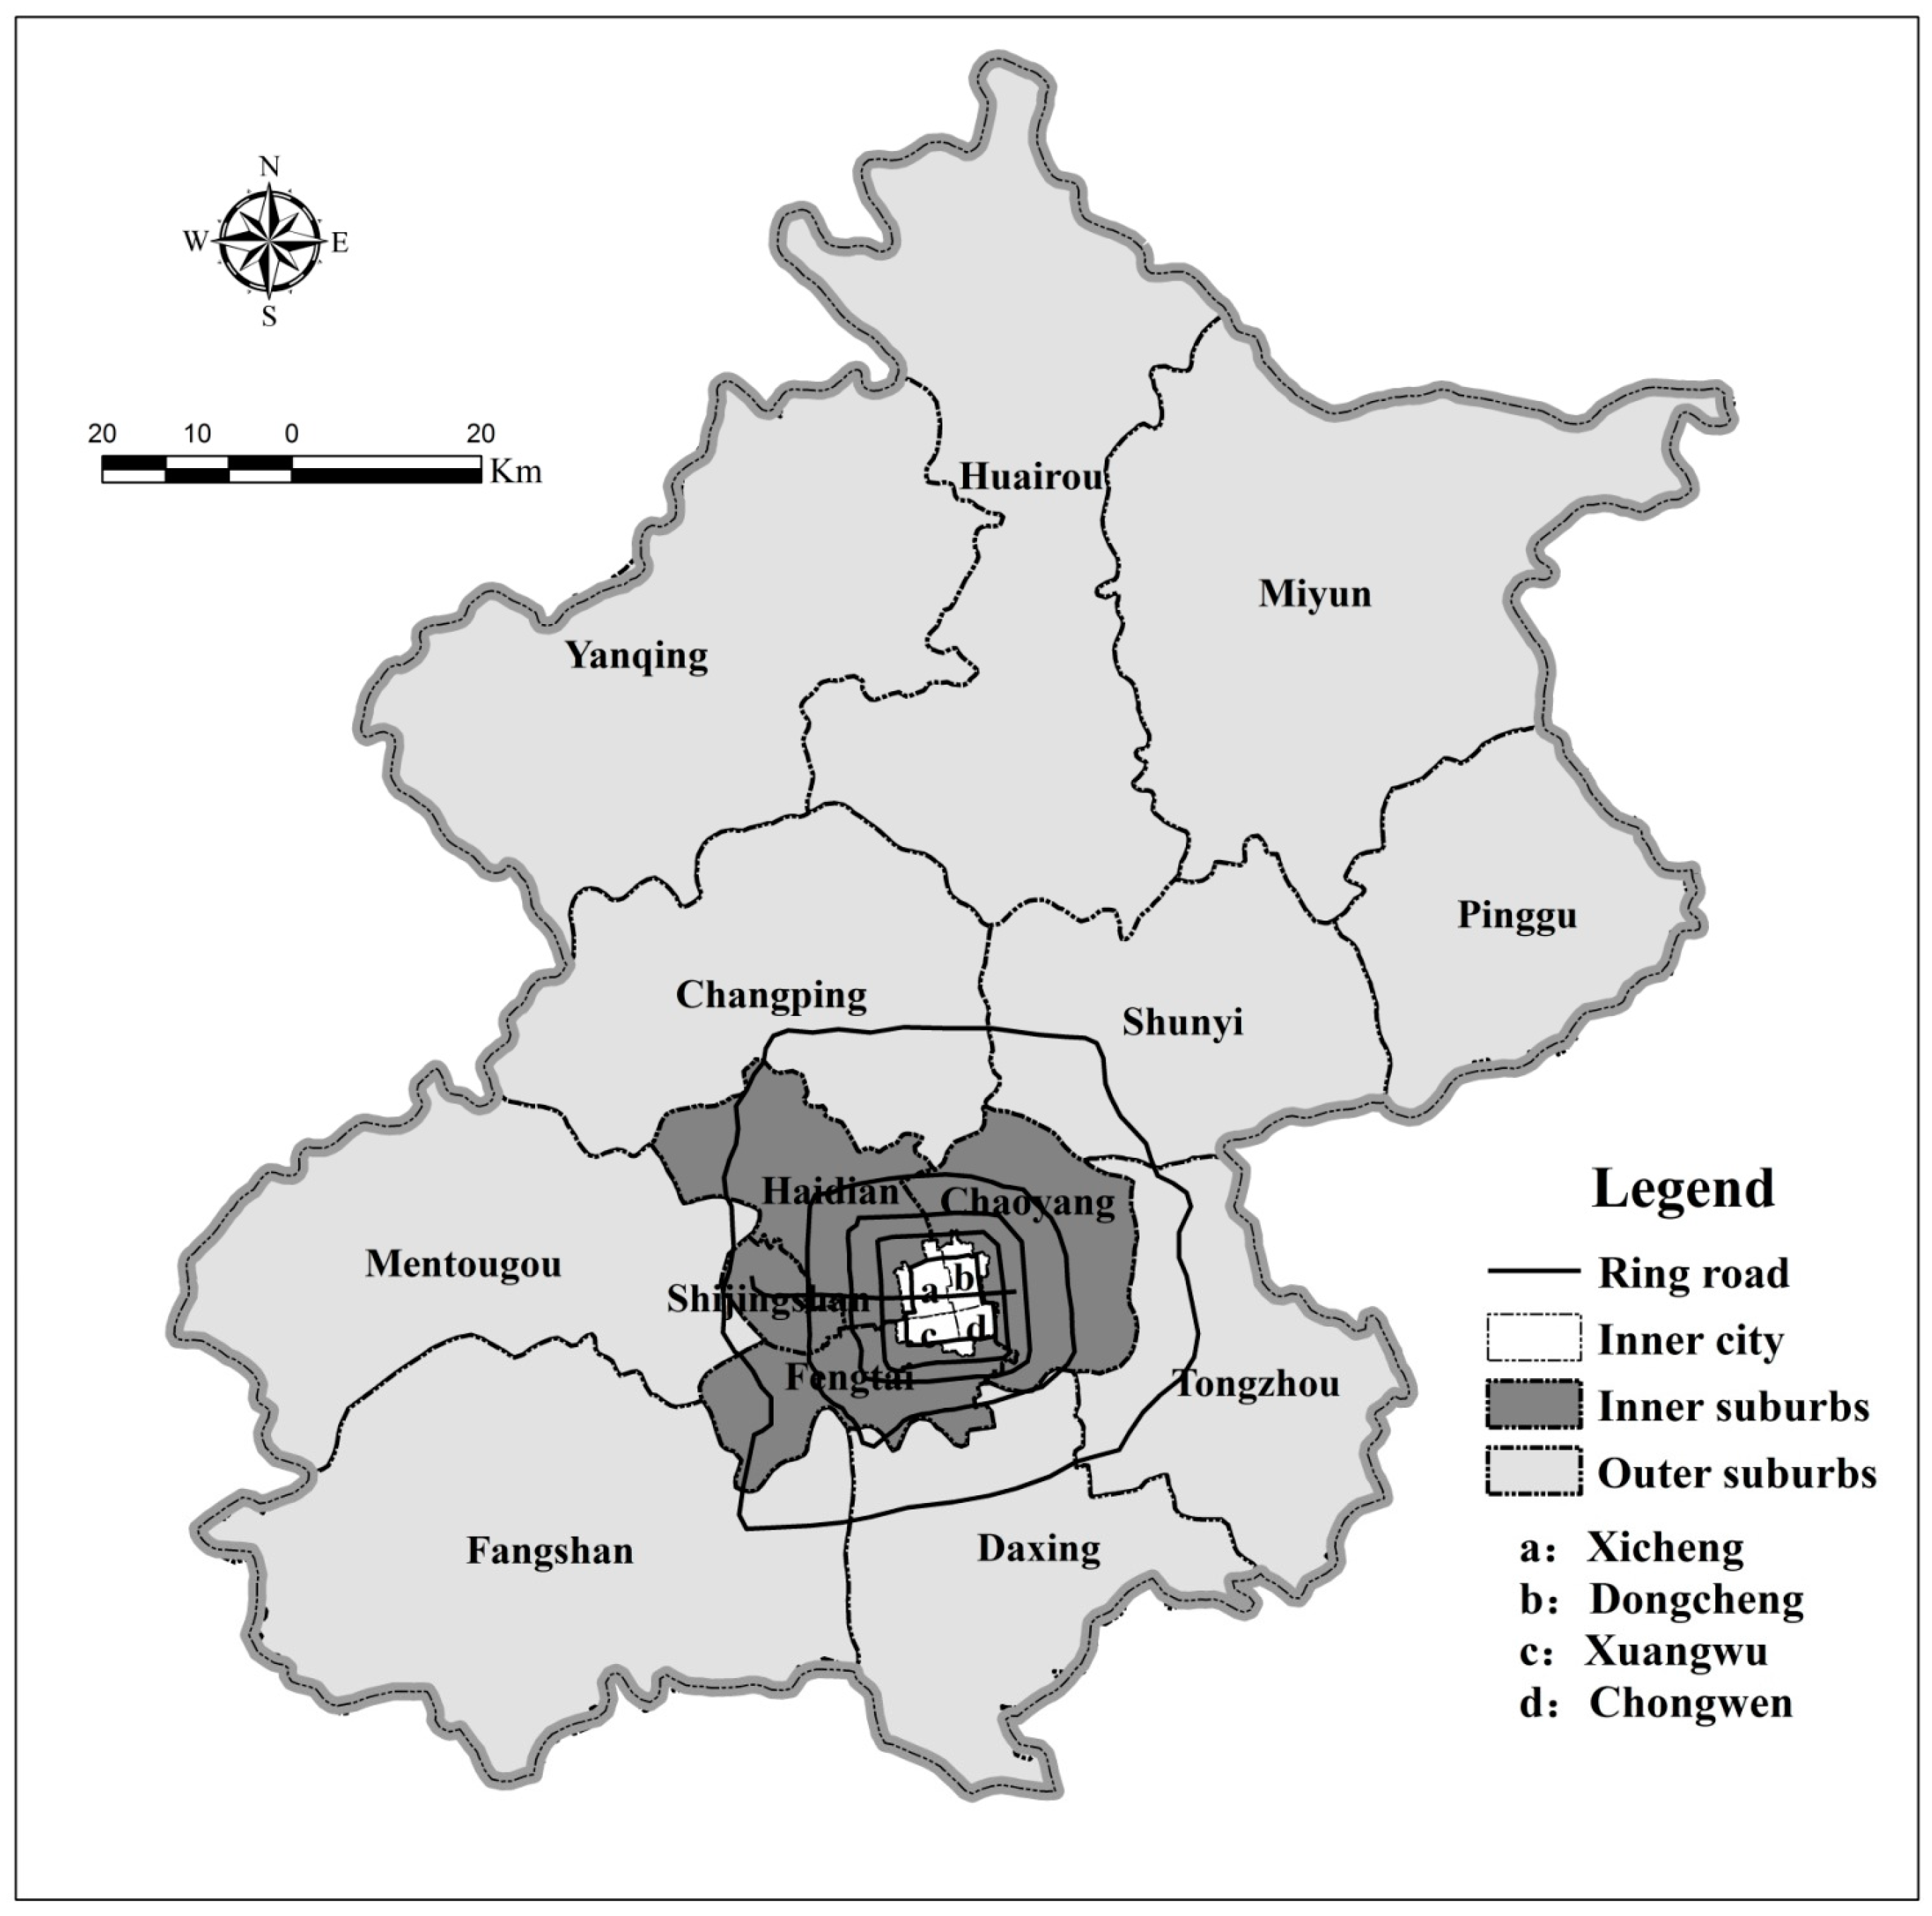
The entire administrative region of Beijing was traditionally divided into three parts: the inner city (four central city districts—Xicheng district, Dongcheng district, Xuanwu district and Chongwen district; in 2010, the four central city districts were reorganised into two new districts, namely new Xicheng district and Dongcheng district); the inner suburbs (including four districts—Haidian district, Chaoyang district, Shijingshan district and Fengtai district); and the outer suburbs (the other eight districts and two counties). The inner city and the inner suburbs together were called the main urban area. The administrative region of Beijing is shown in
Figure 1.
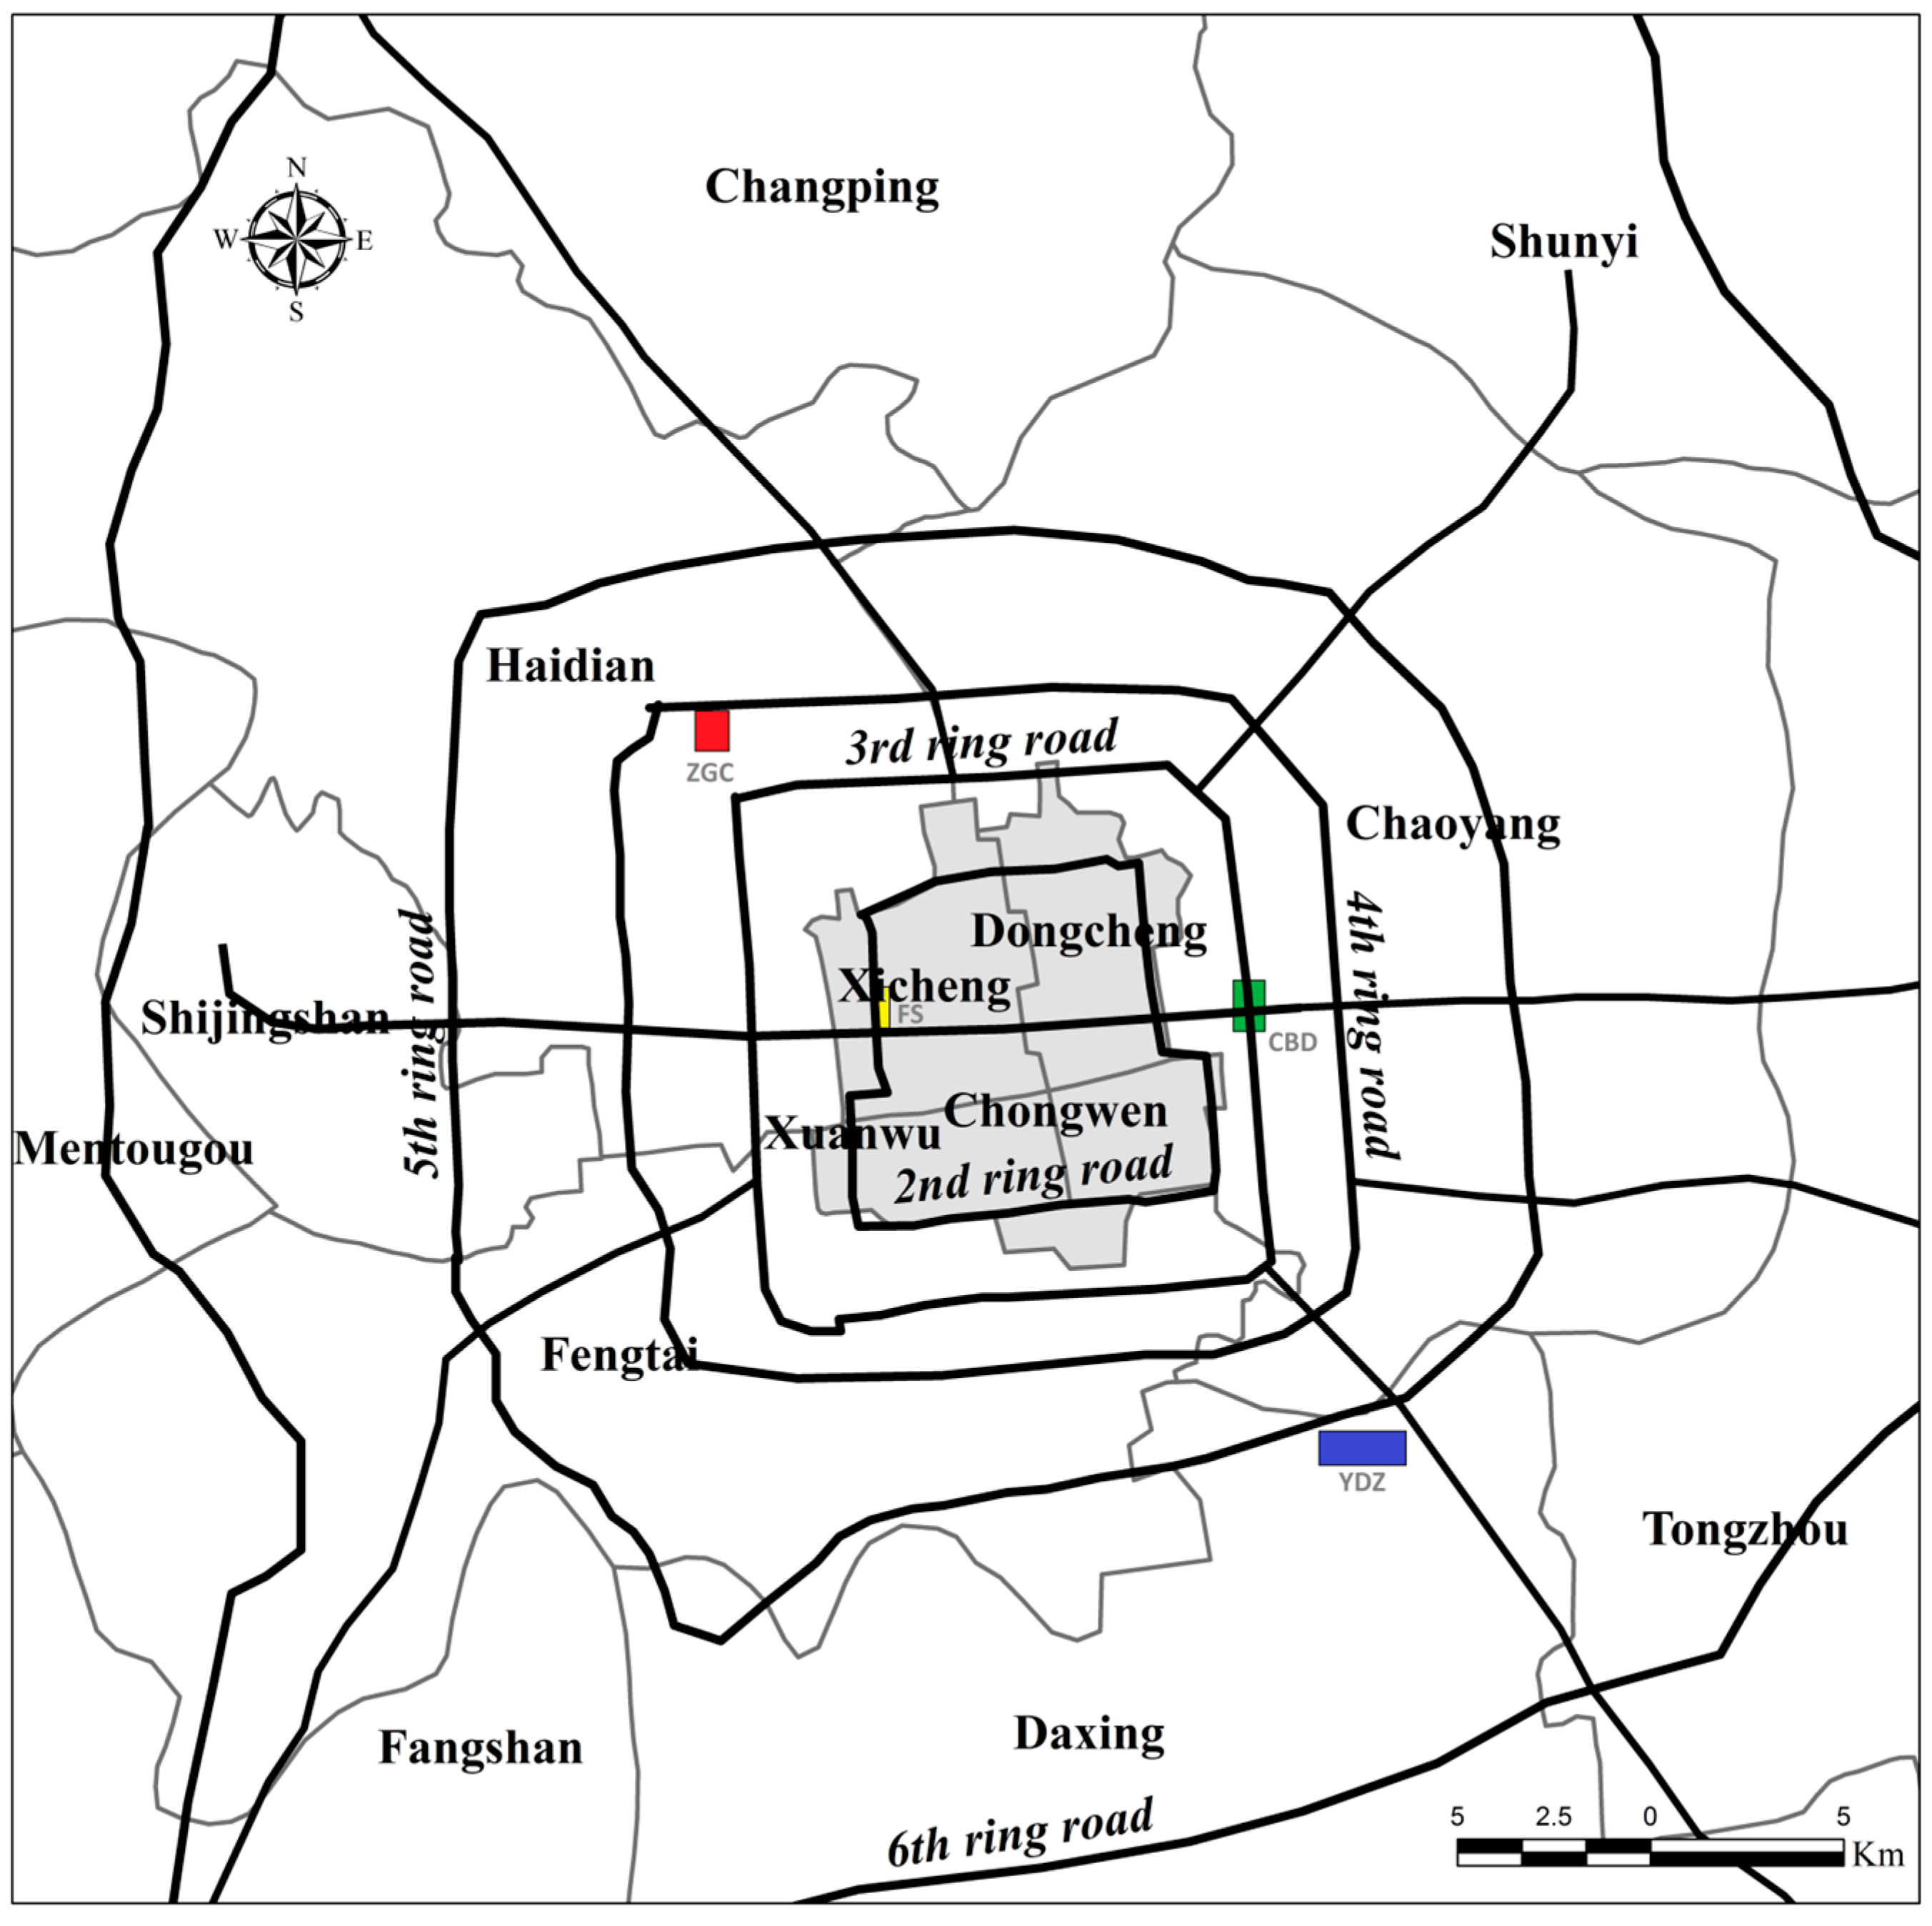
For the purpose of investigating differences in commuting behaviour among various income groups during polycentric urban development in China, workers’ commuting behaviour (including commuting time and commuting mode choice) in four economic sub-centres of Beijing were examined in this study. Data were collected by conducting a field questionnaire survey in four economic sub-centres, namely the Central Business District, Financial Street, Zhongguancun and the Yizhuang Development Zone.
Financial Street (FS) extends along the west second ring road and belongs to the Xicheng district, an inner city district. The FS has a planned area of 1.18 square kilometres (km2) and is only 3 km from the city centre (Tian’anmen Square). In 2008, construction of the core area of FS was completed, and it was identified as the main financial centre of Beijing. Nowadays, the FS is China’s most vital financial regulation centre, and is often called China’s Wall Street. The area accommodates numerous financial institutions and foreign financial institutions’ investment conglomerates. Financial Street has become the most significant employment centre in the inner city of Beijing. Besides its powerful commercial allure, its location and offerings make FS a coveted location for high-income residents.
The Central Business District (CBD) is located 5 km east of Beijing’s city centre in the Chaoyang district, an inner suburb district. The CBD is a comparatively newer cluster than the FS, but it is growing very fast as a major agglomeration of varied media, high-end and global-oriented business services and supporting activities [
39]. In 2001, the CBD Administrative Commission was established and started to formulate a development plan. The initial site was a 4 km
2 block. In 2009, the municipal government decided to extend the CBD eastwards. Presently, the CBD has attracted more than 100 offices of world Fortune 500 businesses in the media, information technology, consulting, financial, and service industries.
Zhongguancun (ZGC) is situated in a technology hub in Haidian district, an inner suburb district of Beijing. Geographically, it is located in the north-western part of Beijing and close to the north fourth ring road. The core zone of ZGC is Zhongguancun West, with an area of 0.94 km2 that is enclosed by north fourth ring road, Zhongguancun Street, Haidian South Road and Suzhou Street. The area is 11 km from the city centre. Zhongguancun zone has long been recognised as China’s largest intellectual region due to its density of research and education establishments. Currently, with a focus on knowledge and information industries as its dynamic economy, the area is well known as China’s Silicon Valley. It concentrates numerous research institutions, such as the Chinese Academy of Sciences.
Yizhuang Development Zone (YDZ), a State-authorised economic and technological development zone, was developed primarily for high-end manufacturing. With a location in south-east Beijing that is close to the south-east fifth ring road, it has been developed along the Jingjintang freeway and around the town of Yizhuang in the Daxing District of Beijing, 15 km from the city centre. The original base of Beijing YDZ, Yizhuang Industrial Area, was created in 1992 with an area of 3.8 km
2. The YDZ is most like American edge cities in terms of geographical characteristics and administrative structure. However, the zone has transformed from a suburban village/town to a development zone dominated by employment land uses. Most recently it is planned to be developed towards an integrated new town with growing residential, urban services, amenity, and public transportation land uses [
41]. The four sub-centres are shown in
Figure 2.
There have been a number of studies that have investigated the influence of urban structure and socio-economic factors on travel behaviour, using small-scale disaggregated data [
22,
42,
43]. In this study, a questionnaire survey was conducted between June and October 2012 in the four economic sub-centres. In each sub-centre, respondents were randomly recruited outside their workplaces during their work breaks.
Prior to the questionnaire survey’s implementation, a pilot survey was undertaken to test the effectiveness of the questionnaire. The questionnaires for the pilot survey were tested with 20 respondents in June 2012 in the four sub-centres. Based on their feedback, the questionnaire was refined and finalised. The pilot survey aimed to test: (1) the clarity of the questionnaire’s questions to determine whether the respondents experienced difficulties in understanding the questions; (2) the length of the questionnaire to determine whether the length of the questionnaire was beyond the patience of the respondents; (3) the logic of the questionnaire to determine whether the questions were appropriately ordered; and (4) the design of processes for coding and analysing the data from the questionnaire to determine ease of analysis. The survey was conducted with targeting via polite invitation to participate in the survey of every second person passing by after the interviewer had completed a questionnaire. This method was applied because the pilot survey indicated that only a small proportion of people would agree to participate in the survey. This survey method was most efficient for maximising the survey sample size in this exploratory study within the limited survey time and guaranteed that the survey sampling reflected the characteristics of workers at the sub-centres. A total of 660 questionnaires were distributed, but some were invalid because some respondents provided incomplete information about their commuting activities. Moreover, some reported unreasonable commuting activities, such as four hours by subway one way, or one minute by car one way. The rate of invalid and incomplete responses was about 12.4%. After these invalid and incomplete questionnaires were disregarded, 578 valid responses were finally obtained—151 in CBD, 136 in FS, 152 in ZGC and 139 in the YDZ. Based on the survey of 578 commuters in Beijing’s four employment sub-centres, the quantitative data were systematically coded and arranged using IBM SPSS Statistics 19.0 (IBM Corp.: Armonk, NY, USA, 2010).
The first category of information collected was respondents’ commuting behaviour, including one-way commuting time and commuting mode choice. Commuting distance is not included in this research because many respondents did not know their actual commuting distances or they were reluctant to provide details of their residential addresses, such as the number of the street or road of their home address. Therefore, questions about the districts of the respondents’ residential addresses and the ring roads that the respondents lived within were included in the survey. Information about the 578 respondents is shown in
Table 1,
Table 2 and
Table 3.
3. Results and Discussion
3.1. Relationship between Income and Commuting Time
The authors aggregated the original nine income levels into three income sub-groups: “low income” (<3000 Yuan/month), “middle income” (3000–9000 Yuan/month), and “high income” (>9000 Yuan/month).
Table 4 presents average commuting times for the different income groups.
As shown in
Table 4, high-income commuters, generally speaking, tended to have a longer average commuting time (36.2 min), while middle-income commuters reported a medium average travel time (32.9 min). Low-income commuters had a shorter average commuting time (30.0 min) than those with high- and middle-income levels. The low-income respondents tended to live in close proximity to their workplaces. This suggests that the recent economic regeneration had barely improved the capability of the poor to reach distant employment opportunities that might provide higher wages. For high-income workers, individual attitudes and preferences may also impact on commuting times. Previous research has indicated that commuting times do not always need to be regarded in a negative manner by all people at all times [
44], and this phenomenon may be more obvious in those with high incomes.
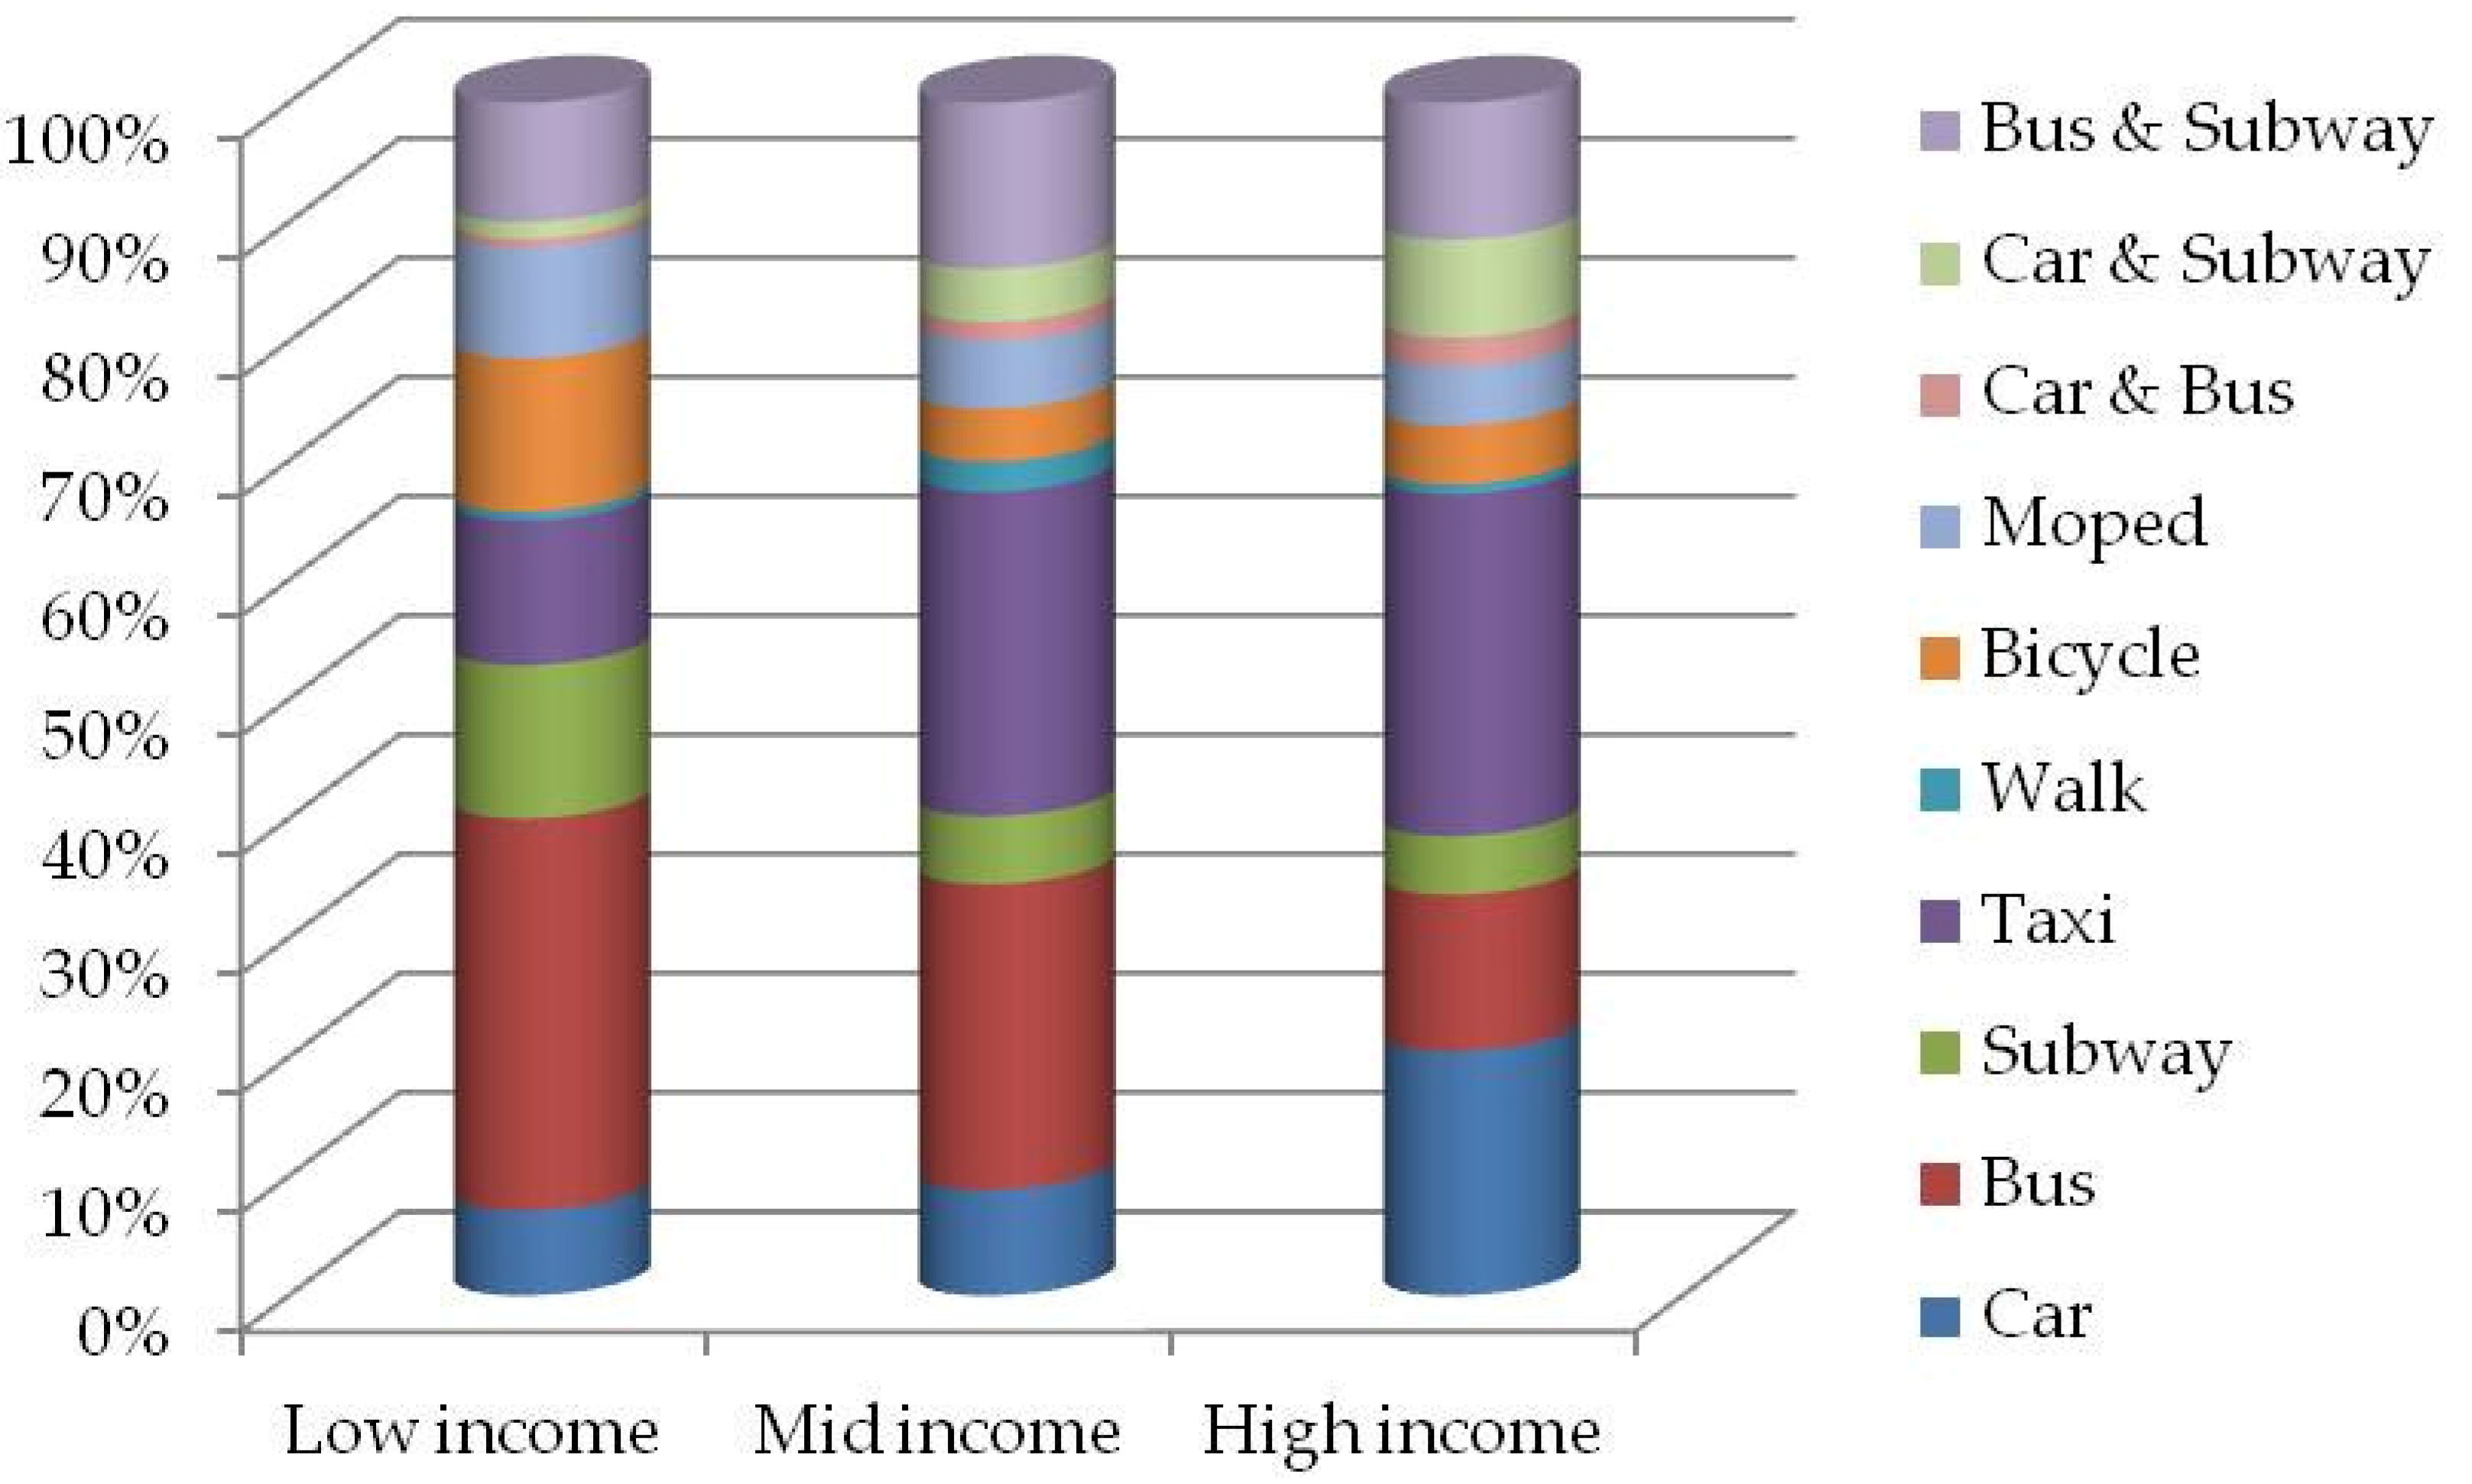
Regarding the low-income respondents and their commuting modal split (
Figure 3), among those who earned less than 3000 Yuan per month, which was about 24.2% of the total respondents, 0.7% walked to their workplaces and 12.9% rode bicycles. Those who travelled by bus and subway accounted for 32.9% and 12.9% of low-income respondents respectively, while about 10% travelled by both bus and subway. About 12.1% of the low-income respondents chose to commute by taxi. Of the low-income respondents, 7.1% commuted by car and 2.1% by both car and bus, or by both car and subway. Low-income respondents tended to use slower or cheap transport modes (e.g., non-motorised modes such as walking and cycling, or bus) to reach their workplaces. The reason for this phenomenon could be that the poverty of the respondents tended to exclude them from seeking distant employment opportunities because of the relatively high cost of using motorised transport modes.
With regard to the middle-income respondents (with monthly incomes between 3000 and 9000 Yuan), who accounted for about 54.7% of the total respondents, 2.5% walked to their workplaces and 4.4% rode by bicycle. About 25.6% and 5.7% of the middle-income respondents commuted by bus and subway respectively, while 13.9% commuted by both bus and subway. Those who took taxis accounted for 27.2% of the middle-income respondents. About 8.9% of middle-income respondents travelled by car and 6% by both car and bus or by both car and subway. The results indicate that compared with low-income respondents, the middle-income respondents had increased levels of car usage, which was reflected in a moderate decrease in non-motorised modes of transport.
When examining the high-income respondents (with monthly incomes over 9000 Yuan), who accounted for 21.1% of the total respondents, only 0.8% chose to commute by walking and 4.9% by bicycle. More than a quarter (28.7%) of high-income respondents travelled by taxi and about 20.5% by car. About 10.7% travelled by both car and bus, or by both car and subway to their workplaces. Of the high-income respondents, 25.9% chose to commute by public transport, including 4.9% by subway, 13.1% by bus and 11.5% by both bus and subway. The results showed that the higher the respondents’ incomes, the more likely they were to use faster and more expensive transport modes (e.g., car or taxi) to reach their workplaces.
3.2. Income Levels and Commuting Modes (Car and Non-Motorised Modes) in Four Sub-Centres
The relationship between income level and commuting transport mode (car and non-motorised modes) was also examined in the four sub-centres. Generally, the results indicated that in each of the four sub-centres, car usage increased as income grew. As can be seen from
Table 5, in the CBD there were no low-income respondents using cars for commuting. Car usage for commuting grew to 4.5% for middle-income respondents and to 15.4% for high-income respondents. A similar trend was seen in FS and ZGC. The results confirm the phenomenon that as income increases, demand for faster and more comfortable transport means increases, causing a rise in motorisation [
45].
Conversely, non-motorised modes (walking and cycling) decreased along with increased income. For example, in FS (see
Table 5), low-income respondents using non-motorised modes for commuting accounted for 30% of all low-income respondents. The proportion declined to 15.0% for the middle-income respondents and to 8.3% for the high-income respondents. The level of non-motorised mode use displays a similar pattern in the YDZ. The reason for this phenomenon is that as income grows, people can afford a motorised transport mode, and therefore the use of non-motorised modes decreases.
3.3. Regression Analysis for Workers in Different Income Groups
A body of research has investigated the impact of local jobs-housing balance on commuting patterns [
8,
13,
44,
46]. Some scholars believed that compared with a monocentric city, polycentric urban development with a balanced jobs-housing relationship in sub-centres would greatly reduce workers’ commuting distances and times [
47,
48].
Multiple linear regression analysis has been widely used in previous research to examine the impacts of land development patterns, individual socio-economic characteristics and other factors on commuting behaviour [
22,
23]. In this paper, a multiple linear regression analysis was used to reveal the impact of certain variables on workers’ commuting times by detecting the relationships between the various independent variables and the dependent variable—workers’ commuting times—to achieve a better understanding of how these factors have influenced workers’ commuting times among various income groups. The analysis applied variables with significant impact on workers’ commuting times, including the jobs-housing proximity variables and the transport mode variables, in order to examine their impact on the commuting times of respondents (see
Table 6). This was done for respondents with low and middle incomes, as well as for respondents with high incomes. This study develops a disaggregated approach to measuring the degree of jobs-housing balance at the individual level, that is, job-based jobs-housing proximity. A job-based jobs-housing proximity variable is used to measure the local jobs-housing balance. Job-based jobs-housing proximity refers to a worker’s access to a workplace, based upon the actual spatial relationship between the individual’s housing and job. To allow the jobs-housing relationships in the four sub-centres to be as spatially comparable as possible, in this research “workplace and housing in the same district” is defined as follows: for employees in the CBD, it means their housing is located in the Chaoyang district and within the fifth ring road; for employees in the ZGC, it means their housing is located in the Haidian district and within the fifth ring road; for employees in FS, it means their housing is located in the Xicheng district; and for those working in the YDZ, it means their housing is located in the YDZ.
The results of the regression analysis are presented in
Table 7 and
Table 8. The regression analysis results for respondents with low and middle incomes (see
Table 7) show that the adjusted
R2 was 0.425, which suggests that 42.5% of the variation in the dependent variable, individual commuting time, can be explained by the independent variables, as detailed in
Table 7. All analysed independent variables have variance inflation factor (VIF) values lower than 10, indicating that the regression analysis has a goodness of fit with regard to the independent variables in
Table 7.
The regression results for respondents with high incomes (see
Table 8) show that the adjusted
R2 was 0.319. All analysed independent variables have VIF values lower than 10, indicating that the regression analysis has a goodness of fit with regard to the independent variables in
Table 8.
The results of the regression analysis showed that job-based jobs-housing relationship (workplace and housing in the same district) has significant impacts on the commuting times of both low- and middle-income workers (unstandardised coefficient of −13.894, p < 0.01) and high-income workers (unstandardised coefficient of −14.859, p < 0.01) when transport mode is controlled for. It is worth noting that the regression analysis results mainly reveal correlations between various variables and not causality. When an employee’s housing is located in the same district as his or her workplace, the employee will have a shorter commuting time. In contrast, when a worker’s housing is located in an outer suburb, the worker often will have a longer commuting time. In addition, the regression results show that the variable of non-motorised transport modes is significantly and negatively related to both low- and middle-income workers’ commuting times (unstandardised coefficient of −17.217, p < 0.01) and high-income workers’ commuting times (unstandardised coefficient of −18.043, p < 0.01).
From
Table 7 and
Table 8, it also can be seen that the subway and bus transport modes significantly and negatively influenced the commuting times of low- and middle-income workers, but they did not have a significant influence on the commuting times of high-income workers. One of the possible reasons for this is that the proportions of low- and middle-income employees who commute by public transport are much higher than for high-income employees. Moreover, Beijing has a comprehensive subway network providing connections between employment sub-centres and several large commercial and affordable residential districts, including Tongzhou, Tiantongyuan and Huilongguan. With locations in the suburbs, these large housing districts usually provide lower-priced housing than commercial housing within a central location. Low- and middle-income employees who can afford this type of housing prefer to reside there. As a result, employment centres that are connected by a subway network have shortened commuting times for low- and middle-income workers. In addition, high-income employees are more capable of changing the locations of residences and workplaces, compared with low- and middle-income employees. This may be because low- and middle-income employees are more dependent on public transport modes to economise on their commuting times than high-income workers who have greater capacity to change their housing locations.
The findings suggest that an improvement in public transport would have a positive effect by reducing the commuting times of low- and middle-income workers who use public transport for commuting. Since the 1990s, the municipal government of Beijing has invested heavily in public transport, particularly in terms of focusing on the urban rail system, including subways and urban light rail. For example, by the end of 2013 Beijing had established an extensive network of urban rail transit with track lengths in operation of 465 km. According to the transportation development plan 2011–2015, more municipal investment would be allocated to improve the urban rail system, and the network would ultimately increase to 660 km by 2015. This massive investment in public transport has greatly improved the efficiency of the transport system, which has played a critically important role in satisfying growing mobility demands in the current rapid urbanisation process. Moreover, improvements in the public transport network can also have the effect of limiting the increase in motorised travel. In general, employment sub-centres with highly accessible public transport, particularly those located in the main urban area, would enhance workers’ accessibility to jobs and thus minimise their commuting times if it is difficult for them to afford the high-priced housing in Beijing’s central locations. In addition to the benefits of Beijing’s extensive public transit network, bus and subway fares are very affordable. The low fare prices enhance affordability of public transport for low- and middle-income workers. This has been achieved via financial subsidies for mass transit services provided by the municipal government of Beijing. Furthermore, the environmental pollution caused by rapid development of motor vehicle transport in Beijing has drawn wide attention in recent years. Automobile emission has become a main factor affecting Beijing’s air quality. The development and improvement of public transport systems would be beneficial for reducing environmental pollution through promoting the use of public transport and decreasing the use of cars. However, substantial increases in bus use would worsen traffic conditions and decrease average automobile speeds due to traffic congestion, possibly leading to a further increase in the total automobile emissions and increased environmental problems. Therefore, the urban rail system is prioritised in the development of public transport in Beijing.
In summary, the results suggest that public policy aimed at shortening employees’ commuting times in Beijing needs to focus more attention on public transport services. Moreover, since public transport is the main transport mode for low- and middle-income workers in Beijing, the findings suggest that the provision of high-quality public transport services would shorten commuting times of low- and middle-income workers and decrease the differences in commuting times between various social groups, resulting in improved social equity.
Table 7 and
Table 8 also show that the variable, car transport mode, has a significant impact on commuting duration of workers with low and middle incomes (unstandardised coefficient of −13.162,
p < 0.01), while it does not have a significant impact on the commuting times of high-income workers. There are two reasons for these results. For the regression model for low- and middle-income workers, the adjusted
R2 is 0.425, while for the regression model for high-income workers, the adjusted
R2 value is only 0.319. The results suggest that when the variables of jobs-housing proximity and transport mode are controlled for, there may be other variables that need to be applied to explain high-income workers’ commuting times. For example, for high-income workers who commute by car, individual attitudes and preferences may also impact on commuting times.
The second reason could be that in recent years, large-scale investment in road infrastructure in Beijing is beneficial for low-income workers who commute by car. The total length of the road network increased from 4460 km in 2007 to 21,614 km in 2013. Considering that the road infrastructure in the main urban area had already been much improved before the 2008 Summer Olympic Games, road infrastructure on the urban fringe has received rapid development in recent years. In Beijing low-income workers usually reside in the outer suburbs, even though they may work in the inner city, because housing in the main urban area is expensive. In the past, road infrastructure in the outer suburbs was normally far from sufficient, particularly when compared with that in the main urban area. However, the massive investment in road infrastructure that has occurred in recent years is likely to be beneficial for low-income workers who live in the outer suburbs and commute by car, particularly compared with high-income workers who live in the inner city where road infrastructure is already well developed.
3.4. The Impact of Polycentric Urban Development on the Jobs-Housing Proximity of Low-Income Workers
In this research, three surveyed sub-centres (FS, CBD and ZGC) are located in the main urban area. Financial Street is 3 km from the city centre, the CBD is 5 km from the city centre, and the ZGC is 11 km from the city centre. The consistent land use patterns and socio-economic characteristics of employees of sub-centres in the main urban area allow examination of the jobs-housing proximity of low-income workers. As can be seen from
Table 9, the greater the distance between the sub-centre and the city centre, the better the job-based jobs-housing spatial relationship of its low-income workers in the three sub-centres (FS, CBD and ZGC) located in the main urban area.
This finding suggests that changes in the location of employment centres in China’s cities may have significant ramifications for the travel behaviour of those from low-income households. Urban land and housing reforms, related to the growing private housing market and changes in land policy, could be a major reason for this. China’s land reform transferred land leasing and land management responsibilities from the central government to local governments. Meanwhile, local governments were also given responsibility to fund more of their municipal services. This change in rights and responsibilities has stimulated local governments to increase their municipal budgets through generating revenue from property development. Accordingly, the “highest and best use” of urban land, such as luxury apartments and commercial uses, was usually encouraged by municipal governments [
49]. In the inner city, old housing and factories are often replaced by modern office buildings and commercial developments. As a result, in the inner city there is limited availability of housing in the lower-priced end of the housing market. Furthermore, in this urban redevelopment process, low-income households had to relocate from the inner city because of the redevelopment strategy and rapidly increasing housing prices. Consequently, the social characteristics of the built environment in the main urban area have been dramatically altered [
38]. It is commonplace for most high-income households in Beijing to reside within the central areas of the city where jobs for highly-educated employees and high-price housing are co-located and there are high levels of accessibility to urban services and superior, abundant amenities. Traditional cultural factors also contribute to this phenomenon, as living in the central city area usually confers a higher social status in China [
50]. By contrast, most low-income workers live in the outer suburbs because they are unable to afford the high-priced housing in the inner city. In Beijing, there is an ongoing trend for luxury housing to be constructed near the city centre, thus favouring high-status workers and forcing low-status workers to reside in urban fringe areas between the 4th and 5th ring roads, 12–16 km from the city centre [
49]. To conclude, in Beijing, due to the fact that most new commercial and affordable housing has been developed on the urban periphery, such as on the fringes of the inner suburbs and in the outer suburbs, when low-income employees work in a sub-centre in the inner city, they often experience long commuting times.
Based on this analysis of the impact of the jobs-housing relationship on the commuting times of low-status workers, in summary it would seem that achieving local jobs-housing balance during the process of decentralisation of employment to suburban sub-centres would be very beneficial for low-income workers. The main reason is that when the jobs-housing balance changes, high-income workers are more capable of changing their housing or workplace locations than are low-income employees. When the degree of jobs-housing balance is low, low-income households are less capable of changing housing or workplace locations, and therefore household members would experience longer commuting times. Accordingly, authorities could encourage new affordable housing projects and implement employment decentralisation strategies to facilitate local jobs-housing relationships that are particularly beneficial for low-income workers. In 2010, more than 70% of affordable housing units in Beijing were located 12 km or more from the inner city [
49]. As a result, workers lived a long distance from the majority of potential job opportunities. In the future, Beijing may need to be proactive in deliberately directing, selecting and managing the location of new affordable housing projects. The authority would have to take charge of promoting more affordable housing in the main urban area for low-income workers so that they can live close to their workplaces. Moreover, employment decentralisation would need to be facilitated by appropriate policies. The service industry, which accounts for about 70% of the total workforce in Beijing, is largely concentrated in the main urban area [
51]. The implementation of policies to facilitate employment decentralisation of service industries to the outer suburbs would be beneficial for a more balanced jobs-housing spatial relationship citywide. Place-based initiatives may be helpful in facilitating increased decentralisation of service jobs. New economic and employment clusters could be formed close to large residential areas in the outer suburbs. Offering financial incentives to attract businesses could help to achieve employment decentralisation to suburbs distant from the inner city.
4. Conclusions
After the launching of economic reforms in 1978, China’s economic performance began to improve substantially. Economic reforms have not only caused economic restructuring but have also impacted on the reorganisation of old urban space and the formation of new urban space, since key policies of economic reforms related to urban scale were launched in the 1980s, including urban land and housing reforms. These reforms have profoundly changed the physical structure of China’s cities in the transformation era. For some mega cities such as Beijing, the urban structure has been evolving towards polycentricity. Moreover, China is experiencing a significant institutional transformation from a centrally planned economy to a market economy. Spatially decentralised concentration of economic activities and employment and its impacts on quality of life have been strongly affected by the interaction between market forces and planning regulations.
Income status is an important variable that is strongly associated with certain commuting behaviour by workers. This study suggests that three key influencing factors—the public transport network, the location of affordable housing projects and the process of employment decentralisation—have played significant roles in affecting workers’ commuting times among various income groups during the process of Beijing’s transition to polycentric development. The results of regression analysis indicate that subway and bus transport significantly and negatively influenced the commuting times of low- and middle-income workers, but the two transport modes did not have a significant influence on high-income workers. One possible reason is that the proportions of low- and middle-income workers who commute by public transport are substantially higher than that of high-income workers. Moreover, Beijing has developed comprehensive subway networks providing connections between these sub-centres and several large commercial and affordable residential districts. With suburban locations, these large residential districts usually provide lower-priced housing than housing with a central location. Low- and middle-income employees can afford these types of housing and normally prefer to live there. As a result, employment sub-centres and workers’ residential areas that are connected by subway networks have reduced low- and middle-income workers’ commuting times. Low- and middle-income workers may become more dependent on public transport to reduce their commuting times, while high-income workers have a greater capacity to change their housing locations in order to achieve shorter commuting times. The findings suggest that improved public transport plays a positive role in shortening the commuting times of low- and middle-income employees, who mainly rely on public transport for commuting. However, it is worth noting that current transit improvements in Beijing, with a focus on the main urban area, may only have limited effects on improving job accessibility for low-income employees who usually reside in the urban fringe. Many low-income workers have to travel by bus or moped to access the closest subway stations if they reside in the urban fringe. Therefore, this research suggests that future development of Beijing’s subway system should include new subway lines that have a greater focus on the outer suburbs where low-income workers are concentrated, as this would be beneficial for low-income workers who have less capacity to adjust their housing locations to secure shorter commuting times.
According to the findings of the paper, it cannot simply be concluded that polycentric urban development in Beijing is beneficial for reducing workers’ commuting times when compared with monocentric urban development and dispersed development. For low-income workers, the formation of sub-centres based on polycentric development may have the potential to reduce workers’ commuting times through promoting jobs-housing balance in the sub-centres of Beijing. Also, the public transport network and the location of affordable housing projects have played significant roles in affecting workers’ commuting behaviour during the formation of sub-centres in the urban suburbs. The results of this study indicate that a balanced jobs-housing relationship can be achieved through adjustment of affordable housing locations, and this can be effective in shortening low-income workers’ commuting times in the sub-centres. This suggests that moderate interventions via spatial planning would be beneficial in improving the jobs-housing balance, thereby decreasing commuting times.
The research has its limitations. As the focus of the study is to examine the commuting times of workers when they work in the sub-centres, comparisons have not been made between workers who work in sub-centres, urban main centres and in the dispersed suburbs. In the Methods section, we have indicated that commuting distance was not included in this research because many respondents did not know their actual commuting distances or they were reluctant to provide details of their residential addresses. In addition, worker’s individual preferences for their residential needs are not addressed in the research. Workers’ commuting behaviours are not only impacted by their job locations but also influenced by other factors such as choice of housing location and residential needs. These impact factors could be considered in future research.


