Article

Alternative Energy Solutions Using BIPV in Apartment Buildings of Developing Countries: A Case Study of North Cyprus

by
Ugochukwu Kenechi Elinwa
1,*,
Mehrshad Radmehr
2 and
John Emmanuel Ogbeba
3
1
Department of Architecture, Faculty of Fine Arts, Design and Architecture Cyprus International University, Famagusta, Via Mersin 10, Lefkosa 99010, Turkey
2
Department of Business Administration Department, Faculty of Economics and Administrative Sciences, Cyprus International University, Famagusta, Via Mersin 10, Lefkosa 99010, Turkey
3
Department of Architecture, Faculty of Architecture, Eastern Mediterranean University, Famagusta, Via Mersin 10, Lefkosa 99010, Turkey
*
Author to whom correspondence should be addressed.
Sustainability 2017, 9(8), 1414; https://0-doi-org.brum.beds.ac.uk/10.3390/su9081414
Submission received: 13 June 2017 / Revised: 14 July 2017 / Accepted: 23 July 2017 / Published: 15 August 2017
(This article belongs to the Special Issue Solar Photovoltaic Electricity)

Abstract

:
The growth in population of North Cyprus, and the increasing demand for housing, are two important factors that are rapidly shaping the development of the island. To meet this housing demand, contractors are resorting to high-rise apartment buildings as a housing solution. The study was carried out to investigate the possibilities of integrating PV systems into apartment buildings. This is a novel approach in housing within the context of North Cyprus. With the use of building information modelling (BIM) software, the possibility of this approach was tested. The study considered several cost variables and the advantages of building integrated photovoltaic (BIPV) systems integrated into apartment buildings at the design stage of the buildings. The willingness to pay (WTP) for this technology was also tested using qualitative methods and an economic analysis was carried out to ascertain the viability and feasibility of this technology. This was in line with present government policies using the net metering system. The method of analysis was carried out using a model proposed for BIPV integration in apartment buildings. The results derived from the survey data suggest that consumers prefer a price lower than €4500 for a 3 kWp integration of solar power equipment to their apartments.

1. Introduction

Buildings account for more than 40% of Europe’s energy consumption. This includes energy consumed by residential, commercial, and industrial buildings. Studies have revealed that 30% of CO2 emissions in the EU are from buildings. Further, it has been found that the energy used in heating living spaces in residential buildings accounts for 57%, while that for water is about 25% of the entire energy used [1,2,3].
It has been stated that there are two major causes for the increase in carbon emission globally—the first is as a result of industrialization, and the other factor has to do with an over dependence and reliance on primary sources of energy, such as fossil fuel. Apparently, CO2 emissions gradually decreased in 2012, although there was a noticeable increase of about 1.4% in global emission in the previous year (2011), attaining a height of about 34.5 billion tonnes in the year 2012. In 2012, oil as a primary source of energy accounted for about 33.1% of the world’s source of energy, making it the primary energy source [4].
Over the years, there have been a plethora of studies undertaken globally that have focused on developing practical methods and tools for energy conservation and optimization within building spaces. Strategies involved here, as suggested by the ENERPOS—Positive Energy—project by Garde et al. [5,6,7,8], include proper cross ventilation and natural lighting of spaces to reduce over dependence of households on mechanical systems. This is achievable by an integrated design approach whose design ideas are strongly influenced by environmental and climatic considerations. These considerations could serve as a solution for enhancing the energy cost effectiveness of buildings. Zhai et al. [9], assert that there is a rapid growth rate in the integration of photovoltaic systems into housing construction within the residential housing sector. Since no two houses are exactly similar, as suggested by Liu et al. [10], it is important to analyze the energy savings potentials of buildings and construction techniques at a micro scale (i.e., individual household scale) and the result can then be possibly extrapolated to a macro scale (i.e., regional or national housing scale). In Kuala Lumpur, a study was carried out by Haw et al. [11] to understand the opinion and thoughts of residents regarding the integration of PV systems into their buildings. Although there is a good supply of solar energy in Malaysia, coupled with the interest of households to take on Building Integrated Photovoltaic (BIPV), the system of BIPV is not very relevant to the local market. This is not only peculiar to Malaysia, but rather is a challenge for many countries. Over the years, strategies have been proposed that could help increase the relevance of PV systems within the residential housing stock. According to James et al. [12], “declining module cost, growing consumer interest in solar energy and policy schemes” could potentially increase PV relevance in the residential housing sector.
Ongoing debates about the possibility of this integration have indicated that consumers are now willing to pay for this micro generation. This leaves governments and policy makers with no option but to seek for ways of encouraging the use of these technologies. The option mostly adopted by these policy makers is the use of incentives, tax cuts, and grants [13,14,15]. According to Stern [16,17], the effectiveness of these policies is dependent on the level to which the promotion can attract potential users, gain their interest, and help them overcome their reluctance of getting involved. To successfully promote micro generation technologies amongst potential users, it is essential to understand the factors that influence their decision towards adopting these new technologies [18,19].
Usually, the major challenge with new technologies lies with the huge investment cost, which could be an obstacle for adopting BIPV systems in building constructions. Scarpa & Willis [20] and Claudy et al. [21] both carried out a study to find out the willingness to pay for the micro-generation of renewable energy by British and Irish households. They found out that the major restricting factor was the cost of investment, which was high. In order to improve the adoption and use of solar energy generating systems in the residential housing sector, it is advantageous to gain support from the government through financial incentives. BIPV could be adopted as a cost effective measure for residential housing energy production if the payback period for the investment on a time scale is less than the lifecycle of the system and within certain measures (such as a subsidy or feed-in-tariff), households would be able to adopt BIPV systems [22]. Over the years, there have been a number of studies conducted to find out people’s perceptions about BIPV [23,24,25,26]. Nevertheless, there is a need for more detailed investigations into the integration of solar systems/technology as a component of the whole building composition at the design stage. The inference here is that if the system is integrated at the design stage, it would be more effective and would incur less cost and damage of buildings’ facades [27].
Introducing virtual platformss and 3D images into the general design and construction scheme can help answer the numerous questions potential customers may have regarding BIPV systems. This gives potential users an in-depth understanding of the BIPV system before choosing to adopt it into the design and construction of their houses. Building information modelling (BIM) software could be used at this stage to demonstrate how the system works. The consumer’s choice and demand are important concepts for ascertaining their willingness to accept and pay for BIPV integrated apartments. Utility estimates can be carried out by simply analysing the customer’s elasticity of demand for both the purchase and utilization of the system.
A number of studies on BIPV technology have been carried out in developing countries with the high potential of solar radiation on standalone houses or villas. However, the potential for implementation of BIPV in apartment buildings has not been adequately explored. Further, current laws do not allow the installation of anything over common areas of apartments. Therefore, further studies can be carried out in this light for the benefit of policy makers.
This study proposes a framework to give a better understanding to both the construction companies and potential house owners of the possibilities that abound for PV integrated into the apartment building at the design stage. The study appraises the households’ maximum willingness to pay for integration of PV into the apartment at the initial design stage. A case study has been carried out in the rural and urban area of Northern Cyprus in order to elaborate the framework. The aim is to achieve compatibility of housing with the environment, without ruining the aesthetic appeal of the buildings, and to give a better understanding to construction companies about ways of adopting BIPV at the design stage.

North Cyprus as a Case Study

In developing countries (like N. Cyprus), the bulk of electricity production is for domestic consumption for either space heating and cooling, or for powering electronic devices and lighting, since industry consumption is relatively low. In Cyprus today, many residential buildings are constructed without paying attention to certain basic bio-climatic principles which eventually lead to an over-dependence on oversized active systems for cooling and heating of spaces. The absence of insulation in the buildings also accounts for the increase in thermal discomfort within interior spaces. In N. Cyprus, heat pumps are used extensively for both heating and cooling in most buildings. 79.2% of residential buildings have single glazed windows and more than 92% of the houses do not have thermal insulation [28].
Cyprus has a typical Mediterranean climate, with about 300 days of sunshine per year. The coldest month is January, having minimum and maximum mean temperatures of 4 °C and 19 °C, respectively. In the hottest month August, the corresponding minimum and maximum mean temperatures are 23 °C and 38 °C, respectively. North Cyprus does not possess any oil or gas reserves, and relies totally on imported energy; these products are essentially imported in the form of oil and gasoline. Power is generated, sold, and distributed by Cyprus’ state-run utility company, Cyprus Turkish Electricity Authority (KIB-TEK) and private sector (AKSA), with the total of around 300 MW.
With the growth rate in the population of North Cyprus as a result of a high influx of students into that side of the island, electricity consumption is also on the rise. In order to meet housing demands, investors have resorted to the construction of apartment buildings, as opposed to the conventional stand-alone villas. Between the years 2001–2010, the human population increased by 36%, while the electricity consumption increased by 49.7%. In like manner, the number of apartments within the last 10 years has increased by about 38% (ref: Famagusta Municipality). This is a clear indication that the rate of demand for electricity will certainly increase if the population continues to increase at the present rate. This high cost of electricity often poses a challenge to students who wish to rent apartments.

2. Integrating Building Integrated Photovoltaic (BIPV) at the Design Stage

The BIPV system has been identified as one of the viable technologies to improve building energy performance and to reduce environmental effects by on-site electricity generation with solar energy. There are two major types of BIPV applications—roof-top and wall/façade mounted. The system involves combining solar photovoltaic electricity technologies with typical building fabrics. Part of the cost of the photovoltaic system is offset by the cost of the material replaced. Some of the materials currently used for photovoltaic include monocrystalline silicon, polycrystalline silicon, amorphous silicon, cadmium telluride, and copper indium selenide/sulfide [28,29,30,31].
A rapidly growing opportunity for photovoltaic applications lies in using photovoltaic modules in place of conventional building materials (Table 1). BIPV products are high-quality construction materials with warranties that match the lifespan of the solar cells.

3. Building Information Modelling (BIM) Solution for BIPV Integration

With the aid of BIM, a building is fully constructed virtually. During the BIM-design phase, one can select and integrate the building elements that will make up the finished structure, including concrete slabs, rebar, steel structure, wall, and ceiling components, HVAC, plumbing and electrical elements. Further, one can also test all such parts for detection of any clashes to ensure everything will come together seamlessly. The 3D building model can then be used to estimate and evaluate the designed building’s energy efficiency by running “what if” scenarios to determine the best of several potential solutions. In addition, depending on the detail of the model, it can automatically take off all items contained in the model, and in that way, produce an impressively precise estimate. The information contained in the various fields of operation for this project can easily be shared with the different professionals involved in the project. This process can be done through a virtual sharing mechanism at every stage of the project [32]. The BIM application is very useful, as it gives a potential client a clear pictorial idea of what the proposed project would look like after completion. However, the BIM tool does not possess the ability to accurately predict the performance output of Photovoltaic against the electricity consumption of the building [33]. There are several other tools that can be used separately from BIM for solar PV modeling to evaluate the PV generation potential of the building. The information can then be extrapolated to the BIM software (AUTODESK, San Rafael, California, United States) and presented in three-dimensional views. 
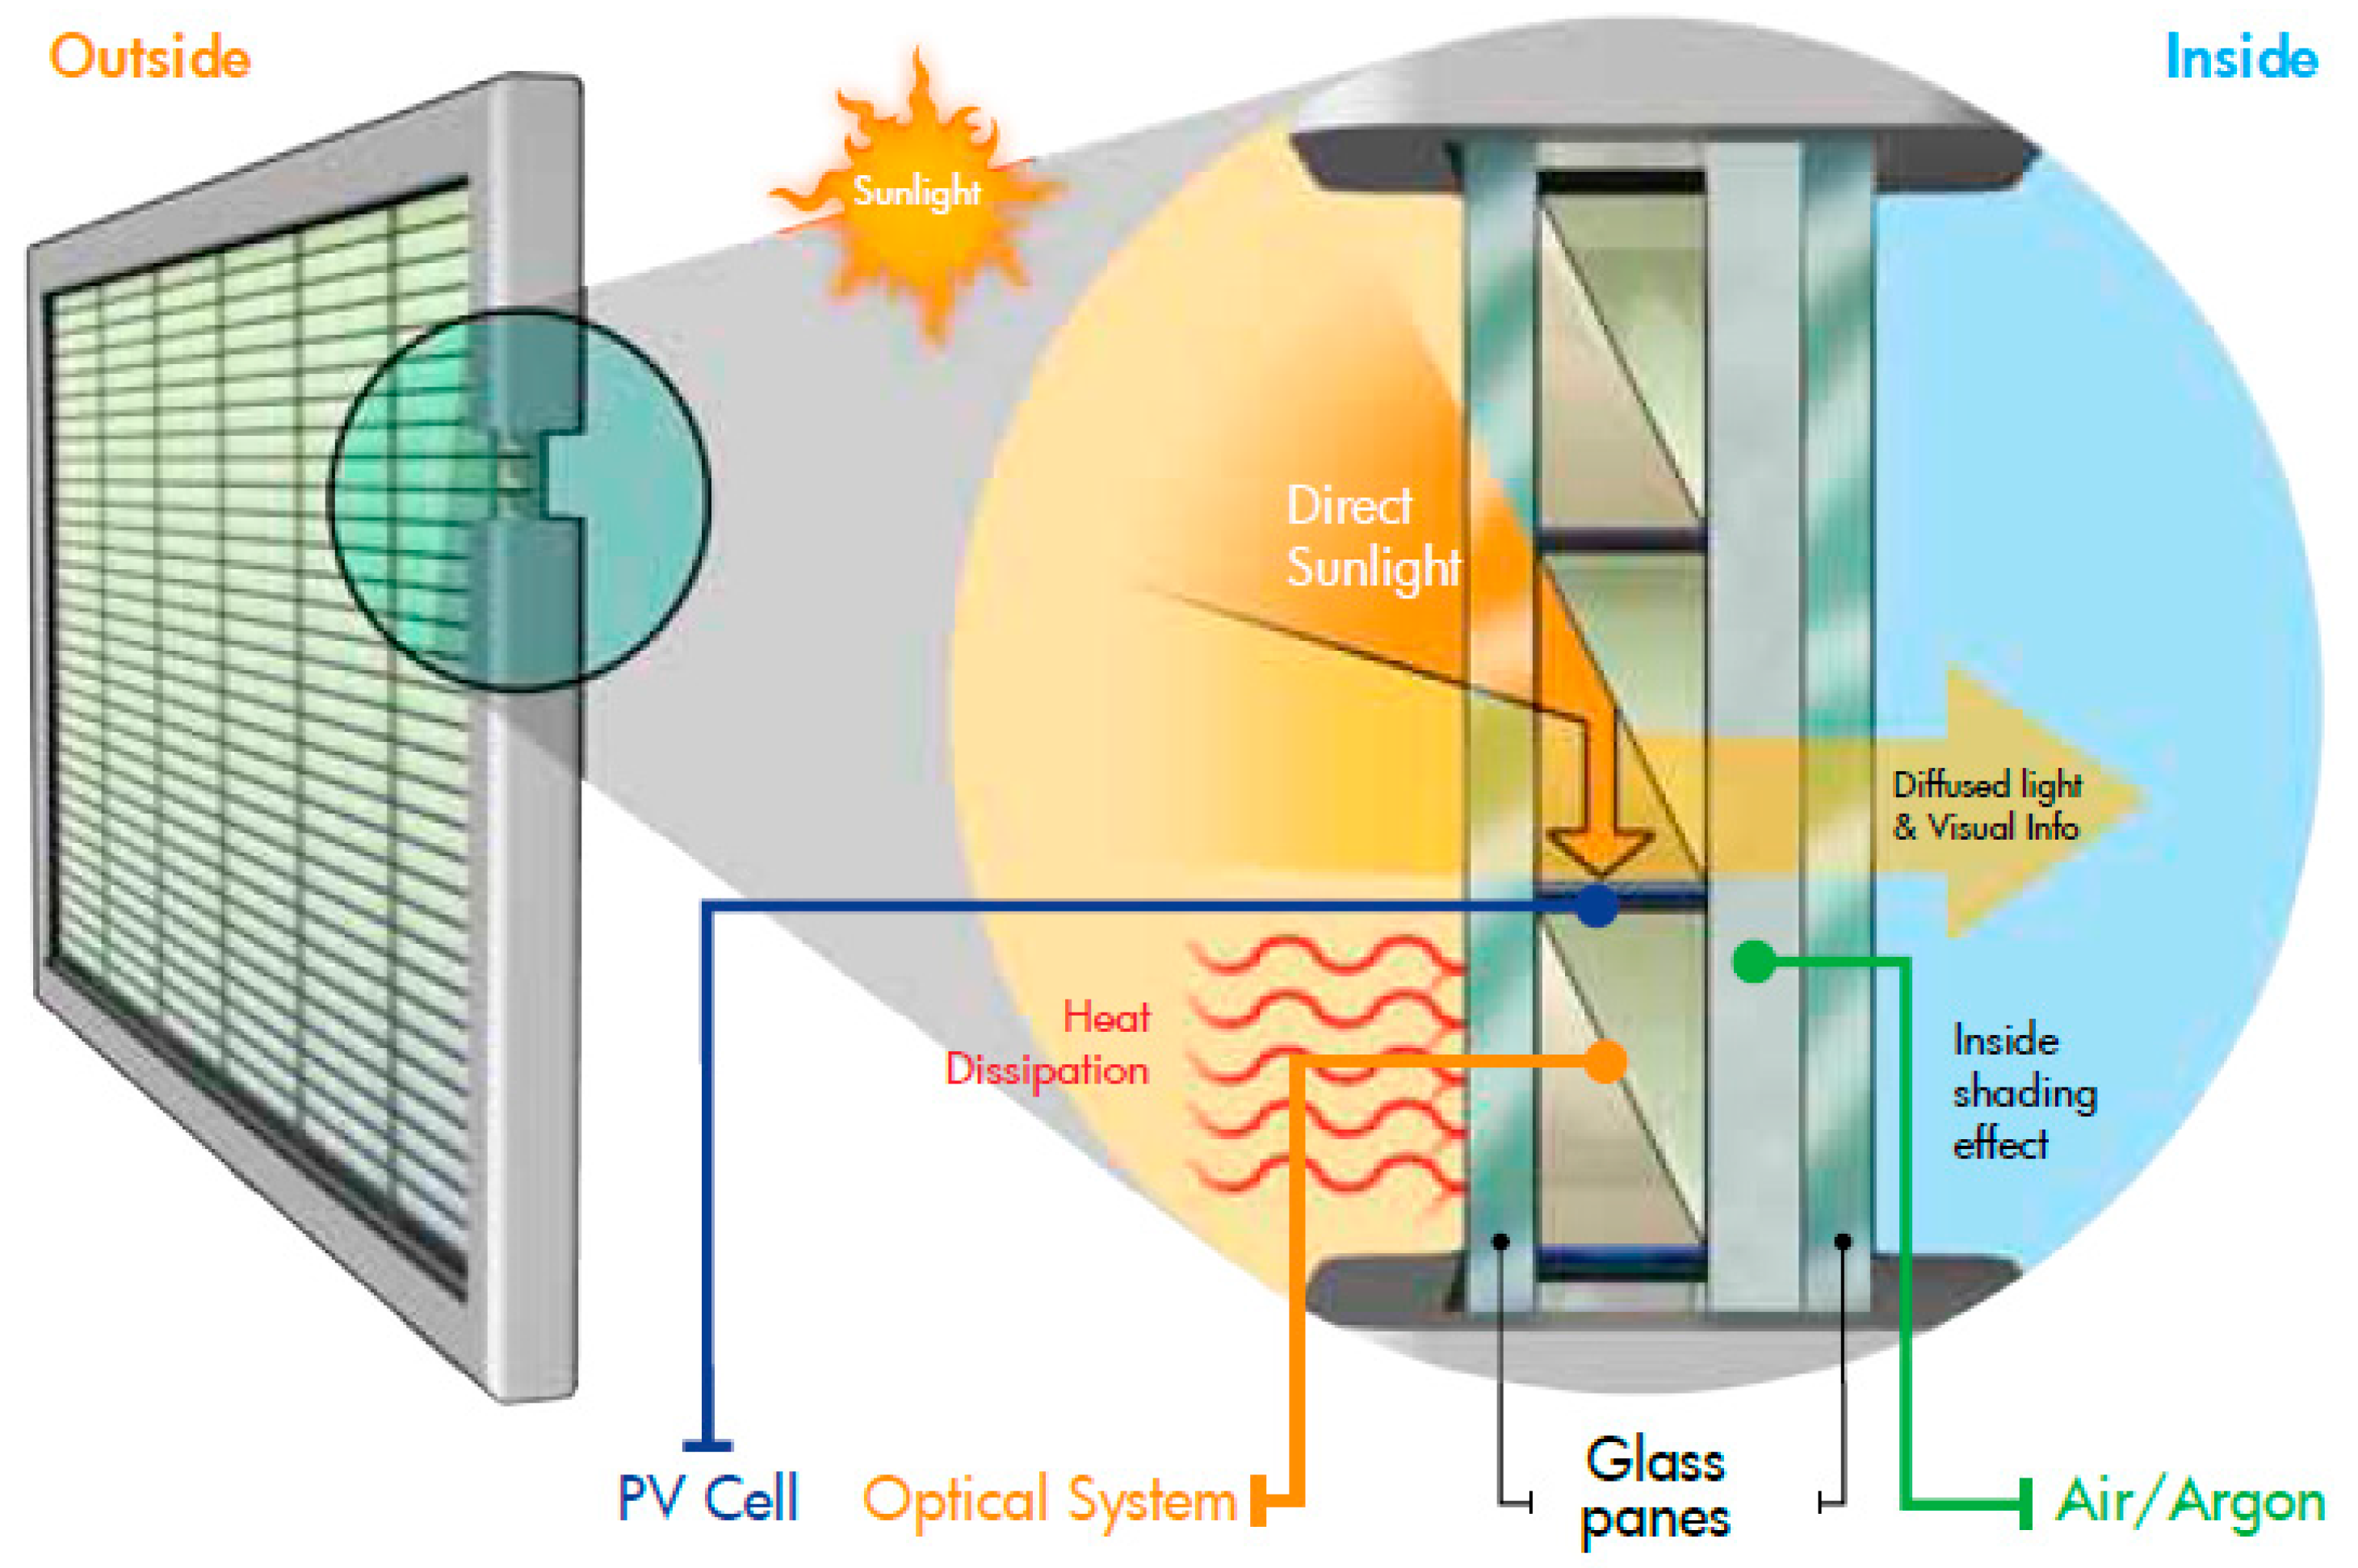
Figure 1 shows the integration of PV systems into window design (Photovoltaic Glass Unit).
This BIPV solar window offers architects and building owners looking for value-added architectural glass products the choice to choose between BIPV glass products and various “tenable” or “smart” windows. Using BIM tools, the integration of PV into the building components can be visualised and analysed (Table 2).

4. Methodology

The study objectives include five stages, which are as follows: Analysis, Preliminary Design Stage, BIM, Cost, WTP, and Implementation. This study will be actualized in stages, as depicted in Figure 2. The methodology employed is designed with the intention to unveil to construction companies and potential customers the great potential and possibilities that can be obtained from the use of BIPV.
Each stage of the proposed framework will be elaborated using a case study of an apartment building which consists of 10 flats on five floors. For this purpose, an analysis was carried out using a real case by means of careful observations. Figure 3 shows a typical example of an existing apartment building with a solar water heating system.
During the study, certain parameters were considered in line with PV applications and space availability. For the apartment in Figure 4, the parameters are given in Table 3.

4.1. STAGE 1

Analysis

For a design to be successful, the architect must pay attention to providing the spatial needs of the client in a healthy arrangement that projects good functionality. After the briefing and debriefing processes have been carried out, several options could then be considered as possible solutions for the spatial arrangement of the building. At this level, consideration should be given to using materials that have a strong ability to enhance energy conservation. Energy potential can be maximized if the site context is studied adequately before proposing or choosing a best fit design for the project. The possibility of doing this without distorting the façade aesthetics of the building is the main objective for creating this analysis. This further analyses the importance of introducing BIPV in apartment buildings.

4.2. STAGE 2

Preliminary Design Stage

At this stage, the study is more focused on providing design solutions suitable for the proposed project. The duration of surface heating or cooling is important for understanding the best positions to adopt as PV integral surfaces for houses. One major challenge that will be encountered when two or more tall buildings are next to each other is shading. Surfaces tend to be kept away from the reach of the sun for a good number of hours. In this stage of the methodology, the number of hours of sun lighting and the number of hours a building receives sun rays are as important as the parts of building and surface area under constant heating from sunrise to sunset.

4.3. STAGE 3

Virtual Operations

This procedure facilitates the adoption of the best environmentally friendly solution for BIPV integration. With this, several building options and materials can be tested using an element/component based integration approach (i.e.; wall facades, roofs, shading devices) modelled on a virtual platform (BIM).
In order to achieve a perfect outcome from BIM (intention to realisation), there are four stages that can be followed. These stages are planning, integration, installation, and management.
Such issues as described in the Figure 4 above can be avoided if PV systems are carefully integrated into the building at the design stage using BIM. This will eliminate certain challenges such as additional cost, time, and labour.
Figure 4 is an example of BIM application for resolving the technicalities of PV integration into buildings, while Figure 5 shows the sun path study using BIM software. An important consideration during this process is the setbacks between buildings. In North Cyprus, building policies require a minimum of 6 m as setback between two buildings. This is so in order to prevent sun blocking by surrounding buildings.
The optimized distance between front and back rows of solar collectors depends mainly on the geographical location of the project. Methods on working out the ratio of distance (D) and height (H) has been provided in national technical recommendations [34]. For an all-year operating solar systems facing the south, the optimized distance (D) are determined by examining the situation at 9:00 a.m. local time in equinoctial days, while the optimal tilt (b) equals to the latitude.
For this study, the integration of PV into the different elements of the building such as balustrades, windows, shading device, and roof will generate a sum total of about 10 kW (Table 4).

4.4. STAGE 4

Feasibility Study; PC (Project Cost)

The feasibility study analyses the total cost of the project, (i.e., from the design stage to the commissioning). This gives the contractor an idea of the viability of the project in order not to incur unprecedented losses resulting from the project. After carrying out a full assessment of the project, potential users are also aware of the cost implications for choosing a particular solution and so they know what they stand to gain or lose. This leads us to the next stage of the methodology, which is people’s willingness to pay for BIPV integration in their buildings at the design stage.
From the BIM analysis, it has been established that about 10 kW will be generated in situ, and the potential users of the apartment would be dependent on the willingness of the users to pay for the apartments that have BIPV integrated into them. Potential buyers can choose the quantity level of PVs, from 1 kWp with the cost of €1500, 2 kWp with the cost of €3000, 3 kWp with the cost €4500, and 4 kWp with the cost of €6000. Based on the present government policies for PV systems in houses, there are no financial incentives for initial investment and feed in tariff. The new policy is based on the net metering system. The net metering involves offsetting excess electricity with as much electricity used by them. In this case, the excess cannot be sold but can only be balanced yearly. Net metering is applied at the end of each month and restart at the beginning of each year. At the end of the year, all excess feeds are vanished.

4.5. STAGE 5

4.5.1. People’s Willingness to Pay for PV Integration

After establishing the first four objectives, a yardstick (criteria) is formed for assessing the willingness of potential house owners to invest in this system based on their perceptions and preferences. The decision to do so relies greatly on the payback period of investing in the system. The Contingent Valuation (CV) technique has been used to estimate consumers demand and WTP for BIPV that is likely to vary on the basis of the cost and the value of energy production. In this context, a flat could be sold as a bundle of attributes. Developers do not know the customer’s preferences and what is his/her maximum willingness to pay for each attribute e.g., preferences for BIPV and in what scale. WTP is evaluated using the expenditure (e) representation:
WTP = e (p, Q0, U) − e (p*, Q1, U)
where Q0 is the good without BIPV, and Q1 is the good with BIPV; p is the price of the good without the BIPV attribute, and p* a price vector of the good with the BIPV attribute. By allowing the price (p*) of the good or attribute to vary across customers, the demand or marginal valuation curve for BIPV can be estimated. The demand can be mapped through the examination of WTP for price p*, holding utility constant.
The energy consumption differs according to the households’ population, their age, job, and other demographic characteristics. For instance, when a household’s members have job commitments and cannot be at home during the day, the BIPV may be evaluated differently from retired or unemployed households.

4.5.2. Study Sample

The sample of the study consisted of 100 head householders, aged above 18, with a mean age of 50 regardless of their gender. The survey was carried out from individuals in the group of five to twelve participants.
The WTP questions were elicited through a close-ended dichotomous (double-bounded) format. The double-bounded dichotomous choice has become a dominant approach in environmental valuation studies because of the capability to facilitate tighter confidence intervals of WTP distribution [33]. The approach provides respondents with the opportunity of a lower value to a ‘no’ answer and an upper level of price to a ‘yes’ answer. If an individual said ‘yes’ to the first bid value, then she/he was asked to a higher level of bid, and if an individual’s response was ‘no’ to the first bid, then she was offered a lower level of bid. An example of the bid questions is shown below
€2,250?
If the answer to €1500/1 kW for BIPV was ‘yes’ then respondent was asked
If the answer to €1500/1 kW for BIPV was ‘no’ then respondent was asked
€750?
In this context, a 100 m2 flat for a typical family of three was the case, and the WTP questions were presented with different levels of bids for integration of PV to their apartments. The choice for the quantity of BIPV was based on first come first serve, so there was no limitation for the choice of size or amount.
As shown in Table 5, the four level of prices were €1500 for 1 kWp (provides 20% of a household’s need), €3000 for 2 kWp (provides 40% a household’s need), €4500 for 3 kWp (provides 60% of a household’s need), and €6000 for 4 kWp (provides 80% of a household’s need).
The four above-mentioned values were varied randomly across each of the 25 respondents. This produced a total number of 100 observations.

4.5.3. WTP Analysis

A parametric and non-parametric approach was applied to analyse the WTP responses. To estimate the covariates models, a sample mean needs to be adjusted to its relevant population, by assessing the likelihood of ‘yes’ as a function of exogenous variables. However, despite the advantages of the parametric models, we used the non-parametric approach in the risk of distribution’s misspecification.
A Logit model with a logistic distribution through the procedure of maximum likelihood estimate (MLE) was used for analysing the maximum WTP observations. The mean consumer surplus was calculated from the result of MLE through logistic regression equation [35].
Log (Prob Yes/1 − Prob Yes) = a + price
From the MLE results in Table 6 and Equation (1) the mean consumer surplus was calculated equal to €3870.

4.5.4. Non-Parametric Analysis

Table 7 represents individuals’ responses to the offered prices. The respondents’ answers to the values are recorded as ‘yes’ and ‘no’ answers. As reported in Table 7, the empirical distribution of WTP does not monotically decreases as the bidding value increases. The responses to €3750 Euros violate the monotonicity assumption of the distribution; therefore, the data were pooled to smooth the distribution following the reviewed steps of the Turnbull calculation by some researchers [36].
The 84% ‘yes’ responses to 1 kWp for the price of €750 implies cost is a significant factor in making decision and paying for BIPV. Any of the four (1, 2, 3, and 4 kWp) quantities practically has been valued at their lower price. The second most preferred quantity of BIPV was 3 kWp for the price of €3750.
As reported in Table 8, the proportion of respondents answering ‘no’ increases and the proportion respondents answering ‘yes’ decreases. To approximate the lower bound of each interval, the Turnbull Lower Bound Mean (LBM) was used to ascertain the interval of actual WTP.
LBM   ( Turnbull ) =   p i B i +   m i = 2 P i ( B i B i 1 )
LBM = €3082.5
The LBM equals €3082 was calculated based on the lower level values. Similarly, the mean value for upper level values was equal €3555.
UBM =   i = 1 m p i ( B i + 1 B i )
UBM = €3555
The outcomes of LBM and UBM values and consumer mean surplus imply that consumers prefer a price lower price than €4500 for a 3 kWp integration of solar power equipment to their apartments.

4.6. STAGE 6

Project Implementation

From the design stage, attention is paid to the building façade in order not to destroy the aesthetics of the façade. The goal of the designer is to make sure that the component based integration of the PV collectors leaves a clean and appealing finishing.

5. Conclusions

The need for sustainable sources of energy cannot be overemphasised. In the study of ecological resilience, PV integration into buildings can be an approach towards reducing the damage done to the ecosystem through conventional energy sources. Although this system and its application is still new in Famagusta, there are chances that it could reduce the long-term cost of electricity generation and thereby increase savings. Government policies and programs can enhance this process and through education, enlightenment, and also investing in advanced research within this field. The study shows that the 84% ‘yes’ responses in implementation of 1 kWp for the price of €750 implies cost is a significant factor in making decision and paying for BIPV. From the survey data of this study, the results of LBM and UBM values and consumer mean surplus suggest that consumers prefer a 3 kWp integration of solar power equipment to their apartments, but for a price lower than €4500.
Professionals within the building construction industry could start looking in the direction of BIPV integration and the use of BIM application for resolving the technicalities of PV integration into buildings. These should be taken into account especially at the design stage of housing projects, in order to save costs and maximise the integration potential of PV systems in buildings.

Author Contributions

Ugochuckwu K. Elinwa and John E. Ogbeba conceived and designed the experiments; Ugochukwu K. Elinwa performed the experiments; Mehrshad Radmehr and John E. Ogbeba analyzed the data; Ugochukwu K. Elinwa, Mehrshad Radmehr and John E. Ogbeba wrote the paper.”

Conflicts of Interest

The authors declare no conflict of interest.

References

  1. Zogou, O.; Stapountzis, H. Energy analysis of an improved concept of integrated PV panels in an office building in central Greece. Appl. Energy 2011, 88, 853–866. [Google Scholar] [CrossRef]
  2. European Parliament and Council. Directive 2002/91/EC of the European Parliament and of the Council of 16 December 2002 on the Energy Performance of Buildings. Available online: http://eur-lex.europa.eu/legal-content/EN/TXT/?uri=CELEX%3A32002L0091 (accessed on 14 July 2017).
  3. Filippini, M.; Hunt, L.C.; Zorić, J. Impact of energy policy instruments on the estimated level of underlying energy efficiency in the EU residential sector. Energy Policy 2014, 69, 73–81. [Google Scholar] [CrossRef]
  4. Trends in Global CO2 Emissions, Pbl Netherlands Environmental Assessment Agency REPORT, 2013. Available online: http://www.pbl.nl/sites/default/files/cms/publicaties/pbl-2013-trends-in-global-co2-emissions-2013-report-1148.pdf (accessed on 14 July 2017).
  5. Garde, F.; Bastide, A.; Wurtz, E.; Achard, G.; Dobre, O.; Thellier, F.; Ottenwelter, E.; Ferjani, N.; Bornarel, A. ENERPOS: A National French Research Program for Developing New Methods for the Design of Zero Energy Buildings, CESB 07; Central Europe towards Sustainable Buildings: Prague, Czech Republic, 2007. [Google Scholar]
  6. Imal, M.; Yılmaz, K.; Pınarbaşı, A. Energy Efficiency Evaluation and Economic Feasibility Analysis of a Geothermal Heating and Cooling System with a Vapor-Compression Chiller System. Sustainability 2015, 7, 12926–12946. [Google Scholar] [CrossRef]
  7. Li, X.F.; Vladimir, S. Energy and Greenhouse Gas Emission Assessment of Conventional and Solar Assisted Air Conditioning Systems. Sustainability 2015, 7, 14710–14728. [Google Scholar] [CrossRef]
  8. Park, D.J.; Yu, K.H.; Yoon, Y.S.; Kim, K.H.; Kim, S.S. Analysis of a building energy efficiency certification system in Korea. Sustainability 2015, 7, 16086–16107. [Google Scholar] [CrossRef]
  9. Zhai, X.Q.; Wang, R.Z.; Dai, Y.J.; Wu, J.Y.; Xu, Y.X.; Ma, Q. Solarintegrated energy systemforagreenbuilding. Energy Build. 2007, 39, 985–993. [Google Scholar] [CrossRef]
  10. Liu, Z.; Osmani, M.; Demian, P.; Baldwin, A.N. The potential use of BIM to aid construction waste minimalisation. In Proceedings of the International Conference of CIB, Antipolis, France, 26–28 October 2011; pp. W78–W102. [Google Scholar]
  11. Haw, L.; Sopian, K.; Sulaiman, Y. Public response to residential building integrated photovoltaic system (BIPV) in Kuala Lumpur urban area. In Proceedings of the 4th IASME/WSEAS International Conference on Energy& Environment, Cambridge, UK, 24–26 February 2009; pp. 212–219. [Google Scholar]
  12. James, T.; Goodrich, A.; Woodhouse, M.; Margolis, R.; Ong, S. Building-Integrated Photovoltaics (BIPV) in the residential sector: An analysis of installed rooftop system prices. Contract 2011, 303, 275–300. [Google Scholar]
  13. Sorrell, S.; O’Malley, E.; Schleich, J.; Scott, S. The Economics of Energy Efficiency: Barriers to Cost-Effective Investment; Edward Elgar: Cheltenham, UK, 2004. [Google Scholar]
  14. Trianni, A.; Cagno, E.; Thollander, P.; Backlund, S. Barriers to industrial energy efficiency in foundries: A European comparison. J. Clean. Prod. 2013, 40, 161–176. [Google Scholar] [CrossRef]
  15. Gandhi, P.; Brager, G.S. Commercial office plug load energy consumption trends and the role of occupant behavior. Energy Build. 2016, 125, 1–8. [Google Scholar] [CrossRef]
  16. Stern, P.C. Information, incentives and pro environmental behaviour. J. Consum. Policy 1999, 22, 461–478. [Google Scholar] [CrossRef]
  17. Kopsakangas-Savolainen, M.; Juutinen, A. Energy consumption and savings: A survey-based study of Finnish households. J. Environ. Econ. Policy 2013, 2, 71–92. [Google Scholar] [CrossRef]
  18. Hastings, G. Social Marketing: Why Should the Devil Have All the Best Tunes; Butterworth-Heinemann: Oxford, UK, 2007. [Google Scholar]
  19. Wymer, W. Developing more effective social marketing strategies. J. Soc. Market. 2011, 1, 17–31. [Google Scholar] [CrossRef]
  20. Scarpa, R.; Willis, K. Willingness-to-pay for renewable energy: Primary and discretionary choice of British households ‘for micro-generation technologies. Energy Econ. 2010, 32, 129–136. [Google Scholar] [CrossRef]
  21. Claudy, M.C.; Michelsen, C.; O’Driscoll, A. The diffusion of microgeneration technologies—Assessing the influence of perceived product characteristics on home owners’willingnesstopay. Energy Policy 2011, 39, 1459–1469. [Google Scholar] [CrossRef]
  22. Eiffert, P. Guidelines for the Economic Evaluation of Building-Integrated Photovoltaic Power Systems (No. NREL/TP-550-31977); National Renewable Energy Lab: Golden, CO, USA, 2003.
  23. Malagueta, D.; Szklo, A.; Borba, B.S.M.C.; Soria, R.; Aragão, R.; Schaeffer, R.; Dutra, R. Assessing incentive policies for integrating centralized solar power generation in the Brazilian electric power system. Energy Policy 2013, 59, 198–212. [Google Scholar] [CrossRef]
  24. Makrides, G.; Zinsser, B.; Norton, M.; Georghiou, G.E.; Schubert, M.; Werner, J.H. Potential of photovoltaic systems in countries with high solar irradiation. Renew. Sustain. Energy. Rev. 2010, 14, 754–762. [Google Scholar] [CrossRef]
  25. Celiktas, M.S.; Sevgili, T.; Kocar, G. A snap shot of renewable energy research in Turkey. Renew. Energy 2009, 34, 1479–1486. [Google Scholar] [CrossRef]
  26. Shi, J.; Su, W.; Zhu, M.; Chen, H.; Pan, Y.; Wan, S.; Wang, Y. Solar water heating system integrated design in high-rise apartment in China. Energy Build. 2013, 58, 19–26. [Google Scholar] [CrossRef]
  27. Johnston, D. Solar energy systems installed on Chinese-style buildings. Energy Build. 2007, 39, 385–392. [Google Scholar] [CrossRef]
  28. Large-Scale, Cheap Solar Electricity. Available online: http://www.technologyreview.com/readarticle.aspx?id=17025&ch=biztech (accessed on 23 June 2006).
  29. Jacobson, M.Z. Review of solutions to global warming, air pollution and energy security. Energy Environ. Sci. 2009, 2, 148–173. [Google Scholar] [CrossRef]
  30. Strong, S. Building Integrated Photovoltaics (BIPV). Available online: http://www.wbdg.org/resources/bipv.php (accessed on 9 June 2010).
  31. Solangi, K.H.; Islam, M.R.; Saidur, R.; Rahim, N.A.; Fayaz, H. A review on global solar energy policy. Renew. Sustain. Energy Rev. 2011, 15, 2149–2163. [Google Scholar] [CrossRef]
  32. Radmehr, M.; Willis, K.; Elinwa, U. A framework for evaluating WTP for BIPV in residential housing design in developing countries: A case study of North Cyprus. Energy Policy 2014, 70, 207–216. [Google Scholar] [CrossRef]
  33. Carson, R.T.; Groves, T. Incentive and informational properties of preference questions. Environ. Resour. Econ. 2007, 37, 181–210. [Google Scholar] [CrossRef]
  34. Dubois, M.-C.; Horvat, M. Task 41—Solar Energy and Architecture, Subtask B—Report T.41.B.1 Methods and Tools for Solar Design:State-of-the-Art of Digital Tools Used by Architects for Solar Design. Available online: http://archive.iea-shc.org/publications/downloads/IEA-T41_STB-DB1_SOA-DigitalTools.pdf2010 (accessed on 14 July 2017).
  35. Loomis, J.B. Contingnet Valuation Using Dichotomous Choice Models. J. Leis. Res. 1988, 20, 46–56. [Google Scholar]
  36. Haab, T.C.; McConnell, K.E. Valuing Environmental and Natural Resources: The Econometrics of Non-Market Valuation; Edward Elgar Publishing: Cheltenham, UK, 2002. [Google Scholar]
Figure 1. Integration of photovoltaic (PV) systems into window design (Photovoltaic Glass Unit pythagoras-solar.com).
Sustainability 09 01414 g001
Figure 2. Proposed framework.
Sustainability 09 01414 g002
Figure 3. Study of an existing building.
Sustainability 09 01414 g003
Figure 4. BIM application for resolving the technicalities of PV integration into buildings.
Sustainability 09 01414 g004
Figure 5. Summer time sun path (8 a.m.; 12 p.m.; 5 p.m.).
Sustainability 09 01414 g005
Table 1. Applications of solar collectors on building elements.
NameWindowBalcony Column BoardSun Shading BoardRoof Structure
appearance Sustainability 09 01414 i001 Sustainability 09 01414 i002 Sustainability 09 01414 i003 Sustainability 09 01414 i004
angle90904530
CharacterJunction Box Top edge mountedIntegrated with balcony’s board commonly, the BIPV construction is simple, and its maintenance easyEasy to install. Its inclined angle is considered by maximum efficiency. Integrated PV element to be placed as shading device over window.Formed from single row type. Metal or concrete trestles are used to install PV collectors continuously inline. Easy to accept sun shine.
Application scope Multi rise or high-rise apartmentsMulti rise or high-rise apartments5 to 12 story apartments5 to 12 story apartments
Maximum power density 120 Wp/m2120 Wp/m2 120 Wp/m2 200 Wp per panel
Mono-crystallineMono-crystallineMono-crystallineMono-crystalline
Table 2. Parameters for photovoltaic (PV) integration into window component using building information modelling (BIM).
Photovoltaic Glass UnitUnit Mechanical SpecificationElectrical SpecificationsMechanical Characteristics
Sustainability 09 01414 i005Length 60′′ (1524 mm)Max. Power Density 120 Wp/m2Solar Cells monocrystalline PV cells
Module Efficiency up to 12.0%Weight/unit area ~41.6 kg/m2 (~8.5 lb/ft2)
Width 60′′ (1524 mm)Tested Operating Temp. −40 °C–85 °CJunction Box Top edge mounted
Max. System Voltage 600 V DCOutput Cables Length per requirements—MC3 connectors
Thickness 1 1/4′′ (32 mm)Max. Series Fuse Rating 15 amps
Power Tolerance ±5%Unit Thickness 28 mm–36 mm (1 1/8”–1 7/16”)
Table 3. Parameters for the current building.
Height of Building18 m
Floor area100 × 2 m2
Total roof area200 m2
Roof Area for water heater30 m2
Roof area for PV panels22 m2
Table 4. Breakdown of the percentile distribution of surfaces to be integrated with PV collectors.
Building ElementPercentage of PVTilt AngleEnergy Produced
Balustrades14%90°1.2 kW
Window Panes20%90°2.0 kW
Shading Devices And18%45°1.8 kW
Roof48%30°5.0 kW
Total kW10 kW
Table 5. Initial bidding values.
First Bid €FrequencyPercentCumulative FrequencyCumulative Percent
15002525.02525.00
30002525.05050.00
45002525.07575.00
60002525.0100100.00
Values in Euros, 2014 prices.
Table 6. Maximum likelihood estimate.
ParameterDFEstimateStandard ErrorWald Chi-SquarePr > Chi-sq
Intercept10.3261 ***0.19014.51110.0012
WTP1−0.0003 ***0.0000266.52160.0002
Note: *** ⟹ Significance at 1% level.
Table 7. Proportion of Yes responses.
N 100Bid Price €Yes ProportionNo ProportionYes%
17500.840.1684%
215000.560.4456%
322500.440.5644%
430000.360.6436%
537500.640.3664%
645000.400.6040%
752500.280.7228%
860000.200.8020%
967500.120.8812%
Table 8. Proportion of Yes answers after pooling.
N 100Bid Price €Yes’sYes ProportionNo ProportionYes%
1750210.840.1684%
21500150.600.3460%
32250130.520.4852%
43000----
53750250.500.5050%
64500100.400.6060%
7525080.280.6228%
8600050.200.8020%
9675030.120.8812%

