Revealing the Linkage Network Dynamic Structures of Chinese Maritime Ports through Automatic Information System Data


1
State Key Laboratory of Information Engineering in Surveying, Mapping and Remote Sensing (LIESMARS), Wuhan University, Luoyu Road 129, Wuhan 430079, China
2
Collaborative Innovation Center of Geospatial Technology, 129 Luoyu Road, Wuhan 430079, China
3
Department of Geography at the University of Tennessee, 304 Burchfiel Geography Building Knoxville, Knoxville, TN 37996-0925, USA
*
Author to whom correspondence should be addressed.
Sustainability 2017, 9(10), 1913; https://0-doi-org.brum.beds.ac.uk/10.3390/su9101913
Submission received: 26 July 2017
/
Revised: 28 September 2017
/
Accepted: 19 October 2017
/
Published: 23 October 2017
Abstract
:Marine economic cooperation has emerged as a major theme in this era of globalization; hence, maritime network connectivity and dynamics have attracted more and more attention. Port construction and maritime route improvements increase maritime trade and thus facilitate economic viability and resource sustainability. This paper reveals the regional dimension of inter-port linkage dynamic structure of Chinese maritime ports from a complex multilayer perspective that is meaningful for strategic forecasting and regional long-term economic development planning. In this research, Automatic Information System (AIS)-derived traffic flows were used to construct a maritime network and subnetworks based on the geographical locations of ports. The linkage intensity between subnetworks, the linkage tightness within subnetworks, the spatial isolation between high-intensity backbones and tight skeleton networks, and a linkage concentration index for each port were calculated. The ports, in turn, were analyzed based on these network attributes. This study analyzed the external competitiveness and internal cohesion of each subnetwork. The results revealed problems in port management and planning, such as unclear divisions in port operations. More critically, weak complementary relationships between the backbone and skeleton networks among the ports reduce connectivity and must be strengthened. This research contributes to the body of work supporting strategic decision-making for future development.
1. Introduction
Maritime transportation is clean, safe, and cheap relative to other transportation modes, and is the important mode of transportation for domestic and international trade [1]. With the rapid growth of maritime transportation and sustained increases in direct shipment and transshipment services, maritime network analysis has attracted much attention. Maritime network analysis is necessary for policymakers to make wise choices that maintain the equilibrium between exploitation and use of maritime resources and protection of the maritime environment, for example, optimal configuration of shipping services, integration and coordination of shipping, and rational planning layouts for ports [2]. Moreover, maritime network analysis is meaningful for understanding potential strategic alliances, strategic forecasting, and planning with a focus on long-term regionalization of economic development [3].
Most research work on maritime networks has been carried out from one of three perspectives: maritime network design in theory, spatial structure analysis in practice, and mining dynamic evolution patterns in application.
Maritime network design research aims to optimize shipping services and route schedules using hub-and-spoke, multi-port of call, and liner shipping strategies [4]. Many factors must be accounted for, such as ship size, sailing frequency, shipment types, transit time constraints, economies of scale in ship deployment, and transshipment costs. Some proposed approaches include a two-objective model that minimizes shipping and inventory costs [5], mixed-integer programming and its variations [6,7], operating cost minimization models [8], probability distribution-free linear fleet deployment models [9], and mixed-integer nonlinear optimization models [10]. However, maritime network design is often based on assumptions, for example, that a network is a complete graph, or that total shipping demand is constant [11,12]. These approaches fall short in practice because of the complex and variable demands found in highly dynamic maritime transportation.
Maritime network spatial structural analysis is also attracting increasing attention in international economies and the domains of global trade and travel. It is typically investigated by analyzing network nodes and linkages, transfer among hub ports, traffic concentration, traffic service schedules, relationships between port and hinterland connections, and the influence of commodity diversity on maritime traffic distribution [13,14,15,16]. Qualitative and quantitative methods to evaluate these networks have been developed, including modelling [3,17,18,19,20,21], statistical measures [22,23,24,25], and empirical analysis [26,27].
Models of maritime network spatial structure reveal that import, export, and transshipment flows are often based on an origin-destination interflow matrix [17,18] or a weighted adjacency matrix [19], for instance, a strategic network choice model [3]. Heuristic models based on combinatorial optimization and priority rules [20] have also been proposed, such as minimum transportation time and maximum transportation capacity models [21]. In addition, indices of maritime degree, centrality, vulnerability, and betweenness and closeness centrality [22,23,24] are also used to measure traffic flow efficiency, such as estimates of nodal accessibility and the number of shortest paths from one node to others [25]. Maritime network spatial structure modelling and statistical measures are often based on statistical data from Containerization International, Lloyd’s Marine Intelligence Unit, Lloyd’s Shipping Register, and specialized press and company websites. Because much of the collected data are largely anecdotal, extensive empirical analyses are undertaken in most current studies, but rigorous methodology is lacking [26,27]. Furthermore, the vast majority of these contributions have focused on large international ports; the regional dimension of inter-port linkages and the geographic locations of regional port groups have rarely been considered, which limits the application scope of the corresponding research results. For example, the regional dimension of inter-port linkages often need to assess different spatial structures between different regional subnetworks, including hub-and-spoke, nonhierarchical structure, hierarchical structure, and so on. These differences may be related to nearby ports’ transportation strategies, such as strategic alliance and bundling management [28].
Dynamic evolution patterns in maritime networks can be systematized and classified from three perspectives. Diffusion processes can be modelled to simulate traditional spatial port expansion [29]. Port system evolutionary models can be based on hinterland accessibility and port regionalization [30,31,32,33], and maritime flow evolution models on graph theory and complex networks, for example, using random walk procedures and analysis of topological structural evolution [34,35,36]. The common problem, however, in these existing systems is that researchers rarely have access to full datasets on spatiotemporal maritime flows to verify the models against observed phenomena or to check for the effects of seasonal changes or of well-known events in world news and history.
For these reasons, maritime network analysis is a very active research field, and many challenges remain to be tackled, including validity, practicality, and applicability of approaches, definitions, and methodologies. In particular, the lack of detailed information on the regional dimension of inter-port relations prevents the application of graph and complex network theories to maritime networks, including increasing maritime trade and answering strategic policy questions. Recently, after the successful implementation of Automatic Information Systems (AIS), AIS data become an important data source of much finer density than heretofore for maritime network analysis. The research presented in this paper fully considers geographical location, development scale and nature, and the range of economic hinterlands to reveal the regional dimension of inter-port linkage structures of Chinese maritime ports using AIS data for all types of ships. The main research contributions are as follows:
- (1)
- AIS—The network structure automatic processing algorithm developed in this research that uses a novel method to construct a maritime network, taking full consideration of the complexity and the typical peculiarities in the regional dimension of inter-port linkages. It is meaningful to construct complex spatial networks consisting of multiple layers, including the regional dimensions of inter-port linkages, detailed information on all types of shipping, and differences in shipping between nations.
- (2)
- Considering the linkage intensity between subnetworks, this paper reports on a comparative analysis of the competitiveness of the Yangtze River Delta, the Southeast Coast, the Bohai Bay, the Southwest Coast, and the Pearl River Delta. This research revealed the current pattern of competition and the advantages and disadvantages of each subnetwork and provided suggestions for improving competitiveness.
- (3)
- Examination of port linkage tightness inside each subnetwork showed that each subnetwork has a different type of internal cohesion, which some ports experience as intense competition and an unclear division of port operations. Hence, their development strategy must be adjusted.
- (4)
- The linkages of tributary and central ports were analyzed through a spatial isolation index, which provides insight into the complementarity of backbone and skeleton networks and contributes to reasonable positioning of non-dominant and dominant ports.
- (5)
- Port interaction preferences in the study area were revealed using the port concentration index, which is very useful in providing an effective decision-making basis for regional coordination and differential development of internal ports.
There are some limitations in our works. On one hand, we did not consider ship size and type. Therefore, it only reflected the spatial characteristics of maritime network in transportation, but it could not reflect the trade information. On the other hand, port competitiveness are affected by some factors, such as the unitization of port facilities, network linkage structures, cargo handling charges, market share of logistics integrators, the development of inland transport network, and so on [37]. We only focus on maritime network structure dynamics, which reflect the transportation network organization, to give some suggestions about the port competitiveness. Finally, affecting factors for dynamic characteristics of Chinese maritime network are very complex, including regional economies, port’s service characteristic, and official management strategy and so on. We just focus on revealing dynamics characteristic of maritime network trough AIS data, which is meaningful for ports’ strategic forecasting and regional long-term economic development planning. The following sections of this paper describe the methodology used for a multi-layer analysis of Chinese maritime network structure (Section 2), the data used in this research and the study area (Section 3), and results and applications in supporting strategic decision-making for future development (Section 4). Finally, Section 5 concludes the paper with a brief summary of the results and recommendations for further research.
2. Methods
2.1. Overview of Methodology
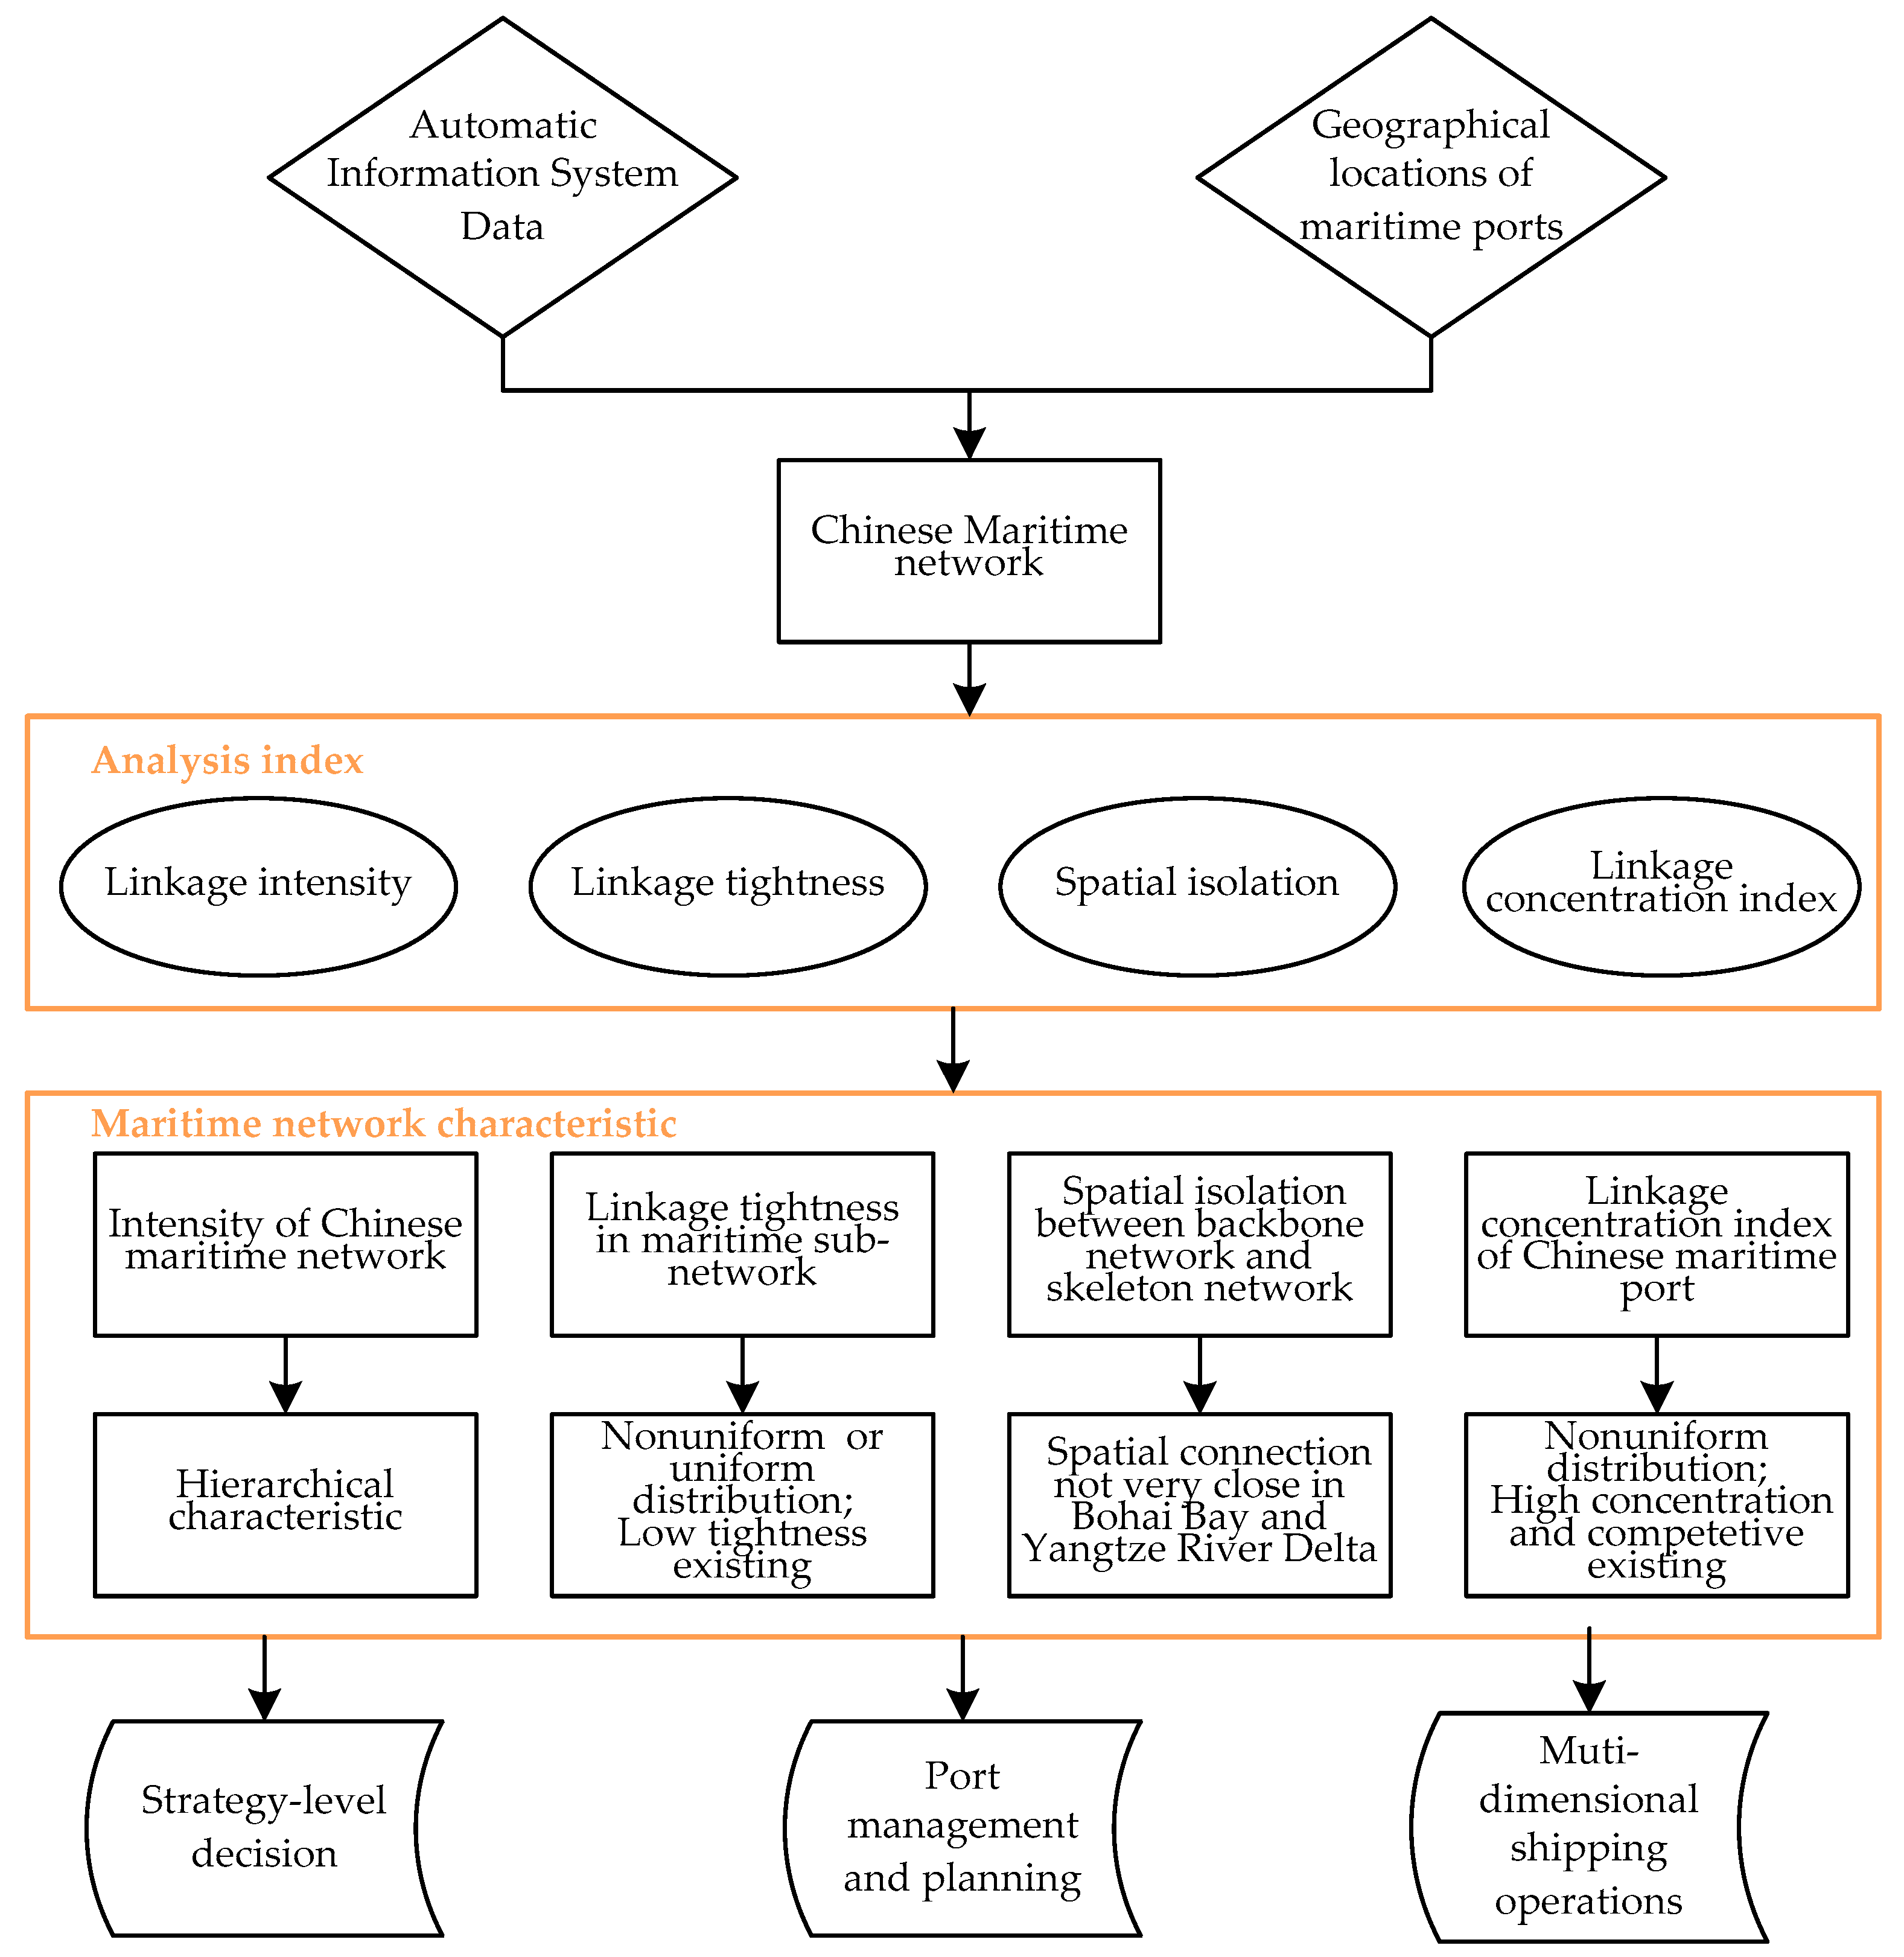
Figure 1 shows an overview of the methodology for the proposed research. Through ships’ trajectories and the locations of Chinese maritime ports, the maritime linkage network was constructed, including the overall network and subnetworks. The ports where a particular ship docked in order can be extracted from its trajectories, an operation that is necessary to construct the maritime linkage network. Furthermore, linkage intensity between subnetworks, internal linkage tightness in subnetworks, spatial isolation between backbone and skeleton networks, and linkage concentration between each port and others were analyzed based on the linkage intensity, linkage tightness, linkage concentration index, and other factors.
2.2. AIS->Automatic Network Structure Processing Algorithm
Step 1: Inaccurate data (accounting for about 2.63%), such as abnormal latitude and longitude and negative speed are encountered and are related to the complex environment on the sea. Cleaning of the original AIS data is necessary in the first step to eliminate anomalous data.
Step 2: AIS data are recorded chronologically and must be converted to ships’ trajectories according to the unique ID of a vessel (MMSI) and the ID registered with the International Maritime Organization (IMO), which are necessary to analyze the docking ports of ships in order.
Step 3: Based on the electronic chart display and information system, the geographical location of each Chinese coastal port is determined, including the vessel traffic service reporting lines, channels, berths, anchorages, and other facilities. In this way, the locations of each node (port) in the maritime network can be determined.
Step 4: If the docking time of one ship at a particular port exceeds the pre-set time thresholds, it will be judged to have stopped at the port to do business. The order of docking ports for a particular ship is determined from its trajectories, which make up a time series and that can be used to reveal linkages between one port and another. The maritime network can be established using the nodes and linkages derived from the traffic flow.
2.3. Network Structure Analysis Index
2.3.1. Linkage Intensity
Linkage intensity reflects how important each port is in the maritime network. The higher the linkage intensity, the larger the corresponding market share will be, and vice versa. The total number of ships traveling between port A and other ports is used to measure port A’s importance in the maritime network, which is defined as:
where is the total number of ships traveling between port A and other ports and N is the number of ports that have shipping links with port A. , are the total number of ships traveling from port A to port i and from port i to port A, respectively, and represents the linkage intensity between port A and port i.
2.3.2. Linkage Tightness
The higher the internal linkage tightness, the stronger will be the cohesion and competitiveness of a subnetwork. When considering a ship sailing to a port directly or indirectly, linkage tightness is defined as follows [38]:
where is the number of ships sailing from port A to port C directly and is the number of ships that begin at port A, stop in other ports, and then finish the trip at port C. is the number of ship trajectory segments from port A to port C. The total number of ships traveling between port C and other ports is represented by , and is the total number of ships traveling between port A and other ports. is the number of ships sailing from port C to port A directly, and is the number of ships that begin at port C, stop in other ports, and then finish the trip at port A. is the number of ship trajectory segments from port C to port A.
2.3.3. Spatial Isolation
Spatial isolation is used to analyze the spatial structure characteristics between backbone and skeleton networks. The term backbone network refers to a high-intensity linkage between subnetworks, and the term skeleton network refers to the linkage tightness inside of the subnetwork. These can be defined as the top ten percent of linkage intensity and the top ten percent of linkage tightness, respectively [38]. In this study, a backbone network is defined as one with linkage intensity greater than 300, and a skeleton network is defined as one with linkage tightness greater than 0.21:
2.3.4. Linkage Concentration Index
The Herfindahl–Hirschman index can be used to describe the degree of concentration in the transportation industry and of social interactions in cyberspace [39]. The Herfindahl–Hirschman index was introduced here to analyze the degree of business concentration in each port in a maritime network. The linkage concentration index (LCI) of port A can be calculated as:
where is the number of ships traveling between port A and port C and represents the number of ships traveling between port A and other ports. According to the standards set by the United States (U.S.) Department of Justice, is taken to mean not concentrated, to represent medium concentration, and to represent high concentration. The larger the LCI, the greater is the business preference for a particular port. A high LCI shows that a port has a stronger business interaction preference.
3. Study Data and Area
3.1. Port Group Division Data
A port group, consisting of two or more ports having the same range of terrestrial transportation networks and a common economic hinterland, is an important concept for future port planning and management. Ports inside one port group have adjacent geographic locations, as well as similar geographical advantages and similar market areas both in China and worldwide. In terms of development, these ports are mutually dependent and constrained. According to official port groupings, the Chinese maritime network can be divided into five subnetworks: the Yangtze River Delta, the Southeast Coast, Bohai Bay, the Southwest Coast, and the Pearl River Delta, as listed in Table 1.
3.2. AIS Data
This study used an AIS dataset of 124,947 vessels in Chinese coastal areas from 1 May 2014 to 31 May 2014. Table 2 shows the basic items in the AIS dataset. The limitation of our data is that we cannot analyze the seasonal effect because of shortage in sample data of other months, such as December or any other month.
3.3. Study Area
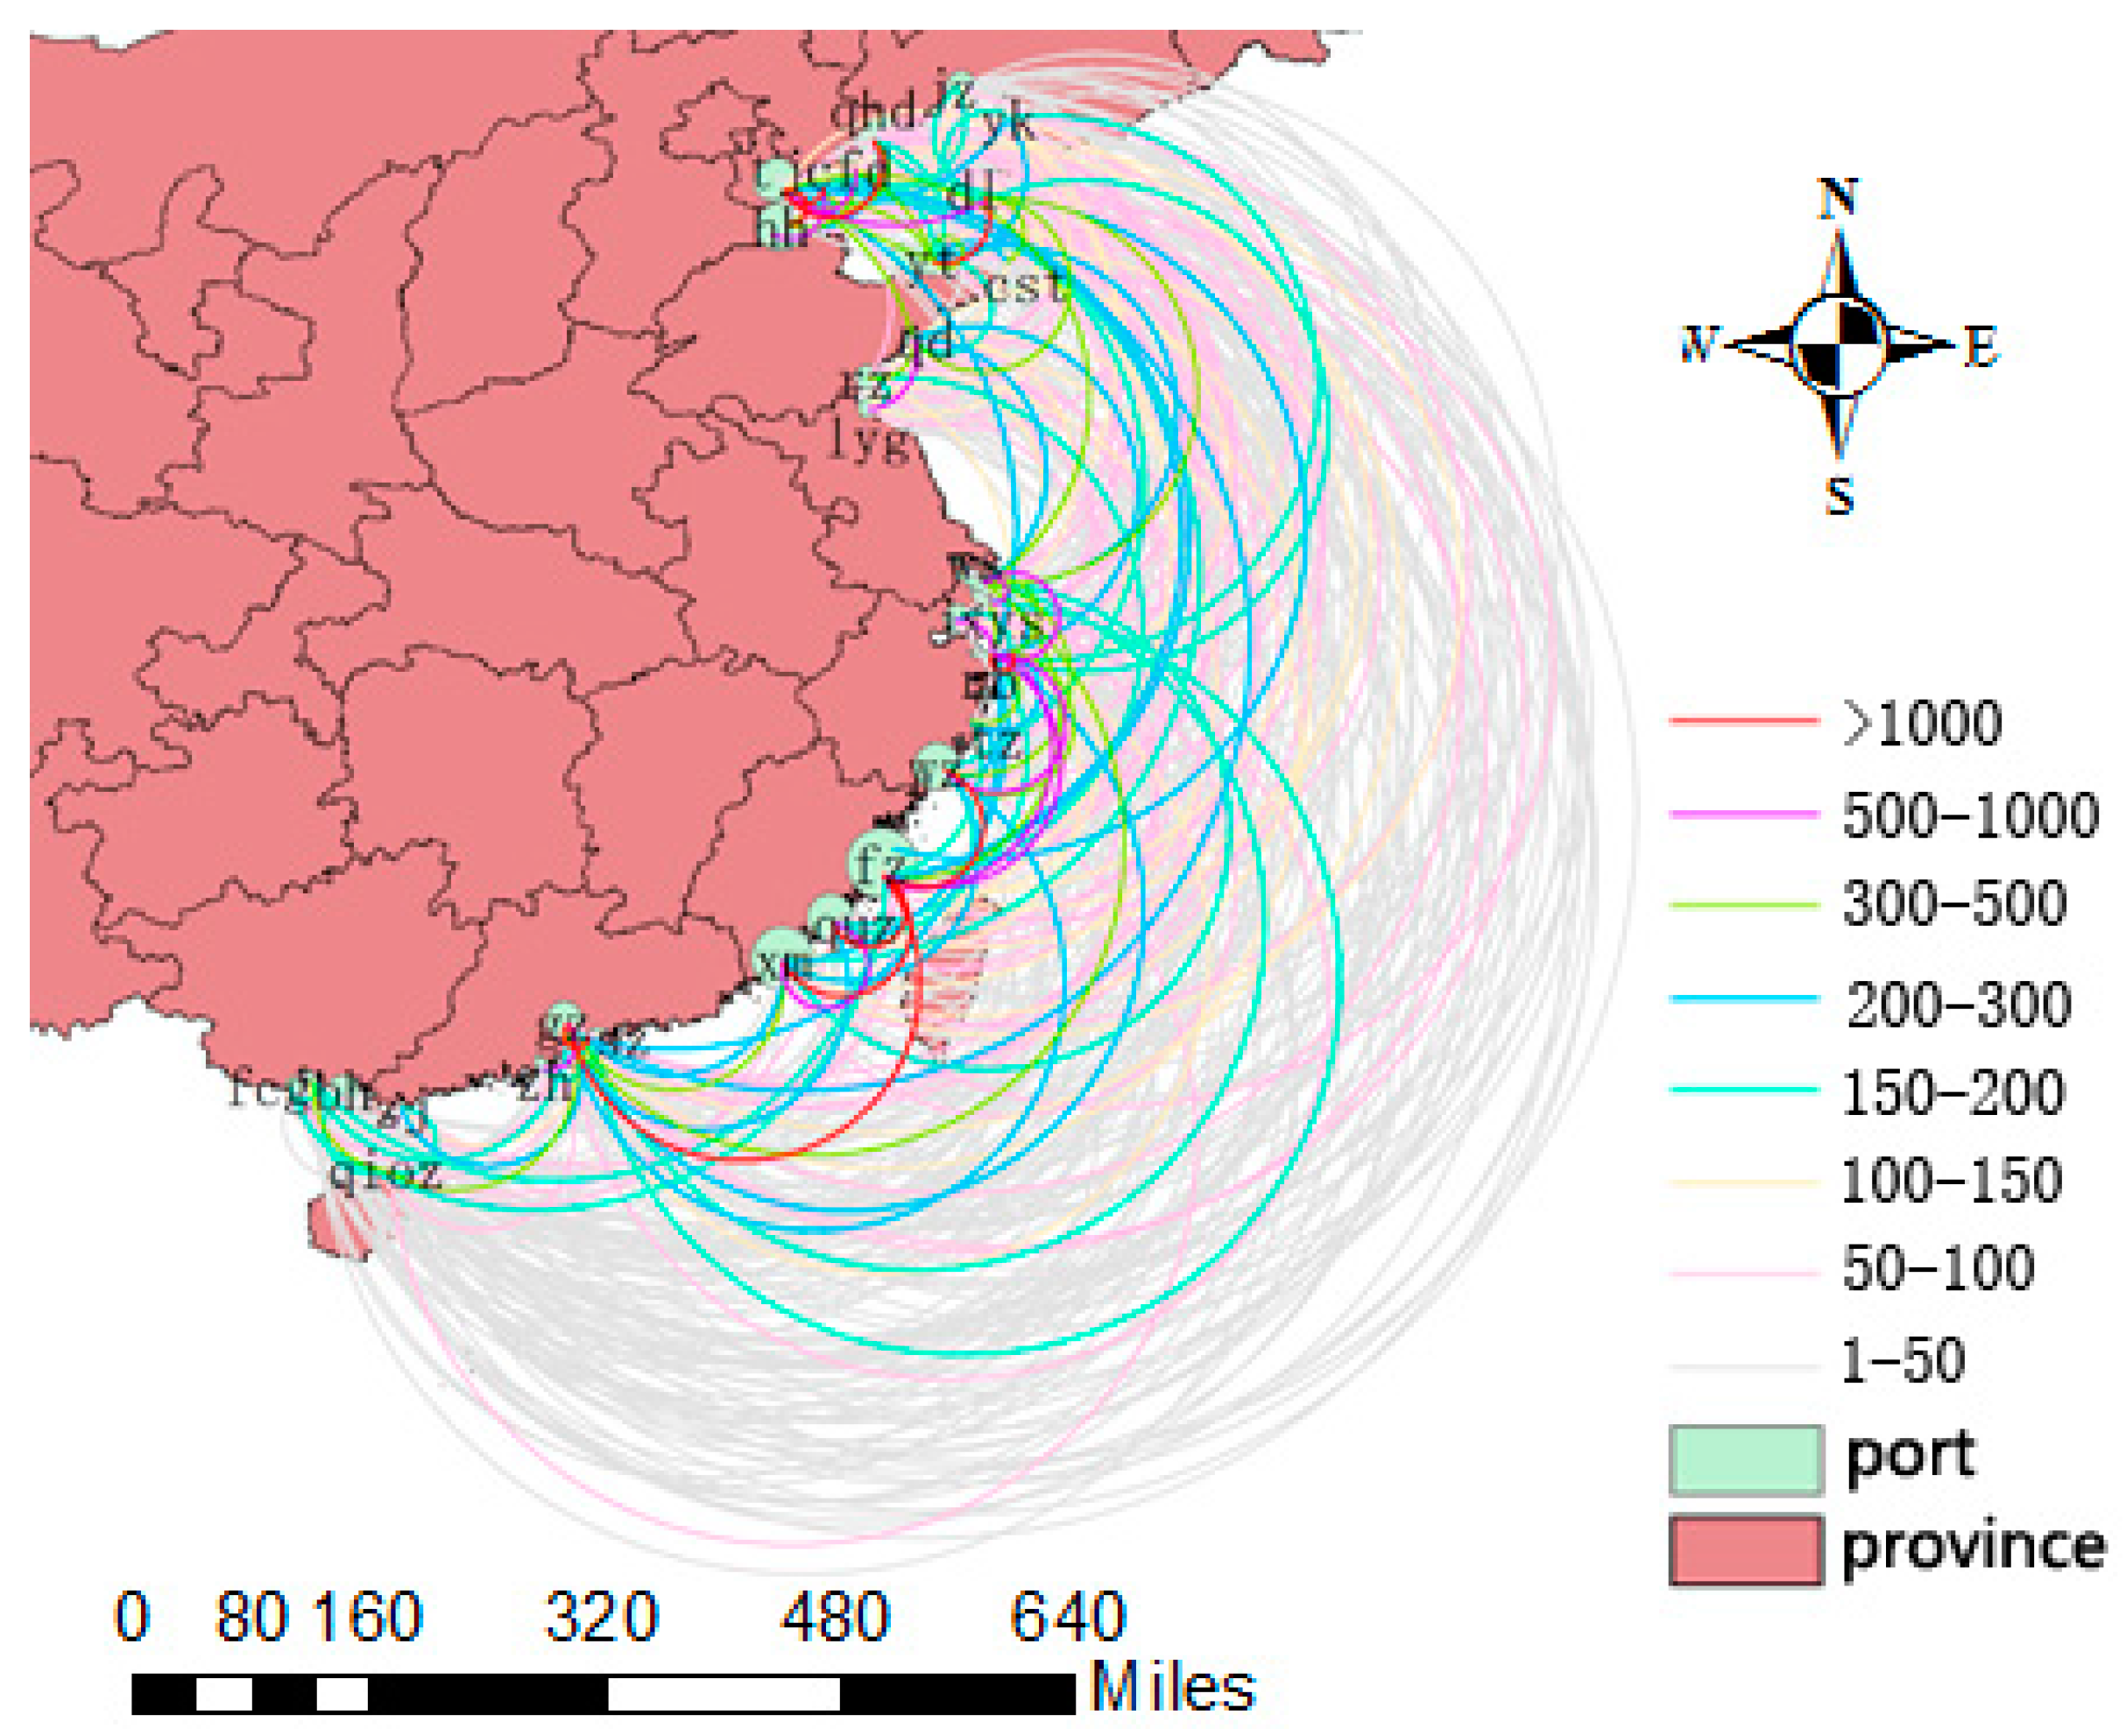
All of the Chinese coastal ports were selected as part of the study area in this research, including 14 ports in Bohai Bay, eight ports in the Yangtze River Delta, three ports on the Southeast Coast, three ports in the Pearl River Delta, and five ports on the Southwest Coast. Figure 2 shows a chart of Chinese coastal ports, which presents the geographical distribution of subnetworks and ports inside subnetworks.
4. Results
4.1. Intensity of Chinese Maritime Network Linkages
A maritime network consists of nodes (maritime ports) and linkages (sea lanes). A port with higher linkage intensity with other ports is more important in the whole network because of its diversified linkages and greater weight. If the operation system of this port broke down, it will affect more other ports as well as the whole network. The linkage intensity of Chinese coastal ports has been analyzed using both quantitative and qualitative methods to illustrate the importance of each port, as shown in Figure 3. Most ports have a linkage intensity of grade one (1–50 ships) or two (50–100 ships) with other ports. Grades one to eight represent numbers of ships between 1–50, 50–100, 100–150, 150–200, 200–300, 300–500, 500–1000, and more than 1000, respectively. The proportions of grades one to eight respectively were 59.23%, 15.42%, 5.68%, 5.68%, 5.07%, 4.46%, 2.43%, and 2.02%. Different subnetworks had different distribution characteristics. For example, on the Southwest Coast, only fcg had a linkage intensity higher than grade 6 with sz in the Pearl River Delta. However, ys, nb, zs in Yangtze River Delta had linkage intensities greater than 6 between each other, wz and jx in Pearl River Delta , tj and qd in the Bohai Bay, xm, fz in Southeast Coast, and sz , gz in the Pearl River Delta.
The linkage intensity of each subnetwork reflects its standing in the Chinese maritime network. The higher the linkage intensity, the stronger will be the competitiveness of the subnetwork, and the more important it will be. The Yangtze River Delta (14,776) is the most important area in the Chinese coastal maritime network, followed by the southeast coast (12,481), Bohai Bay (11,257), and the Pearl River Delta (6974), with the southwest coast (3176) placing last. The Pearl River Delta does not have high linkage intensity because its hinterland gives priority to Guangdong Province, where industrial activity is mainly light industry. Guangdong has also developed rail and air transportation, and therefore it has less demand for maritime traffic. The southwest coastal region lagged mainly because of its lack of industrial development and its low level of industrial structure. Even though the Southwest Coast has the advantages of adjacent seas, adjacent rivers, and adjacent other countries, agriculture still accounts for a large proportion of economic activity. Weak infrastructure and services along the coast restricts its maritime trade with other subnetworks. The Southwest Coast should take some measures to realize “Sea-River linkage” coordinated development, such as making full use of its locational advantages and increasing the potential power of development.
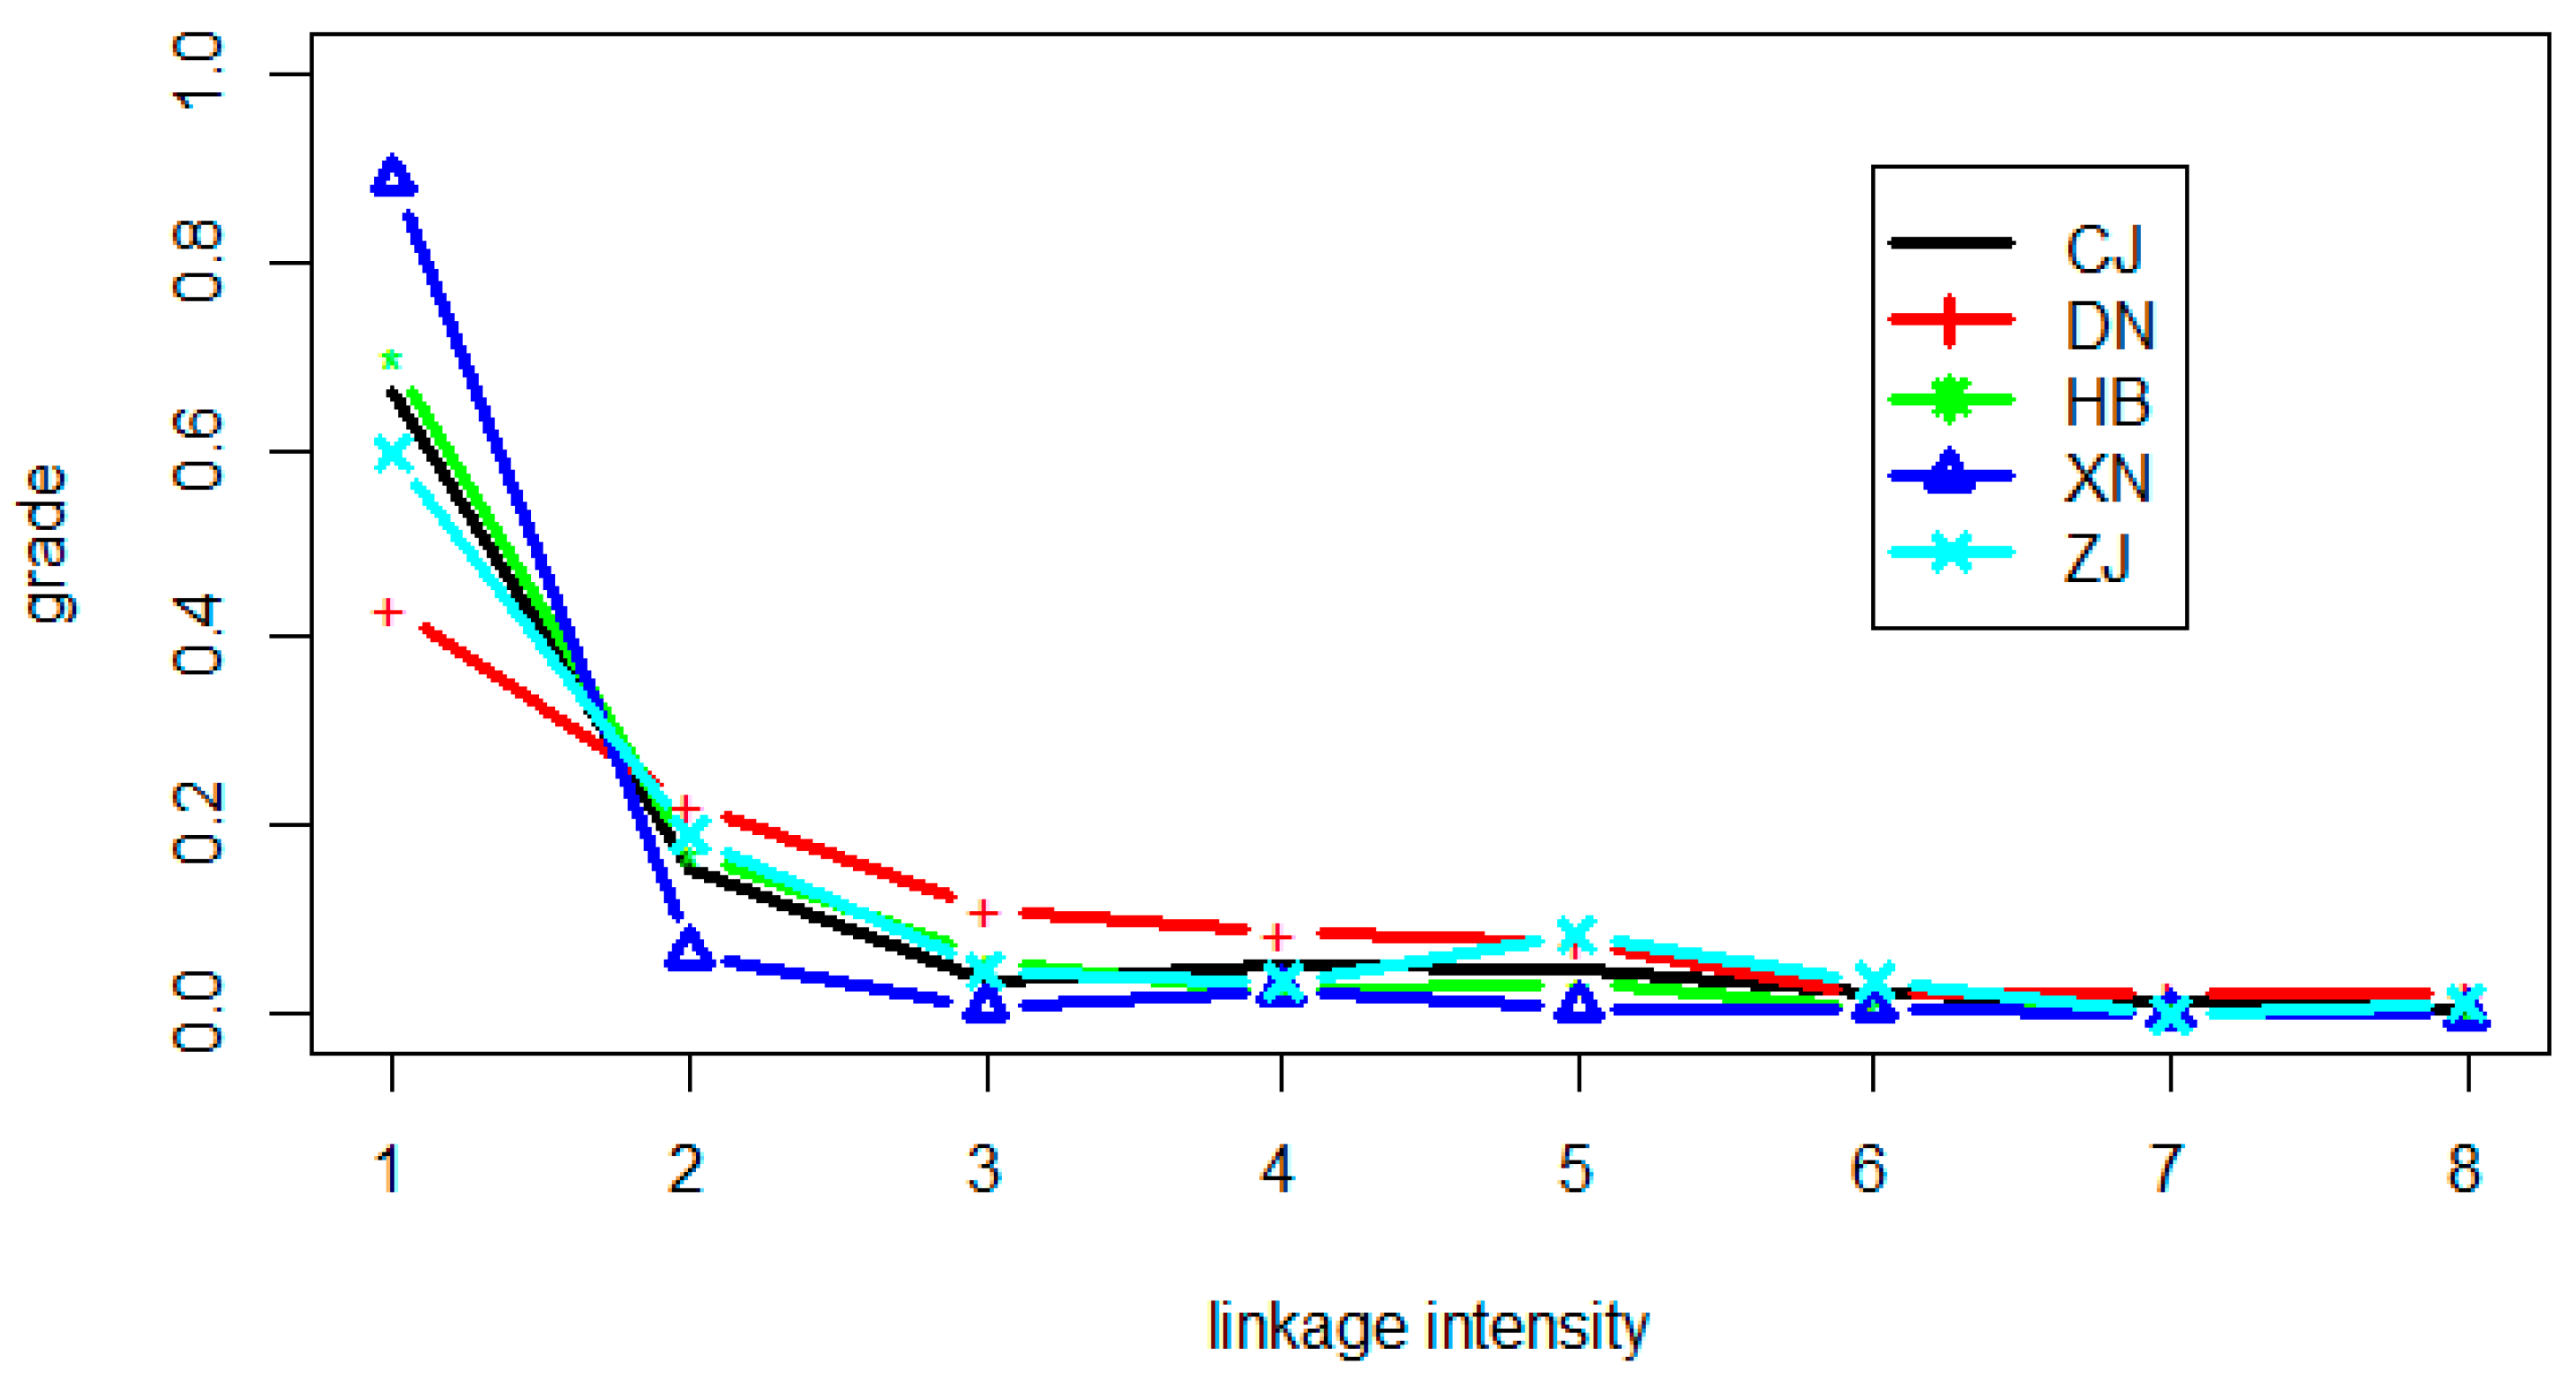
Figure 4 illustrates that the higher the linkage intensity grade, the lower is the proportion of ports having that grade. The proportion descends fastest from grade one to grade two, then more slowly from grade two to grade three, followed by flattening out. This means that the linkage intensity between ports is mostly grade one (1–50 ships), followed by grade two (50–100 ships); ports with a grade equal to or greater than three (more than 100 ships) are few. Table 3 shows the frequencies of different linkage-intensity grades in each subnetwork. The higher the linkage intensity, the lower is the frequency. For example, the frequencies of linkage intensities greater than two are the sum of frequencies from grade 3 to 8. The Yangtze River Delta, the southeast coast, the Bohai Bay, the southwest coast, and the Pearl River Delta respectively 34 (7 + 10 + 9 + 4 + 3 + 1), 31 (10 + 8 + 7 + 2 + 2 + 2), 31 (14 + 6 + 8 + 2 + 1 + 0), 6 (1 + 3 + 1 + 1 + 0 + 0), and 18 (4 + 3 + 7 + 3 + 0 + 1). Similarly, the frequencies of grades greater than five in order were 8, 6, 3, 1, and 4. It is apparent that Bohai Bay needs to strengthen its standing in the backbone network of linkage intensities greater than 300 because it has 31 ports of grade higher than 3, but only three of grade higher than 6.
Figure 5 shows that each subnetwork has different linkage intensity characteristics from the others. The Yangtze River Delta has close business relationships mainly with the Southeast Coast (43%) and Bohai Bay (42%), but has relatively weak business relationships with the Pearl River Delta (12.5%) and the Southwest Coast (2.5%). Both the Southeast Coast and Bohai Bay have their main market in the Yangtze River Delta, which accounts for 51.1% and 54.8% of their respective total business. Furthermore, the linkages between Southeast Coast and Yangtze River Delta, Bohai Bay, Pearl River Delta, and Southwest Coast are 6380, 3160, 2132, 809, respectively. The linkages between Bohai Bay and Yangtze River Delta, Southeast Coast, Pearl River Delta, and Southwest Coast are 6170, 3160, 1453, 474, respectively. The correlation of these two series is 99.44%. The Southeast Coast is in intense competition with Bohai Bay because of their similar linkage intensity distributions. In addition, there was no obvious difference in linkage intensity between the Pearl River Delta and other subnetworks, including 1861 ships (26.7%) to the Yangtze River Delta, 2132 ships (30.6%) to the Southeast Coast, 1453 ships (20.8%) to Bohai Bay, and 1528 ships (21.9%) to the Southwest Coast. The Pearl River Delta should focus first on defining a key development direction. Finally, the Southwest Coast has the weakest linkage intensity and needs to strengthen its linkages with the Yangtze River Delta (365 ships, 11.5%) and Bohai Bay (474 ships, 14.9%). The Southwest Coast should improve its maritime infrastructure, further enhance industrialization, and translate its locational advantage into traffic and economic advantages to boost its competitiveness in the maritime network.
The conclusions can be summarized as follows:
- (1)
- The Yangtze River Delta, the Southeast Coast, and the Bohai Bay account for most of the business in the maritime network. Among them, the Yangtze River Delta presents a dominant status in servicing maritime transportation, which is maybe driven by the bigger economies in these areas than other areas. The Southeast Coast and Bohai Bay have similar linkage intensities with other subnetworks and engage in fierce competition. This result indicates that these areas perform a similar transportation performance while serving the economies in other areas.
- (2)
- The Pearl River Delta and the Southwest Coast have lower competitiveness than the other subnetworks and need to foster growth and prosperity by advancing economic cooperation, expanding trade and investment, and opening markets throughout the region. These results indicate the potential increasing space in connecting with other areas. The potential increasing spaces need some effective subnetwork development strategies while competing with other subnetwork area, such as differential transportation markets including ship types, goods, service, and others.
4.2. Linkage Tightness in Maritime Subnetworks
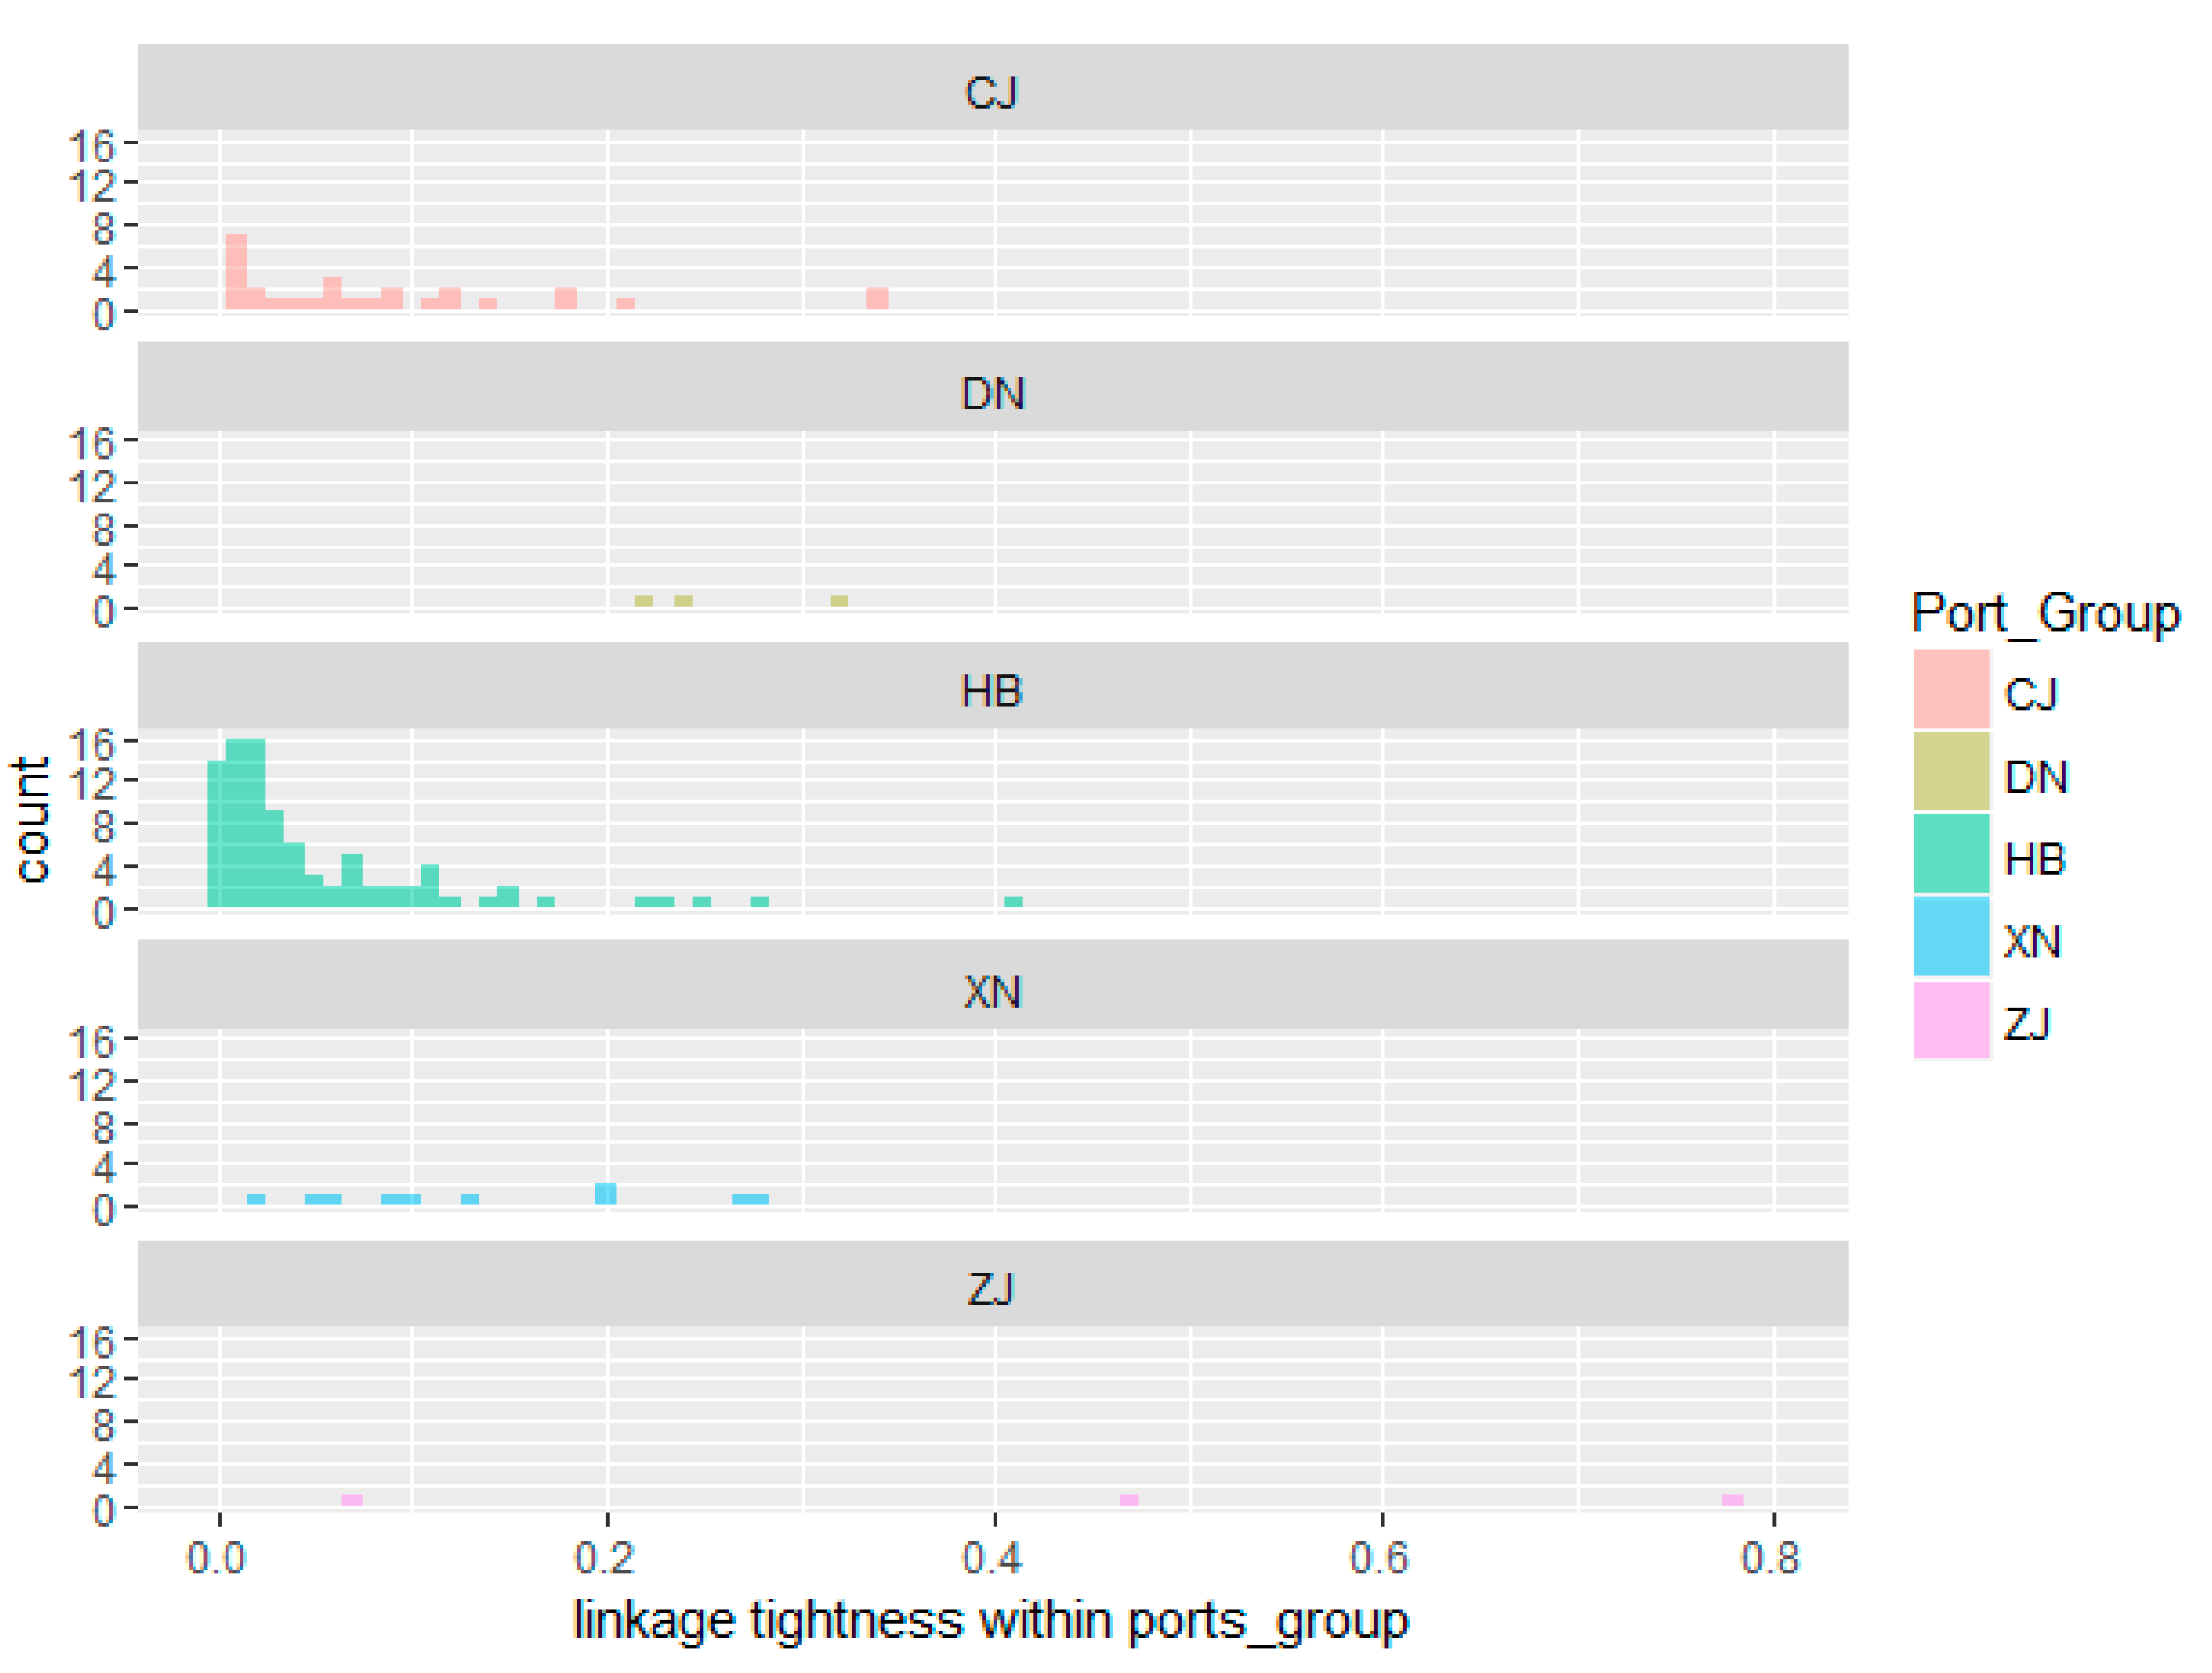
High linkage tightness represents strong cohesion and high competitiveness in a subnetwork. Figure 6 shows that the linkage tightness distribution of each subnetwork, as determined by ship trajectories, has many different characteristics. On the one hand, the linkage tightnesses of ports in the Yangtze River Delta, the Southeast Coast, Bohai Bay, and the Southwest Coast are mainly distributed between 0 and 0.2, 0.2 and 0.4, 0 and 0.1, and 0 and 0.3, respectively. The tightness distribution of ports in the Pearl River delta is the most scattered. Table 4 reveals the corresponding statistical analysis results for each subnetwork. The mean and median provide information that helps in understanding the central tendency of each linkage tightness data set. The variance or standard deviation (SD) measures the extent to which a set of linkage tightness values is spread out from its mean. The coefficient of variation () describes the dispersion of linkage tightness in a way that does not depend on the measurement units. The Pearl River Delta () has the highest mean linkage tightness, followed by the Southeast Coast () and the Southwest Coast (), and in last place by the Yangtze River Delta () and Bohai Bay (). The Southeast Coast has the minimum SD, with linkage tightness values mostly close to 0.258. This analysis also revealed that the linkage tightnesses in the Yangtze River Delta, Bohai Bay, and the southwest coast are mainly clustered around 0.088, 0.052, and 0.141. Their SD values are all relatively small, , , and , respectively. The Pearl River Delta has the greatest spread between internal linkage tightness values and their mean due to its largest standard deviation, . The Southeast Coast, the Southwest Coast, and the Yangtze River Delta have , , and respectively. These show that their mean values can represent the average internal linkage tightness relatively well due to their relatively small CV. The Yangtze River Delta () and Bohai Bay () have higher CVs, and the dispersion in their linkage tightnesses is greater. Therefore, their mean values can reflect their internal linkage tightness only to a certain extent.
The aforementioned analysis leads to the following conclusions:
- (1)
- Bohai Bay and the Yangtze River Delta have low mean linkage tightness and relatively small SD. This means that internal adjustment and cooperation is useful to enhance competitiveness for these two subnetworks. The direction of future planning should focus on internal coordination rather than developing new ports. Therefore, cooperation and coordination for internal ports in this subnetwork is necessary to use assets more efficiently and prevent wasting scarce resources on inter-port competition. The cooperation and coordination takes various forms, such as strategic alliance, bundling management, and merging their data system.
- (2)
- The Pearl River Delta has the highest mean value, but the largest SD, mainly due to intense competition between zh and sz with a linkage tightness of only 0.07. The Pearl River Delta’s expansion focus needs to shift to seek differentiated development strategies and achieve a reasonable division, for example, strategic alliance between zh and sz is suggested to promote the competitiveness of subnetwork and increase maritime transportation service.
- (3)
- The Southwest Coast has the third highest mean linkage tightness, but the linkage tightness values of zj with bh, fcg, and qz are very low, 0.02, 0.05, and 0.006, respectively. The competition between zj and the North Gulf International Port Group Co., Ltd. (NGIPG, Guangxi, China) is growing rapidly. NGIPG includes bh, fcg, and qz and takes advantage of long-distance logistics because of bundled management. The Southwest Coast can take some measures to enhance competitiveness, such as coordinated development and scientific division of activities between zj and other ports. The result also indicates effective bundling management is efficient and activates intermodal linkages, which maybe increase hinterland penetration, strengthen service frequency, and make full use of infrastructure.
- (4)
- The Southeast Coast has the second-highest mean linkage tightness and the minimum SD and CV; all of the ports constitute an organic whole and present large internal cohesion. xm focuses mainly on developing container transport processes and has become the logistics center of the west coast of the Taiwan Strait. fz specializes in offshore and bulk cargo transport, and quz focuses on petrochemical transportation. The result illustrates a clear division of operations that can adapt to more flexible maritime transportation, and counterbalance the carrier power of each port inside the subnetwork.
4.3. Spatial Isolation between Linkage Intensity and Linkage Tightness
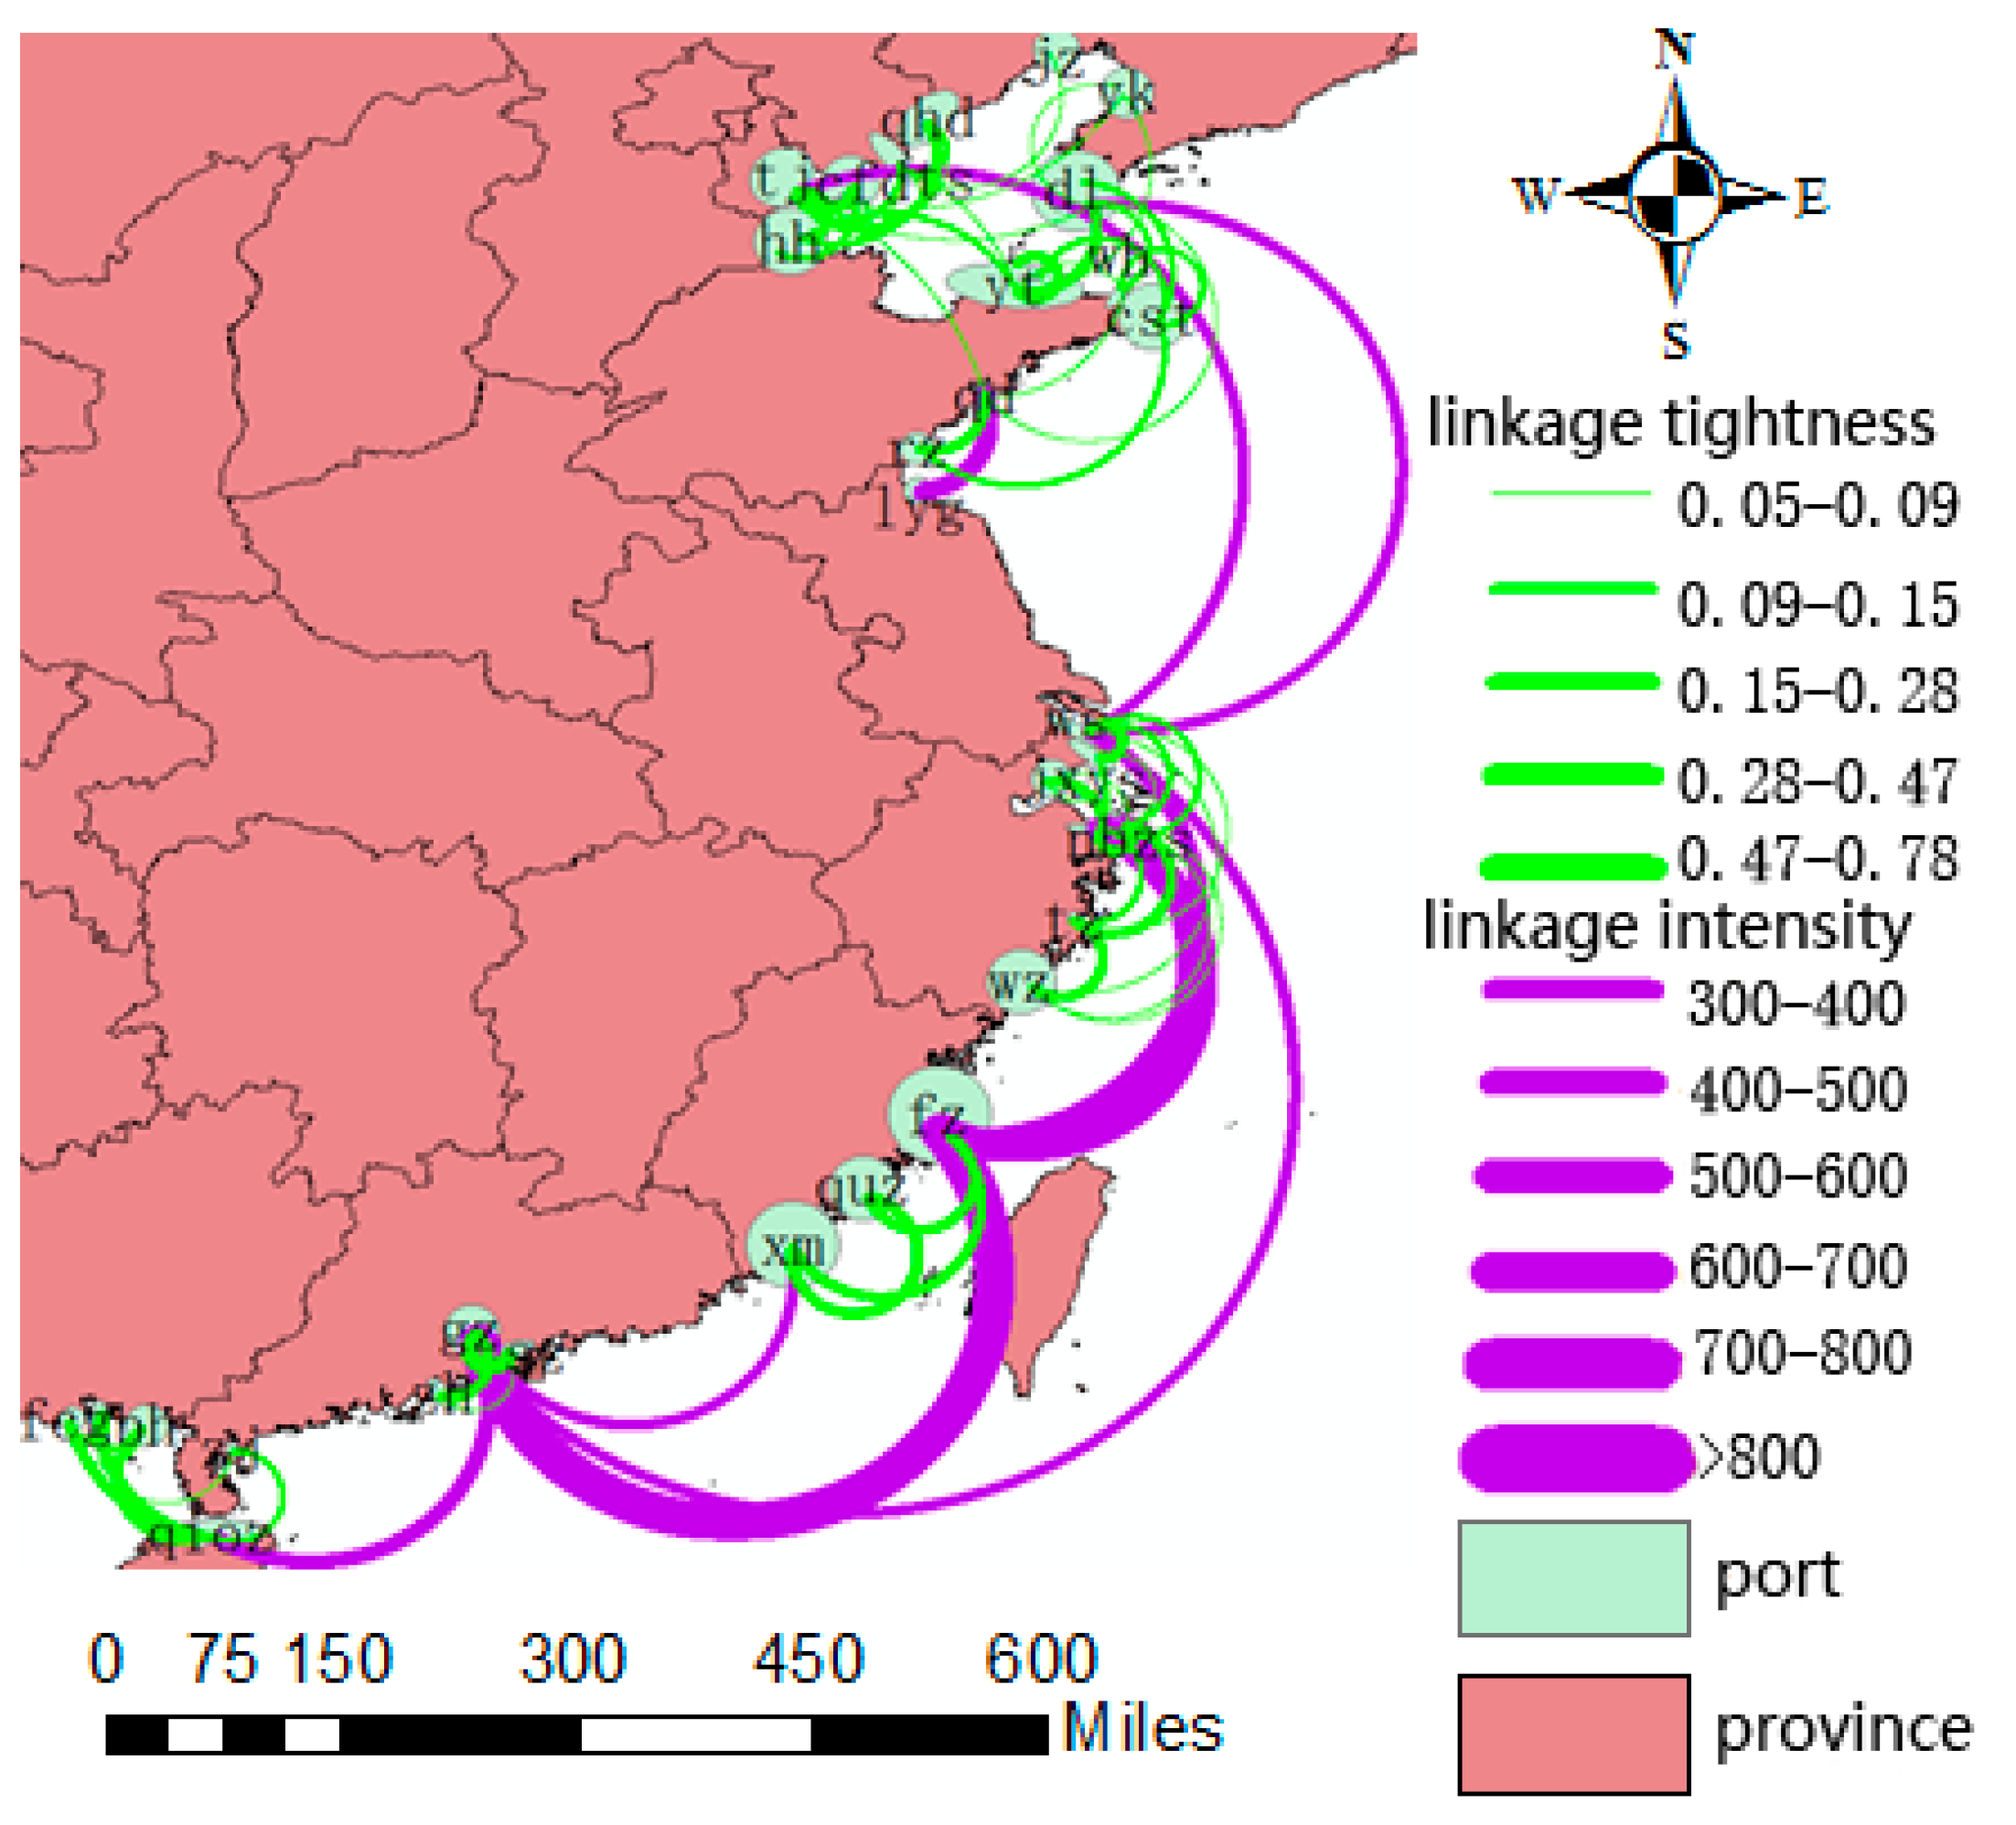
Figure 7 illustrates the spatial isolation characteristics of the Chinese maritime network. High linkage intensity (more than 300 ships) between subnetworks defines the backbone network. The Chinese maritime backbone network is composed of tj and dl in Bohai Bay, ws, zs, and nb in the Yangtze River Delta, fz and xm on the Southeast Coast, gz and sz in the Pearl River Delta, and qioz on the Southwest Coast. The ports in the backbone network have different standings; for example, ws, zs, nb, fz, gz, and sz are stronger than dl, tj, and qioz because of their higher linkage intensity. On the other hand, high linkage tightness (greater than 0.21) between internal and central ports in each subnetwork represents a skeleton network. Bohai Bay and the Yangtze River Delta have a small number of ports with strong linkages to central ports. They can further improve their competitiveness through cooperation among internal ports. 16.7% of linkage tightness values in Bohai Bay are greater than 0.21, including cfd-tj (0.41), hh-tj (0.28), yt-dl (0.25), and qhd-tj (0.22). Most internal ports have weaker tightness with tj and dl. Only ys-zs (0.34) and jx-nb (0.21) have high linkage tightness in the Yangtze River Delta. Other ports have low linkage tightnesses with ws, zs, and nb. All of the ports on the Southeast Coast maintain high linkage tightness with their center ports, including xm and fz. 66.7% of linkage tightness in the Pearl River Delta are greater than 0.21, such as sz-gz (0.78) and zh-gz (0.47). 75% of ports on the Southwest Coast have high linkage tightness with their center port, such as qz-qioz (0.28), bh-qioz (0.27), and zj-qioz (0.27).
In conclusion, skeleton networks in Bohai Bay, the Yangtze River Delta, the Southeast Coast, the Southwest Coast, and the Pearl River Delta can be linked with their backbone networks. There is no spatial separation. However, the linkages between the skeleton networks of Bohai Bay and the Yangtze River Delta and their center ports are not very tight and need to be further strengthened to establish substantial complementarity between backbone and skeleton networks. These results indicate the co-governance in these areas still has a big improvement space in strengthening the inter-relation between internal ports with center ports. For example, the ports in skeleton network can share the places for storing a variety of commodities in case of some ports with no vacant places in backbone network. This would be a meaningful contribution to improving the competitiveness of these regions in the Chinese maritime network.
4.4. Linkage Concentration Index of Chinese Maritime Ports
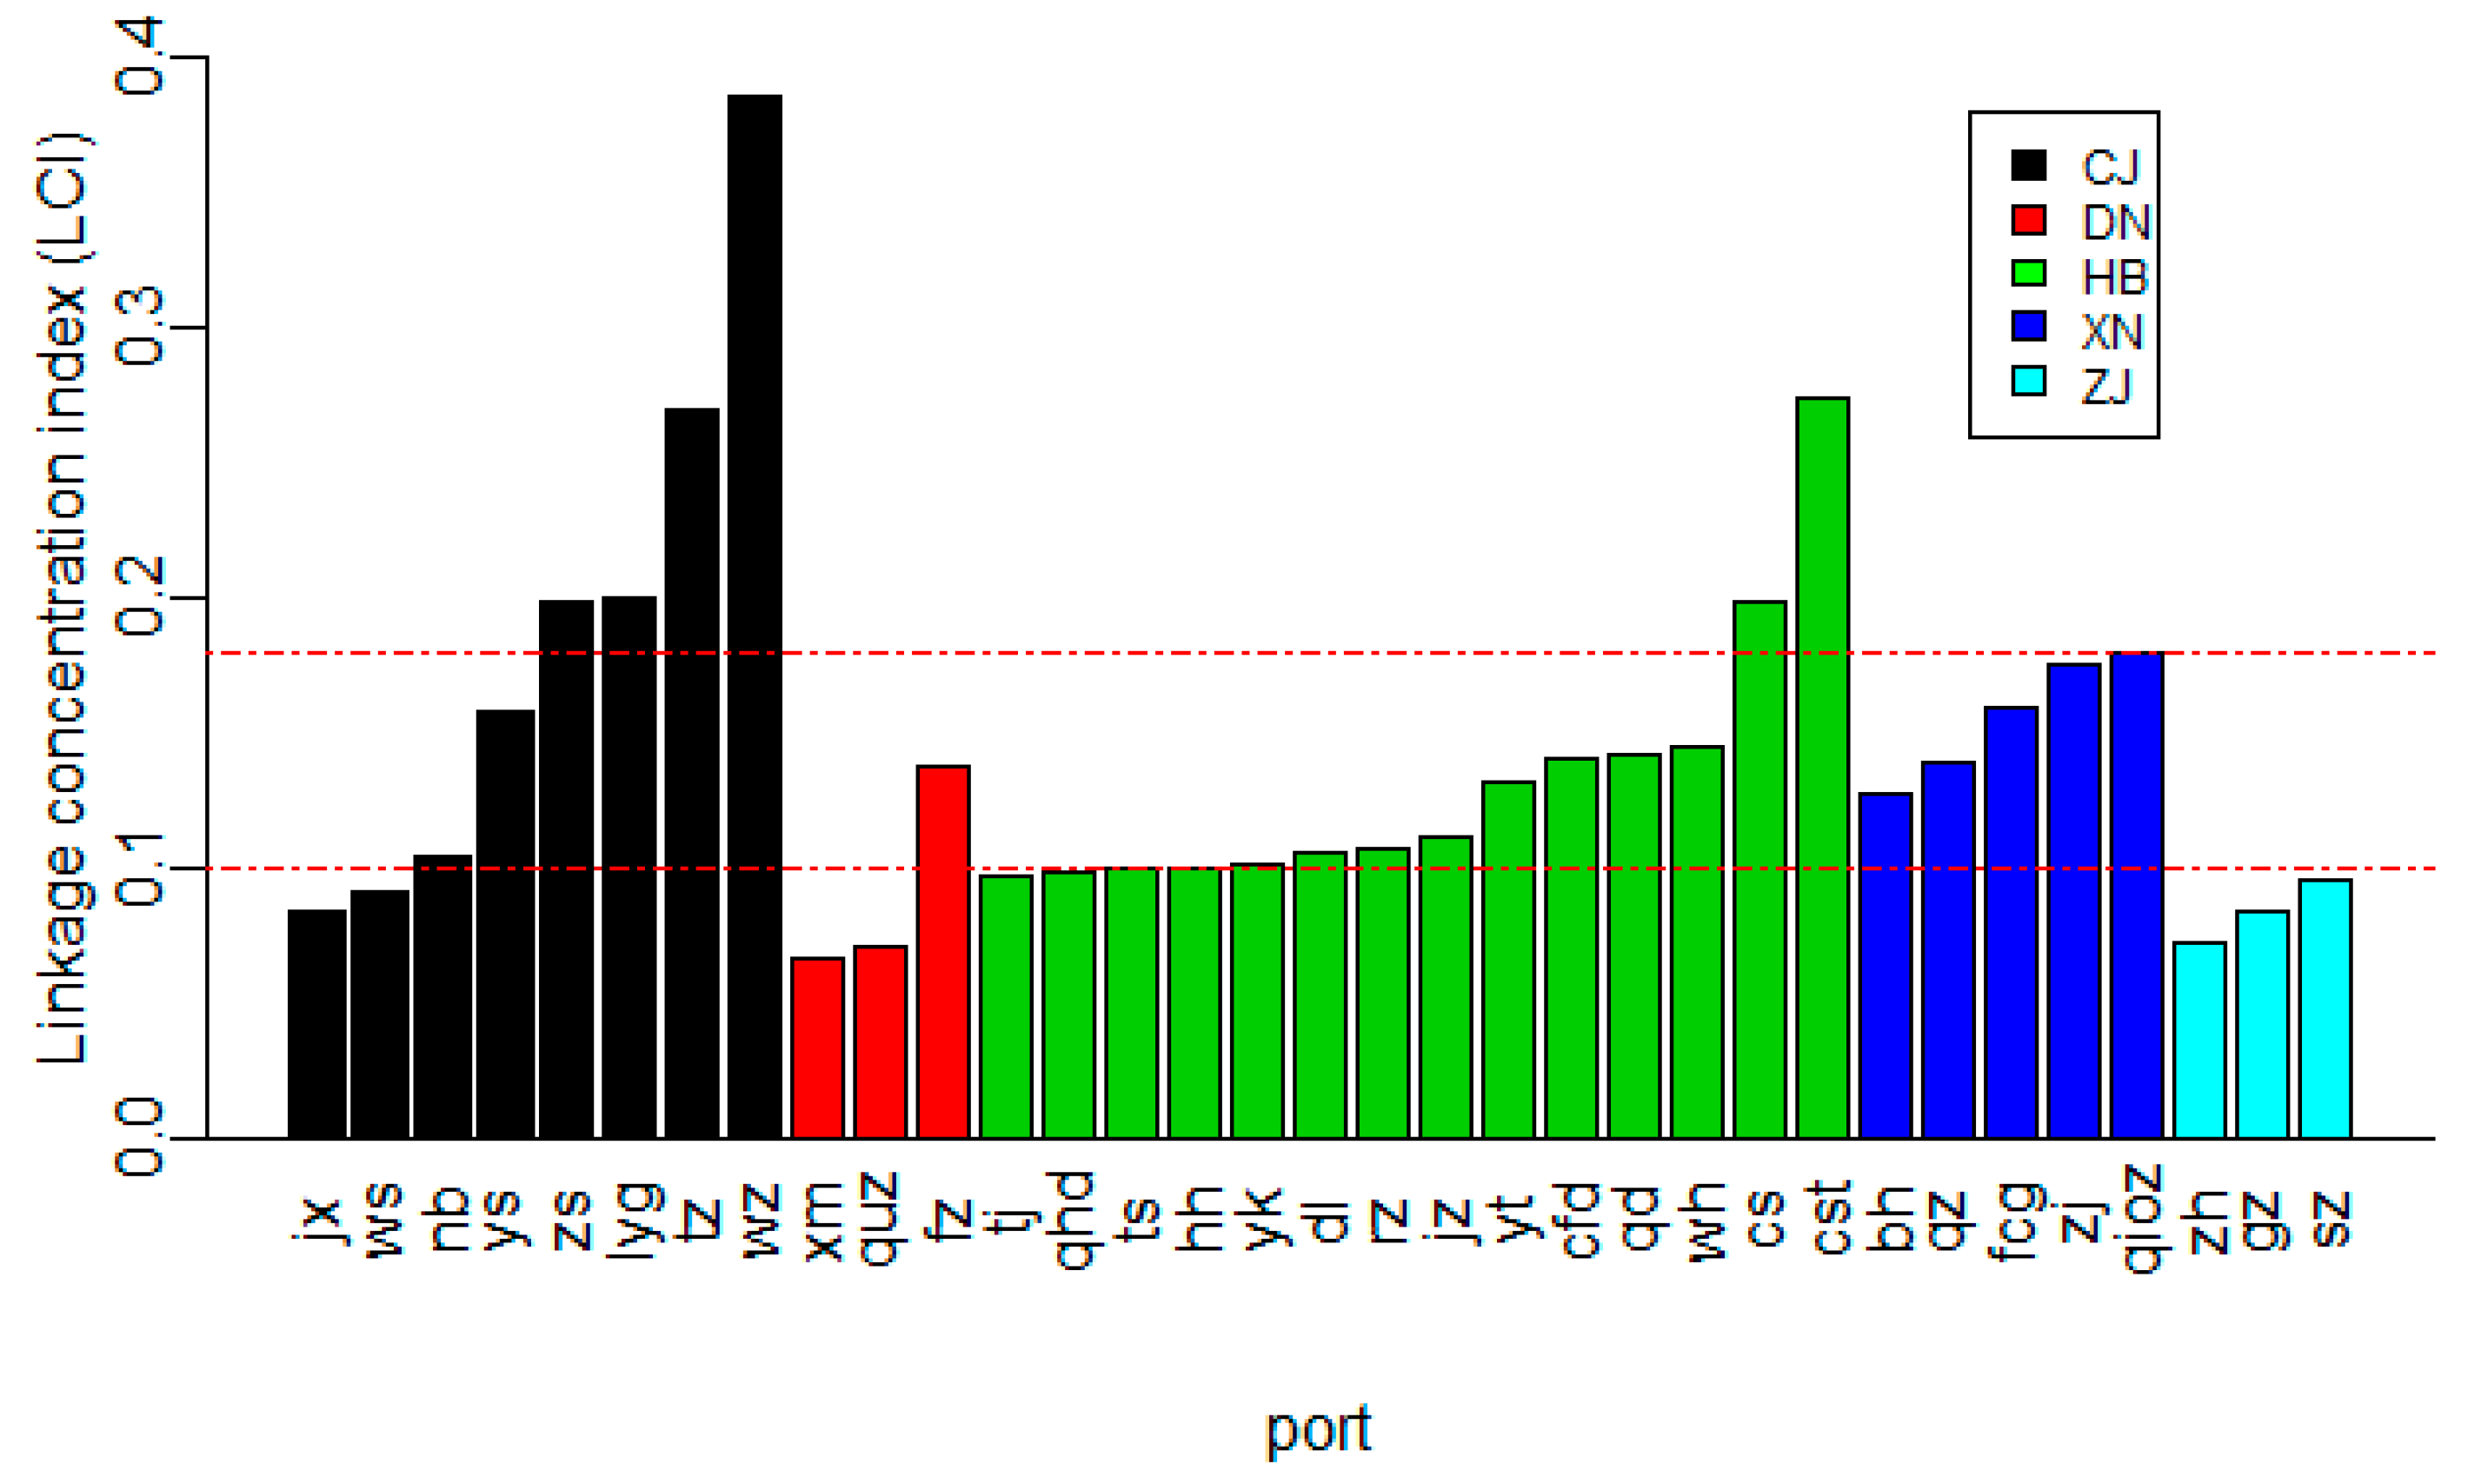
Figure 8 presents the linkage concentration indices of Chinese coastal ports, including 10 non-centralized, 17 moderately centralized, and 6 highly centralized ports. Highly centralized ports include zs, lyg, tz, and wz in the Yangtze River Delta and cs and cst in Bohai Bay. The preferred port of zs, tz, wz, cs, and cst is fz, and lyg tends to interact with qd. fz is the preferred port of multiple ports with high concentration index, focusing on developing offshore transport, container transport for internal feeder industries, and bulk cargo transport.
- (1)
- The Yangtze River Delta and Bohai Bay have hierarchical structures of internal ports’ concentration indices. The non-centralized, moderately centralized, and highly centralized ports in the Yangtze River Delta account for 25%, 25%, and 50% of ports, respectively; in Bohai Bay, they account for 21.4%, 64.3%, and 14.3%, respectively. The Southeast Coast includes xm and qua with low concentration indices and fz with a moderate concentration index. gz, wz, nb, and zs have more frequent business with fz. These results indicate that Yangtze River Delta, Bohai Bay, and Southeast Coast have the hub-and-spoke linkage structure characteristic, which can enhance the allocation of linkages (sea-lanes) and contribute to widespread routes of subnetwork.
- (2)
- All of the ports in the Pearl River Delta have low LCI and similar linkages with other subnetworks. This shows all of ports in the Pearl River Delta maybe develop equally and have no obvious hierarchical characteristic in transportation structure. Some measures are necessary to improve the Pearl River Delta’s competitiveness, including clear divisions in port operations and differentiation in development directions.
- (3)
- All of the ports of the Southwest Coast have moderate LCI and prefer to interact with fz, gz, and sz. The result indicates that all of the ports in the Southwest Coast have a similar concentration characteristic in transportation structure with the ports in other subnetworks. This situation will lead to over-competition between internal ports and weaker competitiveness overall, which can be relieved by clarifying the hierarchical structure of southwest coastal ports.
5. Conclusions
The Chinese maritime subnetworks have complex relationships among their internal ports, full of both competition and cooperation. Subnetwork structures are an important way to describe the competitiveness of subnetworks, such as internal cohesion from reasonable positioning of center ports and non-dominant ports and their clear hierarchies and strong cooperative ability. In this paper, the dynamic characteristics of Chinese maritime network linkages have been studied based on AIS data. The ports were represented as network nodes connected by shipping lines that are defined from existing ship trajectories. Linkage intensity between different subnetworks, linkage tightness in subnetworks, spatial isolation of backbone from skeleton networks, and a linkage concentration index were analyzed. The conclusions can be summarized as follows:
- (1)
- As for linkage intensity between subnetworks, the Yangtze River Delta has the highest position in China's maritime network, followed by the Southeast Coast and Bohai Bay, with the Pearl River Delta and the Southwest Coast lagging behind. The Pearl River Delta and the Southwest Coast should take measures to improve their competitiveness, such as expanding their business markets. The Southeast Coast and Bohai Bay both have close business relationships with the Yangtze River Delta, but they face intense competition. The Yangtze River Delta, the southeast coast, and Bohai Bay control most of the business in the Chinese maritime network.
- (2)
- As for linkage tightness in subnetworks, the Pearl River Delta has the largest mean linkage tightness, but its distribution is the most dispersed. For example, the linkage tightness between sz and zh is only 0.07. The Southeast Coast has the second-highest mean linkage tightness, and its distribution is the most concentrated. The Yangtze River Delta and Bohai Bay both have relatively low linkage tightness between internal ports. The Southwest Coast also has low linkage tightness between zj and bh, fcg, and qz respectively. Therefore, these subnetworks need to take measures for each subnetwork to improve its operating efficiency by coordinating competition among internal ports, such as clear-cut assignments of port operations, making full use of limited resources, and differentiated development directions and models.
- (3)
- As for spatial isolation between backbone and skeleton networks, all of the skeleton networks in Bohai Bay, the Yangtze River Delta, the Southeast Coast, the Southwest Coast, and the Pearl River Delta, can be connected with their backbone network. However, linkages between the skeleton networks and their center ports in Bohai Bay and the Yangtze River Delta are not very close and need to be further strengthened to provide substantial complementarity.
- (4)
- The concentration index distributions of internal ports are different from one subnetwork to another. In the Yangtze River Delta and Bohai Bay, the concentration index distribution of internal ports has an obvious hierarchical structure. All of the ports on the Southwest Coast tend to interact with certain ports, including fz, gz, and sz, but none of the ports in the Pearl River Delta is preferred in linking with others.
In terms of future research, regional diversity in intensive linkage can be identified as an important topic. According to information, such as ship types and types of goods from Lloyd’s Shipping Register data, differentiations in the trade aspect of these subnetworks can be further analyzed. This would be conducive to a reasonably clear-cut assignment of port operations. On the other hand, the regional accessibility of each port could be analyzed in combination with the land network (e.g., road networks, rail network, etc.) a total transportation network consisting of the maritime network and the land transportation network could also be constructed using a traffic flow dataset. This would be needed to analyze the characteristics of the transportation network and the urban spatial system, including spatial correlation, functional differentiation, and regional diversity. Thirdly, sophisticated analysis about port competitiveness can be carried out. For example, some other factors, such as unitization of port facilities, cargo-handling charges, market share of logistics integrators, the development of inland transport network, etc., can be combined with our analysis result about transportation network organization to enhance the guidance about port competitiveness. Finally, potential affecting factors for dynamic of Chinese maritime network can be analyzed through multi-source data, including statistical data in economy, port’s service characteristic, and official management strategic, and so on.
Acknowledgments
This work was supported in part by National Natural Science Foundation of China (Grants 41231171, 41371420, 40971233), the innovation research funding of Wuhan University (Grant 2042015KF0167).
Author Contributions
Hongchu Yu and Zhixiang Fang conceived and designed the experiments. Hongchu Yu performed the experiments; Hongchu Yu and Zhixiang Fang analyzed the data and wrote the paper. Guojun Peng gave many valuable suggestions and help editing the language of the manuscript, and Mingxiang Feng contributed analysis tools.
Conflicts of Interest
The authors declare no conflict of interest.
References
- Zhang, Y.; Li, S.; Guo, Z. The Evolution of the Coastal Economy: The Role of Working Waterfronts in the Alabama Gulf Coast. Sustainability 2015, 7, 4310–4322. [Google Scholar] [CrossRef]
- Kaluza, P.; Kölzsch, A.; Gastner, M.T.; Blasius, B. The complex network of global cargo ship movements. J. R. Soc. Interface 2010, 7, 1093–1103. [Google Scholar] [CrossRef] [PubMed]
- Tavasszy, L.; Minderhoud, M.; Perrin, J.F.; Notteboom, T. A strategic network choice model for global container flows: Specification, estimation and application. J. Transp. Geogr. 2011, 19, 1163–1172. [Google Scholar] [CrossRef]
- Imai, A.; Nishimura, E.; Papadimitriou, S.; Liu, M. The economic viability of container mega-ships. Transp. Res. Part E Logist. 2006, 42, 21–41. [Google Scholar] [CrossRef]
- Hsu, C.I.; Hsieh, Y.P. Routing, ship size, and sailing frequency decision-making for a maritime hub-and-spoke container network. Math. Comput. Model. 2007, 45, 899–916. [Google Scholar] [CrossRef]
- Agarwal, R.; Ergun, Ö. Ship scheduling and network design for cargo routing in liner shipping. Transp. Sci. 2008, 42, 175–196. [Google Scholar] [CrossRef]
- Ng, M. Distribution-free vessel deployment for liner shipping. Eur. J. Oper. Res. 2014, 238, 858–862. [Google Scholar] [CrossRef]
- Brouer, B.D.; Desaulniers, G.; Pisinger, D. A matheuristic for the liner shipping network design problem. Transp. Res. Part E Logist. 2014, 72, 42–59. [Google Scholar] [CrossRef]
- Zheng, J.; Meng, Q.; Sun, Z. Liner hub-and-spoke shipping network design. Transp. Res. Part E Logist. 2015, 75, 32–48. [Google Scholar] [CrossRef]
- Wang, S.; Meng, Q. Robust bunker management for liner shipping networks. Eur. J. Oper. Res. 2015, 243, 789–797. [Google Scholar] [CrossRef]
- Zheng, J.; Gao, Z.; Yang, D.; Sun, Z. Network design and capacity exchange for liner alliances with fixed and variable container demands. Transp. Sci. 2015, 49, 886–899. [Google Scholar] [CrossRef]
- Zhen, L.; Shen, T.; Wang, S.; Yu, S. Models on ship scheduling in transshipment hubs with considering bunker cost. Int. J. Prod. Econ. 2016, 173, 111–121. [Google Scholar] [CrossRef]
- Veenstra, A.W.; Mulder, H.M.; Sels, R.A. Analysing container flows in the Caribbean. J. Transp. Geogr. 2005, 13, 295–305. [Google Scholar] [CrossRef]
- Notteboom, T.E.; Rodrigue, J.P. Port regionalization: Towards a new phase in port development. Marit. Policy Manag. 2005, 32, 297–313. [Google Scholar] [CrossRef]
- Wang, C.; Wang, J. Spatial pattern of the global shipping network and its hub-and-spoke system. Res. Transp. Econ. 2011, 32, 54–63. [Google Scholar] [CrossRef]
- Ducruet, C. Network diversity and maritime flows. J. Transp. Geogr. 2013, 30, 77–88. [Google Scholar] [CrossRef] [Green Version]
- Fremont, A. Global maritime networks: The case of Maersk. J. Transp. Geogr. 2007, 15, 431–442. [Google Scholar] [CrossRef]
- Ducruet, C.; Zaidi, F. Maritime constellations: A complex network approach to shipping and ports. Marit. Policy Manag. 2012, 39, 151–168. [Google Scholar] [CrossRef]
- Caschili, S.; Medda, F.; Parola, F.; Ferrari, C. An analysis of shipping agreements: The cooperative container network. Netw. Spat. Econ. 2014, 14, 357–377. [Google Scholar] [CrossRef]
- Song, D.; Zhang, J.; Carter, J.; Field, T.; Marshall, J.; Polak, J.; Schumacher, K.; Sinha-Ray, P.; Woods, J. On cost-efficiency of the global container shipping network. Marit. Policy Manag. 2005, 32, 15–30. [Google Scholar] [CrossRef]
- Jiang, J.; Lee, L.H.; Chew, E.P.; Gan, C.C. Port connectivity study: An analysis framework from a global container liner shipping network perspective. Transp. Res. Part E Logist. 2015, 73, 47–64. [Google Scholar] [CrossRef]
- Laxe, F.G.; Seoane, M.J.F.; Montes, C.P. Maritime degree, centrality and vulnerability: Port hierarchies and emerging areas in containerized transport (2008–2010). J. Transp. Geogr. 2012, 24, 33–44. [Google Scholar] [CrossRef]
- Li, Z.; Xu, M.; Shi, Y. Centrality in global shipping network basing on worldwide shipping areas. GeoJournal 2015, 80, 47–60. [Google Scholar] [CrossRef]
- Ducruet, C.; Notteboom, T. The worldwide maritime network of container shipping: Spatial structure and regional dynamics. Global Netw. 2012, 12, 395–423. [Google Scholar] [CrossRef] [Green Version]
- Ducruet, C.; Rozenblat, C.; Zaidi, F. Ports in multi-level maritime networks: Evidence from the Atlantic (1996–2006). J. Transp. Geogr. 2010, 18, 508–518. [Google Scholar] [CrossRef] [Green Version]
- Fransoo, J.C.; Lee, C.Y. The critical role of ocean container transport in global supply chain performance. Prod. Oper. Manag. 2013, 22, 253–268. [Google Scholar] [CrossRef]
- Wilmsmeier, G.; Notteboom, T. Determinants of liner shipping network configuration: A two-region comparison. GeoJournal 2011, 76, 213–228. [Google Scholar] [CrossRef]
- Mohamed-Chérif, F.; Ducruet, C. Regional integration and maritime connectivity across the Maghreb seaport system. J. Transp. Geogr. 2016, 51, 280–293. [Google Scholar] [CrossRef] [Green Version]
- Hägerstrand, T. The Propagation of Innovation Waves; Lund Studies in Geography: Series B, Human Geography 4; Royal University of Lund, Dept. of Geography: Lund, Sweden, 1952. [Google Scholar]
- Notteboom, T.E. The peripheral port challenge in container port systems. In International Maritime Transport: Perspectives; Leggate, H., Mcconville, J., Morvillo, A., Eds.; Routledge: London, UK, 2005; pp. 173–188. [Google Scholar]
- Wilmsmeier, G.; Monios, J.; Pérez-Salas, G. Port system evolution—The case of Latin America and the Caribbean. J. Transp. Geogr. 2014, 39, 208–221. [Google Scholar] [CrossRef]
- Monios, J.; Wilmsmeier, G. Giving a direction to port regionalisation. Transp. Res. Part A Policy Pract. 2012, 46, 1551–1561. [Google Scholar] [CrossRef]
- Monios, J.; Wilmsmeier, G. Port-centric logistics, dry ports and offshore logistics hubs: Strategies to overcome double peripherality. Marit. Policy Manag. 2012, 39, 207–226. [Google Scholar] [CrossRef]
- Ducruet, C. Multilayer dynamics of complex spatial networks: The case of global maritime flows (1977–2008). J. Transp. Geogr. 2017, 60, 47–58. [Google Scholar] [CrossRef]
- Kosowska-Stamirowska, Z.; Ducruet, C.; Rai, N. Evolving structure of the maritime trade network: Evidence from the Lloyd’s Shipping Index (1890–2000). J. Shipp. Trade 2016, 1, 10. [Google Scholar] [CrossRef]
- Xu, M.; Li, Z.; Shi, Y.; Zhang, X.; Jiang, S. Evolution of regional inequality in the global shipping network. J. Transp. Geogr. 2015, 44, 1–12. [Google Scholar] [CrossRef]
- Tongzon, J.; Heng, W. Port privatization, efficiency and competitiveness: Some empirical evidence from container ports (terminals). Transp. Res. Part A Policy Pract. 2005, 39, 405–424. [Google Scholar] [CrossRef]
- Zhou, Y.X.; Hu, Z.Y. Looking into the network structure of Chinese urban system from the perspective of air transportation. Geogr. Res. 2002, 21, 276–286. [Google Scholar]
- Li, Q.Q.; Chang, X.M.; Shaw, S.L.; Yan, K.; Yue, Y.; Chen, B.Y. Characteristics of micro-blog inter-city social interactions in China. J. Shenzhen Univ. Sci. Eng. 2013, 30, 441–449. [Google Scholar] [CrossRef]
Figure 1.
Overall process flowchart.

Figure 2.
Chart of all Chinese coastal ports.

Figure 3.
Linkage intensity between ports in the Chinese maritime network.

Figure 4.
Linkage intensity grades of a port subnetwork (CJ for Yangtze River Delta, DN for Southeast Coast, HB for Bohai Bay, XN for Southwest Coast, and ZJ for Pearl River Delta).
Figure 4.
Linkage intensity grades of a port subnetwork (CJ for Yangtze River Delta, DN for Southeast Coast, HB for Bohai Bay, XN for Southwest Coast, and ZJ for Pearl River Delta).

Figure 5.
Accumulation histogram of the linkage intensity of each subnetwork (CJ for Yangtze River Delta, DN for Southeast Coast, HB for Bohai Bay, XN for Southwest Coast, and ZJ for Pearl River Delta).
Figure 5.
Accumulation histogram of the linkage intensity of each subnetwork (CJ for Yangtze River Delta, DN for Southeast Coast, HB for Bohai Bay, XN for Southwest Coast, and ZJ for Pearl River Delta).

Figure 6.
Tightness distribution in subnetworks (CJ for Yangtze River Delta, DN for the Southeast Coast , HB for Bohai Bay, XN for the Southwest Coast, ZJ for the Pearl River Delta).
Figure 6.
Tightness distribution in subnetworks (CJ for Yangtze River Delta, DN for the Southeast Coast , HB for Bohai Bay, XN for the Southwest Coast, ZJ for the Pearl River Delta).

Figure 7.
Spatial isolation of backbone and skeleton networks.

Figure 8.
Distribution of port business concentration indices (CJ represents the Yangtze River Delta, DN the Southeast Coast, HB the Bohai Bay, XN the Southwest Coast, and ZJ the Pearl River Delta).
Figure 8.
Distribution of port business concentration indices (CJ represents the Yangtze River Delta, DN the Southeast Coast, HB the Bohai Bay, XN the Southwest Coast, and ZJ the Pearl River Delta).


Table 1.
Port subnetwork in China.
| Port Subnetwork | Economic Hinterland | Member Ports |
|---|---|---|
| Yangtze River Delta | Relying on Shanghai as an international shipping center, giving priority to Shanghai Port, Ningbo Port, and Lianyungang Port, and supporting the economic and social development of the Yangtze River Delta economic region. | Ningbo (nb), Zhoushan (zs), Yangshan (ys), Lianyungang (lyg), Taizhou (tz), Wenzhou (wz), Wusong (ws), Jiaxing (jx) |
| Southeast Coast | Giving priority to Xiamen Port and Fuzhou Port, supporting the economic and social development of Fujian Province, Jiangxi Province, etc., and the need for “three links” to Taiwan | Xiamen (xm), Fuzhou (fz), Quanzhou (quz) |
| Bohai Bay | Giving priority to Tianjin Port, Dalian Port, Yantai Port, Qingdao Port, etc., supporting the economic and social development of Beijing and Tianjin, northern China and its western extension, the three northeastern provinces and Eastern Mongolia, Shandong Province and its western extension, etc. | Tianjin (tj), Qinhuangdao (qhd), Tangshan (ts), Huanghua (hh), Caofeidian (cfd), Dalian (dl), Yingkou (yk), Jinzhou (jz), Qingdao (qd), Yantai (yt), Rizhao (rz), Chengshantou (cst), Weihai (wh), Changshan (cs) |
| Southwest Coast | Giving priority to Zhanjiang Port, Fangchenggang Port, etc., supporting the economic and social development of China's western region, providing transportation security for Hainan Province to expand exchange of goods with other places. | Zhanjiang (zj), Fangchenggang (fcg), Beihai (bh), Qinzhou (qz), Qiongzhou (qioz) |
| Pearl River Delta | Giving priority to Guangzhou Port, Shenzhen Port, Zhuhai Port, etc., providing service for southwestern and southern China, strengthening communication between Guangdong Province and the Hong Kong and Macao regions. | Guangzhou (gz), Shenzhen (sz), Zhuhai (zh) |
Table 2.
Automatic Information System (AIS) data description.
| Item | Its Meaning |
|---|---|
| MMSI | Unique ID of a vessel |
| IMO | ID registered with International Maritime Organization (IMO) |
| Time | Second-level timestamp (e.g., 10 June 2015, 01:16:58) |
| Location | Longitude and latitude of the location |
| Vessel_name | Name of the vessel |
| Flag_normalized | Country to which the vessel belongs |
| Speed | Speed of the vessel |
| Course | Heading of the vessel |
Table 3.
Frequency of linkage intensity grades for each maritime subnetwork.
| Grade | CJ | DN | HB | XN | ZJ |
|---|---|---|---|---|---|
| 1 | 124 | 39 | 167 | 108 | 50 |
| 2 | 29 | 20 | 41 | 8 | 16 |
| 3 | 7 | 10 | 14 | 1 | 4 |
| 4 | 10 | 8 | 6 | 3 | 3 |
| 5 | 9 | 7 | 8 | 1 | 7 |
| 6 | 4 | 2 | 2 | 1 | 3 |
| 7 | 3 | 2 | 1 | 0 | 0 |
| 8 | 1 | 2 | 0 | 0 | 1 |
Table 4.
Statistical analysis of linkage tightness.
| Port_Group | Min | Q1 | Median | Mean | Q3 | Max | Var | SD | CV (%) |
|---|---|---|---|---|---|---|---|---|---|
| CJ | 0.010 | 0.017 | 0.061 | 0.088 | 0.117 | 0.345 | 0.008 | 0.091 | 103.419 |
| DN | 0.217 | 0.226 | 0.236 | 0.258 | 0.278 | 0.321 | 0.003 | 0.055 | 21.455 |
| HB | 0.000 | 0.010 | 0.024 | 0.052 | 0.070 | 0.410 | 0.005 | 0.070 | 134.387 |
| XN | 0.021 | 0.069 | 0.117 | 0.141 | 0.202 | 0.280 | 0.009 | 0.092 | 65.421 |
| ZJ | 0.073 | 0.272 | 0.471 | 0.441 | 0.625 | 0.778 | 0.125 | 0.353 | 80.158 |
Note: Min for minimum value; Q1 for the first quartile; Q3 for the third quartile; Max for maximum value; Var for variance; SD for standard deviation; and CV for the coefficient of variation.
© 2017 by the authors. Licensee MDPI, Basel, Switzerland. This article is an open access article distributed under the terms and conditions of the Creative Commons Attribution (CC BY) license (http://creativecommons.org/licenses/by/4.0/).
Share and Cite
MDPI and ACS Style
Yu, H.; Fang, Z.; Peng, G.; Feng, M. Revealing the Linkage Network Dynamic Structures of Chinese Maritime Ports through Automatic Information System Data. Sustainability 2017, 9, 1913. https://0-doi-org.brum.beds.ac.uk/10.3390/su9101913
AMA Style
Yu H, Fang Z, Peng G, Feng M. Revealing the Linkage Network Dynamic Structures of Chinese Maritime Ports through Automatic Information System Data. Sustainability. 2017; 9(10):1913. https://0-doi-org.brum.beds.ac.uk/10.3390/su9101913
Chicago/Turabian StyleYu, Hongchu, Zhixiang Fang, Guojun Peng, and Mingxiang Feng. 2017. "Revealing the Linkage Network Dynamic Structures of Chinese Maritime Ports through Automatic Information System Data" Sustainability 9, no. 10: 1913. https://0-doi-org.brum.beds.ac.uk/10.3390/su9101913
Note that from the first issue of 2016, this journal uses article numbers instead of page numbers. See further details here.