Understanding Stakeholders’ Influence on Project Success with a New SNA Method: A Case Study of the Green Retrofit in China

1
School of International and Public Affairs, Shanghai Jiao Tong University, Shanghai 200240, China
2
School of Economics and Management, Tongji University, Shanghai 200092, China
3
Department of Building and Real Estate, Hong Kong Polytechnic University, Hong Kong, China
4
School of Economics and Management Engineering, Beijing University of Civil Engineering and Architecture, Beijing 100037, China
*
Author to whom correspondence should be addressed.
Sustainability 2017, 9(10), 1927; https://0-doi-org.brum.beds.ac.uk/10.3390/su9101927
Submission received: 6 August 2017
/
Revised: 8 October 2017
/
Accepted: 19 October 2017
/
Published: 24 October 2017
(This article belongs to the Section Economic and Business Aspects of Sustainability)
Abstract
:Stakeholders strongly influence project success, particularly for complex projects with heterogeneous stakeholders, and hence, understanding their influence is essential for project management and implementation. This paper proposes an original model based on social network analysis (SNA), which first introduces critical success factors (CSFs) as intermediate variables between stakeholders and project success. The model can demonstrate the interrelation between stakeholders and CSFs, and the results can reveal how stakeholders influence project success. Green retrofit is a typical type of complex project. The stakeholder relationship in green retrofit projects is more complex than in new projects, since more stakeholders (e.g., tenants and facility managers) who have particular interrelations (e.g., lease contract and split incentives between owners and tenants) are involved. Therefore, a case study of green retrofit in China was conducted to illustrate how the proposed model works. The results indicated the priorities and similarities of stakeholders in green retrofit. Stakeholders are categorized into five clusters according to their relationship. Based on the results, the important role of stakeholders in green retrofit projects was discussed. The main contribution of this study is providing a novel method to reveal how stakeholders influence the success of complex projects.
1. Introduction
Stakeholder management largely accounts for the success of projects, particularly that of complex projects [1]. Stakeholders can be defined as an individual or a group of individuals, who are influenced by or able to influence a project [2]. The strong cooperation of stakeholders is necessary for project success, since a project can be considered a temporary organization of stakeholders pursuing an aim together [3]. McElroy and Mills [1] indicated that the purpose of stakeholder management is to achieve project success through the continuing development of their interrelationships. Therefore, identifying how stakeholders influence project success is an important and fundamental issue of stakeholder management.
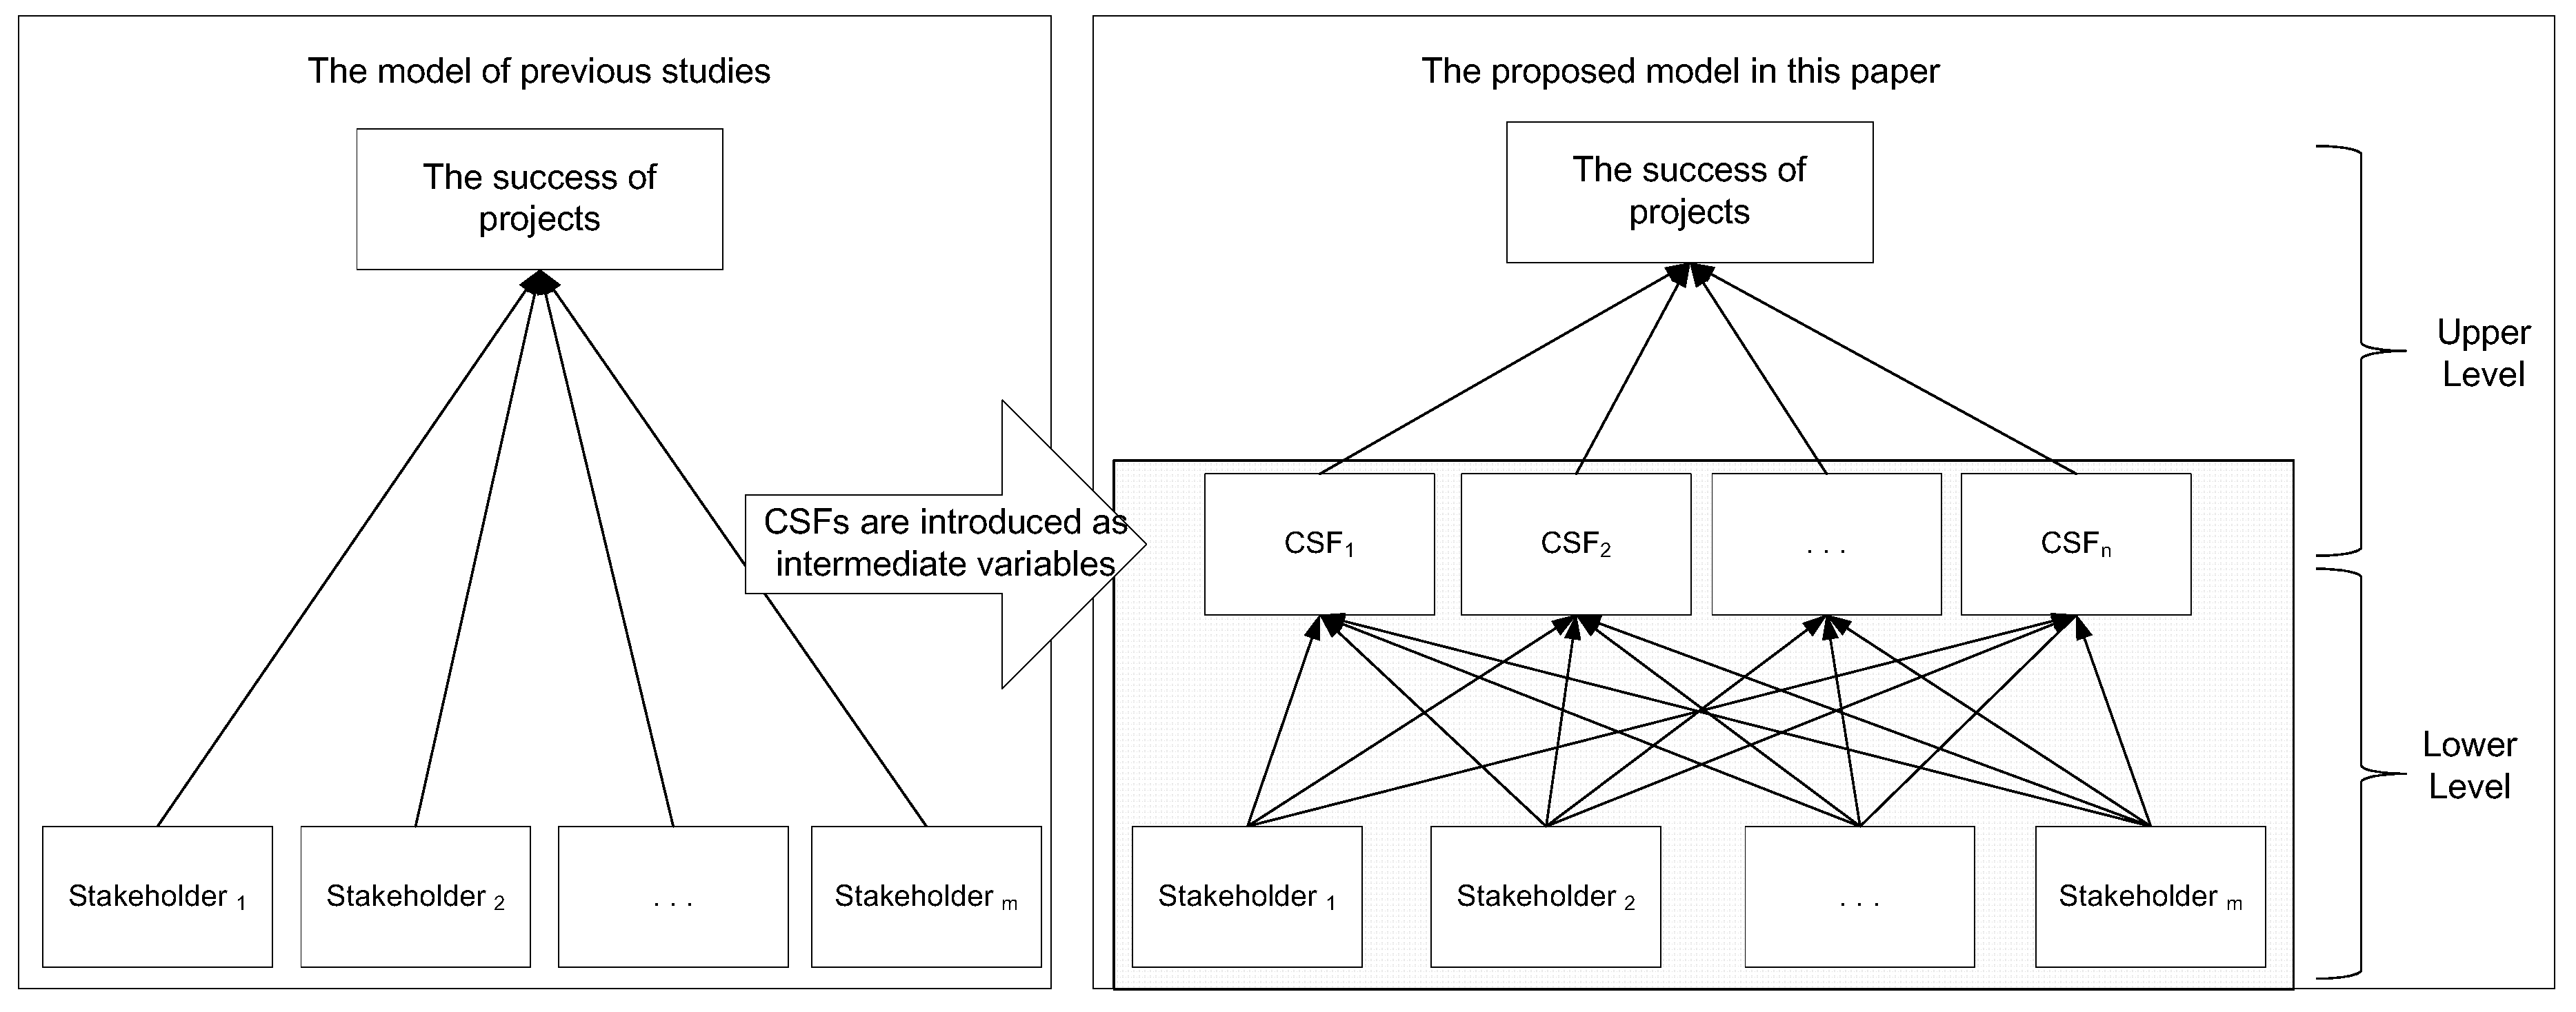
Most previous studies analyzed the priorities of stakeholders through questionnaires and surveys, which prioritizes stakeholder influence directly, shown in the left part of Figure 1. This is appropriate in projects with relatively simple stakeholder relationships. However, most projects have non-linear, complex, and interactive stakeholder relationships. The methods used in previous studies cannot address this complex problem. Furthermore, the methods used in previous studies cannot identify the underlying logic of how stakeholders influence the success of projects [4,5]. Namely, they only answer the question “who”, that is, which stakeholders influence project success significantly, rather than how they influence the success and the relationships between them. Therefore, research gaps can be identified as the methods used in previous studies (1) are not suitable for projects with complex stakeholder relationships, and (2) cannot explain the underlying logic between stakeholders and project success.
To bridge these research gaps, this study proposes an original model that analyzes stakeholder influence on the success of projects. The main contribution of this model is the introduction of critical success factors (CSFs) [6] as intermediate variables. Namely, the influence path is “stakeholders—CSFs—project success”, in which CSFs are variables between stakeholders and project success, and as such, they were referred to as intermediate variables. Compared to the models in previous studies (shown in Figure 1 on the left side), the proposed model breaks down the problem into two levels through CSFs (shown in Figure 1 on the right side): the lower level illustrates how stakeholders influence CSFs, and the upper level illustrates how CSFs influence the success of projects. Since the relationship between project success and CSFs (the upper level) has been revealed in numerous previous studies [7,8], this study focuses on the lower level, represented by the shaded area in Figure 1. Then, by combining the lower and upper levels, the influence paths of stakeholders on project success can be revealed.
The relationship between CSFs and stakeholders can be modeled as a network between two groups (CSFs and stakeholders), which is a typical two-mode network or bipartite graph problem [5,9]. Therefore, this study analyzes the relationship between stakeholders and CSFs based on a two-mode network. The two-mode network is a particular type of social network analysis (SNA), which is considered an effective method for understanding the stakeholder relationship [10,11,12], especially in identifying the underlying relationship structure [13,14]. The two-mode network can model relationships between two different sets in a bipartite graph, which is different from the conventional one-mode network analysis. Many large, real-world networks can be modeled naturally using two-mode networks [15,16,17]. Through two-mode network analysis, similarity among stakeholders according to their relationship with CSFs can be identified. The similarity degree is normalized at intervals from 0 to 1. A high value demonstrates that the two stakeholders have a similar relationship with CSFs. An extreme example is that the two stakeholders obtain exactly the same points in each of the CSFs, which means the two stakeholders have the same relationship with the CSFs. Similar stakeholders should have similar objectives, benefits, and risks. Understanding this relationship can help improve the efficiency of stakeholder management.
This study selected green retrofit in China as a case study to illustrate how the proposed model works. “Green retrofit”, which can be defined as the innovation of the fabric and systems of a building with the primary intention of improving energy efficiency, is considered to be an important approach for energy conservation. Although green retrofit has been promoted by governments in numerous countries, it still faces various difficulties [18]. A main issue is that stakeholder management in green retrofit projects is more complex [19]. First, more stakeholders (e.g., tenants and facility managers) are involved in green retrofit projects compared to new projects. In addition, the interrelations among stakeholders are also more complex, including different occupancy types, property rights, and lease contracts. Therefore, it is critical to apply novel methods to comprehensively understand the relationships between stakeholders and their influence on the success of these projects.
The aim of this study is to propose a two-mode network model to analyze the relationship between stakeholders and CSFs, as well as stakeholders’ influence on project success. The objectives of this study are as follows:
- (1)
- Analyze the relationship between stakeholders and CSFs using the proposed two-mode network model.
- (2)
- Discuss the methods of the two-mode network and adopt an appropriate method to reveal the relationship among stakeholders based on CSFs, including closeness, priorities, and clusters.
- (3)
- Use a case study of green retrofit in China to illustrate how the proposed model works in a stepwise manner, and indicate problems and suggestions based on this case study.
The rest of the paper is organized as follows. Section 2 critically reviews the literature on SNA. Section 3 introduces the two-mode network model and the methods of the proposed model. Section 4 illustrates how the proposed model works through a case study of green retrofit in China. The results of the case study are comprehensively discussed in this section. Section 5 concludes the study and presents suggestions for future research.
2. Social Network Analysis (SNA)
The concept of SNA developed from social network theory, which is an interdisciplinary endeavor derived from sociology and anthropology [20], and incorporates mathematical, statistical, and informational methodologies [21]. A “Social network” could be defined as “a specific set of linkages among a defined set of persons, with the additional property that the characteristics of these linkages as a whole may be used to interpret the social behavior of the persons involved” [20]. Furthermore, the social network focuses on the links that tie each individual to other individuals. That is, the classical one-mode social network refers to the set of actors and the links between them, which are the two essential elements in a social network [21].
SNA has been widely used in stakeholder analysis, in which the nodes in the network are defined as stakeholders and the links as the relationships between them. SNA in stakeholder analysis can provide the relationship structures of stakeholders, which is illustrated by a graph of the network. More information could be represented in the graph: for example, the shape of nodes represents the type of stakeholders, and the width of links represents the tightness of relationships. Furthermore, some methods based on graph theory can be applied to facilitate SNA in stakeholder analysis.
Previous studies have applied SNA in stakeholder analysis to identify stakeholders, map their interrelationships, and analyze their priorities, influence, clusters, and other attributes [10,22,23]. Prell, Hubacek and Reed [23] applied SNA to natural resource stakeholder analysis and identified that stakeholders played more central roles in the network of nature resource management. Yang [21] identified the priority of stakeholders through SNA for a regional renewal project in Australia. Yang and Zou [24] first integrated stakeholder and risk analysis by SNA, which is called stakeholder-associated risks analysis. They proposed an SNA-based model to identify and analyze the interrelationships between stakeholders and risks in complex green building projects. However, most previous studies used a one-mode network to investigate the relationship between stakeholders, rather than the relationship between stakeholders and some essential factors in project management (e.g., CSFs). Therefore, in this study, a two-mode network model is proposed to analyze the interaction relationship between stakeholders and CSFs.
3. The Two-Mode Network Model
A two-mode network is beneficial when modeling the relationship between two groups [5]. Some two-mode network-based models have been proposed that analyze the relationship between individuals and their associated attributes, such as board members and the companies they lead [25]. A major difference from the classical one-mode network is that the two-mode network’s nodes are in two disjointed sets, and the links are between the nodes of both sets [26]. That is, two nodes in the same set should not be linked.
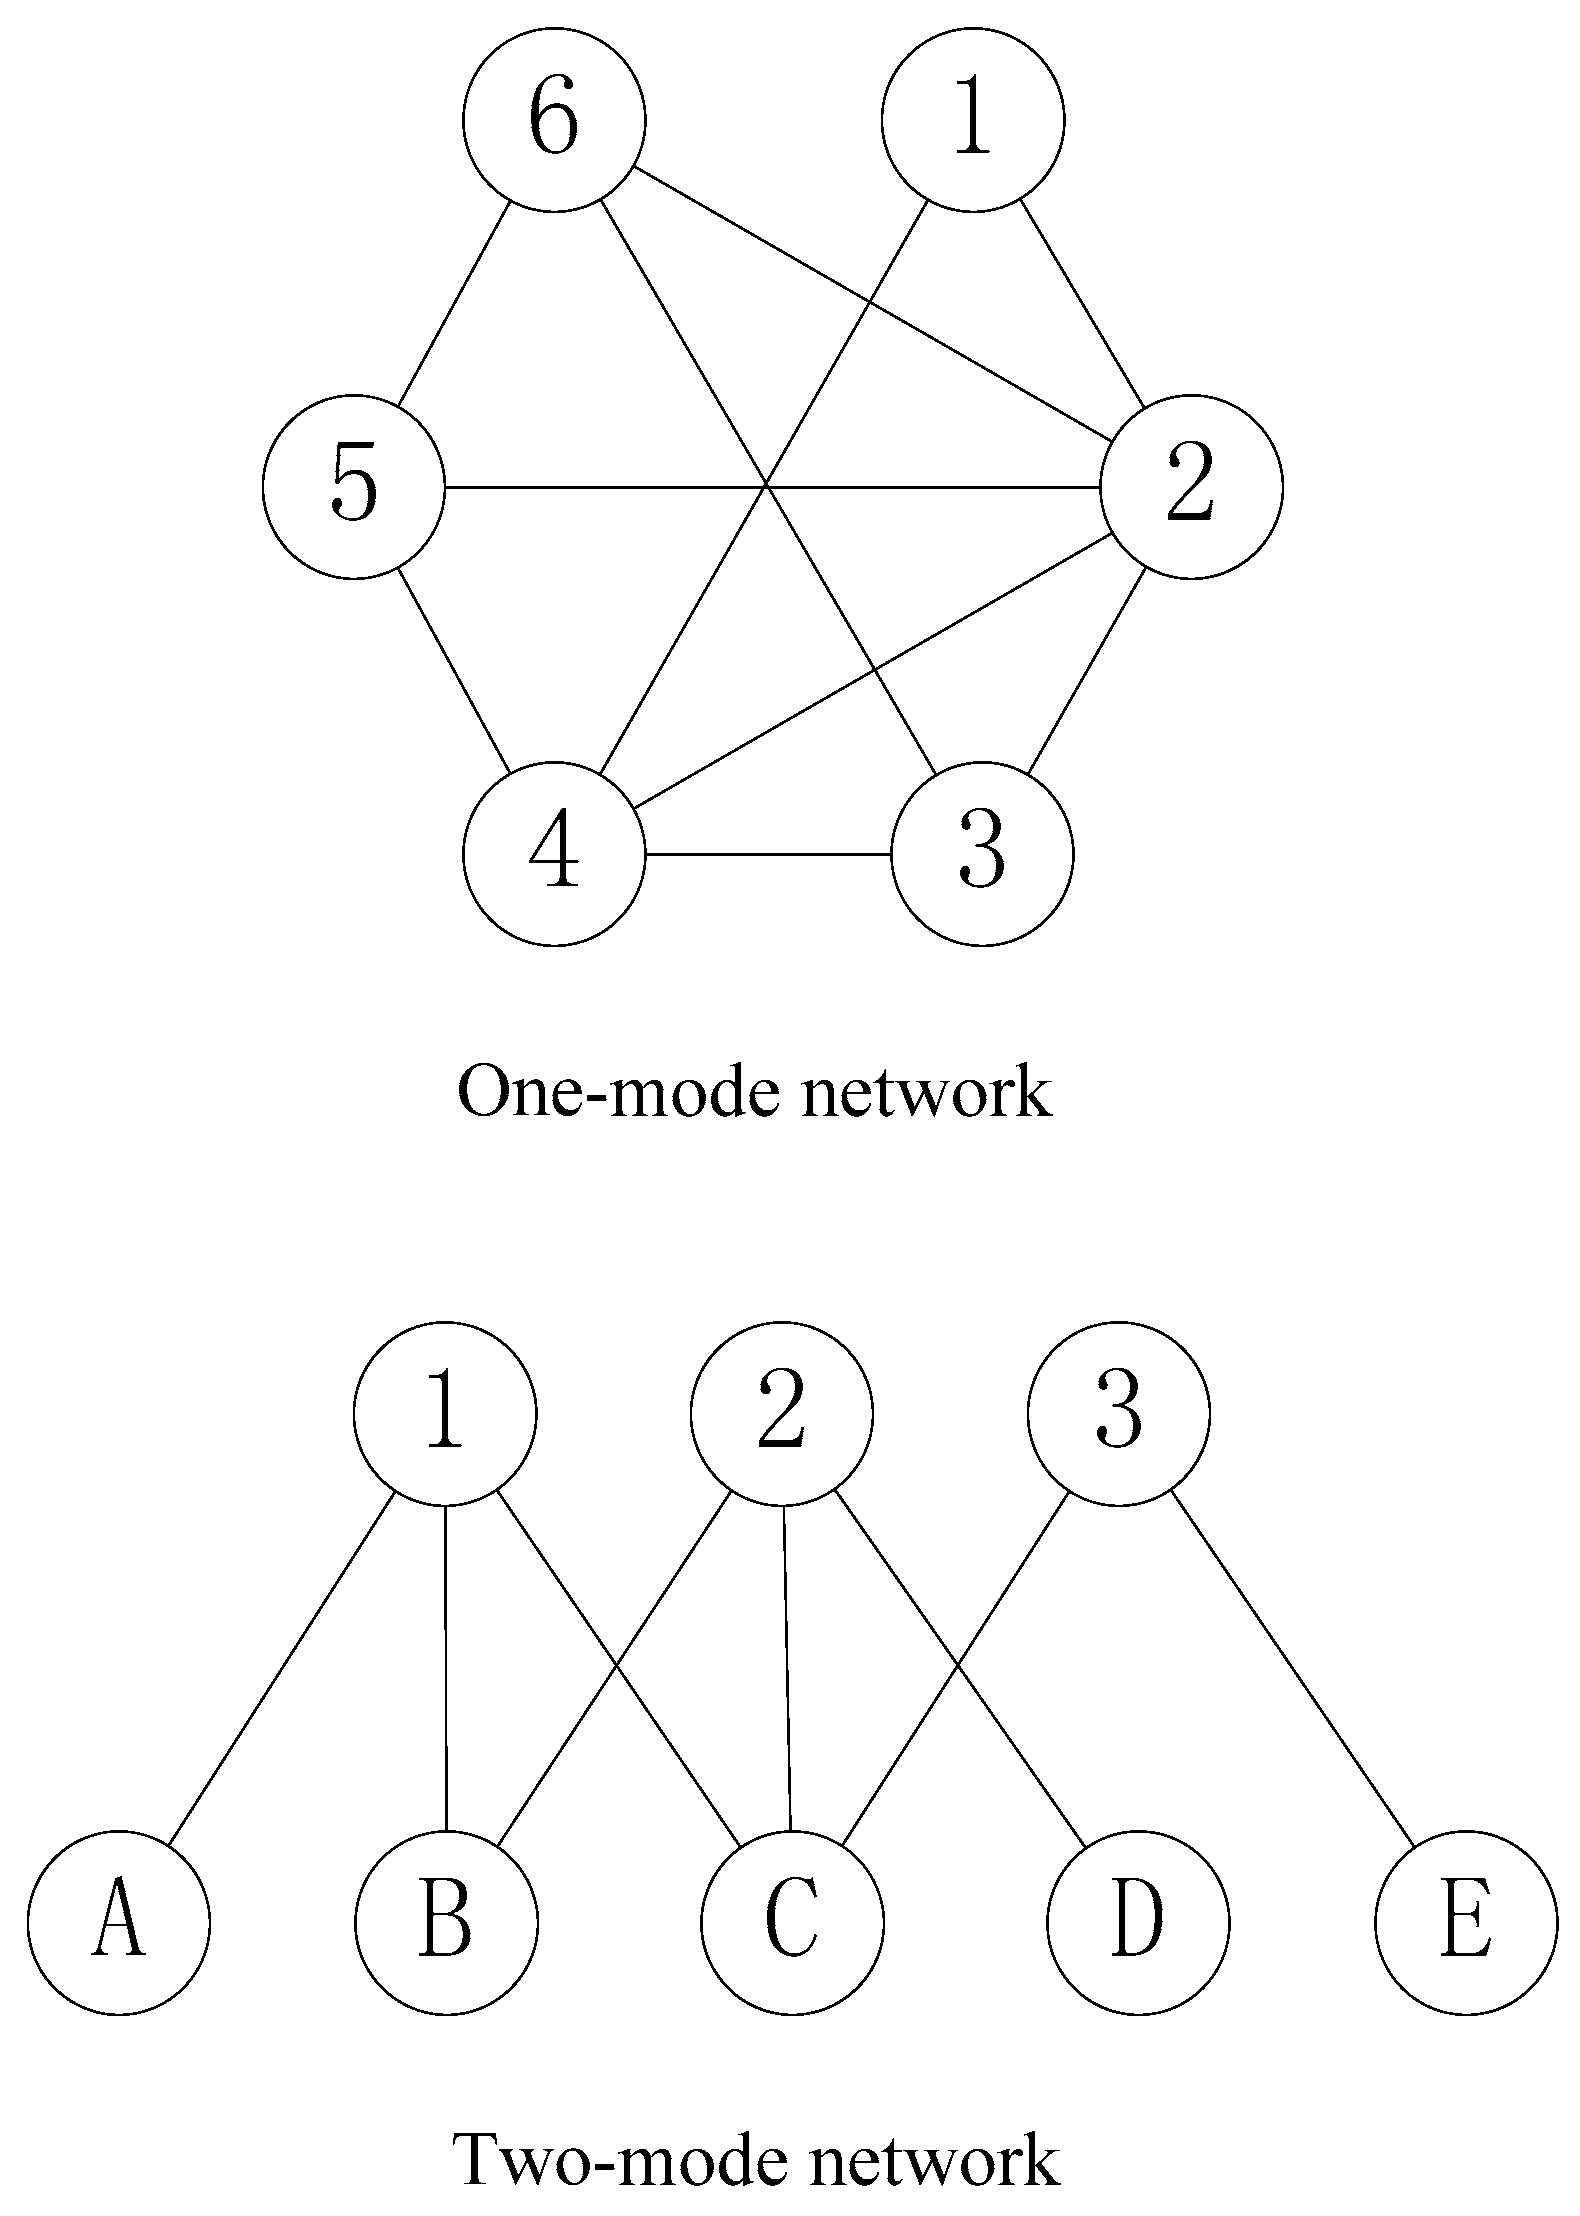
A two-mode network can be represented as a triplet G = (▽, △, E), where ▽ is the set of top nodes, △ is the set of bottom nodes, and E ▽ × △ is the set of links [9]. Figure 2 shows an example of one-mode versus two-mode networks. The nodes 1 to 3 in the two-mode network are the top nodes and the nodes A to E are the bottom nodes. There is no link between top nodes or between bottom nodes.
3.1. Analytical Approaches Used for Two-Mode Networks
There have been two typical approaches for two-mode networks. Borgatti and Halgin [27] referred to these as the “conversion” approach and the “direct” approach. The direct approach analyzes the two-mode network directly, with the two modes analyzed jointly. In this approach, both modes are taken account of in an integrated way [5]. For example, an “m by n” two-mode network will be considered as an “(m + n) by (m + n)” matrix, which loses the rigor and generality of a two-mode network structure [27]. The conversion approach converts a two-mode network into a one-mode network, so that it can be analyzed by methods defined for classical one-mode networks. The direct method attracted attention in recent years, and some specific methods for two-mode networks have been proposed, but these often lack rigor and generality, making the relevance of the results difficult to evaluate [9]. Therefore, more studies on two-mode networks have used the conversion method. Some scholars assumed that the latter method significantly causes information loss, because information of the bipartite structure may disappear after transformation [9]. However, Everett and Borgatti [5] argued that the conversion method can retain the information needed to reconstruct the original two-mode matrix in most empirical cases. This study also indicated the projection methods are generally safe to use and often have conceptual advantages over direct methods. Table 1 shows the categories of methods for two-mode networks.
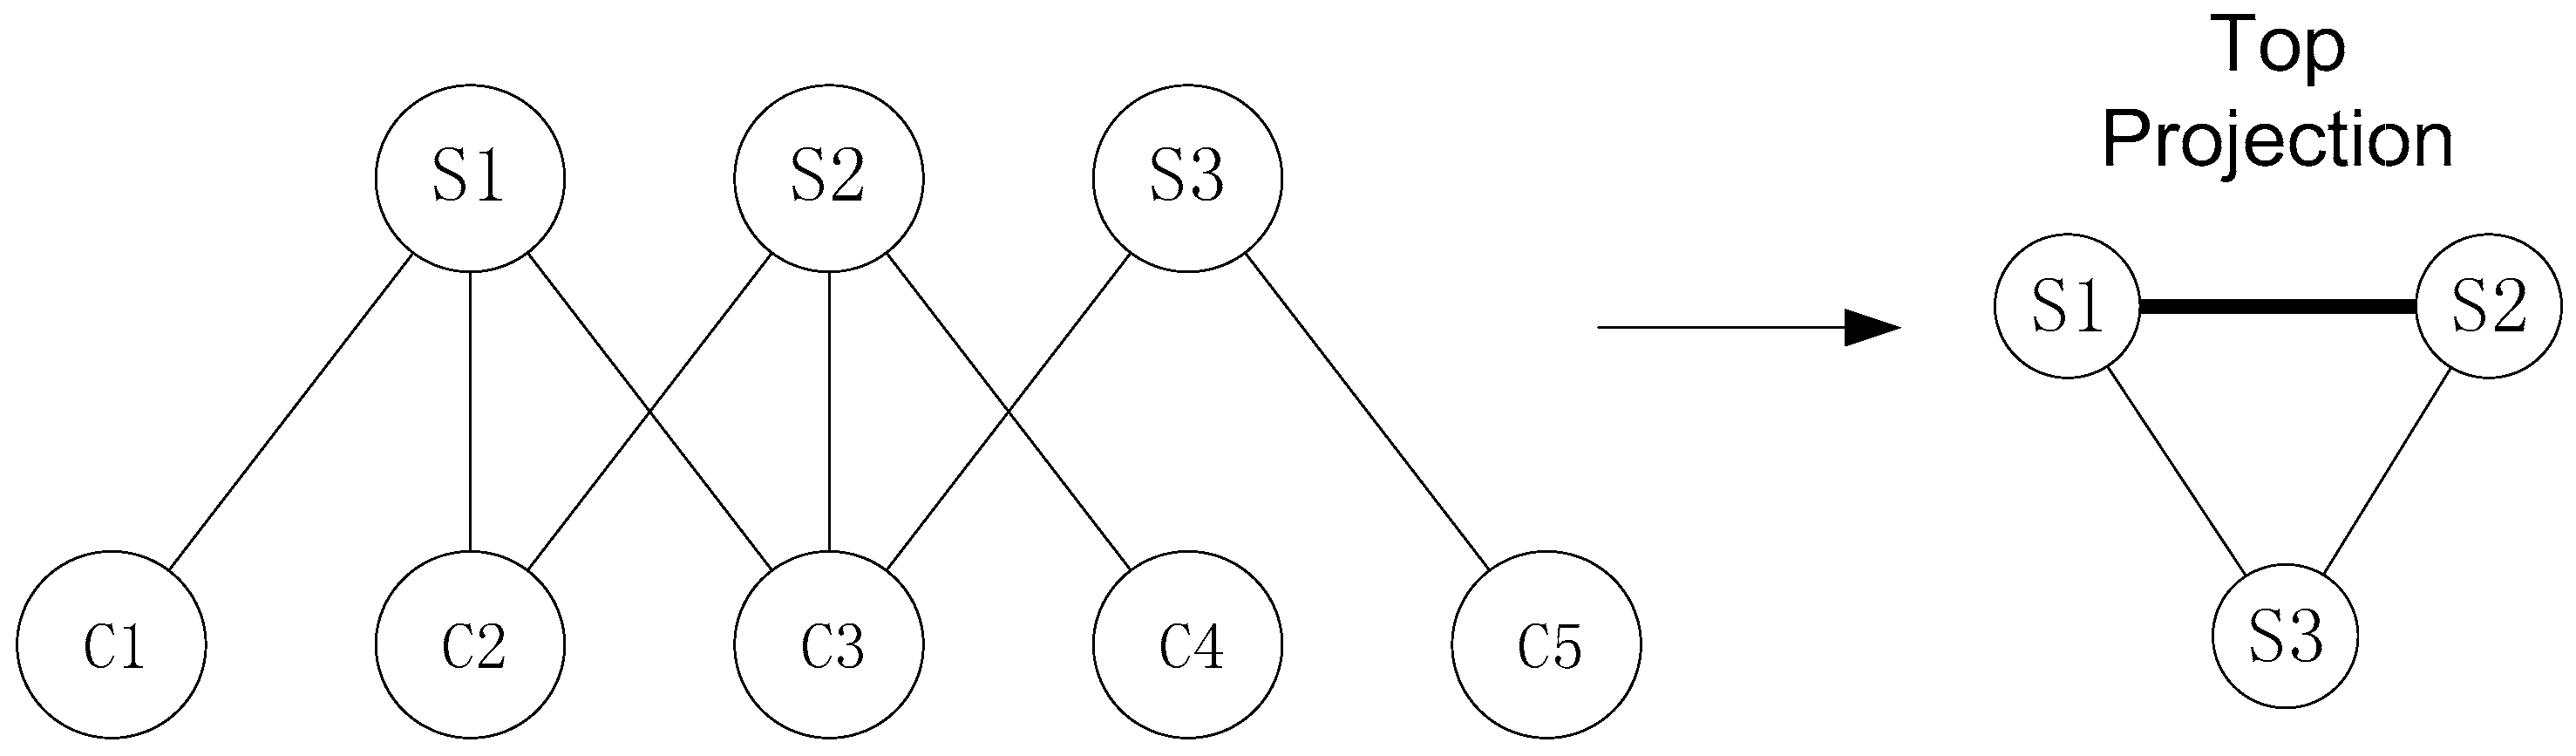
Projection is used to project a two-mode network to a one-mode network, which includes two types of projection: “top projection” and “bottom projection.” The top projection links two nodes in ▽ together, when they are linked to a common neighbor in △. It can be represented by G▽ = (▽, E▽), where the value of E▽ could be defined as the number of common neighbors in △ multiplied by the weighted value of links in E. The process of bottom projection is the same as that used in top projection. Several previous studies used projection to convert and analyze two-mode networks [5,9,15]. For example, an actor–movie network was projected to a one-mode network of actors, where two actors were linked if they played in the same movie [15].
We can apply the projection approach for analyzing how stakeholders influence CSFs, so that a stakeholder–CSF two-mode network can be projected to a one-mode network of stakeholders. The tightness of relationships between stakeholders with regard to CSFs can be illustrated by this top projection in Figure 3, based on which stakeholders’ influence on CSFs and project success can be identified. An illustration of the projection for stakeholder–CSF analysis is shown in Table 2 and Figure 3. Table 2 shows an example of a stakeholder–CSF relationship matrix, where stakeholders are coded with S# and CSFs are coded with C*, where # represents the identity of each stakeholder and * represents the identity of each CSF. A value of one at the cross points of S# and C* in the matrix indicates that they are linked and zero indicates that they are not. The matrix of three stakeholders and five CSFs in Table 2 can be visualized to the network on the left side of Figure 3. In addition, the relationship of stakeholders through CSFs can be built using the top projection, shown on the right side of Figure 3.
3.2. Processes of Two-Mode Network Models
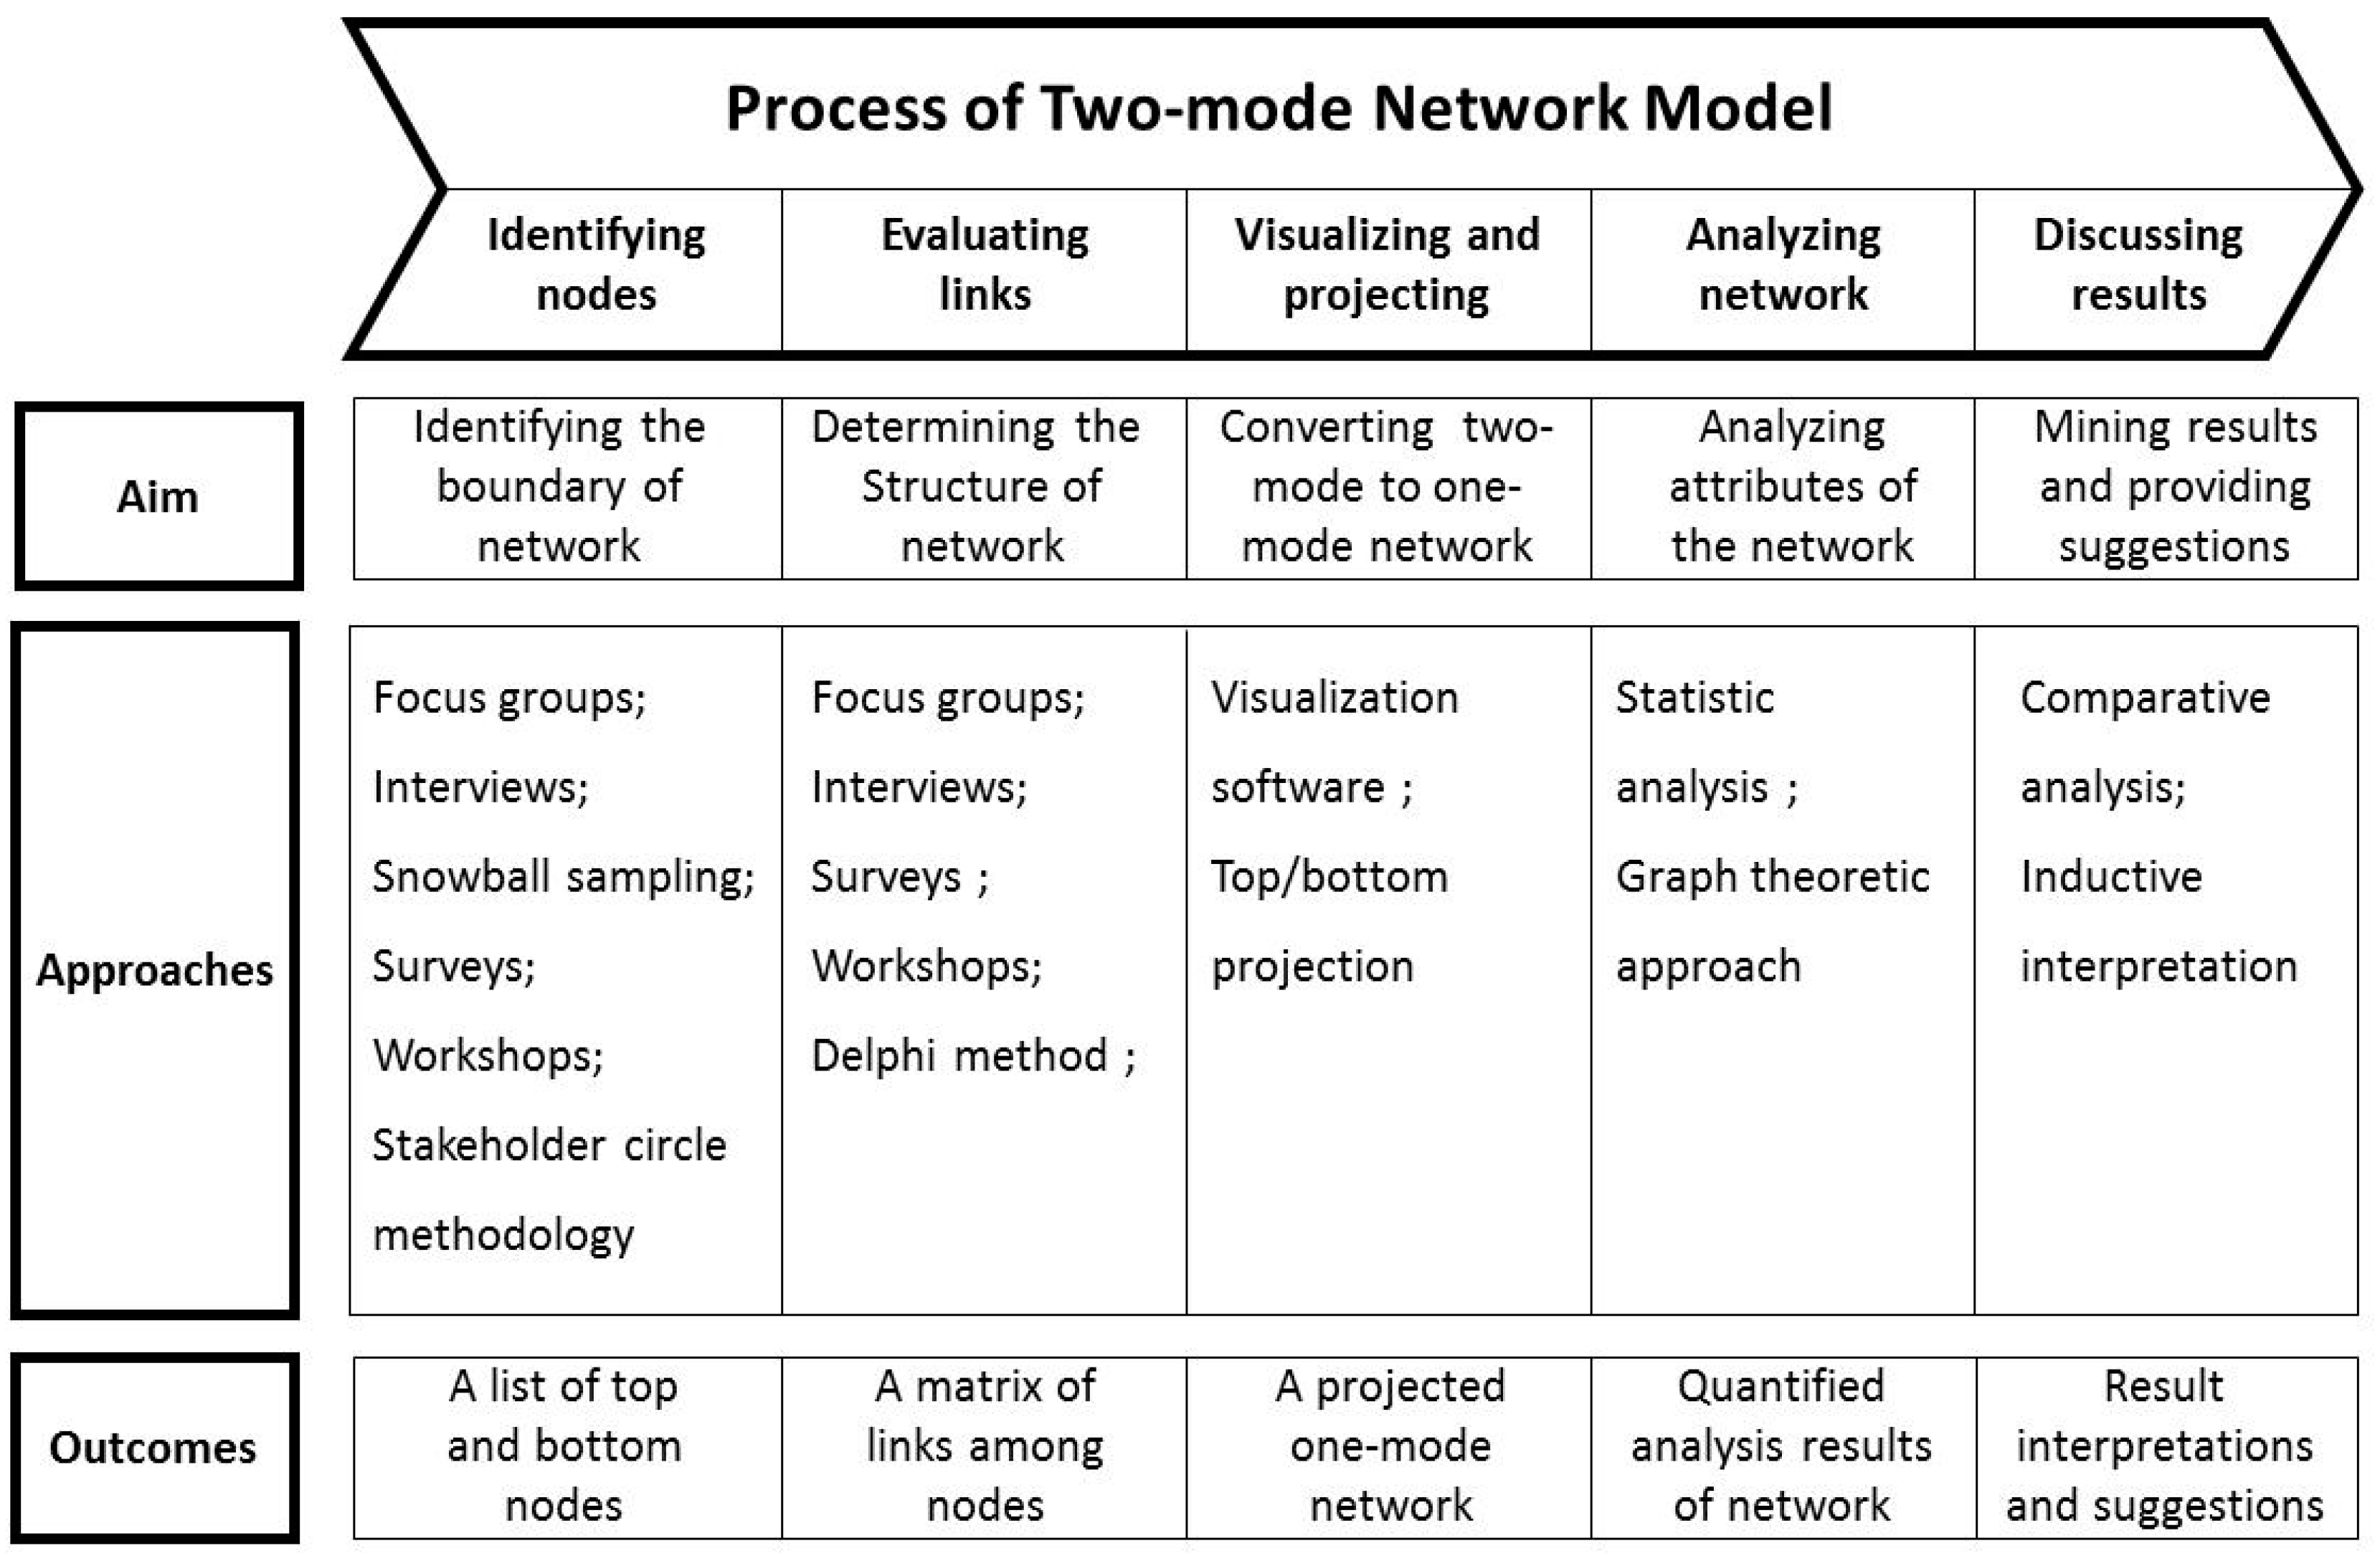
Yang [21] summarized the process of conducting an SNA in five main steps: (1) identifying the boundary of the network; (2) assessing meaningful and actionable relationships; (3) visualizing the network; (4) analyzing the network data; and (5) presenting the results of the analysis. Derived from previous studies [24,28], the process of the proposed two-mode network model is shown in Figure 4.
3.2.1. Step 1: Identifying the Nodes of Network
The aim of this step is to identify all the nodes, namely, the boundary of the network. For a two-mode network model, two lists of top and bottom nodes need to be developed. There are several approaches to facilitate this step, mainly in two categories: using the literature review and experience-based methods.
Data captured from the literature can define the scope of nodes according to related studies, surveys, and reports. Since different studies may focus on different areas and use different methods, the previous individual results may not be sufficient for the present study. A more comprehensive list of nodes can be obtained by combining the results of previous studies. The main advantage of this method is that it is an efficient way to identify possible existing factors. Furthermore, this method can provide reliable references for identified factors and analysis of the development trend. However, it can only summarize previous results, rather than explore or find undefined and new factors. Hence, it is necessary to identify new factors from current practice using the experience-based method.
The experience-based method is a suitable supplement to the literature review. Focus groups, semi-structured interviews, workshops, and surveys are common approaches of this method. Usually, experts involved in related subjects are invited to attend meetings to provide suggestions based on their experiences [6,24]. The disadvantage is that it is difficult to compile a complete list of nodes from several workshops with a limited number of experts, or owing to limitations with respect to the experts’ range of experience. However, when seeking new factors in theory-building, a grounded theory approach can be adopted [29]. Current good practices for use of this approach recommend that conducting interviews for new factors should proceed until no new factors emerge from successive interviews [30].
3.2.2. Step 2: Evaluating the Links of a Network
A network comprises of nodes and links, where the nodes are identified in Step 1 and the links are assessed in Step 2. Links in the network represent the relationships between nodes. These relationships can be defined in different ways, such as collaboration, information sharing potential, rigidity, and supportiveness in a network [21]. Prell, Hubacek and Reed [23] indicated that relationships involving communication, decision making, and influence are most frequently analyzed in practice. According to different types of relationships, the value of links can be defined using different meanings, for example, the tightness of collaboration, degree of influence, and power in decision making. The link value is high when the nodes have strong interactions with each other, and vice versa. This step can be developed in parallel with Step 1, using both the literature review and experience-based approaches. To minimize bias from dominant participants in the workshops, the Delphi method can be adopted to improve results. Ideally, all the stakeholders identified in Step 1 should be involved in this step to achieve a consensus, but in reality, only some of the key stakeholders are engaged because of practical difficulties [24]. A typical example of an evaluation matrix of a two-mode network model is shown in Table 2.
3.2.3. Step 3: Visualizing and Projecting
Based on the nodes and links identified in Steps 1 and 2, respectively, the matrix can be visualized to a network figure. In the present study, a two-mode network is proposed to represent the relationships between two sets of nodes, which is different from the conventional one-mode network. The two-mode network can be visualized by various SNA software packages, including UCINET, NetMiner, NetDraw, and Pajek [24]. Then, the two-mode network can be converted to one-mode by projection. According to the specific issue, both top and bottom projections can be applied individually or synthetically.
3.2.4. Step 4: Analyzing the Network
Based on the network after visualization and projection, quantitative analysis is adopted to mine information about the structure of the network, which is important for network analysis [31]. Yang [21] classified network analysis methods into network measures (e.g., density and cohesion) and individual measures (e.g., centrality and brokerage). The concept of centrality, developed by Freeman [32], is a prominent criterion for assessing the importance of nodes. Nodes need to be emphasized and assigned a high priority in the network, when they have a higher centrality value. Three kinds of centrality are widely used in network analysis, namely degree, betweenness, and eigenvector centrality [12,16,24,33]. Degree centrality is defined as the link that a node shares directly with other nodes. It is commonly used for assessing the structural importance of nodes because it focuses on the local structure in which a particular node is embedded [12]. Betweenness centrality is the number of times a node is on the path between two non-interlinked nodes, and is commonly used for assessing the power of nodes [32]. It refers to the argument that a node links with other nodes that were not directly linked previously [12]. Eigenvector centrality is a more sophisticated method proposed by Peter Gould [33]. While the other two methods hypothesize that all the nodes are equal, the eigenvector centrality considers nodes to have differing amounts of power. The more powerful neighbors contribute more to node centrality. All these methods have their respective advantages and disadvantages [23], so they are used as comparisons in this study.
In addition to the aforementioned network analysis methods, statistical methods are likewise important in quantitative analysis. Cluster analysis is used to categorize the nodes into several groups according to their similarities. Clusters in a classical one-mode network indicate similarity and aggregation among nodes through their own attributes. In contrast, correlation coefficients and clusters in a two-mode network indicate similarity and aggregation among nodes in one set through the relationship with nodes in another set. Therefore, the two-mode network model considers the two sets of nodes synthetically rather than independently. In the present study, stakeholders and CSFs are analyzed together using a two-mode network model to show the interrelationship between them. The clusters of nodes can help understand the underlying relationship between nodes and improve categorization and management in projects.
3.2.5. Step 5: Discussing Results and Providing Suggestions
The results of the network analysis in the previous steps are discussed and summarized in this step. Suggestions are provided on the basis of the findings, mainly about the stakeholder prioritization, relationship among stakeholders, stakeholders’ influence on success, and policies to improve stakeholder management.
4. An Illustrative Case Study: Experience from the Green Retrofit in China
To illustrate to the process of analyzing stakeholders’ influence with the proposed two-mode network model, green retrofit in China was selected as the case study. Green retrofit has attracted considerable attention in recent years [34,35]. In China, 95% of the existing buildings have both high energy consumption and high carbon emissions, and the Chinese government has made great efforts to promote green retrofit for such existing buildings [35]. The Chinese 12th Five-Year Plan stipulated that 400 million m2 residential buildings and 60 million m2 public buildings are planned to be retrofitted as pilot projects between 2011 and 2015 to improve building energy efficiency.
Although green retrofit in China has been developing quickly in recent years, it faces various difficulties and barriers. For example, stakeholders do not have initiatives to undertake green retrofit, the risks are very high during implementation, and the energy saving after retrofit does not reach the expected target [18,36]. Previous studies indicated stakeholders are a main impact factor on the success of green retrofit projects [37,38,39,40,41], however, few studies have focused on how the stakeholders influence the success of projects. Therefore, this study will apply the proposed model to build the relationship between stakeholders and CSFs, then analyze stakeholders’ influence on project success. The aforementioned processes are followed in a stepwise manner as follows.
4.1. Building the Network
The present study uses both literature review and experience-based methods to identify stakeholders and CSFs of green retrofit. First, the lists of stakeholders and CSFs were identified from the literature [7,38,39,40,41,42,43,44,45,46], and then a series of in-depth interviews were conducted to confirm, refine, and categorize these lists, shown in Table 3 and Table 4. In the case study, five semi-structured interviews were conducted with 16 experts, all with experience in green retrofit projects. To enhance the reliability of the results, these interviews were conducted from the North to the South of China, including Beijing, Shenzhen, Guangzhou, and Hong Kong. The interviews lasted from 30 min to two hours. The details of the interviews are shown in Table 5.
The interviews investigated the issues around CSFs in green retrofit projects, stakeholders’ relationships to project success, and the categorization of CSFs and stakeholders. Thirteen stakeholders were identified, which are coded from S1 to S13, shown in Table 4. Twenty-eight CSFs were identified in five categories (i.e., economics, building information and environment, sociocultural, technology, policy, and standard). CSFs were coded from CSF1 to CSF28, shown in Table 5. It should be noted that this study only focuses on green-related CSFs and stakeholders.
Based on the lists of stakeholders and CSFs identified in Step 1, the relationship between them was evaluated through a 13-by-28 matrix with 364 interactions assessed. The workshop was conducted in Beijing in 2014 and lasted three hours. First, the Delphi method was used to collect independent evaluations from the professionals, which took about an hour. Next, an open discussion was conducted to reach a consensus of their evaluation. The evaluation used a five-point Likert scale, where 4 is “Extremely strong influence”, 3 is “Strong influence”, 2 is “Influence”, 1 is “Very small influence”, and 0 is “No influence”. Through this workshop, an evaluation matrix of relationships between 28 CSFs and 13 stakeholders was developed.
Based on the nodes identified in Step 1 and the links evaluated in Step 2, the two-mode network of stakeholders and CSFs was established. In this stakeholder–CSF scenario, ▽ in the two-mode network refers to the group of stakeholders, △ refers to the group of CSFs, and E refers to the tightness of the relationship between stakeholders and CSFs. The stakeholder–CSF network is shown in Figure 5. The left nodes in blue color are stakeholders and the right nodes are CSFs, where the different shapes indicate different categories of CSFs. The links between stakeholders and CSFs show the relationship between them. Due to the high density of links, their values are not shown in the figure.
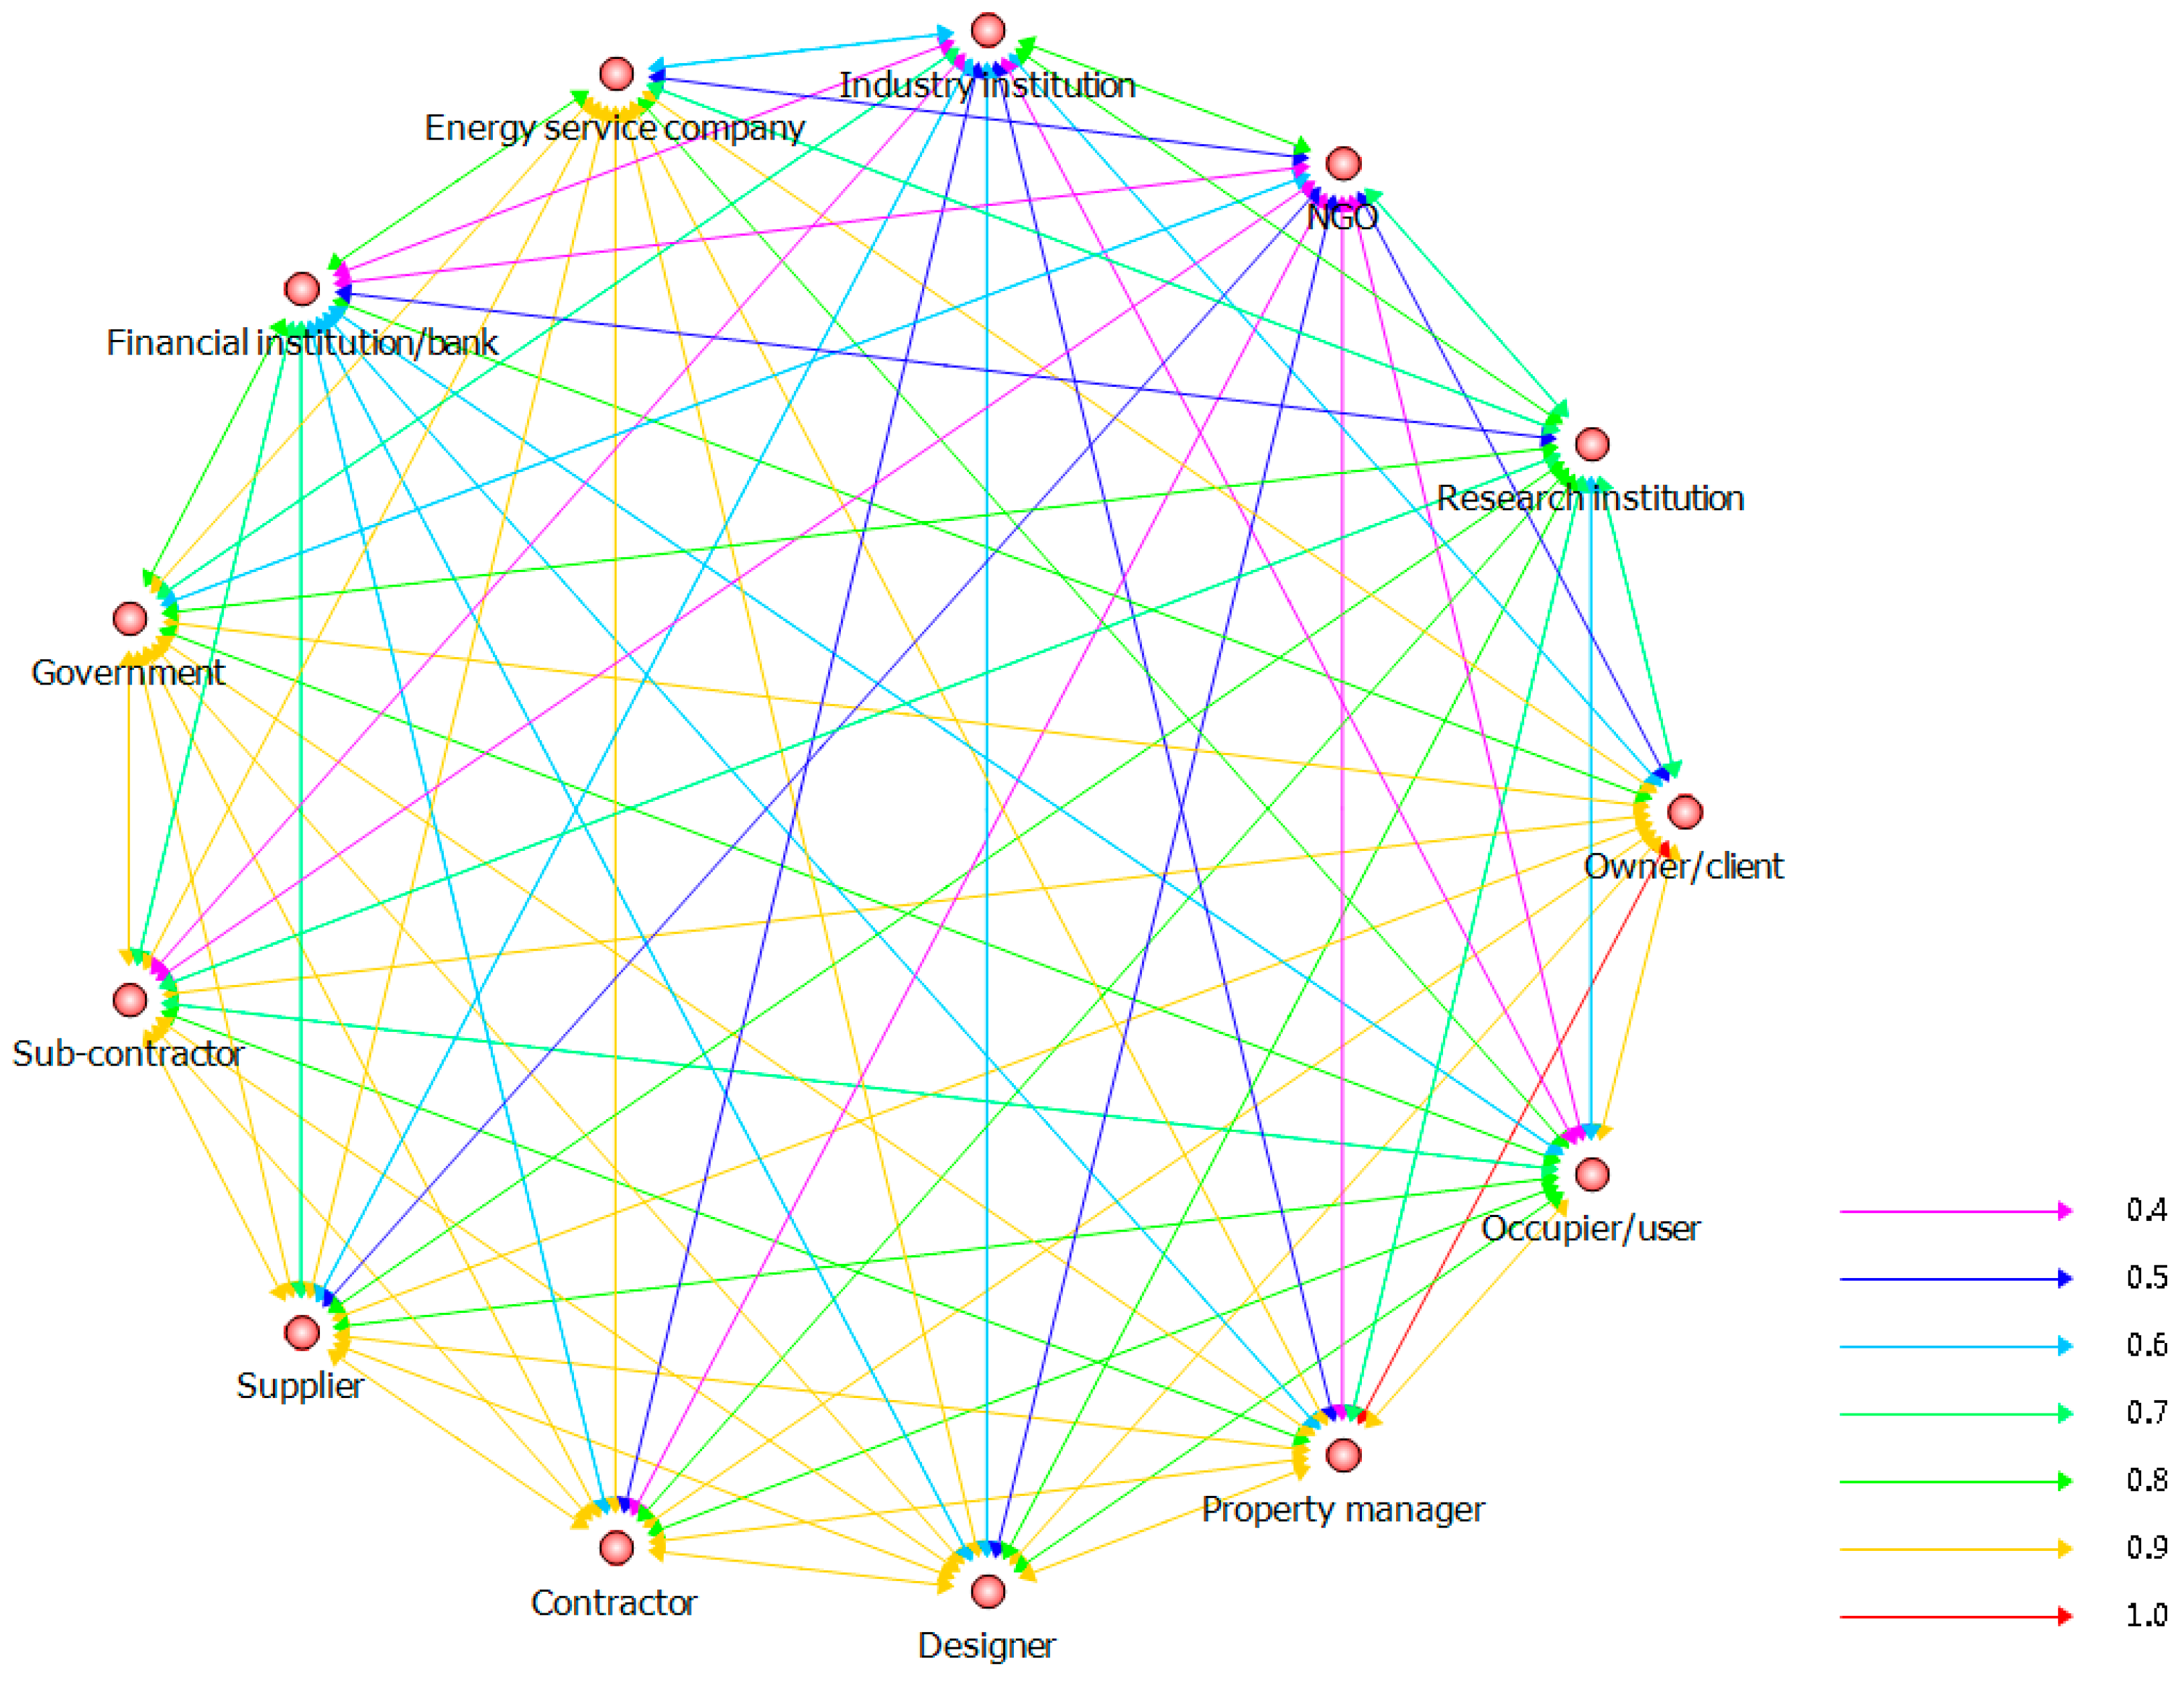
This study uses a top projection to convert the two-mode network to a one-mode network, that is, the network of stakeholders shown in Figure 6. In the top projected network, the nodes comprise thirteen stakeholders and the links show the relationships between them. A novel method of color-coding is used, which is different from the previous network analysis of stakeholders, such that the links in the projected network indicate the tightness of their relationship to the CSFs. The color ranges from red to violet to indicate the degree of relationship. The colors of the links that are nearer to red are higher in degree, which means the linked stakeholders have a tighter relationship and stronger influence on each other with respect to project success. Conversely, the colors nearer to blue/violet are low in degree, which means the linked stakeholders have a comparatively less tight relationship and weaker influence on each other.
The results in Table 6 indicate the similarity between stakeholders according to their relationship with the CSFs. The similarity degree is normalized to an interval from 0 to 1. That is to say, the larger the values, the more similar the stakeholders.
4.2. Analyzing the Network
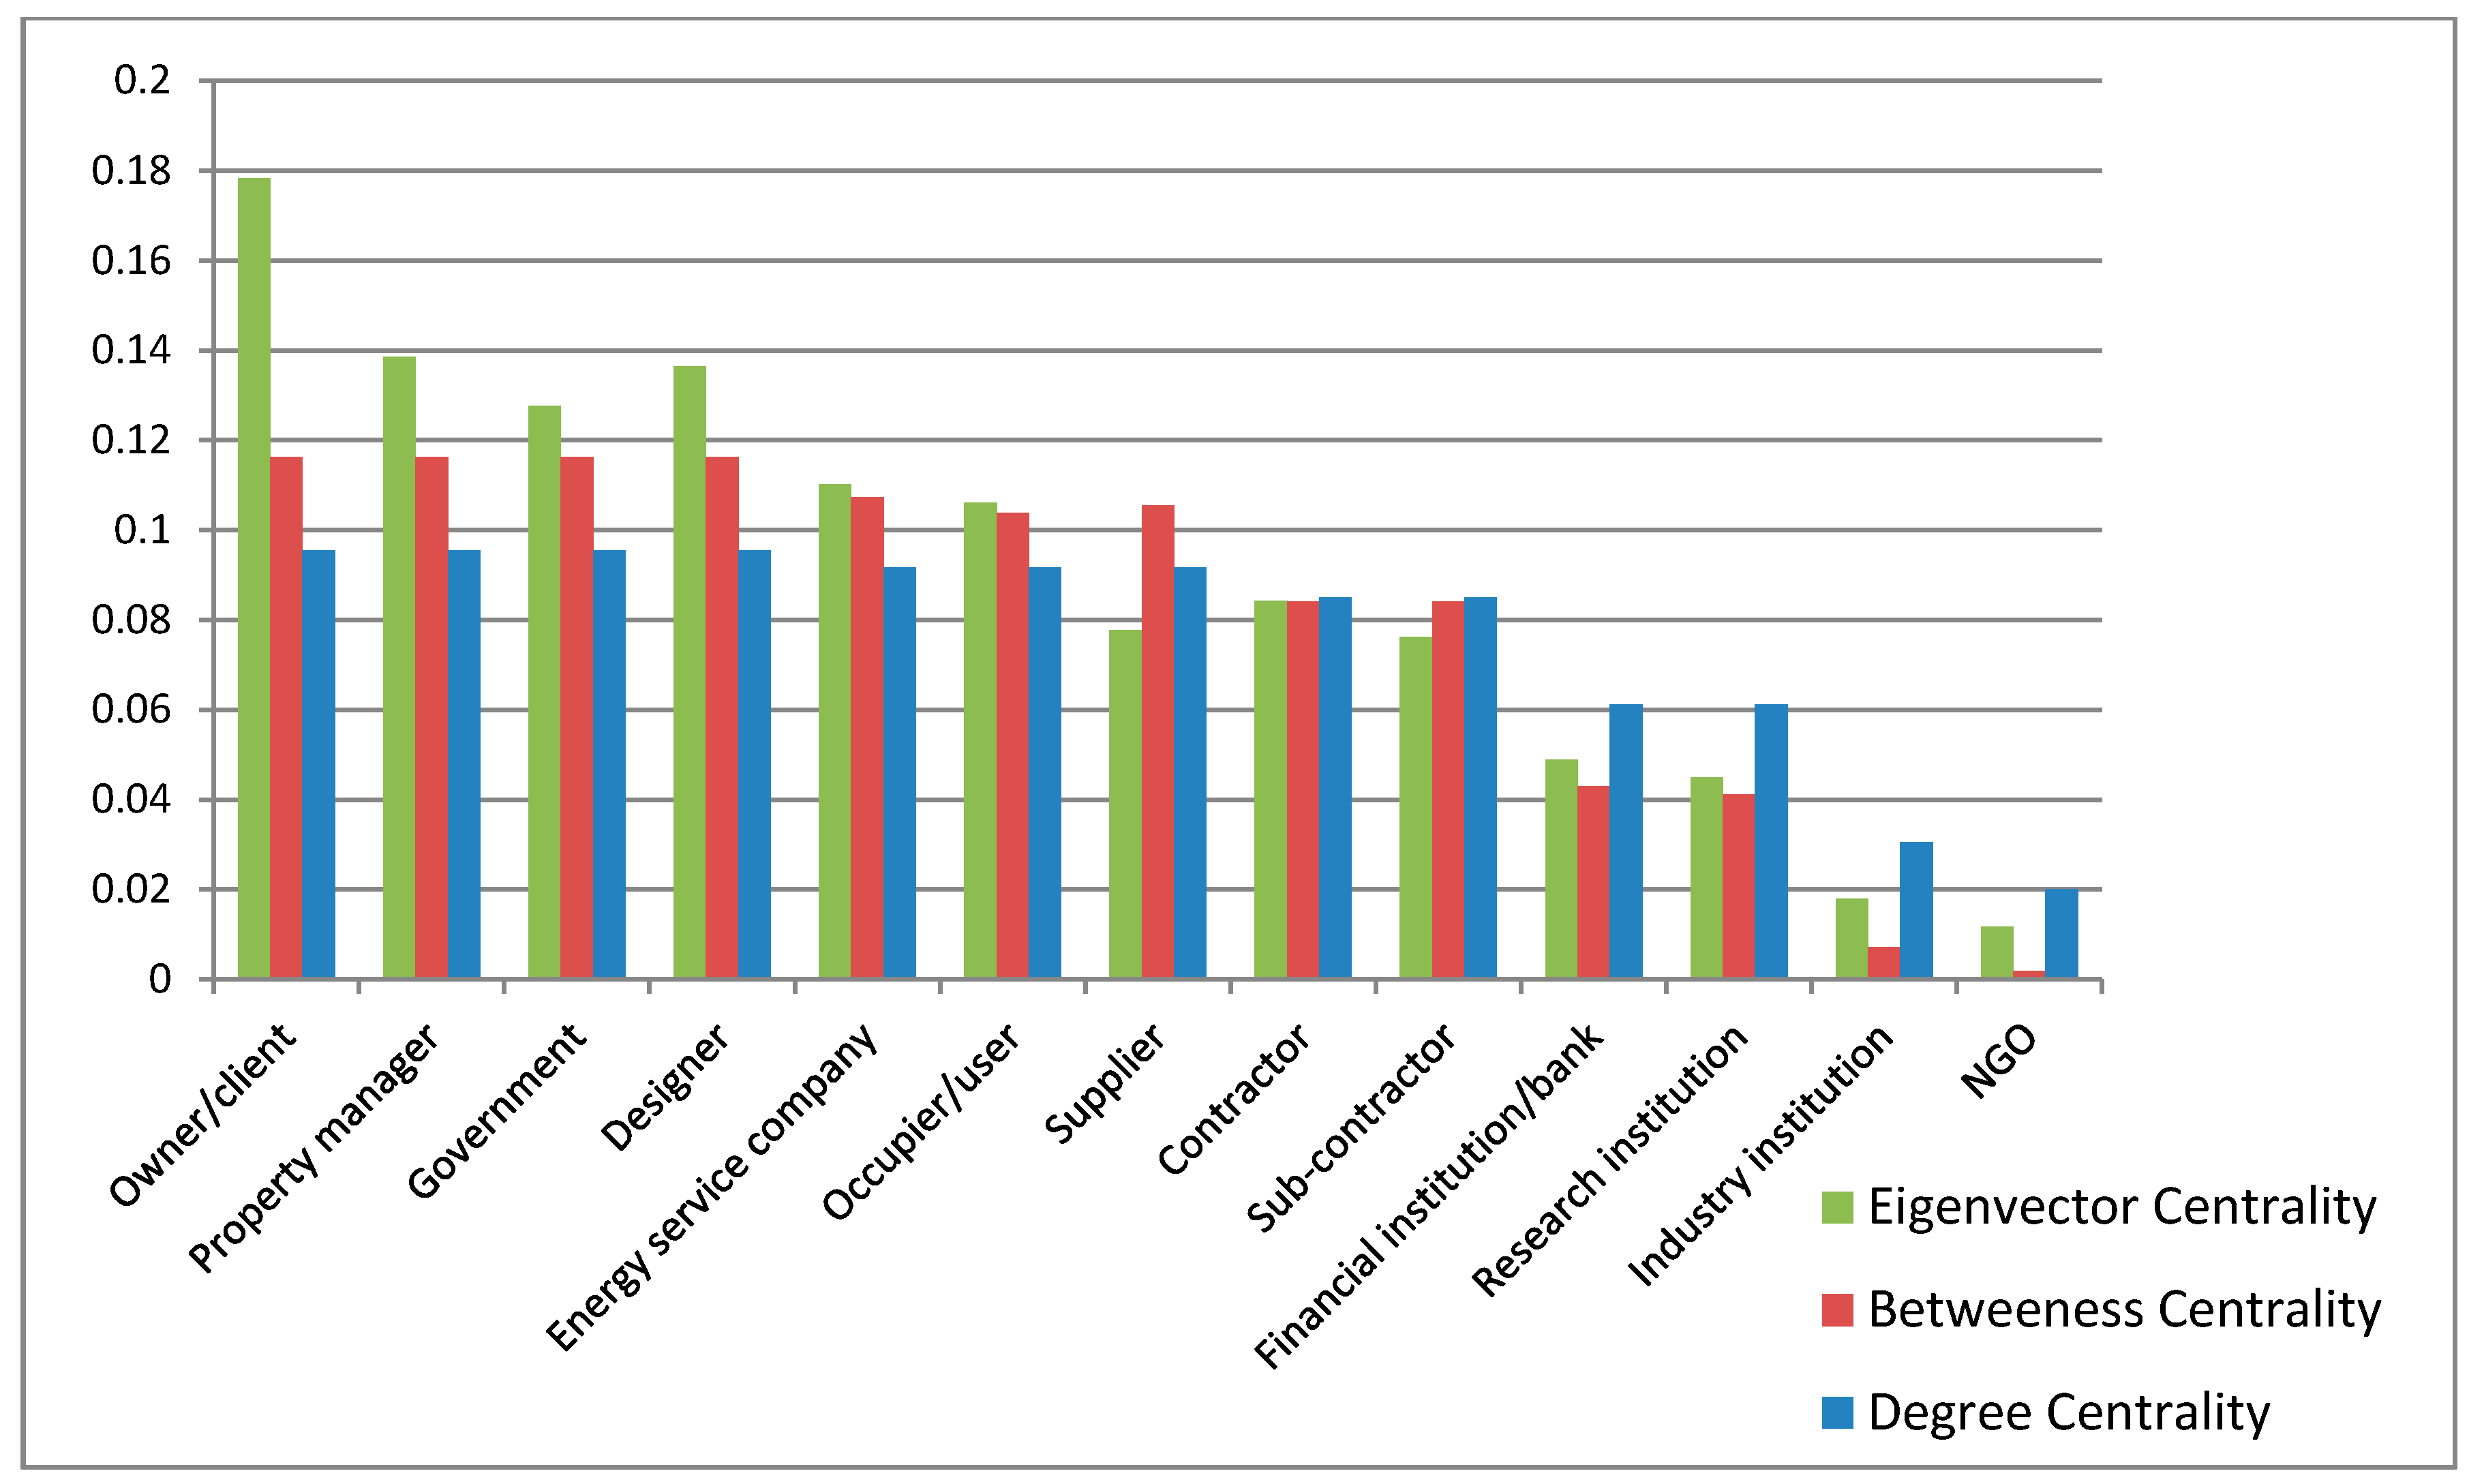
The prioritization of stakeholders can be represented by centrality, as discussed earlier. The three kinds of centralities, as previously defined, are applied to analyze the importance of CSFs. The priority rankings of stakeholders based on these three types of centrality are shown in Table 7 and Figure 7.
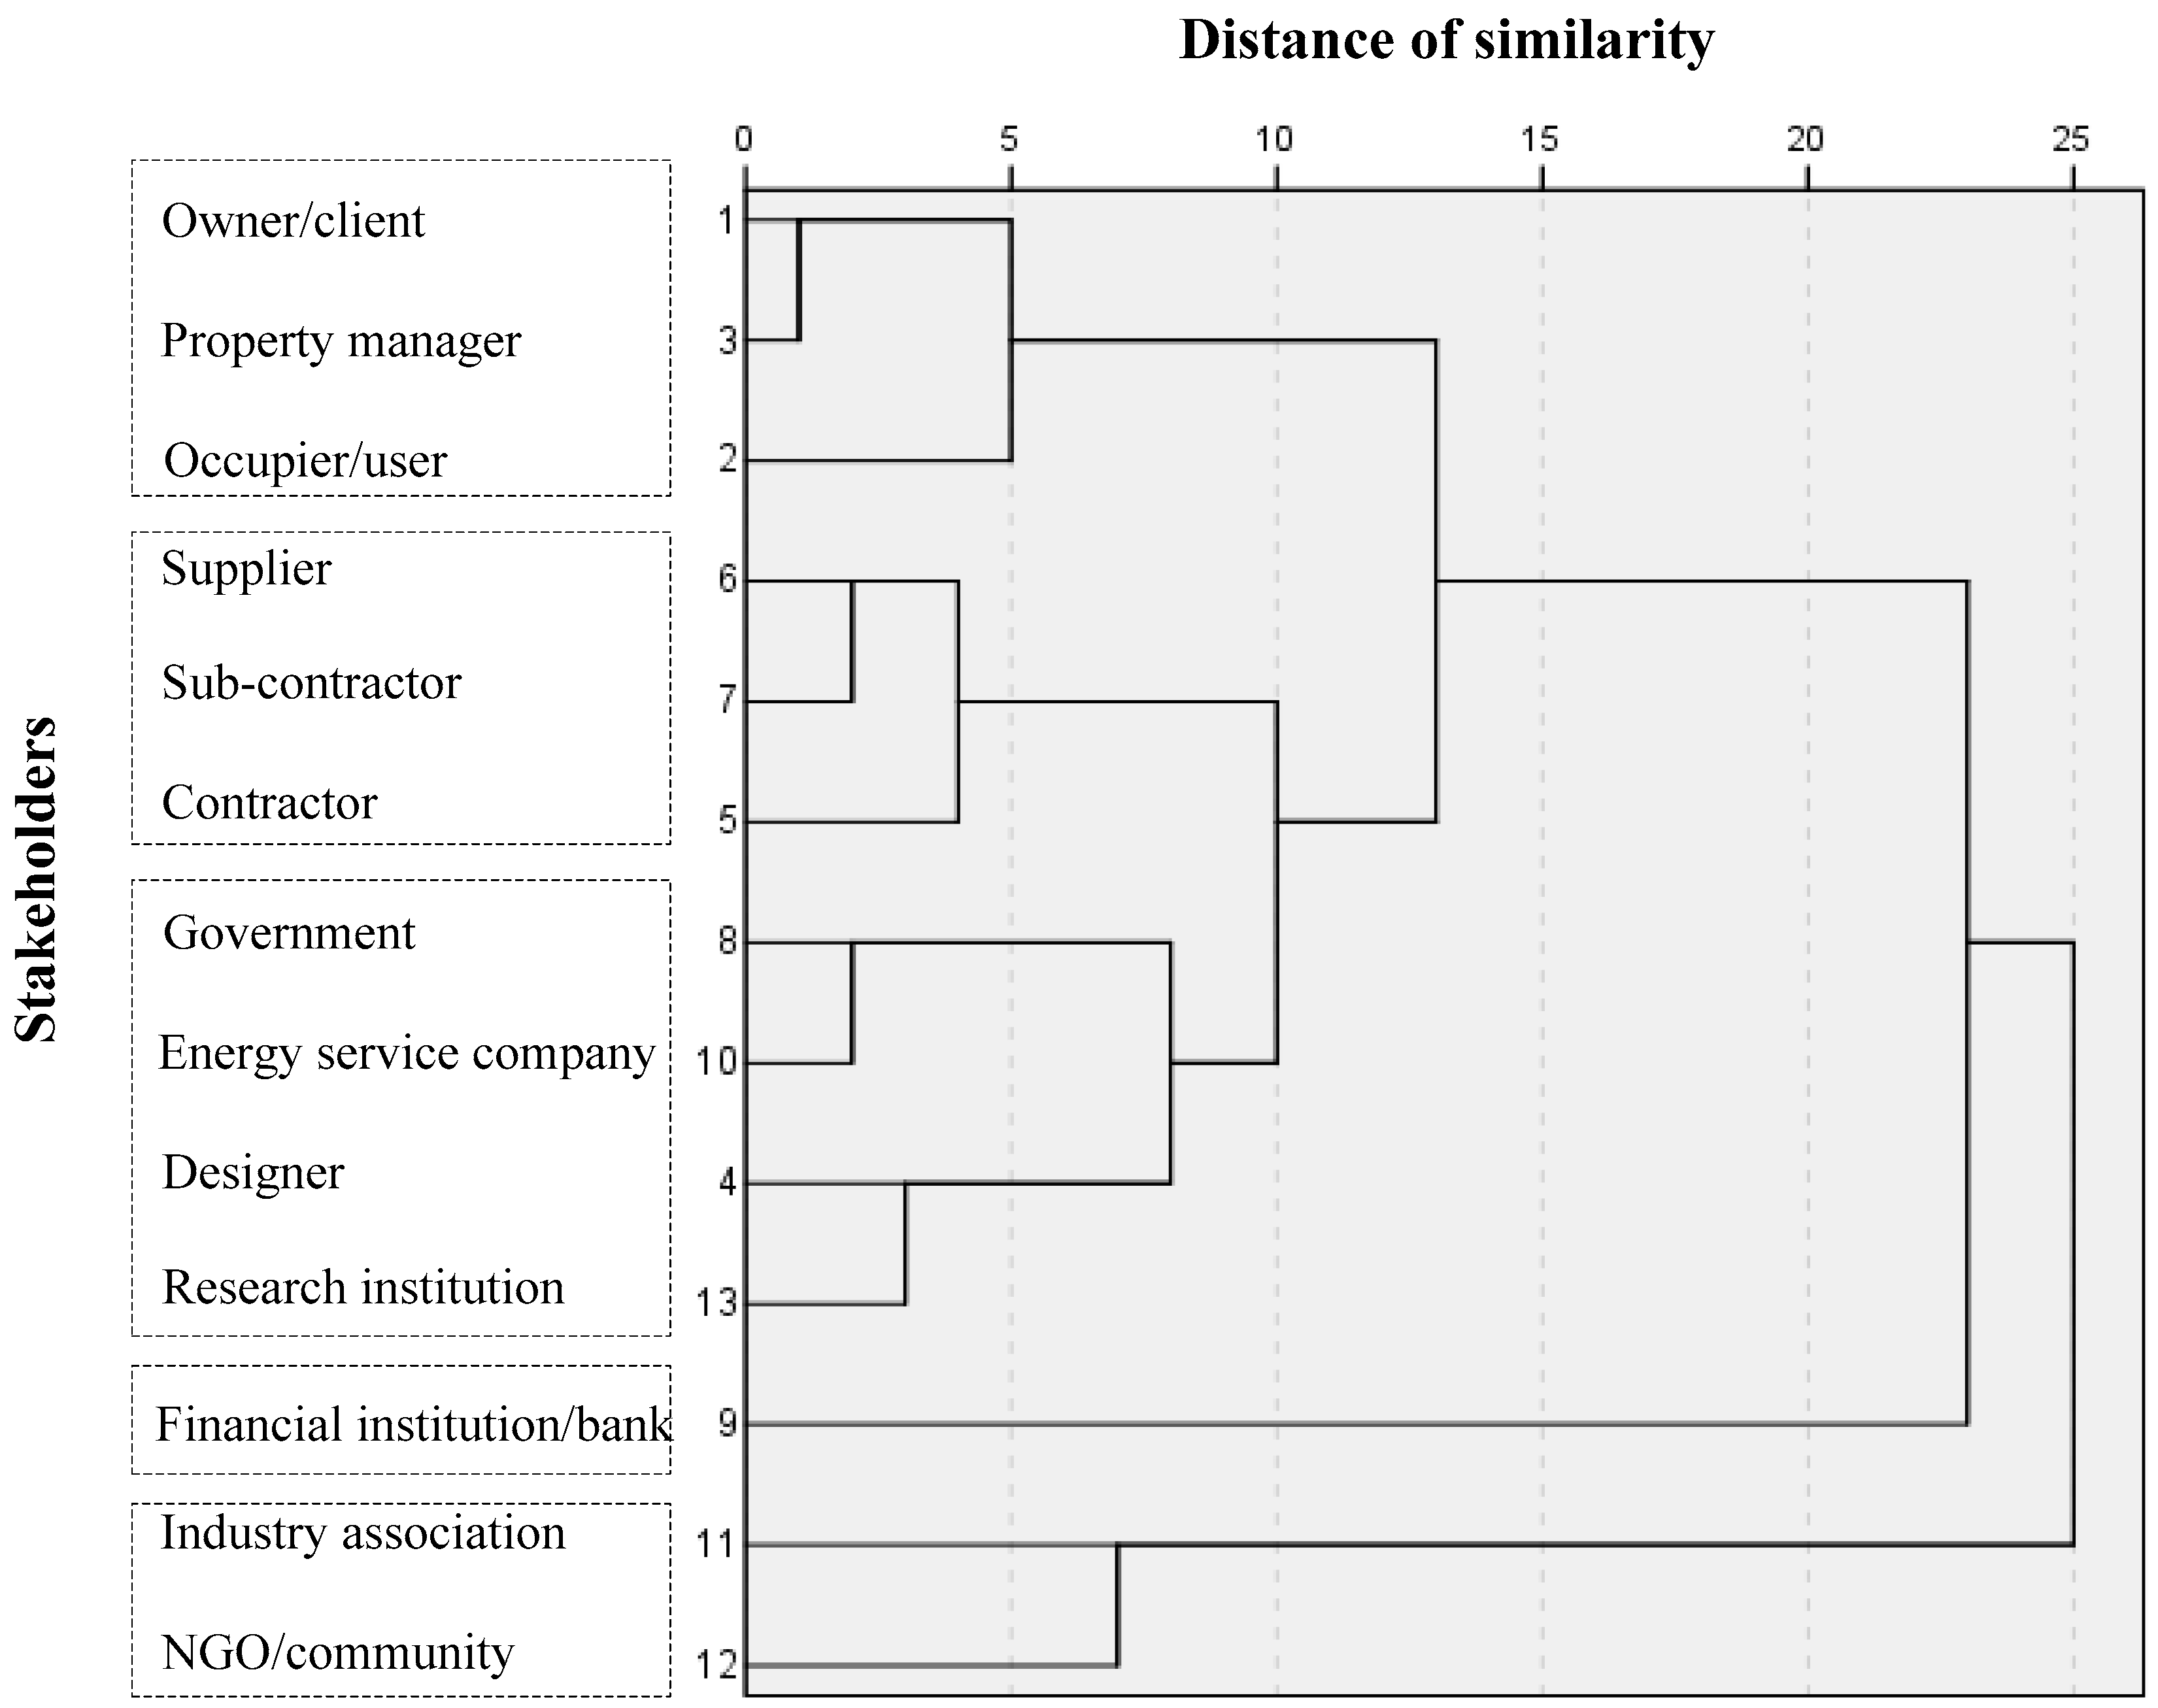
Cluster analysis is adopted to categorize stakeholders according to their similarity. The tree diagram developed by Ward’s method [60] is shown in Figure 8. The horizontal axis represents the distance of similarity, which indicates the similarity of stakeholders. The smaller the value of distance, the more similar the stakeholders. The vertical axis represents the stakeholders, which are rearranged according to cluster. Five clusters are highlighted in Figure 8, which are cluster one (owner/client, property manager, occupier/user), cluster two (supplier, contractor, sub-contractor), cluster three (government, energy service company, designer, research institution), cluster four (financial institution/ bank), and cluster five (industry association, NGO/community).
4.3. Discussion
The structure of the two-mode network shown in Figure 5 illustrates the interrelation between stakeholders and CSFs. The linked stakeholders and CSFs are related to each other and the value of the link represents the strength of influence. For example, the property manager is related to all the CSFs and has the strongest influence on “interruptions in operations”, since the score of the link between them is the highest. By contrast, NGO/community only links to six CSFs with a low value of “1”, which implies a very small influence on these six CSFs and no influence on the other CSFs. Therefore, in green retrofit projects, the structure of this two-mode network can help build an understanding of the influence strength of each stakeholder on every CSF. For stakeholder analysis, stakeholders can be compared to show the differences of their influence on different CSFs. From the CSF perspective, if there is an issue with a specific CSF, the most-related stakeholder that influences this CSF can be selected and be responsible for this issue, which improves the efficiency of project management.
Relationships between stakeholders, shown in Figure 6, indicate the closeness of their relationship with the success of projects. The value of links is normalized in [1, 0], where “1” represents the closest relationship and “0” represents no relationship. The higher the link value, the closer the two stakeholders’ relationship with the CSFs. For example, the value of the link between the owner/client and property manager is “1”, which implies that they have a similar influence on project success. However, owner/client (S1) has a significantly different influence on project success than NGO (S12), since the value of the link between them is only 0.5. Stakeholders in close relationships have similar issues, interests, barriers, risks, and influences on success. Therefore, this indicator can improve requirements analysis, risk assessment, and troubleshooting in project management.
The results of prioritization by degree and betweenness centrality methods are the same, and slightly different from the result from the eigenvector centrality method in numbers seven and eight. It indicates that the prioritization is unified and reliable since it is verified by different methods. Owner/client, property manager, designer, and government are the first four important stakeholders, who obtain the same score in the degree and betweenness centrality methods. Research institutions, industry associations, and NGO/community are the last three stakeholders, who were neither participants in the green retrofit projects, nor had a direct economic relationship. Specifically, the values of the last two stakeholders are significantly below that of the others, which indicates that they are in only a peripheral position within the stakeholder circle [21].
Stakeholder categorization is implemented by clustering methods, shown in Figure 8. According to the clustering analysis, stakeholders can be categorized into five clusters, shown in Table 8.
Cluster 1 involves owner/clients, property managers, and occupier/users, who are stakeholders of end-use. They have a direct interaction with the retrofitted building. An owner/client owns the building and gets benefit from it. Occupier/users living in the building are directly affected by the environment of the building. The property manager manages the operation of the building. All of them are most familiar with the building condition, and will be affected most strongly by retrofitting. Therefore, they are the core stakeholders in decision making, especially in deciding whether to retrofit at the beginning stage.
Cluster 2 involves contractors, sub-contractors, and suppliers, who are stakeholders in construction. They have direct relationships with the green retrofit projects but not with the retrofitted buildings. They play major roles in the construction phase and need close cooperation with each other.
Cluster 3 involves government, energy service companies, designers, and research institutions, who are stakeholders of consulting and service. They are not participants in construction, but provide technical support and solve some special issues.
Cluster 4 involves financial institutions/banks, who are the stakeholders in finance. Financial institutions mainly offer financial support to green retrofit projects.
Cluster 5 involves industry associations and the NGO/community, who are stakeholders for supervision. Although they do not have a direct relationship with green retrofit projects, they can supervise whether or not the projects follow industrial standards, environmental criteria, policies, and laws.
In cluster 1, there are three stakeholders, who are the owner, property manager, and occupier. Building owners (S1) are the most important stakeholders in green retrofit projects, which has been emphasized by numerous previous studies [38,61]. Building owners play an essential role in decision making, implementation, communication and collaboration [62]. Property managers (S3) are normally the agents of building owners. They have more professional knowledge and serve building owners. Namely, the property manager is representative of the owner’s interests. Therefore, the similarity degree between them is 0.9, which is very high. In the clustering analysis, they are also categorized in the same cluster. Therefore, in green retrofit projects, building owners and property managers should be managed together, for example in meeting, organization, and communication.
The important role played by owners in green retrofit can be naturally and easily understood, whereas the role of the occupiers (S2) is often underestimated [63]. Table 6 shows owners and occupiers are very similar (the similarity degree is 0.9), and they are categorized in the same cluster through clustering analysis. However, they are only number six in the priority rank. It reveals that the occupiers are underestimated in stakeholder analysis. In fact, a main difference between green retrofit and new green building projects is that the former occupiers are occupants in the existing buildings. As the direct users of the buildings, green retrofit may influence the occupants in their operation, health, income, and rent. Conversely, occupiers’ influence also makes the retrofit process more difficult and risky than projects of new buildings, as the cooperation and participation of occupiers are required in existing building retrofits [40,42]. In addition, the actions of the occupiers are identified as major determinants in the effectiveness of energy saving [64,65]. The occupiers can affect the energy consumption difference by up to 100% through different behaviors, such as ventilation habits, indoor temperature setting behavior, and after-hour lighting use [66]. Therefore, the occupiers are essential stakeholders in green retrofit projects, who should be paid more attention in green retrofit projects.
5. Conclusions
Understanding the influence of stakeholders on project success is essential in project management, particularly in projects with complex stakeholder relationships. However, previous studies focused mainly on stakeholder identification and prioritization, rather than on their influence on the success of projects. This study develops an original two-mode network model to analyze stakeholders’ influence on success. CSFs are introduced as intermediate variables between stakeholders and project success. The relationship between stakeholders and CSFs could be modeled using the two-mode network. Two-mode networks are beneficial for analyzing the relationships between two groups. In this study, the relationship between the stakeholders and CSFs was modeled using a two-mode network, through which the former’s influence on the latter is revealed, and the influence on success can be better understood in advance. The proposed model could be used in stakeholder management, risk analysis and critical factor control, which can improve project management in the following respects: (1) helping project managers focus on the stakeholders who influence project success more significantly; (2) facilitating resource assignment so that the limited resources can be allocated effectively and efficiently; (3) providing details of anticipated opportunities and problems for the PM at the early stages of projects so that teams have adequate time to manage them.
A case study on green retrofit in China was conducted to illustrate how the proposed two-mode network model works. Green retrofit projects are one of the most complex and risky types of projects, and hence, stakeholder analysis in a green retrofit project is important. First, stakeholders and CSFs were identified through a literature review and interviews with experts. Then the links between them were assessed using a workshop. Based on the results of the workshop, a stakeholder-CSF two-mode network was visualized to illustrate the relationship between these two groups. The two-mode network was projected to the one-mode network of stakeholders, where the closeness of stakeholders is shown in the value of the links. Prioritization was ranked using three centrality methods, and the result indicates the four most important stakeholders are owners/clients, property managers, designers, and government. Five clusters, which involve similar stakeholders, were developed. The results indicate that for retrofit projects a key stakeholder—the occupier—is surprisingly underestimated in prioritization and should receive greater focus in future research and projects. The results of this two-mode network analysis can help in the understanding of the characteristics of stakeholders and how they influence project success. When there is a problem in a project, the most related stakeholders can be quickly identified and controlled through prioritization and clustering methods. Then, the related stakeholders can be efficiently gathered to address the problem. Therefore, based on the proposed model, stakeholder management can be improved to become more effective, efficient, and accurate.
The study has two research limitations. First, the interviewees were all internal stakeholders involved in previous energy efficiency retrofit projects. External stakeholders, such as the media, were excluded. Second, since China only began to promote green retrofit in recent years, the number of experienced experts is limited. The aim of the case study is to illustrate how the proposed model is applied. In further studies, more case studies should be conducted and more stakeholders should be involved to obtain more concrete findings.
The proposed research method and analytical model can also be applied to other research areas. Aside from green retrofit projects, other projects or organizations with complex stakeholder relationships, such as mega projects and infrastructure construction projects, can be studied using the proposed model. In addition, the proposed model can also be applied to analyze the relationships between stakeholders and other factors, including stakeholder influence on delay, risk, and the quality of projects.
Acknowledgements
This study is sponsored by the Shanghai Pujiang Program 17PJC061 and the Fundamental Research Funds for the Central Universities 17JCYA08.
Author Contributions
Xin Liang conceived and designed the research framework and wrote the paper; Tao Yu analyzed the data; Li Guo contributed to the interviews.
Conflicts of Interest
The authors declare no conflict of interest.
References
- McElroy, B.; Mills, C. Managing stakeholders. In Gower Handbook of Project Management; Turner, R.J., Simister, S.J., Eds.; Gower: Aldershot, UK, 2000. [Google Scholar]
- Freeman, R.E. Strategic Management: A Stakeholder Approach; Cambridge University Press: Cambridge, UK, 1984. [Google Scholar]
- Jepsen, A.L.; Eskerod, P. Stakeholder analysis in projects: Challenges in using current guidelines in the real world. Int. J. Proj. Manag. 2009, 27, 335–343. [Google Scholar] [CrossRef]
- Borgatti, S.P.; Everett, M.G. Network analysis of two mode data. Soc. Netw. 1997, 19, 243–269. [Google Scholar] [CrossRef]
- Everett, M.G.; Borgatti, S.P. The dual-projection approach for two-mode networks. Soc. Netw. 2013, 35, 204–210. [Google Scholar] [CrossRef]
- Zou, W.W.; Kumaraswamy, M.; Chung, J.; Wong, J. Identifying the critical success factors for relationship management in ppp projects. Int. J. Proj. Manag. 2014, 32, 265–274. [Google Scholar] [CrossRef] [Green Version]
- Xu, P.P.; Chan, E.H.W.; Qian, Q.K. Success factors of energy performance contracting (EPC) for sustainable building energy efficiency retrofit (beer) of hotel buildings in China. Energy Policy 2011, 39, 7389–7398. [Google Scholar] [CrossRef]
- Yang, J.; Shen, G.Q.; Drew, D.S.; Ho, M.F. Critical success factors for stakeholder management: Construction practitioners’ perspectives. J. Constr. Eng. Manag. 2010, 136, 778–786. [Google Scholar] [CrossRef]
- Latapy, M.; Magnien, C.; Vecchio, N.D. Basic notions for the analysis of large two-mode networks. Soc. Netw. 2008, 30, 31–48. [Google Scholar] [CrossRef]
- Caniato, M.; Vaccari, M.; Visvanathan, C.; Zurbrugg, C. Using social network and stakeholder analysis to help evaluate infectious waste management: A step towards a holistic assessment. Waste Manag. 2014, 34, 938–951. [Google Scholar] [CrossRef] [PubMed]
- Aral, S.; Walker, D. Tie strength, embeddedness, and social influence: A large-scale networked experiment. Manag. Sci. 2014, 60, 1352–1370. [Google Scholar] [CrossRef]
- Lienert, J.; Schnetzer, F.; Ingold, K. Stakeholder analysis combined with social network analysis provides fine-grained insights into water infrastructure planning processes. J. Environ. Manag. 2013, 125, 134–148. [Google Scholar] [CrossRef] [PubMed]
- Bourne, L.; Walker, D.H.T. Visualizing stakeholder influence—Two australian examples. Proj. Manag. J. 2006, 37, 5–21. [Google Scholar]
- Rowley, T.J. Moving beyond dyadic ties: A network theory of stakeholder influences. Acad. Manag. Rev. 1997, 22, 887–910. [Google Scholar]
- Newman, M.E.J. Scientific collaboration networks. I. Network construction and fundamental results. Phys. Rev. E 2001, 64, 016131. [Google Scholar] [CrossRef] [PubMed]
- Neal, Z. Structural determinism in the interlocking world city network. Geogr. Anal. 2012, 44, 162–170. [Google Scholar] [CrossRef]
- Newman, M.E.J. Scientific collaboration networks. II. Shortest paths, weighted networks, and centrality. Phys. Rev. E 2001, 64, 016132. [Google Scholar] [CrossRef] [PubMed]
- Liang, X.; Peng, Y.; Shen, G.Q. A game theory based analysis of decision making for green retrofit under different occupancy types. J. Clean. Prod. 2016, 137, 1300–1312. [Google Scholar] [CrossRef]
- Davies, P.; Osmani, M. Low carbon housing refurbishment challenges and incentives: Architects’ perspectives. Build. Environ. 2011, 46, 1691–1698. [Google Scholar] [CrossRef]
- Mitchell, J.C. The Concept and Use of Social Networks; Bobbs-Merrill: Indianapolis, IN, USA, 1969. [Google Scholar]
- Yang, R.J. An investigation of stakeholder analysis in urban development projects: Empirical or rationalistic perspectives. Int. J. Proj. Manag. 2014, 32, 838–849. [Google Scholar] [CrossRef]
- Kelly, R.A.; Jakeman, A.J.; Barreteau, O.; Borsuk, M.E.; ElSawah, S.; Hamilton, S.H.; Henriksen, H.J.; Kuikka, S.; Maier, H.R.; Rizzoli, A.E.; et al. Selecting among five common modelling approaches for integrated environmental assessment and management. Environ. Model. Softw. 2013, 47, 159–181. [Google Scholar] [CrossRef]
- Prell, C.; Hubacek, K.; Reed, M. Stakeholder analysis and social network analysis in natural resource management. Soc. Nat. Resour. 2009, 22, 501–518. [Google Scholar] [CrossRef]
- Yang, R.J.; Zou, P.X.W. Stakeholder-associated risks and their interactions in complex green building projects: A social network model. Build. Environ. 2014, 73, 208–222. [Google Scholar] [CrossRef]
- Robins, G.; Alexander, M. Small worlds among interlocking directors: Network structure and distance in bipartite graphs. Comput. Math. Organ. Theory 2004, 10, 69–94. [Google Scholar] [CrossRef]
- Kim, S.C.; Jeong, Y.S.; Park, S.O. Rfid-based indoor location tracking to ensure the safety of the elderly in smart home environments. Pers. Ubiquitous Comput. 2013, 17, 1699–1707. [Google Scholar] [CrossRef]
- Borgatti, S.P.; Halgin, D.S. Analyzing Affiliation Networks; SAGE: New York, NY, USA, 2014; Available online: http://0-dx-doi-org.brum.beds.ac.uk/10.4135/9781446294413.n28 (accessed on 6 June 2014).
- Timur, S.; Getz, D. A network perspective on managing stakeholders for sustainable urban tourism. Int. J. Contemp. Hosp. Manag. 2008, 20, 445–461. [Google Scholar] [CrossRef]
- Glaser, B. Basics of Grounded Theory Analysis; Sociology Press: Mill Valley, CA, USA, 1992. [Google Scholar]
- Glaser, B.G.; Strauss, A.L.; Strutzel, E. The discovery of grounded theory; strategies for qualitative research. Nurs. Res. 1968, 17, 364. [Google Scholar] [CrossRef]
- Cross, R.L.; Parker, A. The Hidden Power of Social Networks: Understanding How Work Really Gets Done in Organizations; Harvard Business Press: Brighton, MA, USA, 2004. [Google Scholar]
- Freeman, L.C. Centrality in social networks conceptual clarification. Soc. Netw. 1979, 1, 215–239. [Google Scholar] [CrossRef]
- Gould, P.R. On the geographical interpretation of eigenvalues. Trans. Inst. Br. Geogr. 1967, 53–86. [Google Scholar] [CrossRef]
- Sun, J.; Liu, C. Obstacle identification and solution on energy efficient retrofit for exising buildings. Low Temp. Archit. Technol. 2007, 5, 130–131. [Google Scholar]
- Xu, P.; Chan, E.H.W. Anp model for sustainable building energy efficiency retrofit (beer) using energy performance contracting (EPC) for hotel buildings in China. Habitat Int. 2013, 37, 104–112. [Google Scholar] [CrossRef]
- Menassa, C.C. Evaluating sustainable retrofits in existing buildings under uncertainty. Energy Build. 2011, 43, 3576–3583. [Google Scholar] [CrossRef]
- Menassa, C.C.; Baer, B. A framework to assess the role of stakeholders in sustainable building retrofit decisions. Sustain. Cities Soc. 2014, 10, 207–221. [Google Scholar] [CrossRef]
- Ali, A.S.; Rahmat, I.; Hassan, H. Involvement of key design participants in refurbishment design process. Facilities 2008, 26, 389–400. [Google Scholar]
- Zavadskas, E.K.; Kaklauskas, A.; Gulbinas, A. Multiple Criteria Decision Support Web-Based System for Building Refurbishment. J. Civ. Eng. Manag. 2004, 10, 77–85. [Google Scholar] [CrossRef]
- Juan, Y.K.; Kim, J.H.; Roper, K.; Castro-Lacouture, D. Ga-based decision support system for housing condition assessment and refurbishment strategies. Autom. Constr. 2009, 18, 394–401. [Google Scholar] [CrossRef]
- Banaitiene, N.; Banaitis, A.; Kaklauskas, A.; Zavadskas, E.K. Evaluating the life cycle of a building: A multivariant and multiple criteria approach. Omega-Int. J. Manag. Sci. 2008, 36, 429–441. [Google Scholar] [CrossRef]
- Miller, E.; Buys, L. Retrofitting commercial office buildings for sustainability: Tenants’ perspectives. J. Prop. Invest. Financ. 2008, 26, 552–561. [Google Scholar] [CrossRef] [Green Version]
- Kaklauskas, A.; Zavadskas, E.K.; Galiniene, B. A building’s refurbishment knowledge-based decision support system. Int. J. Environ. Pollut. 2008, 35, 237–249. [Google Scholar] [CrossRef]
- Gultekin, P.; Anumba, C.J.; Leicht, R.M. A Cross-Case Analysis of Decision Making Environments for Deep Retrofit Projects; ASCE: Reston, VA, USA, 2013; pp. 250–258. Available online: https://0-doi-org.brum.beds.ac.uk/10.1061/9780784413029.032 (accessed on 5 June 2015).
- Cronin, J.J., Jr.; Smith, J.S.; Gleim, M.R.; Ramirez, E.; Martinez, J.D. Green marketing strategies: An examination of stakeholders and the opportunities they present. J. Acad. Mark. Sci. 2011, 39, 158–174. [Google Scholar] [CrossRef]
- Rosenfeld, Y.; Shohet, I.M. Decision support model for semi-automated selection of renovation alternatives. Autom. Constr. 1999, 8, 503–510. [Google Scholar] [CrossRef]
- Chidiac, S.E.; Catania, E.J.C.; Morofsky, E.; Foo, S. A screening methodology for implementing cost effective energy retrofit measures in canadian office buildings. Energy Build. 2011, 43, 614–620. [Google Scholar] [CrossRef]
- Fuerst, F.; McAllister, P. Green noise or green value? Measuring the effects of environmental certification on office values. Real Estate Econ. 2011, 39, 45–69. [Google Scholar] [CrossRef]
- Kasivisvanathan, H.; Ng, R.T.L.; Tay, D.H.S.; Ng, D.K.S. Fuzzy optimisation for retrofitting a palm oil mill into a sustainable palm oil-based integrated biorefinery. Chem. Eng. J. 2012, 200, 694–709. [Google Scholar] [CrossRef]
- Ma, Z.J.; Cooper, P.; Daly, D.; Ledo, L. Existing building retrofits: Methodology and state-of-the-art. Energy Build. 2012, 55, 889–902. [Google Scholar] [CrossRef]
- Rhoads, J. Low Carbon Retrofit Toolkit—A Roadmap to Success; Better Buildings Partnership: London, UK, 2010; Available online: https://www.google.com.hk/url?sa=t&rct=j&q=&esrc=s&source=web&cd=3&cad=rja&uact=8&ved=0ahUKEwjig7v9tIbXAhUKEbwKHbxfARUQFggyMAI&url=http%3a%2f%2fwww%2ecarbonaction2050%2ecom%2fsites%2fcarbonaction2050%2ecom%2ffiles%2fdocument-attachment%2fBetter%2520Buildings%2520Partnership%2520Retrofit%2520Toolkit%2epdf&usg=AOvVaw2lMT8BGmeIJ1isJUecdp12 (accessed on 20 April 2014).
- Thomas, L.E. Evaluating design strategies, performance and occupant satisfaction: A low carbon office refurbishment. Build. Res. Inf. 2010, 38, 610–624. [Google Scholar] [CrossRef]
- Mickaityte, A.; Zavadskas, E.K.; Kaklauskas, A.; Tupenaite, L. The concept model of sustainable buildings refurbishment. Int. J. Strateg. Prop. Manag. 2008, 12, 53–68. [Google Scholar] [CrossRef]
- Andrews, C.J.; Yi, D.; Krogmann, U.; Senick, J.A.; Wener, R.E. Designing buildings for real occupants: An agent-based approach. IEEE Trans. Syst. Man Cybern. Part A Syst. Hum. 2011, 41, 1077–1091. [Google Scholar] [CrossRef]
- Volk, R.; Stengel, J.; Schultmann, F. Building information modeling (bim) for existing buildings—Literature review and future needs. Autom. Constr. 2014, 38, 109–127. [Google Scholar] [CrossRef]
- Trust, C. Low Carbon Refurbishment of Buildings—A Guide to Achieving Carbon Savings from Refurbishment of Non-Domestic Buildings; The Carbon Trust: London, UK, 2008; Available online: https://www.google.com.hk/url?sa=t&rct=j&q=&esrc=s&source=web&cd=1&cad=rja&uact=8&ved=0ahUKEwjGgNuNtIbXAhUKW7wKHTM4CWkQFgglMAA&url=https%3a%2f%2fwww%2ecarbontrust%2ecom%2fmedia%2f81389%2fctv038-low-carbon-refurbishment-of-buildings-management-guide%2epdf&usg=AOvVaw1rgXDK7I4fFEyEoKkOJ0y5 (accessed on 3 May 2014).
- Caccavelli, D.; Gugerli, H. Tobus—A european diagnosis and decision-making tool for office building upgrading. Energy Build. 2002, 34, 113–119. [Google Scholar] [CrossRef]
- Lapinski, A.R.; Horman, M.J.; Riley, D.R. Lean processes for sustainable project delivery. J. Constr. Eng. Manag. ASCE 2006, 132, 1083–1091. [Google Scholar] [CrossRef]
- Korkmaz, S.; Messner, J.I.; Riley, D.R.; Magent, C. High-performance green building design process modeling and integrated use of visualization tools. J. Archit. Eng. 2010, 16, 37–45. [Google Scholar] [CrossRef]
- Mojena, R. Hierarchical grouping methods and stopping rules: An evaluation. Comput. J. 1977, 20, 359–363. [Google Scholar] [CrossRef]
- Stiess, I.; Dunkelberg, E. Objectives, barriers and occasions for energy efficient refurbishment by private homeowners. J. Clean. Prod. 2013, 48, 250–259. [Google Scholar] [CrossRef]
- Liang, X.; Shen, G.Q.; Guo, L. Improving management of green retrofits from a stakeholder perspective: A case study in China. Int. J. Environ. Res. Public Health 2015, 12, 13823–13842. [Google Scholar] [CrossRef] [PubMed]
- Karvonen, A. Towards systemic domestic retrofit: A social practices approach. Build. Res. Inf. 2013, 41, 563–574. [Google Scholar] [CrossRef]
- Azar, E.; Menassa, C.C. A comprehensive analysis of the impact of occupancy parameters in energy simulation of office buildings. Energy Build. 2012, 55, 841–853. [Google Scholar] [CrossRef]
- Azar, E.; Menassa, C.C. A comprehensive framework to quantify energy savings potential from improved operations of commercial building stocks. Energy Policy 2014, 67, 459–472. [Google Scholar] [CrossRef]
- Ürge-Vorsatz, D.; Novikova, A.; Köppel, S.; Boza-Kiss, B. Bottom–up assessment of potentials and costs of co2 emission mitigation in the buildings sector: Insights into the missing elements. Energy Effic. 2009, 2, 293–316. [Google Scholar] [CrossRef]
Figure 1.
Theoretical hierarchy of stakeholder influence on the success of projects.

Figure 2.
Example of one-mode versus two-mode networks.

Figure 3.
Example of projection for two-mode network analysis.

Figure 4.
Process of the proposed two-mode network model.

Figure 5.
Two-mode network of CSF–stakeholders for green retrofit.

Figure 6.
Projection of the relationships among stakeholders related to the CSFs.

Figure 7.
Comparison of prioritization based on different types of centrality.

Figure 8.
Tree diagram of cluster analysis for stakeholders.


Table 1.
Categories of methods for two-mode networks.
| Methods for Two-Mode Network | Advantages | Disadvantages | |
|---|---|---|---|
| Direct method | Some specific methods (e.g., bipartite statistics ) | (1) Directly handle two-mode network; (2) No information loss. | (1) Lack of rigor and generality; (2) Difficult to evaluate the results. |
| Conversion methods | Projection | (1) Can use methods for one-mode network; (2) Easy to evaluate and compare the results. | (1) May lose information of the bipartite structure. |
Table 2.
An example of a matrix in “two-mode to one-mode projection”.
| C1 | C2 | C3 | C4 | C5 | |
|---|---|---|---|---|---|
| S1 | 1 | 1 | 1 | 0 | 0 |
| S2 | 0 | 1 | 1 | 1 | 0 |
| S3 | 0 | 0 | 1 | 0 | 1 |
Table 3.
The main stakeholders of green retrofit projects.
| Code | Stakeholder | [39] | [40] | [42] | [43] | [41] | [44] | [38] | [7] | [45] | [46] |
|---|---|---|---|---|---|---|---|---|---|---|---|
| S1 | Owner/client | √ | √ | √ | √ | √ | |||||
| S2 | Occupier/user | √ | √ | √ | |||||||
| S3 | Property manager | √ | √ | √ | |||||||
| S4 | Designer | √ | √ | √ | √ | ||||||
| S5 | Contractor | √ | √ | √ | √ | ||||||
| S6 | Supplier | √ | √ | ||||||||
| S7 | Sub-contractor | √ | |||||||||
| S8 | Government | √ | √ | ||||||||
| S9 | Financial institution/bank | √ | √ | √ | |||||||
| S10 | Energy service company | √ | √ | ||||||||
| S11 | Industry association | √ | |||||||||
| S12 | NGO/community | √ | √ | ||||||||
| S13 | Research institution | √ | √ |
Table 4.
The CSFs of green retrofit projects.
| Category | Code | CSF | Literature |
|---|---|---|---|
| Economics | C1 | Cost | [39,44,47] |
| C2 | Who invests | [37,48] | |
| C3 | Profit distribution among stakeholders | [19] | |
| C4 | Interruptions in operations | [42,49] | |
| C5 | Interest rate | [39] | |
| C6 | Occupancy type | [50,51] | |
| C7 | Who gets energy saving benefits | [48] | |
| C8 | Subsidies/tax reduction | [19,39,50] | |
| C9 | Rent increases after retrofit | [48,52] | |
| Building information and environment | C10 | Existing building environment | [50,53] |
| C11 | Existing building condition | [7,37,38,53] | |
| C12 | Existing facilities condition | [37,53,54] | |
| C13 | Existing building information modeling (BIM) | [54,55] | |
| C14 | Existing building evaluation | [53] | |
| Sociocultural | C15 | Clear vision | [56] |
| C16 | Cooperation among stakeholders | [44,56] | |
| C17 | Information sharing | [50,53] | |
| C18 | Users’ behavior and demand analysis | [50,57] | |
| C19 | Project organization and management | [44] | |
| C20 | Experience sharing and education | [19,49,51] | |
| C21 | Cultural traditions | [53] | |
| Technology | C22 | Maturity of technology | [50,53] |
| C23 | Complexity of technology | [19] | |
| C24 | Maintainability | [57] | |
| C25 | Information technologies and computerization level | [53] | |
| C26 | Collaborative design and automation | [38,58,59] | |
| Policy and standard | C27 | Clear government program and policies | [19,50,53] |
| C28 | Clear criteria and standards | [7,42,51,53] |
Table 5.
Details of the semi-structured interviews.
| Interview No. | Locations | Number of Interviewees | Roles in Projects | Company Types |
|---|---|---|---|---|
| 1 | Hong Kong | 10 | Project manager, technical specialists, purchasing managers | Client |
| 2 | Beijing, Mainland China | 1 | Designer | Design institute |
| 3 | Beijing, Mainland China | 1 | Administrative manager | Design institute |
| 4 | Shenzhen, Mainland China | 2 | Contractor manager, supervisor | Client and third-party institute (authorized by the government to audit projects) |
| 5 | Guangzhou, Mainland China | 2 | Facility managers | Facility managers |
Table 6.
Similarity degree among stakeholders related to the CSFs.
| Stakeholders | S1 | S2 | S3 | S4 | S5 | S6 | S7 | S8 | S9 | S10 | S11 | S12 | S13 |
|---|---|---|---|---|---|---|---|---|---|---|---|---|---|
| S1 | 1 | 0.9 | 1 | 0.9 | 0.9 | 0.9 | 0.9 | 0.9 | 0.8 | 0.9 | 0.6 | 0.5 | 0.7 |
| S2 | 1 | 0.9 | 0.8 | 0.8 | 0.8 | 0.7 | 0.8 | 0.6 | 0.8 | 0.4 | 0.4 | 0.6 | |
| S3 | 1 | 0.9 | 0.9 | 0.9 | 0.8 | 0.9 | 0.6 | 0.9 | 0.5 | 0.4 | 0.7 | ||
| S4 | 1 | 0.9 | 0.9 | 0.9 | 0.9 | 0.6 | 0.9 | 0.6 | 0.5 | 0.8 | |||
| S5 | 1 | 0.9 | 0.9 | 0.9 | 0.6 | 0.9 | 0.5 | 0.4 | 0.8 | ||||
| S6 | 1 | 0.9 | 0.9 | 0.7 | 0.9 | 0.6 | 0.5 | 0.8 | |||||
| S7 | 1 | 0.9 | 0.7 | 0.9 | 0.4 | 0.4 | 0.7 | ||||||
| S8 | 1 | 0.8 | 0.9 | 0.7 | 0.6 | 0.8 | |||||||
| S9 | 1 | 0.8 | 0.4 | 0.4 | 0.5 | ||||||||
| S10 | 1 | 0.6 | 0.5 | 0.7 | |||||||||
| S11 | 1 | 0.8 | 0.8 | ||||||||||
| S12 | 1 | 0.7 | |||||||||||
| S13 | 1 |
Table 7.
The prioritization of stakeholders based on different types of centrality.
| Stakeholders | Degree Centrality | Betweenness Centrality | Eigenvector Centrality | |||
|---|---|---|---|---|---|---|
| Value | Rank | Value | Rank | Value | Rank | |
| Owner/client | 0.09551098 | 1 | 0.11627907 | 1 | 0.178402 | 1 |
| Property manager | 0.09551098 | 2 | 0.11627907 | 2 | 0.138636 | 2 |
| Designer | 0.09551098 | 3 | 0.11627907 | 3 | 0.136447 | 3 |
| Government | 0.09551098 | 4 | 0.11627907 | 4 | 0.127691 | 4 |
| Energy service company | 0.09169054 | 5 | 0.107334526 | 5 | 0.110179 | 5 |
| Occupier/user | 0.09169054 | 6 | 0.103756708 | 6 | 0.106166 | 6 |
| Supplier | 0.09169054 | 7 | 0.105545617 | 7 | 0.077709 | 8 |
| Contractor | 0.08500478 | 8 | 0.084078712 | 8 | 0.084276 | 7 |
| Sub-contractor | 0.08500478 | 9 | 0.084078712 | 9 | 0.07625 | 9 |
| Financial institution/bank | 0.06112703 | 10 | 0.04293381 | 10 | 0.048887 | 10 |
| Research institution | 0.06112703 | 11 | 0.041144902 | 11 | 0.044874 | 11 |
| Industry association | 0.03056351 | 12 | 0.007155635 | 12 | 0.017877 | 12 |
| NGO/community | 0.02005731 | 13 | 0.001788909 | 13 | 0.011675 | 13 |
Table 8.
The clusters of stakeholders in green retrofit.
| Cluster | Stakeholders |
|---|---|
| Cluster 1 | Owner/clients; Property managers; Occupier/users |
| Cluster 2 | Contractors; Sub-contractors; Suppliers |
| Cluster 3 | Government; Energy service companies; Designers; Research institutions |
| Cluster 4 | Financial institutions/banks |
| Cluster 5 | Industry associations; NGO/community |
© 2017 by the authors. Licensee MDPI, Basel, Switzerland. This article is an open access article distributed under the terms and conditions of the Creative Commons Attribution (CC BY) license (http://creativecommons.org/licenses/by/4.0/).
Share and Cite
MDPI and ACS Style
Liang, X.; Yu, T.; Guo, L. Understanding Stakeholders’ Influence on Project Success with a New SNA Method: A Case Study of the Green Retrofit in China. Sustainability 2017, 9, 1927. https://0-doi-org.brum.beds.ac.uk/10.3390/su9101927
AMA Style
Liang X, Yu T, Guo L. Understanding Stakeholders’ Influence on Project Success with a New SNA Method: A Case Study of the Green Retrofit in China. Sustainability. 2017; 9(10):1927. https://0-doi-org.brum.beds.ac.uk/10.3390/su9101927
Chicago/Turabian StyleLiang, Xin, Tao Yu, and Li Guo. 2017. "Understanding Stakeholders’ Influence on Project Success with a New SNA Method: A Case Study of the Green Retrofit in China" Sustainability 9, no. 10: 1927. https://0-doi-org.brum.beds.ac.uk/10.3390/su9101927
Note that from the first issue of 2016, this journal uses article numbers instead of page numbers. See further details here.