1. Introduction
The strategic decision of Kuwait to achieve partial food security led to the establishment of three agricultural areas (Wafra in the south, Sulabiya in center, and Abdalli in the north of Kuwait) since the early 1970s. The agriculture in Kuwait is irrigated, since the annual precipitation is too low and erratic to support any reliable agricultural production. Agriculture in Wafra started in the 1970s, with the establishment of 127 farms covering an area of 1125 ha with 100 wells in 1976, to 1673 farms covering over 37,500 ha and 2119 wells in 2008 [
1]. Two main aquifers are utilized for irrigation: the unconfined Kuwait Group (KG) aquifer and the underlying confined Dammam aquifer. The capacity of the Dammam aquifer is much higher compared with the Kuwait Group aquifer. Hence, most of the wells in Wafra were tapping the Dammam aquifer in the absence of a well-established policy and guidelines for the design and construction of wells in agricultural farms. The apathy towards water use in the agriculture sector in Kuwait has lead to excessive over-irrigation, which has resulted in waterlogging, and eventually soil salinization. Similar observations have been made in other irrigated agriculture areas in arid regions [
2,
3,
4].
Factors such as soil thickness [
5,
6], soil type, geology, and geomorphology play significant and interactive roles [
3,
7,
8] in aggravating the waterlogging and salinization problems in agriculture areas. This study attempts to look into the causes and effects of the water table rise in south Kuwait, which is a regional issue. Water quality and level information was used to infer the consequences responsible for water level rise in the Wafra agriculture area. This study also documents the outcomes of interventions done.
The Public Authority for Agriculture and Fisheries Resources (PAAFR) in Kuwait is responsible for the allocation of farmland and their management. PAAFR has been informed about the scientific observations made in the area, which show the main reasons for water table rise to be improper well design, the construction of wells tapping the Damman aquifer, and apathy towards water use. PAAFR enacted a policy that was underpinned by sound scientific observations; it was regarded illegal to construct a well that taps the Damman aquifer. In 2007, there were over 650 wells that were tapping the Damman aquifer. PAAFR started a campaign in 2008 to seal off these wells, and for more than a year these wells were sealed off, until October 2009. Early signs of recovery started appearing in the worst affected areas and the areas at higher topographic elevation.
2. Study Area
The Wafra agricultural area is located in the southern part of Kuwait between latitude 28°31′48″ and 28°36′36″ N and longitude 47°58′49″ and 48°13′16″ E, corresponding to UTM 38 R 3,154,000–3,170,000 m north and 795,000–826,000 m east (
Figure 1). Wafra farms demarcate the international border with the Kingdom of Saudi Arabia in the south. The farms currently cover an area of ~375 km
2 (37,500 ha). The average annual rainfall in the area is about 100 mm; most precipitation is received during the winter months of November–January. There is a wide variation in summer and winter temperatures, with maximum temperature exceeding 50 °C and the minimum below 2 °C.
Geologically, the area is part of the Kuwait Group (KG) consisting of the lower Fars and Ghar Formations, and lithologically comprising of sand, gravel, clay, and limestone. The major aquifers are from the Kuwait and Hassa Groups; the lower aquifer is the Damman aquifer, which belongs to the Dammam and Rus Formations of middle and lower Eocene age, overlain by the recent Kuwait Group [
9].
Agriculture in Wafra farms is perennial. The commonly grown crops are fruits, vegetables, and forage, including alfalfa.
3. Methodology Used
Satellite images were used for the generation of land use (
Figure 1) and topography.
Figure 2 presents the high-resolution topographic information that explains the groundwater flow dynamics in the Wafra agriculture area. Fifteen exploratory wells were drilled, including one continuous multi-channel well complementing the available monitoring wells constructed by the Ministry of Electricity and Water (MEW) in the upper Kuwait Group (UKG) and the lower Kuwait Group (LKG). Seven-channel tubing from Solinst Canada was used in the multi-channel well (PAAFR-14) to gain a better understanding of the vertical water quality variations. The seven channels were tapping water between 27 and 45 m below ground level (bgl). Another 14 exploratory wells were drilled in the UKG aquifer to a depth of 25–30 m. Water quality was tested in all of the drilled wells, and the water levels were monitored, to observe the changes in water level due to irrigation. Geophysical logging (resistivity and gamma) was taken up to gather additional subsurface information. For a more comprehensive understanding of the problem, surface water and soil samples were collected from waterlogged areas. To understand the spatiotemporal change in water levels and quality, the current observations were compared with the previous comprehensive study [
10] to assess variability in water quality and levels over two decades.
4. Results and Discussion
4.1. Site Geology
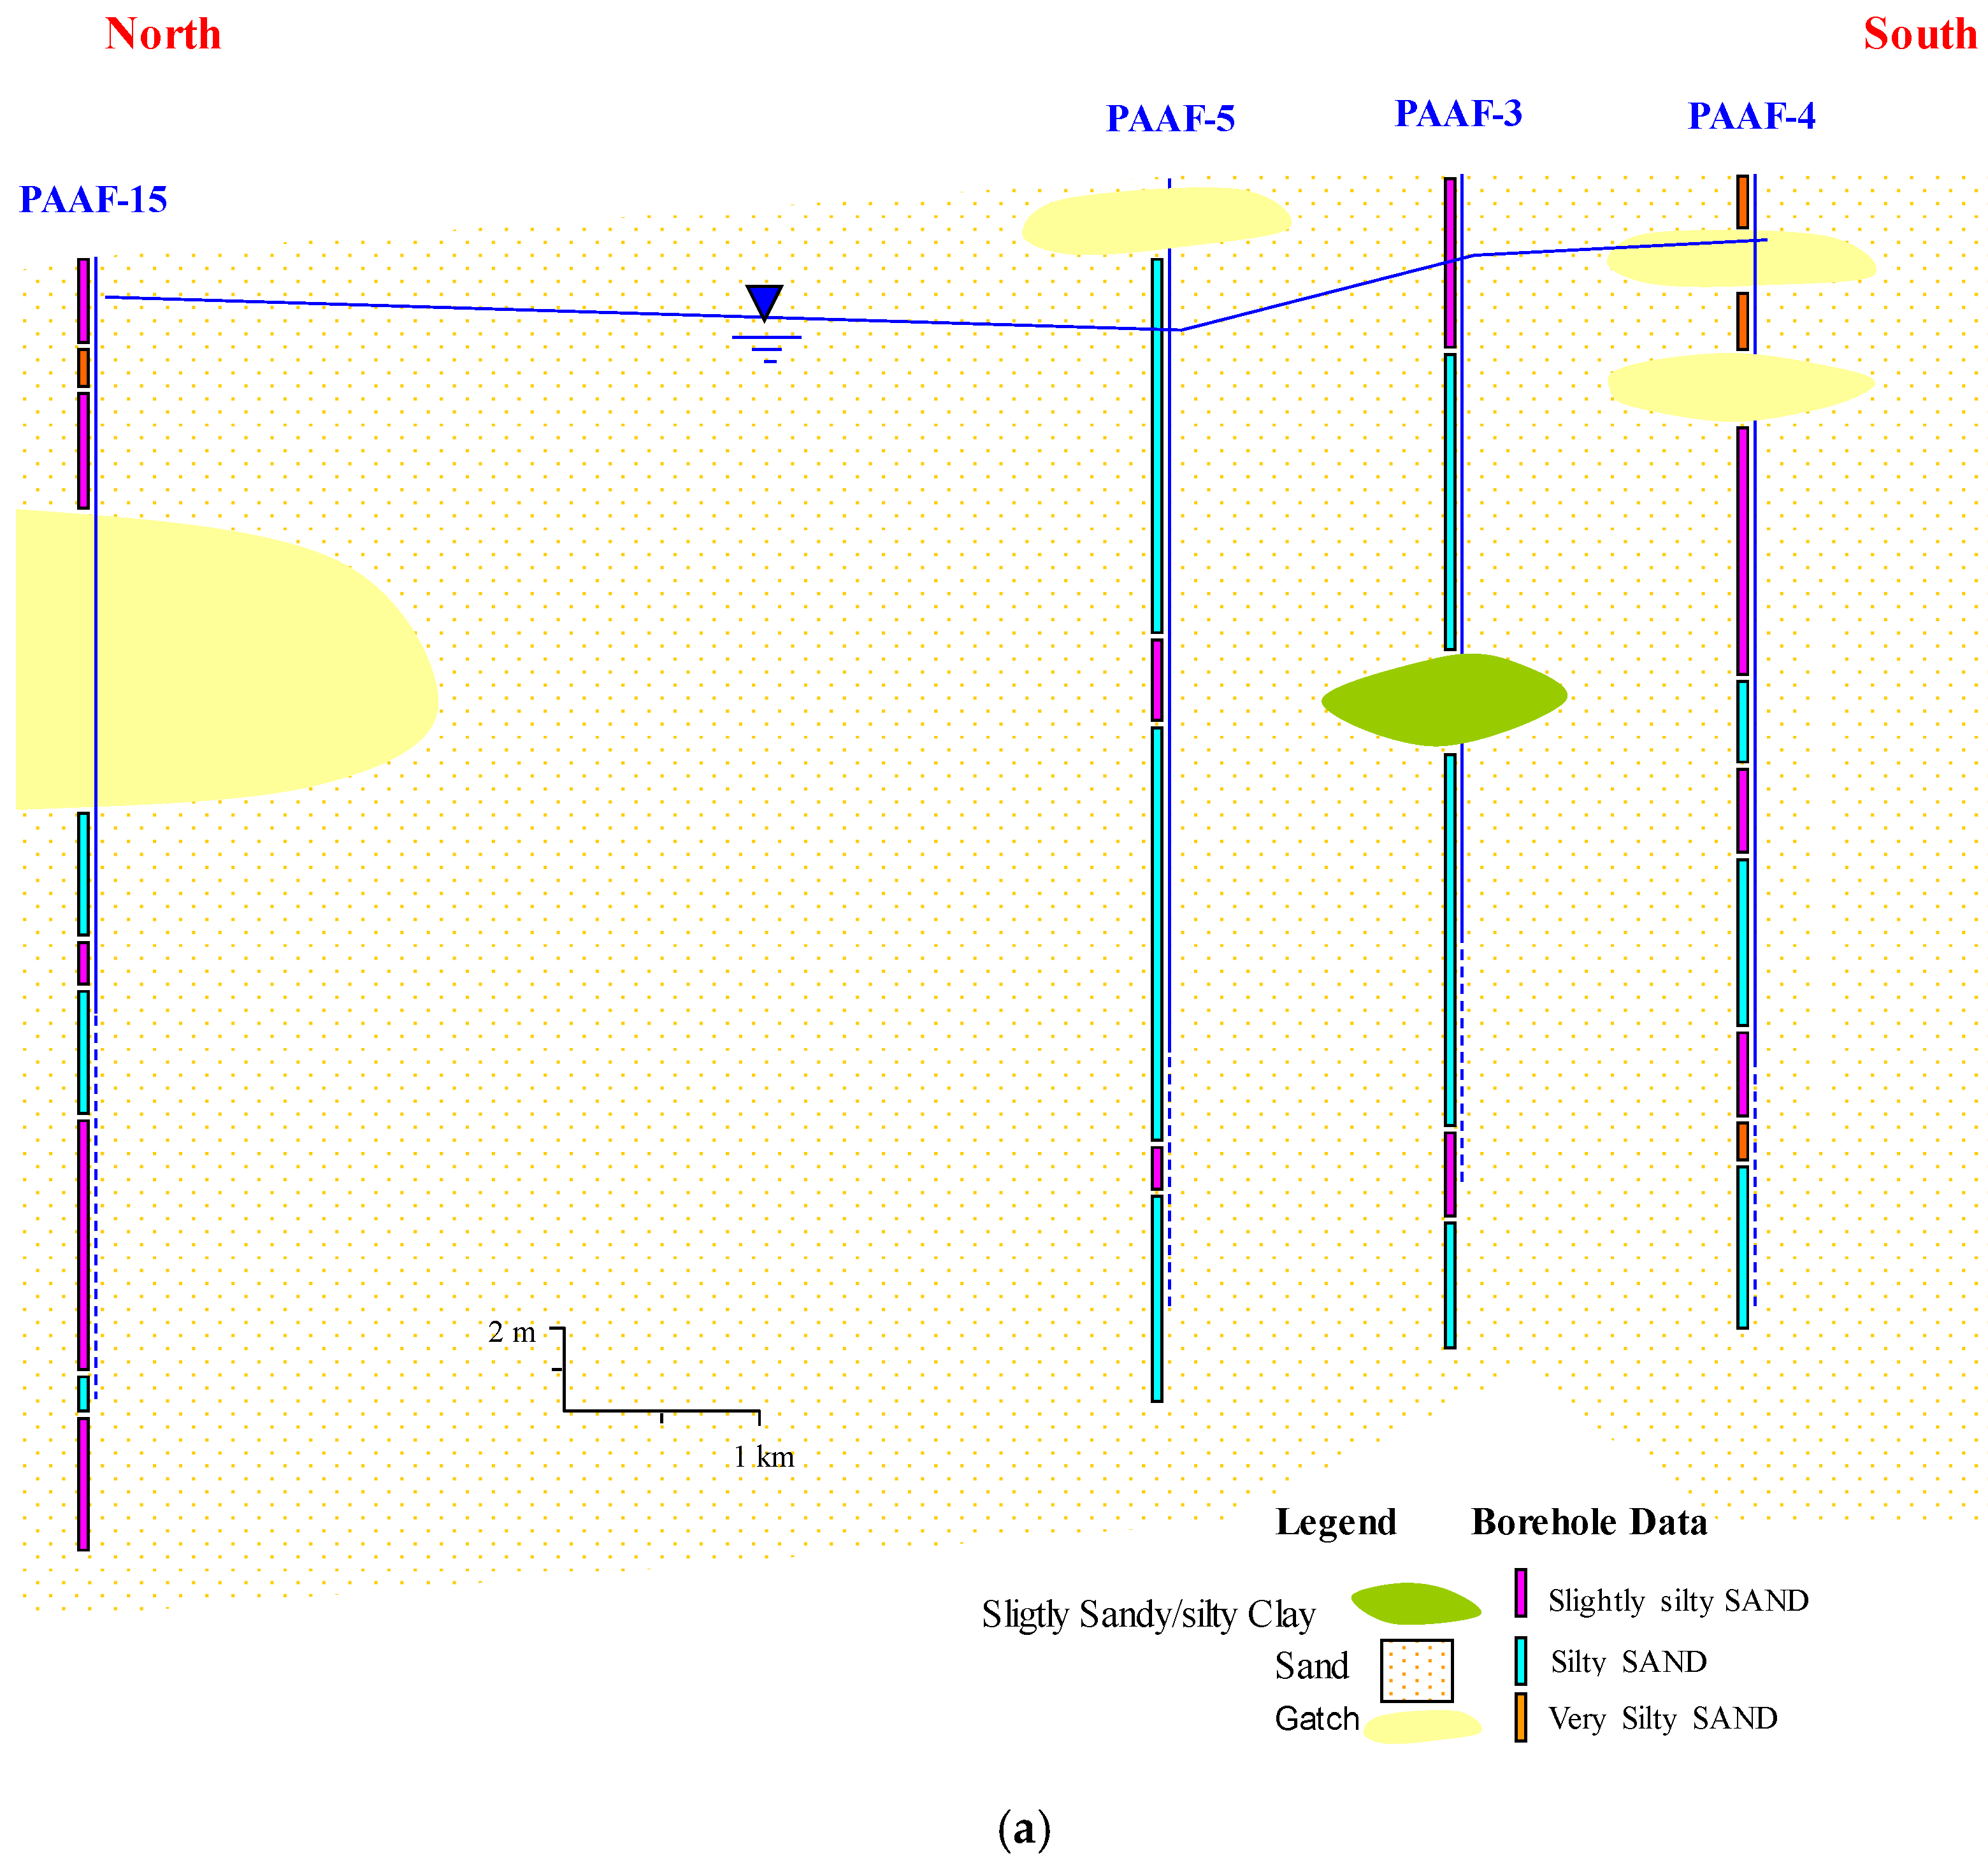
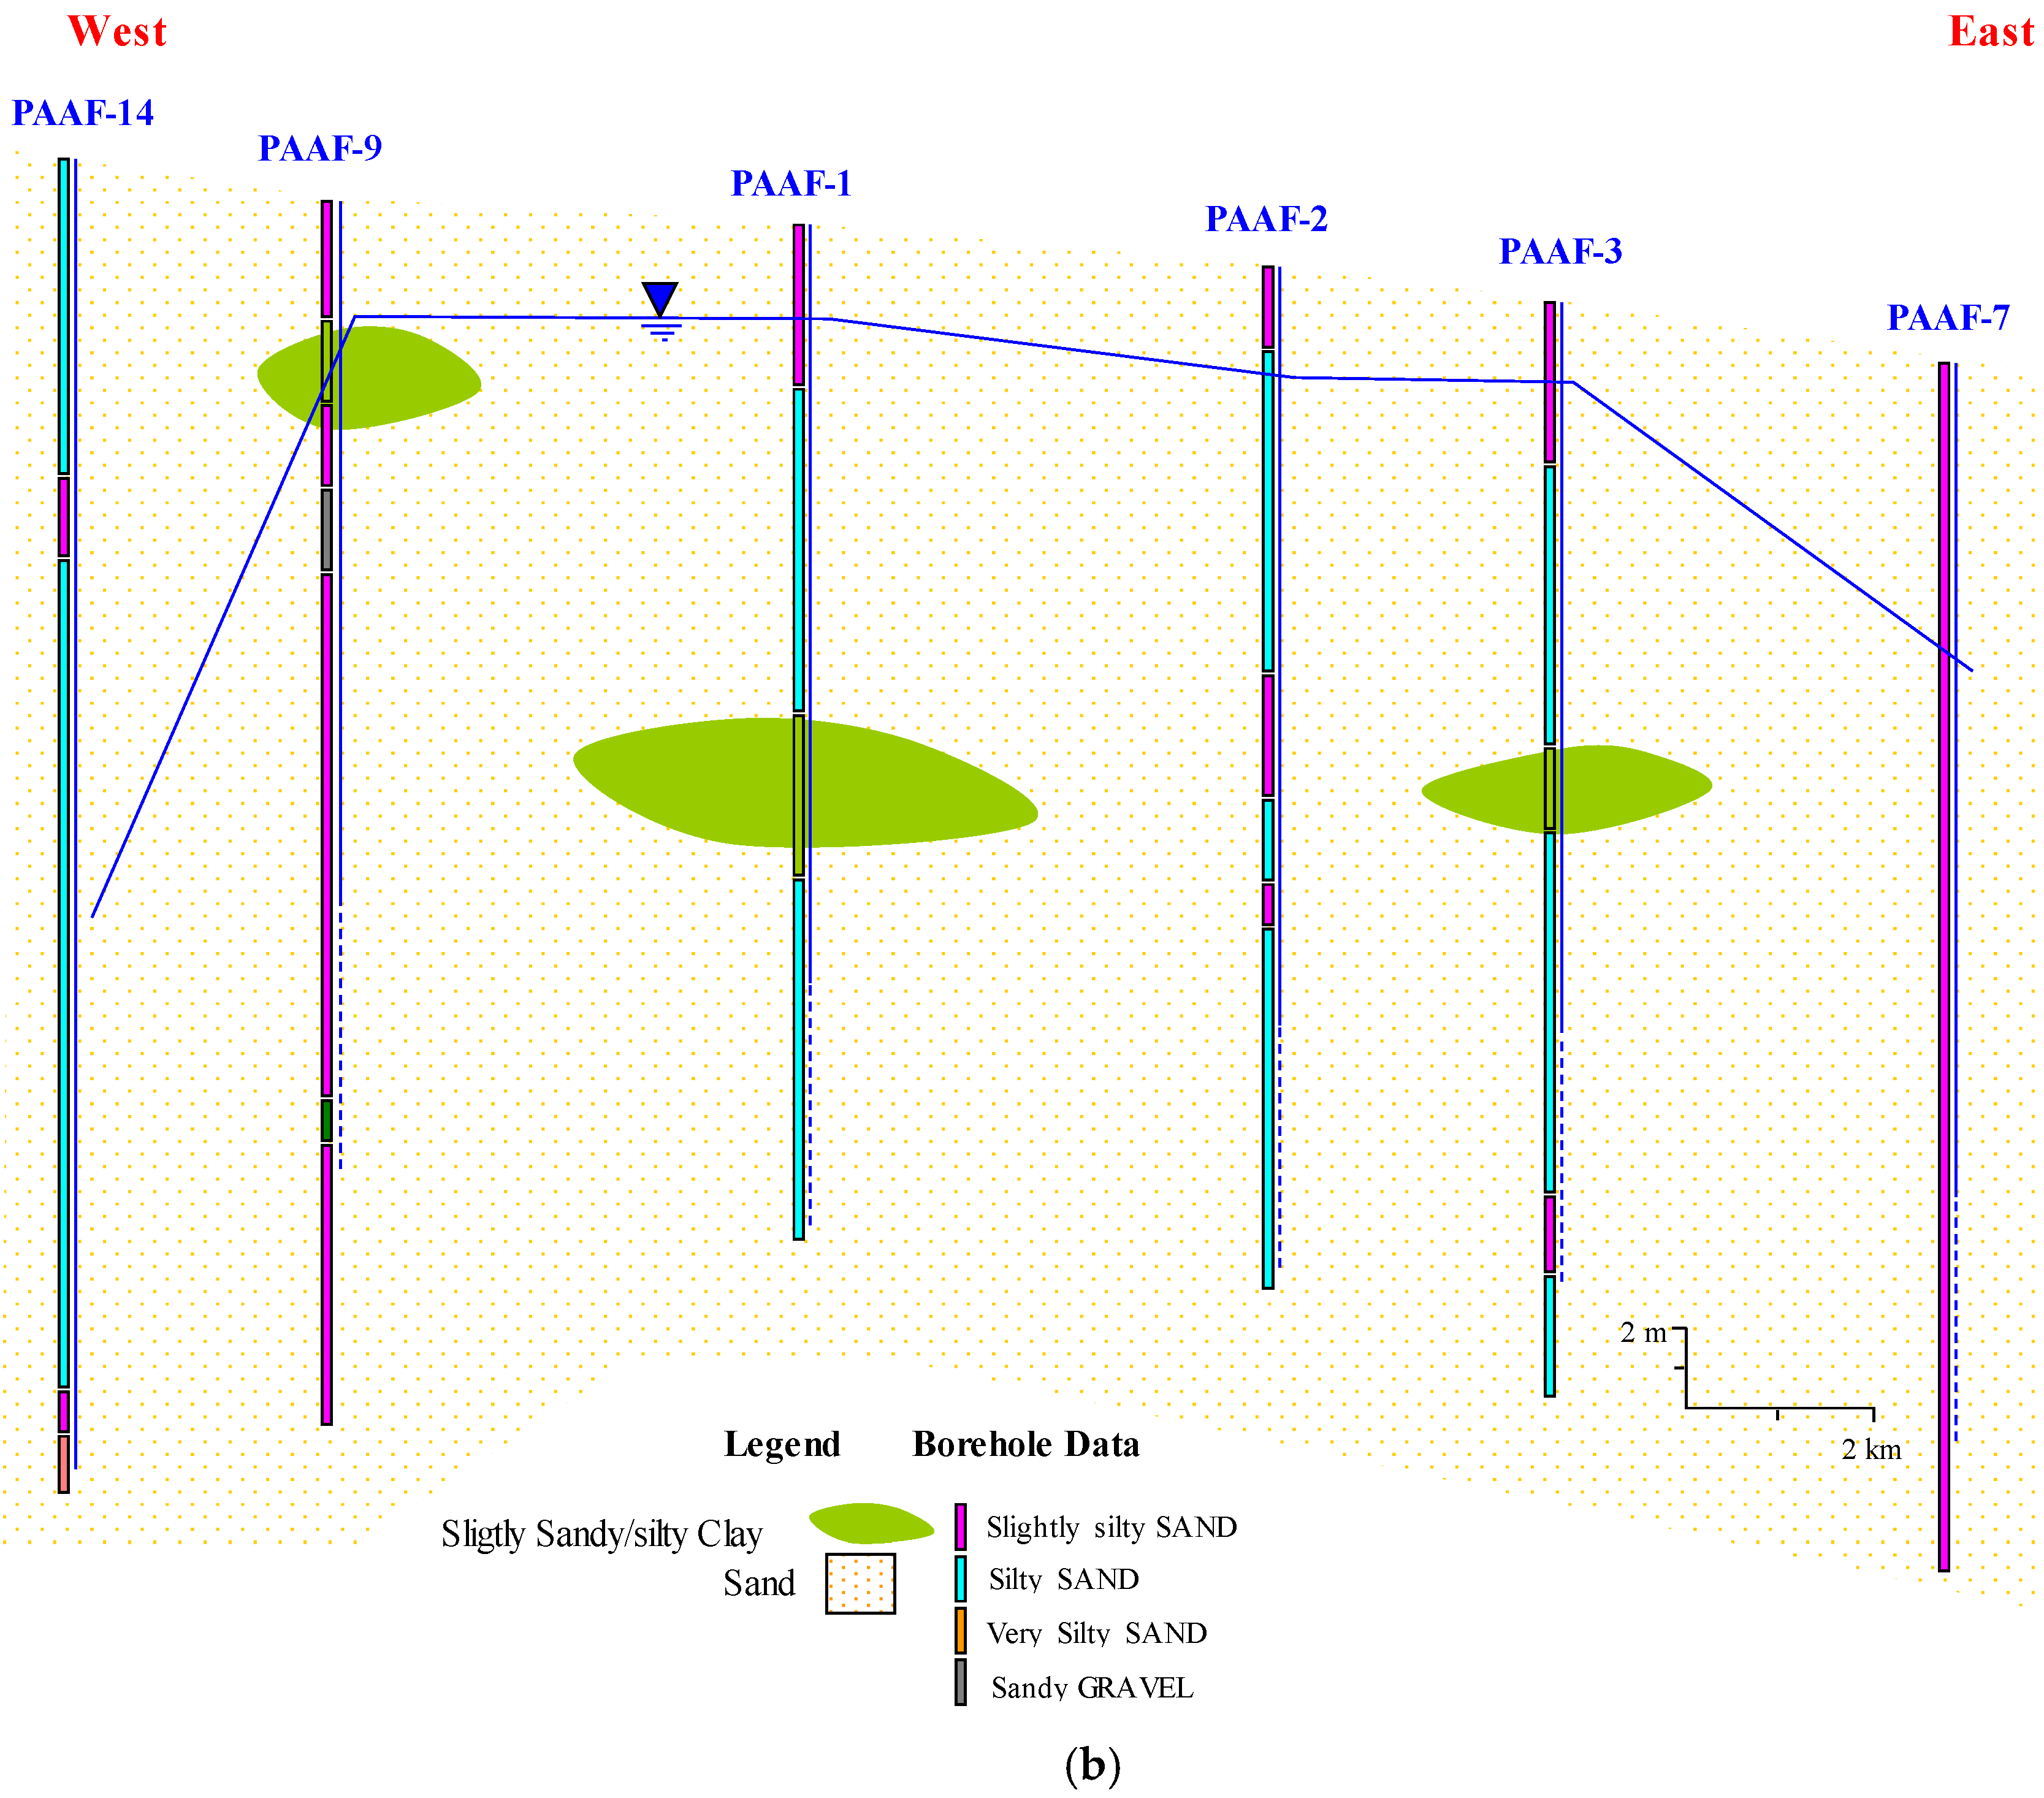
The regional aquifers in Kuwait are composed of the saturated part of the KG aquifer and the underlying Dammam aquifer. The thickness of the KG aquifer in the western part of the study area is ~45 m, which increases to ~70 m to the east. Direct observation was possible at Well No. PAAFR-14, where the top of the Dammam Formation was encountered at 47 m bgl. Lithological characterization was made on the basis of the drill cuttings, grain size, and geophysical investigations. The Kuwait Group aquifer is chiefly fluviatile clastics, subdivided into UKG and LKG. To explore the three-dimensional (3-D) disposition of various lithologies in the Wafra area, two cross-sections were considered: a north–south section (
Figure 3a) passing through Well Nos. PAAFR-15, PAAFR-5, PAAFR-3 and PAAFR-4; and an east–west section (
Figure 3b) passing through Well Nos. PAAFR-14, PAAFR-9, PAAFR-1, PAAFR-2, PAAFR-3, and PAAFR-6. The slightly sandy clay and sandy clay that were present in other wells were not observed in Well Nos. PAAFR-10 and PAAFR-11, indicating the localized development of these units. The core recovered from two wells, Well Nos. PAAFR 4 and PAAFR 8 showed 2 m to 7 m-thick calcrete deposits, which possibly act as an impediment, hampering hydraulic conductivity in the area.
4.2. Water Table and Total Dissolved Soild Levels
The change in the depth of the water table and total dissolved solids (TDS) levels were two key components of linking leakage from the Dammam aquifer and over-irrigation in the Wafra agriculture area. Both of these parameters were measured in all of the 15 wells drilled during this study and compared with the water level and TDS information generated in 1993 [
10] and from MEW observation wells. The regulations in Kuwait had stipulated that tapping the Dammam aquifer for irrigation is illegal, and the wells should be restricted to the brackish Kuwait Group aquifer. An average depth of 10 m bgl was reported from irrigation wells in Wafra in 1993 [
10]. The change in water level started appearing since 2003 in MEW observation wells when the Wafra agriculture area witnessed the development of irrigation wells tapping the brackish Dammam aquifer and the use of reverse osmosis to produce fresh water. The effluent was dumped back into the wells or disposed of in pits left for evaporation. PAAFR identified more than 650 wells that were illegally tapping the Dammam aquifer. The apathy towards water use and the calcitic thin soil profile resulted in the rise of the water level, so much so that about 18.7% of the Wafra agriculture area became waterlogged by 2008. Over-irrigation using brackish water, and high evaporation rates in the region, led to the salinization of soil. PAAFR initiated a campaign in 2008 to seal off all of the wells tapping the Dammam aquifer in Wafra. As a result, 600 wells were sealed between June 2008 and October 2009. As part of the assessment, five sites were investigated in detail (
Figure 1).
4.2.1. Site A
Site A is the Tammar Farm (
Figure 1). This site was a topographic low and had an acute water rise problem, so much so that it had developed a 1.5 m deep pond (
Scheme 1a), resulting in the complete disruption of infrastructures and substantial loss of this farm (
Scheme 1b). The reason for this problem was an improperly designed well in the Dammam aquifer, and irrigation return flows from adjacent farms at a higher elevation. Since Dammam is a confined aquifer, improper sealing of well resulted in constant leaking. The continued use of this well resulted in water level rise to the extent that the 25,000 m
2 land was submerged in this farm, and a few adjacent farms were completely waterlogged.
PAAFR plugged the well at Site A in January 2009. For closer observation, Well No. PAAFR-9 was constructed near the affected farm to record the changes in water level. Measurements made between July and October of 2009 showed rising water levels even after sealing the Dammam well at Site A, indicating the additional source. The topographic data and flow vectors were plotted to identify the reason for this water table rise at Site A, and revealed that this site is in a syncline receiving the irrigation return flow from other adjacent farms. This contribution from adjacent farms resulted in a significant rise in the water level at Site A. Once the adjacent wells were plugged, the water level started to decline.
A diurnal fluctuation of 0.5 m was observed in Well No. PAAFR-9, which was a result of abstraction from wells in nearby farms, and continued until they were plugged. A significant change was observed in the concentration of total dissolved solids since the last measurements in 1993. The TDS in the upper and lower horizon of the KG aquifer and the Dammam Formation increased from 5000 mg/L in 1993 [
10] to 12,700 mg/L in 2009 [
1]. The surface water (pond) from Site A had a TDS of 23,860 mg/L. This extremely high TDS in the surface water is a result of evaporation, and once fully dry, left behind salt encrustations over the ground surface, rendering it unfit for agricultural usage. The presence of a 3 m bgl calcareous green mud layer at the site acts as an aquitard and an impediment, retaining the irrigation return flow within this depression, and forming a pond. This layer is massivly cohesive, and occurs in the lower horizon of the KG group [
10].
4.2.2. Site B
Site B was PAAFR’s new experimental station. This site is located in the northern part of the Wafra area (
Figure 1), with very few farms and minimal irrigation activity. The surface geology shows the existence of a calcrete outcropping inside and outside the southern corner of the PAAFR station (
Scheme 2) that was at a lower elevation than the other areas of the farm.
Three wells were drilled in the area in addition to an existing MEW nested well, M4, to elucidate the local hydrological situation.
Figure 4 shows the water level in newly drilled Well Nos. PAAFR 12, 13, and 15, while
Figure 5 depicts the water level observed in well M4. The south of Well No. PAAFR-15 is a waterlogged depression, which explains the shallow water table depth in this well. Nearby Well Nos. PAAFR-12 and PAAFR-13 show the rise of the water table by more than 1 m between mid-September and October 2009 (
Figure 4). A similar water table rise was observed in nested Well Nos. M4-UKG and M4-LKG during October 2008 to January 2009 and July to October 2009 (
Figure 5). A sharp decline of about 6 m in the LKG and 1.5 m in the UKG was measured between April and June 2009. The reason for this drop is increased abstraction and agriculture activity in the summer months. The levels are increased in winter months, as there is less abstraction, in addition to continued leakages from the Dammam wells.
There is no significant difference regarding the TDS observed at this site, with 6000 mg/L in 1993 [
10] and 6250 mg/L in 2009 [
1]. This consistency could broadly be related to the limited agricultural development in this part of Wafra.
4.2.3. Site C
Site C is an area located adjacent to the old PAAFR station in Wafra (
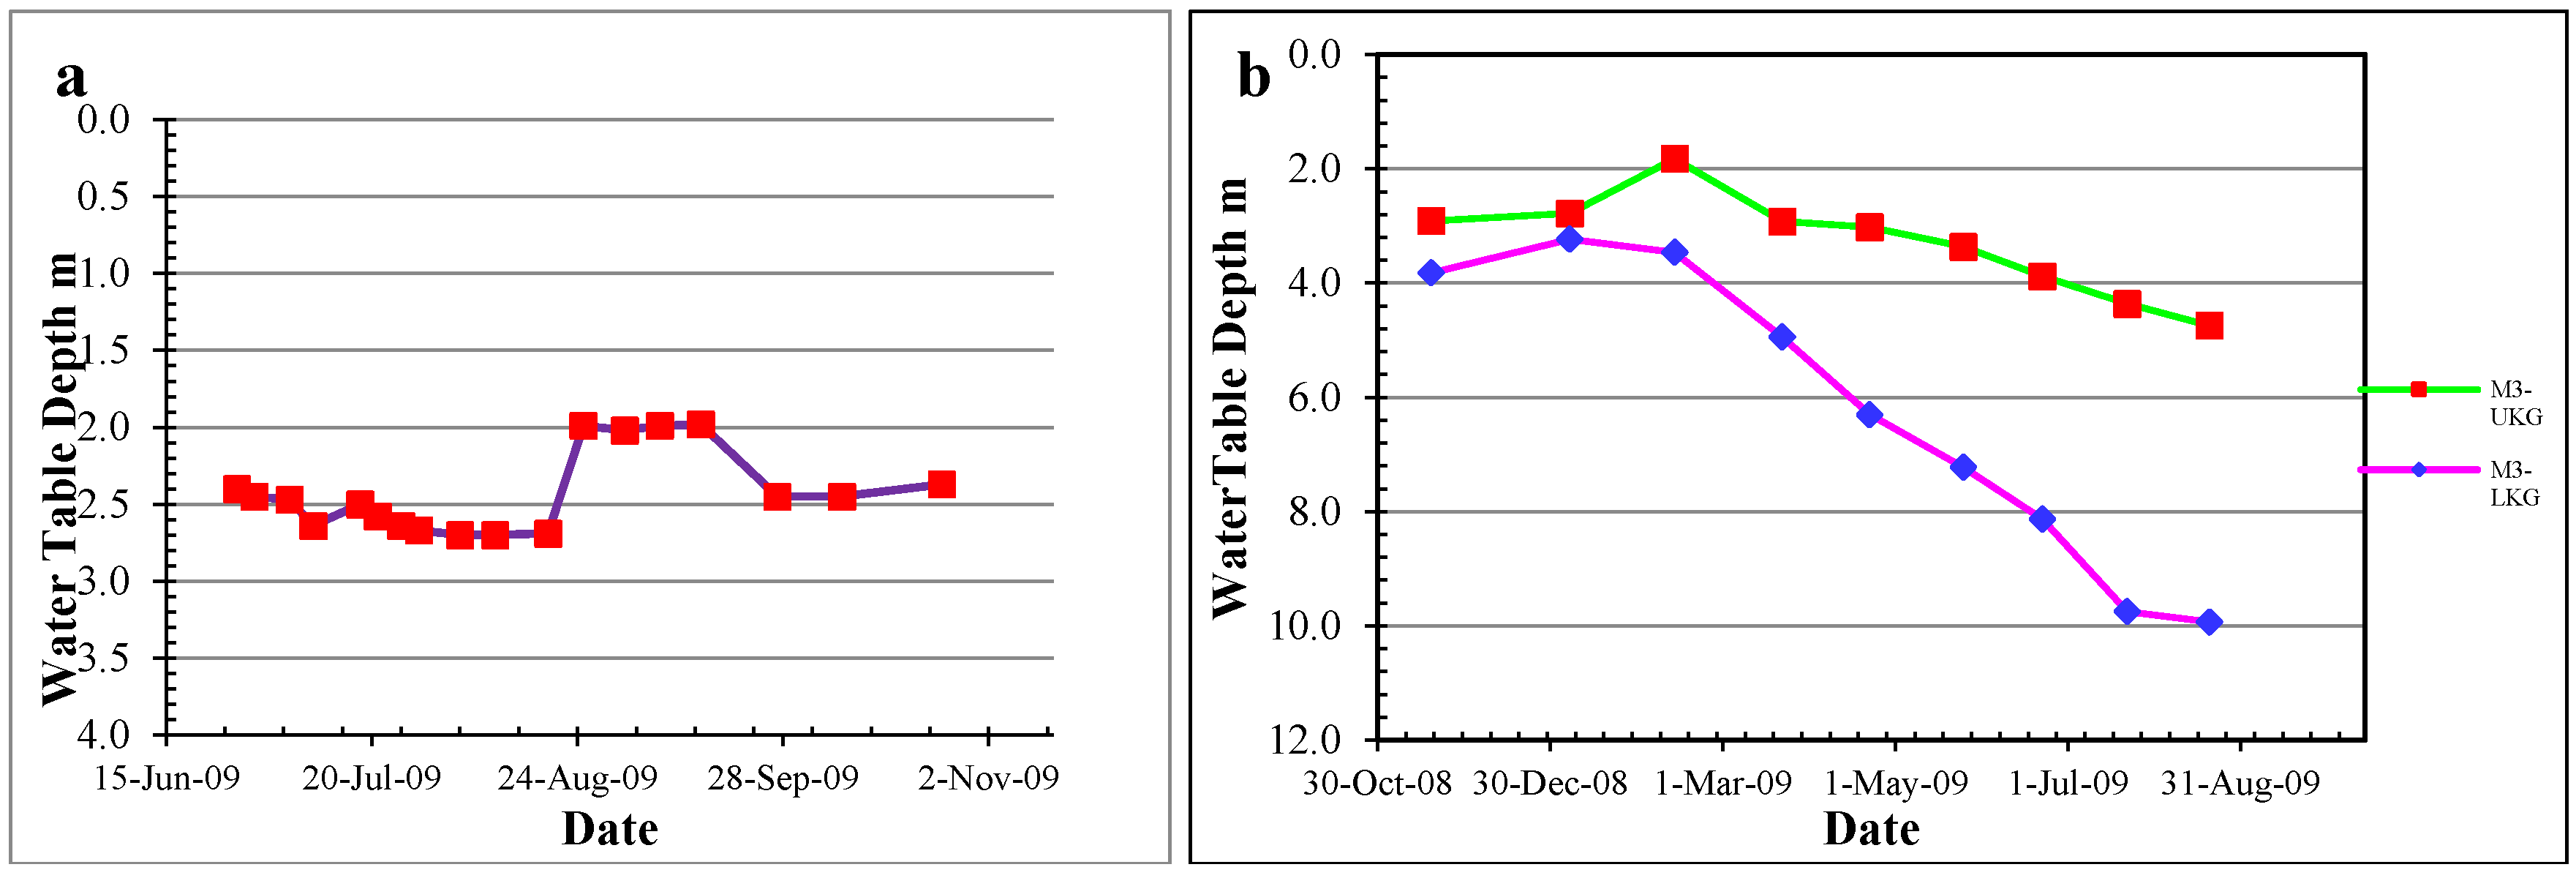
Figure 1). This is a localized natural depression. The area was flooded during the 2008 winters. In the following summer, the flooded water evaporated, leaving behind saline encrustations. The water table was measured in adjacent Well No. PAAFR-1, and nested observation Wells No. M3-UKG and M3-LKG. The water level in PAAFR-1 was 2.40–2.70 m bgl on 27 June 2009 and 19 August 2009 (
Figure 6a). The water table trends in Well No. PAAFR-1 were similar to Well No. PAAFR-9 at Site A.
Diurnal variation in the water table was also observed; higher levels were observed in the early morning during 19 August 2009 to 14 September 2009. However, the daytime water table remained consistent. M2 showed a decline in the water table of about 6.0 m and 2.0 m, from the LKG and UKG, respectively (
Figure 6b). The decline in the LKG is more than the UKG, since most wells tap the lower part of the aquifer. As in Site A, the nested wells of the LKG and UKG have the same trend. The area showed reasonable recovery after 12 Dammam wells were plugged, ceasing the leakage from the confined Dammam aquifer.
The area shows an increase in TDS values from 5000 mg/L during 1993 [
10] to 7000 mg/L in 2009 [
1]. This increase in TDS values is a likely result of evaporation from excessive irrigation and probably mixing of reverse osmosis (RO) effluent.
4.2.4. Site D
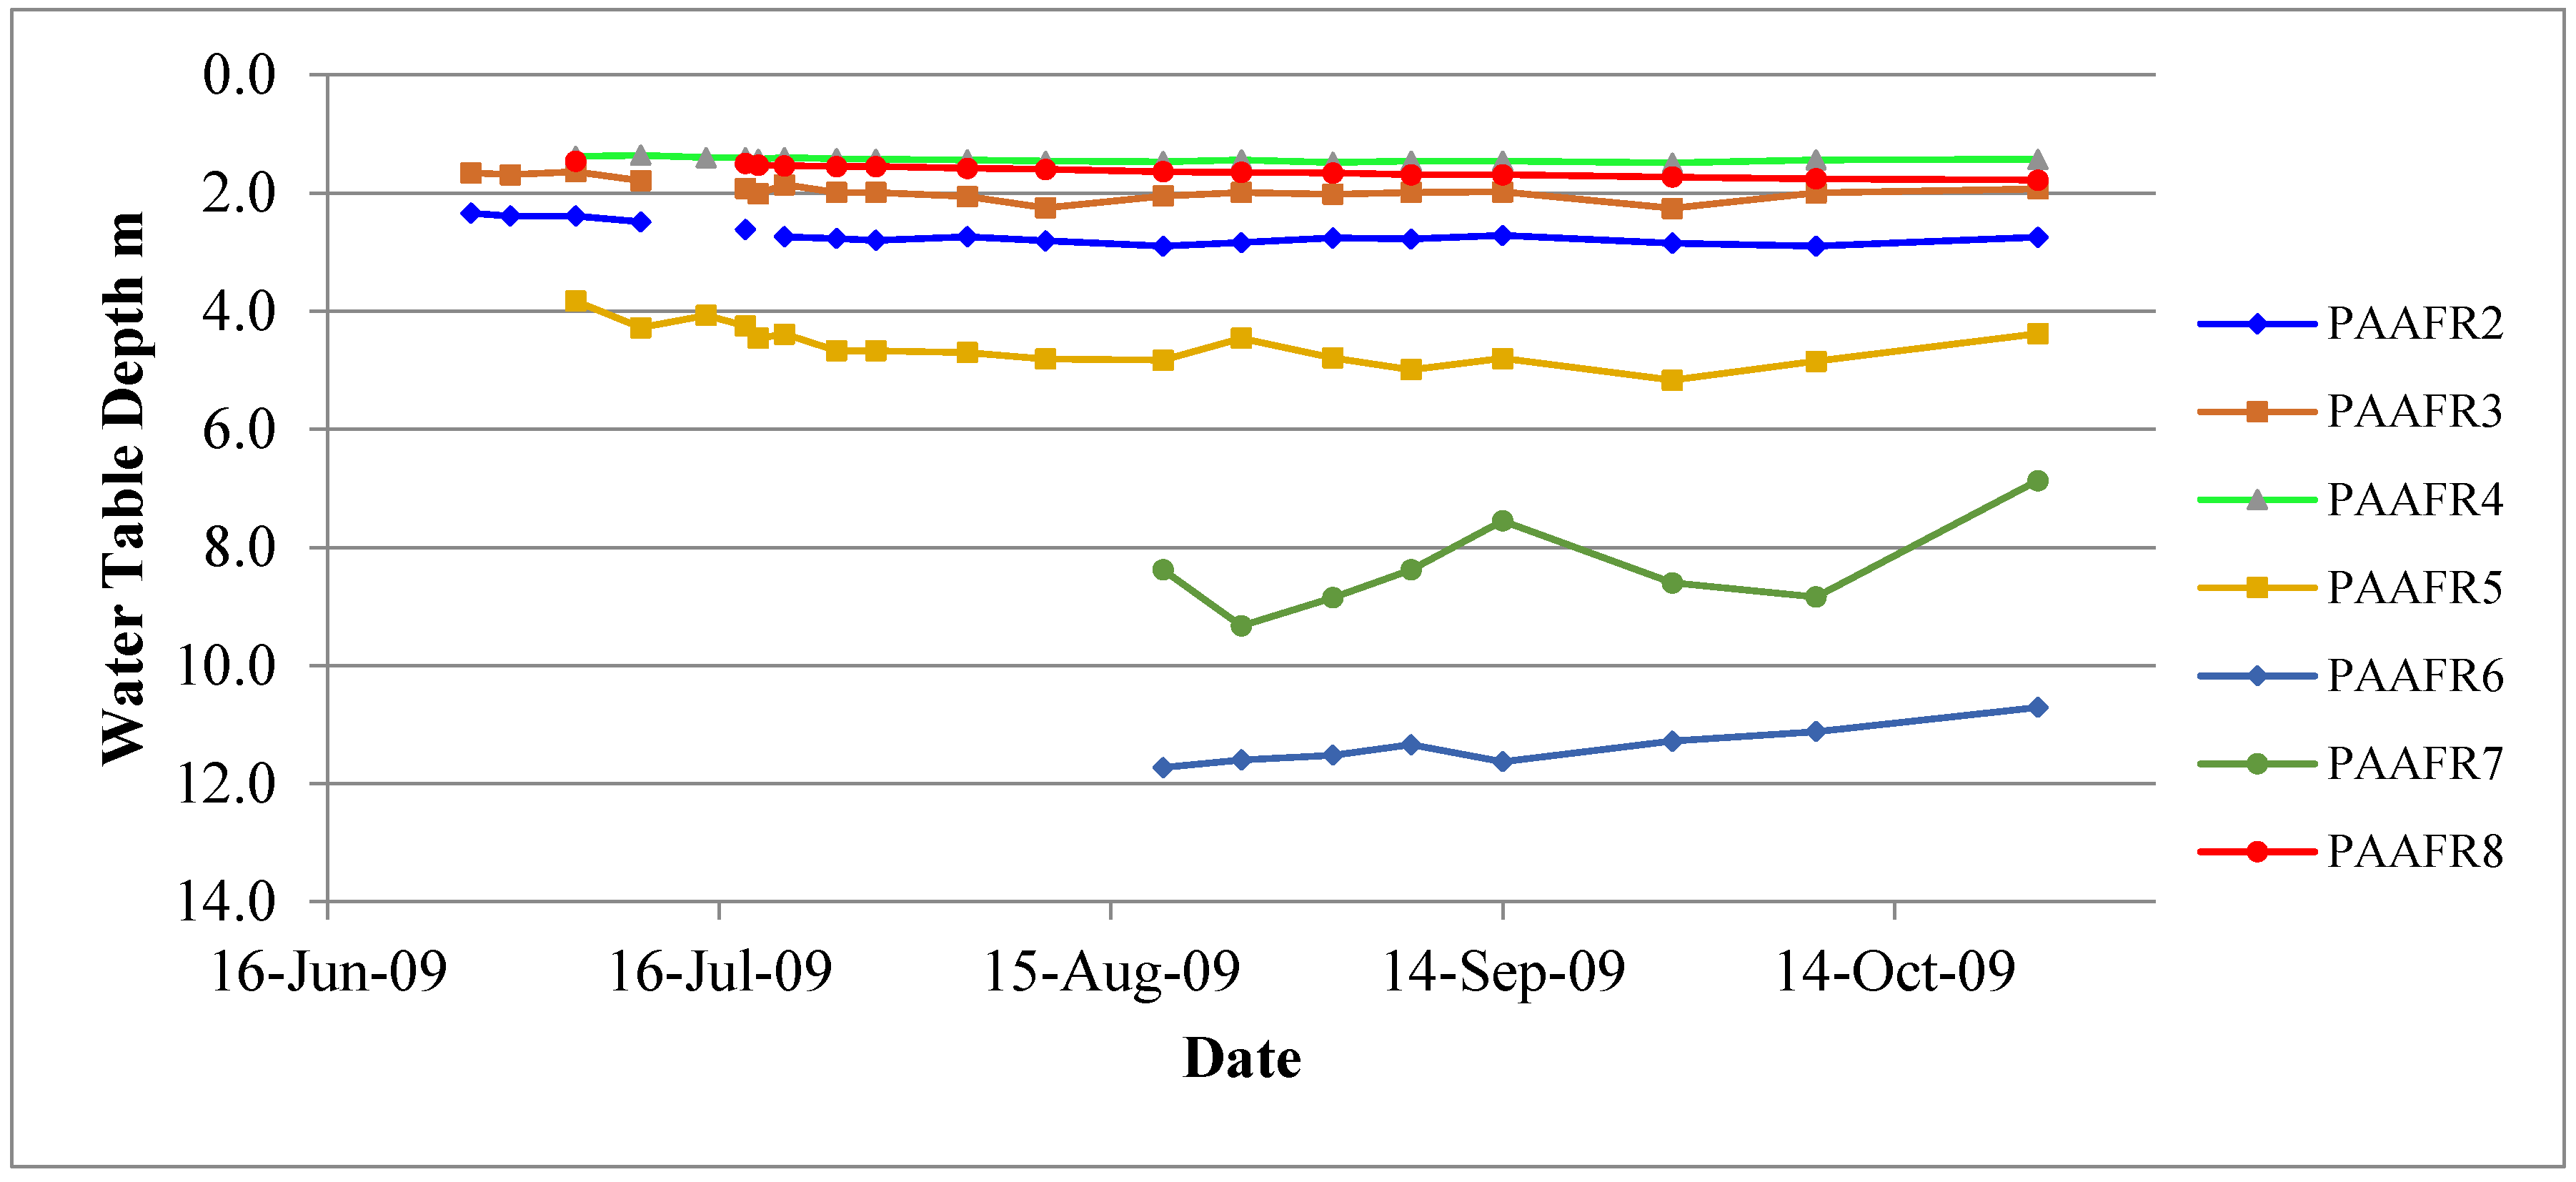
Site D is located in the southeastern part of Wafra, which is the worst impacted location within the entire study area. The elevation of the area varies between 110.0 and 60.0 m above mean sea level. This 50-m difference in elevation within 10 km makes the low-lying area vulnerable to waterlogging. The water table rise has severely impacted the farms in this area, and many of them have stagnant ponds. Monitoring Well Nos. PAAFR-2, PAAFR-3, PAAFR-4, PAAFR-5, PAAFR-6, PAAFR-7, and PAAFR-8 were constructed to understand the water level fluctuations. During the observation period (July–October 2009), the water table declined in most of the monitoring wells, i.e., Well Nos. PAAFR-2, 3, 4, 5, and 8 (
Figure 7). The water table fluctuation was similar to Sites A, B, and C. Plugging of the Dammam wells and pumping from the KG aquifer were inferred to be the cause of this decline; it will take probably a year or more to lower the water level in the KG. The moderate rise was observed from the end of August until October in all of the wells, because it was low agriculture season and the abstraction rates were low.
The TDS has increased in the KG aquifer, from 8000 mg/L in 1993 [
10] to 10,100 mg/L in 2009 in Well No. PAAFR-2 [
1]. This increase in TDS is attributed to the infiltration from surface water ponds that formed near Well No. PAAFR-2. The soil salinity in the dried up ponds was 19,800 mg/L [
1]. The soil at Site D had deteriorated to an extent that it was not suitable for plantation.
Areas around other wells that were severely impacted showed a considerable recovery until July 2009. An increase in the salinity of the groundwater and soil was observed over the entire area. The observations made at the Ministry of Electricity and Water observation wells at the end of 2009 showed a decline of 4 m in the UKG and LKG aquifers.
4.2.5. Site E
Site E is the area located between the Wafra oil field and the Wafra agricultural area (
Figure 2). A multi-channel well was constructed in this area to investigate the impact of an evaporative pond within the Wafra oil field on the groundwater in the area. The evaporative pond was constructed in the early 1970s; since then, it had received produced water from the oil field. This evaporative pond is not a secured site. The evaporative pond in 1974 was ~2.0 km
2, and has grown since to ~3.6 km
2 (3.0 × 1.2 km) in 2004 with 2.0 m depth.
Table 1 shows the vertical TDS of the groundwater in the multi-channel Well No. PAAFR 14 [
1]. The table shows a stratified TDS in the location of the well. The TDS ranged from 15,000 mg/L to 58,000 mg/L, at depths of 27.0 m bgl and 31 m bgl, respectively. The maximum concentration suggests that the center of the plume is at this depth in the area of the well. The initial reported TDS was between 3000–7000 mg/L in this area [
11]. This dramatic change in the TDS of the groundwater shows a likely contamination from the produced water in the evaporative pond.
The water table in the well was at 20 m below the ground surface in October 2009. At this time, the water table may be at the start of rising to the highest level, as shown by the graphs of the other nested wells, such as M4-UKG and M4-LKG (
Figure 5). Changes in the water table levels during summer and winter may affect the vertical distribution of the TDS in the area. With the presence of more than 1500 wells in the KG aquifer within the Wafra agriculture area, the cone of depression is large, and obliterates the hydrodynamics by mixing the discharge from the evaporative pond with the KG. An estimation of the volume of produced water that reached the KG, and its spatial and temporal distribution, is a topic of future investigation.
The Wafra area lacks a sewer network, and cesspools are common practice. This is another significant source that contributes water to the KG. In Wafra, more than 20.0 MIG/d is used for irrigation and human uses. With two such cesspools in each farm, there are about 3500–4000 cesspools in Wafra. The design of these cesspools is quite rudimentary, and does not provide any protection from direct infiltration of the wastewater to the ground.
5. Conclusions and Recommendations
Based on the investigation carried out, it is clear that the problem in the Wafra agricultural area is multifaceted. The most conspicuous issue related to the water level rise in Wafra was the usage of 650+ Dammam Formation wells. This issue was tackled by PAAFR by sealing 600 wells that were tapping the Dammam Formation aquifer until October 2009 as a policy measure, resulting in sealing off the uncontrolled source of irrigation.
The installation of reverse osmosis units for producing fresh water for irrigation in Wafra farms is prohibited by law. However, several illegal operations do exist. PAAFR will have to crack down on these operations and close them. The viable alternative for supplying fresh water to farms will be extending the tertiary-treated wastewater supply to these farms. This supply can be blended with the KG aquifer to produce suitable irrigation water. This recommendation will also address the issue of secondary salinization of soil.
Satellite data has revealed micro-elevation changes that suggest underground karst development. The impacted farms at higher topographic elevations have shown quick recovery. The farms at lower elevations might take a longer time to recover and have shown soil salinization. This observation was verified at several locations in the area. The saline soil is to be treated by scraping the salt from the surface and leaching [
12,
13,
14] using tertiary-treated wastewater. The leached water will drain into the upper KG aquifer. The consistent dilution of KG with large quantities of tertiary-treated wastewater will lower the TDS of the KG aquifer, and can contribute toward sustainable agriculture development in the area.
The use of brackish water, coupled with the lithological conditions and shallow water table, has created stagnant brackish surface water bodies. These brackish water bodies eventually become saline due to excessive evaporation in the study area. These stagnant ponds upon drying up leave behind calcrete deposits and salt encrustations on the surface soil, which should again be scraped and leached using tertiary-treated wastewater.
The most critical aspect in the present scenario is well construction and irrigation management, which has been addressed very effectively by designing a sound policy that prohibits farmers from tapping the Damman aquifer. Since Dammam is a semi-confined aquifer, an improper sealing leads to continuous leakage. The water quality in the KG and Dammam aquifers are similar; thus, limiting the irrigation wells to the KG is not likely to affect productivity, while controlling the water rise problem to a larger extent.
Better irrigation management practices need to be used, especially the adoption of sprinklers for alfalfa, and drip irrigation for fruits and vegetables. The water application should take into account the crop water requirements based on crop type, growth stage, and metrological conditions. The gravity and flood irrigation that are currently practiced should be immediately stopped.
To keep the water level checked, a dewatering well field should be constructed in the southeastern part of the study area (Site D). The abstracted brackish groundwater from this well field can be utilized for landscaping purposes in the Wafra area. It is also very important to keep the KG wells active in the farms, especially in the southeastern part, to lower the water table in the study area. Installing pumping wells in the UKG should be a new regulation in Wafra, especially in the areas where the water table is very shallow. Also, the use of tertiary-treated wastewater for blending with the KG aquifer will lower the TDS. A close monitoring of water table levels in constructed wells at the study area should provide an early warning signal for water table rise.


