Health Risk Assessment of Vegetables Grown on the Contaminated Soils in Daye City of Hubei Province, China


1
Research Center for Environment and Health, Zhongnan University of Economics and Law, Wuhan 430073, China
2
Institute of Environmental Management and Policy, Zhongnan University of Economics and Law, Wuhan 430073, China
3
School of Information and Safety Engineering, Zhongnan University of Economics and Law, Wuhan 430073, China
*
Author to whom correspondence should be addressed.
Sustainability 2017, 9(11), 2141; https://0-doi-org.brum.beds.ac.uk/10.3390/su9112141
Submission received: 24 September 2017
/
Revised: 12 November 2017
/
Accepted: 17 November 2017
/
Published: 20 November 2017
(This article belongs to the Special Issue Heavy Metals: Environmental Health Risk Assessment and Sustainable Management)
Abstract
:China is an agriculturally-producing country and the safety of its vegetables will have an extensive attention at home and abroad. Recently, contamination of soils and vegetables caused by mining activities is of great social concern because of the potential risk to human health, especially to the residents whom live near metal or metalloid mines. In this study, 18 topsoil and 141 vegetable samples were collected from the contaminated areas in Daye City Hubei Province, China and the concentrations of copper (Cu), zinc (Zn), arsenic (As), cadmium (Cd) and lead (Pb) were analyzed. A self-designed questionnaire was assigned to obtain the exposure scenario and the USEPA health risk assessment model was adopted to assess two type of risks (non-carcinogenic risks and carcinogenic risks) of vegetables to humans. The results showed that the average contents of metal(loid)s in soils exceeded the background value of Daye City. The average contents of metal(loid)s, especially As, Cd, Pb, in three kinds of vegetables were significantly higher than the permissible values based on Chinese national standard. Leafy vegetables had relatively higher concentrations and the transfer factors of As (0.015), Cd (0.080) and Pb (0.003) were comparable to leguminous and fruit vegetables. Leguminous vegetables had relatively higher concentrations and transfer factors of Cu (0.032) and Zn (0.094) than leafy and fruit vegetables. The transfer factors from soil to plants follows a decreasing order as Cd (0.068), Zn (0.047) > Cu (0.023) > As (0.006), Pb (0.002). Furthermore, health risk assessment revealed the following results: the non-carcinogenic risk decreased in the order of children, adult, adolescent, while the carcinogenic risk followed a decreasing order of adult, adolescent, children; the calculated carcinogenic and non-carcinogenic risk of the metal(loid)s by vegetable consumption decreased in the order of leafy vegetables > fruit vegetables > leguminous vegetables. The relatively lower transfer factors and lower risks may suggest that leguminous and fruit vegetables are more suitable for planting in Daye City. Based on the contributions of five kinds of metal(loid)s from three types of vegetables, Cd and As are found to be the dominant sources of health risk.
1. Introduction
Potentially toxic elements caused by mining are one of the leading sources of soil contamination in many countries [1,2,3]. Among different toxic elements, heavy metals and metalloids are of major concern because of their ubiquitous nature, toxicity, non-biodegradability, long biological half-lives and bioaccumulation [4,5,6], which allow heavy metals and metalloids to easily enter into the human body by plant enrichment when accumulated to a certain concentration in soils. The soil-crop system is the main pathway for heavy metals and metalloids migrating into the food chain, affecting food quality and safety [7,8]. Increasing awareness of the harm of heavy metals and metalloids to the food chain has led to strengthened international regulations and supervision on food quality [9]. China is an agriculturally-producing country and the safety of its vegetables will have an impact on the health all over the world. A series of norms and standards about metal(loid) pollution of the crops and their origin have been published in China (GB18406.1-2001, GB2762-2005, NY/T391-2000). Studies have shown that vegetables accounted for a large proportion of the Chinese diet structure [10]. Vegetables have become an important medium for people exposed to metal(loid)s due to the accumulation of metal(loid)s in vegetables [11,12]. Therefore, systematically investigation on metal(loid)s contamination in vegetables and assessment the related human health risks are necessary and imperative.
Daye City in Hubei Province, China, has a long mining history of more than 3000 years. However, the environment of this city had been damaged seriously while mining was heavily exploited for promoting economic development, especially for the soils in the mining area [13]. Many studies have appeared dealing with the metal(loid) contamination in Daye City. For example, Du et al. reported the data concerning concentrations of heavy metals in soils in 2015 [14], Zhang et al. studied the contamination of sediments of Daye Lake in 2014 [15] and Xiao et al. studied the health risk of heavy metals in soils in 2017 [16]. Existing studies have shown that the soil in Daye is polluted by metal(loid)s, creating a risk to both ecology and the population. Yet, the health risk caused by food consumption has not been further explored. In addition, the focus of more existing studies on the human health risk assessment is often concerned with the environmental quality parameters involved in the evaluation method. Human exposure parameters often refer to the exposure parameter manual directly [17,18,19]. Health risk assessment carrying out environmental quality surveys and human exposure parameter surveys are rarely reported [20].
This study was carried out in Daye City, Hubei Province. The aim of the present work was to estimate the environmental impact of major and trace elements, including copper (Cu), zinc (Zn), arsenic (As), cadmium (Cd) and lead (Pb) in samples of soils and vegetables in the mining hinterland, which were selected according to the preliminary investigation results. The enrichment characteristics of metal(loid)s from soil to vegetables were studied in detail. At the same time, a questionnaire survey was conducted among the residents in Daye to explore the related exposure parameters of the local population through vegetable consumption. Furthermore, health risks were calculated taking into account the contribution of vegetable consumption. The results will provide a reliable scientific basis for the safety management of soil and vegetables in the mining area and supply some reference for preventing the pollution of metal(loid)s from harming human health. In addition, the results and methods of this research can make sense in similar areas and provide some reference values for other polluted areas around the world.
2. Materials and Methods
2.1. Study Site
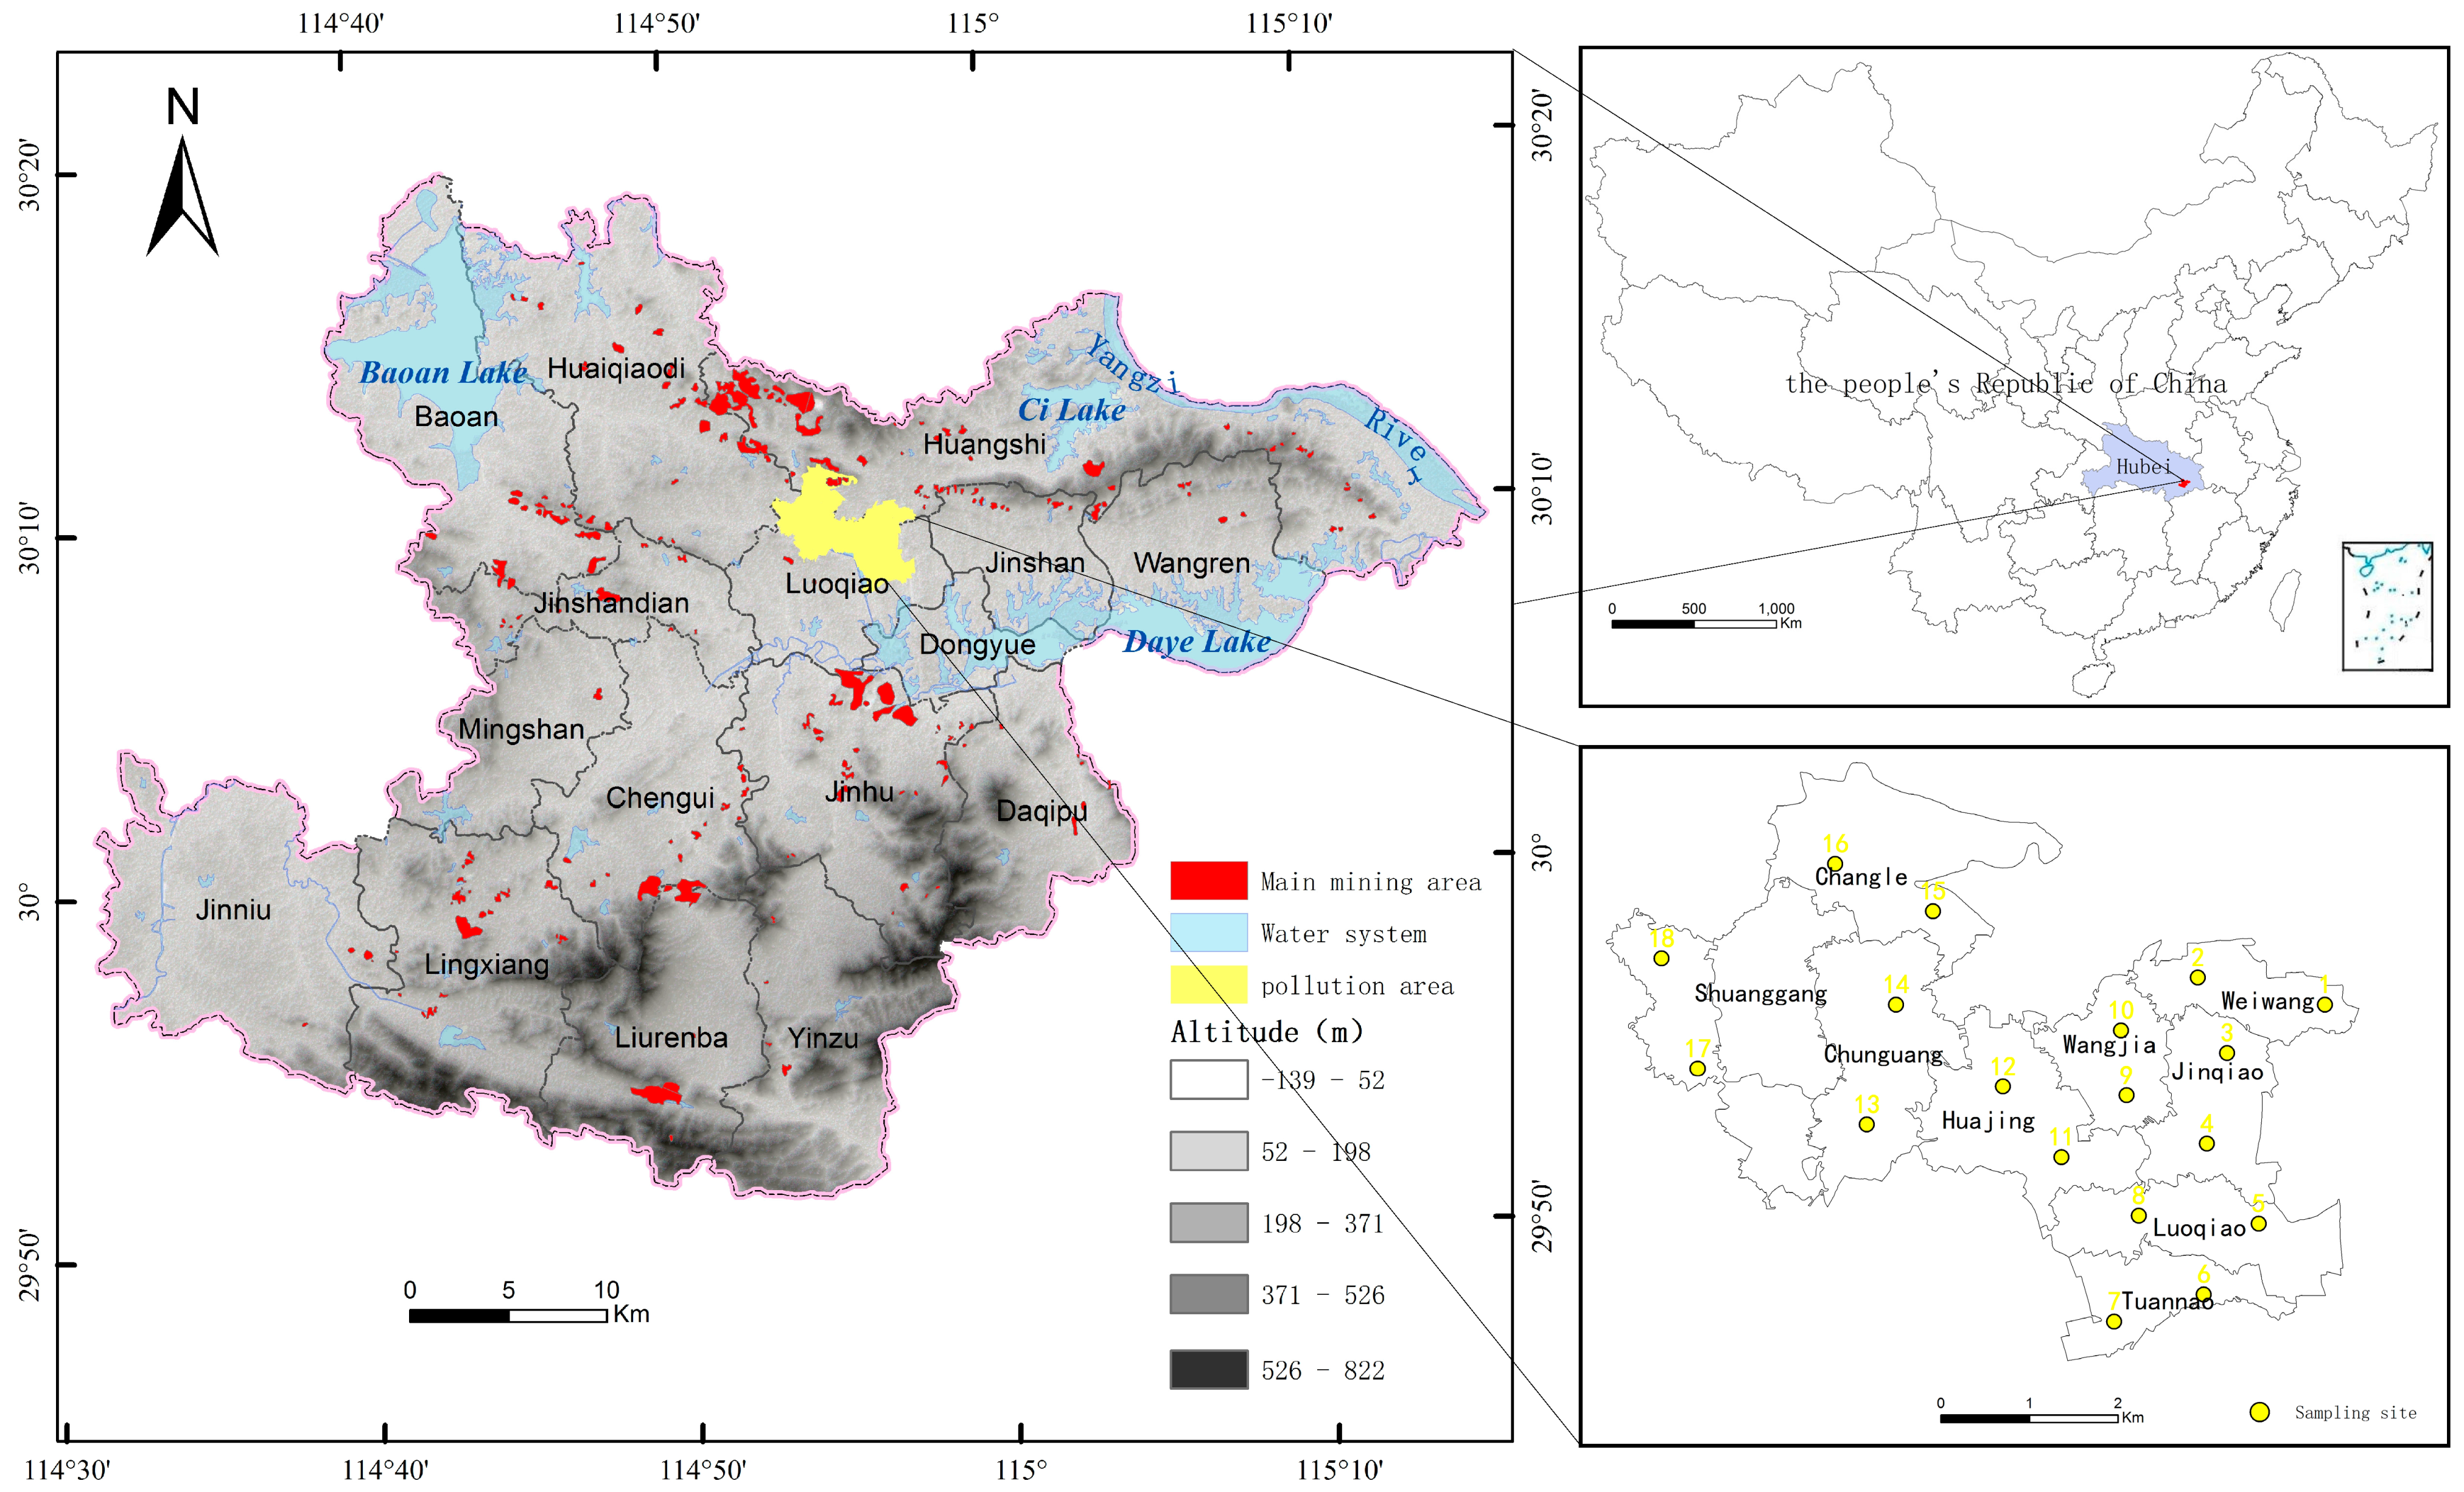
The study was carried out in a famous mining city in China’s Daye City, at east longitude 114°31′–115°20′, latitude 29°40′–30°15′. The zonal soil is red earth. The topsoil is a brown, loose and humus layer and its organic matter content is 1.5–2% and the pH value is 6.5–7.5. As a result of the intensive industrial activities in local areas, including non-ferrous metal mining, metal smelting and processing, Daye City has become a typical heavy metal and metalloid pollution area in China. The 2008 survey of the environmental protection department in the Chinese Ministry of Agriculture showed that the heavy metal pollution area of agricultural land in Daye reached 25 acres, mainly distributed across Jinhu, Dajipu, Luojiaqiao, Chengui and Jinshandian residential districts [21]. According to the investigation of soil pollution in Hubei Province in 2009, the contents of heavy metals such as As, Cd, Pb and Zn, in the surrounding area of Daye Nonferrous Smelter, exceeded recommended levels [22]. Thus, 9 villages near Daye Nonferrous Smelter (within 10 km range) have been chosen as the study area (Figure 1), which includes Weiwang Village, Wangjia Village, Luoqiao Village, Changle Village, Tuannao Village, Chunguang Village, Huajing Village, Guantang Village and Jinqiao Village (the total area is 29.82 km2).
2.2. Sampling and Analyzing
A total 18 samples of agricultural topsoil (0–20 cm) were collected from the study area in November 2015 referring to HJ/166-2004 (China, 2004) [23]. Soils were sampled in a completely randomized design based on land use. Each sample was a mixture of ten samples which were collected within a distance of 10 m surrounding a specific sampling location. 1 kg of soil was selected from the mixed samples by the quartile method. The samples were air-dried, crushed to powder (200 mesh) and homogenized. The soil samples were digested using USEPA Method 3052 (USEPA, 1996) [24]: a soil sample of up to 0.5 g is digested in a mixture containing 9 mL of concentrated nitric acid and 3 mL hydrofluoric acid for 15 min using microwave heating with a suitable laboratory microwave procedure. The temperature profile was specified to permit specific reactions and incorporated reaching 180 ± 5 °C in approximately less than 5.5 min and remaining at 180 ± 5 °C for 9.5 min for the completion of specific reactions. After cooling to room temperature, the vessel contents were filtered, centrifuged, or allowed to settle and then decanted, diluted to a certain volume and analyzed by the appropriate method.
The sampling of vegetables was conducted twice in winter of 2015 and summer of 2016, respectively. Vegetables were sampled in points corresponding to the soil sampling sites. All types of vegetables within a distance of 10 m surrounding a specific sampling location was collected. Each composite sample was a mixture of five samples. A total of 141 vegetable samples are divided into the following three categories: (1) leguminous vegetables (N = 24): bean and young soybean; (2) leafy vegetables (N = 51): amaranth, water spinach and sweet potato leaf; (3) fruit vegetables (N = 66): tomato, pepper, balsam pear, towel gourd and eggplant. The edible portions of vegetables were washed three times with distilled water and finally rinsed with deionized water and dried. The edible parts of vegetables were selected for digestion according to Chinese provincial standard of DB53/T288-2009 [25]. A representative sample of 2–5 g in three-necked flasks (Shuniu, GG-17) with nitric acid were soaked overnight. The vegetables were heated and digested on an electric heating plate (Beingjing Heng Odd, HAD-DB-3A) after a small funnel (Kimble, AK28950-00055) was arranged at the mouth of the bottle. If the decomposition was not completed or a darker color was observed when the volume of digested liquid is about 10 mL, the reaction was cooled and more nitric acid was added. The process was repeated until the digestive solution was colorless, transparent, or yellowish. A mixed acid of nitric acid and perchloric acid solution (4:1) was then added and evaporated until white smoke appeared. The mixture was then cooled and a small amount of 0.5 mol/L nitrate was added, followed by washing the bottle wall with a small amount of water. The flask was placed onto a heating plate to eliminate excessive nitrate. The digestion liquid was moved into a 10 mL bottle (i-quip, V2846-10 mL-2EA), fixed to the scale and the spare parts were kept. The reagent blank was prepared at the same time.
All the reagents in the analysis process were in excellent purity and ultrapure water was used. The concentrations of Cu, Zn, As, Cd and Pb were analyzed by inductively-coupled plasma mass spectrometry (ICP-MC, PerkinElmer NexIon350x). Each batch of testing blank and the parallel samples were analyzed at the same time. Quality control was conducted using soil and plant standard reference materials. The relative deviation between the parallel samples was controlled within 10% according to the references [26,27].
2.3. Dietary Survey
Due to the geographical habits between different regions, dietary preferences, physical conditions and other differences, it is not appropriate to use the national exposure parameters of China directly. Thus, the questionnaire on the exposure parameters of the Daye area was designed, which mainly covered the problems related to the calculation of dietary route exposure, including gender, age, height, weight and other individual characteristics and food types, consumption, frequency, time and other dietary exposure parameters.
The investigation area was concentrated in Yangqiao Village, Wangjiazhuang Village and Jinqiao Village, which were randomly selected from the study area. A serial of interviews with local residents of these three villages was conducted in December 2015. A total of 400 questionnaires were issued and 389 valid questionnaires were obtained. After data inputting, SPSS software was used for statistical analysis.
2.4. Human Health Risk Assessment of Metal(loid)s
Health risk assessment in Europe and America has been developed for a long time. The RBCA (risk-based corrective action) model, the CLEA (Contaminated Land Exposure Assessment) of America model and the CSOIL (contaminated soil) model of Holland have been widely used [28,29]. However, health risk assessment was carried out in China much later and the evaluation mode has not yet been pertinently established regarding the applicability in domestic areas. Most of studies in China refer to the mature methods of evaluation in foreign countries. The existing studies show that the USEPA health risk assessment model is widely used both at home and abroad [30]. Therefore, the study adopted the USEPA model to assess the residents’ health risk from vegetable consumption and the human health risk can be calculated using the following equations:
where ADD represents daily exposure dose (mg∙kg−1∙d−1). C represents the concentration of heavy metals and metalloids in vegetables (mg∙kg−1). IR represent the daily vegetable consumption (kg∙d−1). EF represents the exposure frequency (365 d∙a−1). ED represents the exposure duration (a). BW represent the body weight (kg). AT represents the average exposure time (d). HQ represents the hazard quotient of heavy metals and metalloids. RfD represents the contaminants in an exposure pathway of the reference dose (mg∙kg−1∙d−1). HI represents the sum of two or more HQs for all potentially toxic elements and for each exposure route. Riski is the carcinogenic risk. SF is carcinogenic slope factor (kg∙d−1∙mg−1). RiskT is the sum of the risk values of various heavy metals and metalloid carcinogenic risk.
The values of RfD for Cu, Zn, As, Cd and Pb were 0.037, 0.3, 0.3 × 10⁻³, 1.0 × 10⁻³ and 4 × 10⁻³ mg kg−1∙d−1 and the values of SF for As, Cd and Pb were 1.5, 0.38 and 0.0085 [31,32]. The method recommended by Li et al. [33] was used to convert As to the inorganic As content.
When HQ is lower than 1 there is no serious risk; while HQ is equal to, or higher than, 1, the exposed population is likely to experience an adverse effect. According to USEPA recommended maximum acceptable risk value of 10−4, if RiskT is lower than 10−4, the carcinogenic damage to the human body can be ignored. When RiskT is higher than 10−4, the human body would be affected by carcinogenic hazards [34].
2.5. Data Statistics and Analysis
The sample plots were drawn using ArcGIS, all the data was input into Excel and the significant differences were analyzed by SPSS 17.0, including single sample t-test, independent sample t-test and one-way analysis of variance (ANOVA). The level of significant difference was 0.05 due to the referencing literatures [35,36].
3. Results and Discussion
3.1. Concentrations of Metal(loid)s in Soils
The metal(loid) content of the soil in the study area is shown in Table 1. The content of Cu, Zn and Cd of 18 soil samples from the study area were significantly higher than the background value of the Daye area [37]. The maximum concentration levels of five types of metal(loid)s was not only far higher than the background value of the Daye area but also higher than the Chinese national secondary standard value in Environmental Quality Standard for Soils (GB15618-1995) issued by State Environmental Protection Administration, (SEPA, 1995); The minimum concentration levels of five types of metal(loid)s are close to the background value, below the limit of the standards prescribed by the state. However, the average values indicated that the concentrations of five types of metal(loid)s were higher than the background value. The average concentration values of Cu and Cd are higher than the background values by five times and 7.7 times, respectively. In the study area, the concentrations of Zn and Pb in all soils types were lower than the permissible level. The excessive rate of Cu was 77.8%. The excessive rates of As were 11.1%. The excessive rates of Cd were 88.9%. Among the nine sampling sites, the metal(loid) pollution in Weiwang village and Changleshan village is relatively serious, especially in Weiwang village. The metal(loid) concentrations in Tuannao village did not exceed the standards. Figure 1 shows the mining activity around Weiwang village and Changle village is strong and Tuannao village is a certain distance from the mining activity area. The pollution of Weiwang village is the most serious, possibly because it is closest to the Daye nonferrous metal smelter. The difference of contents in study areas may be caused by topography, the development degree of the sampling point, the distance from the pollution source and other factors. The single factor indices of five types of metal(loid)s was a benchmark to represent the degree of pollution. Single factor indices of As, Pb and Zn exhibited no significant difference, which means the As, Pb and Zn are at the same level of pollution. According to the significant difference test, the pollution degree of five types of metal(loid)s showed the characteristics order of Cd > Cu > Zn, Pb, As. In summary, Cu and Cd are the major contamination elements.
In comparison with the existing research in Daye City, Yin [38] reported that the degree of heavy metal pollution in the soil in Daye Lake farmland ranked as Cd > Cu > Pb > Zn; Song [39] showed that the pollution degree of heavy metals and metalloids in soils around Tonglushan Mine in Daye ranked as Cd > Zn > Pb, As. The research of Du showed that the soil in Daye City was polluted by Cd. We found that the most serious soil pollution in the whole city of Daye was Cd. The results show that the pollution of Cu is serious, which is slightly different from the others and this is probably because the research areas chosen were near the mine area.
3.2. Concentrations of Metal(loid)s in Different Types of Vegetables
Concentrations of Cu, Zn, As, Cd and Pb were determined in vegetables grown in the investigated sampling sites. The values are given in Table 2. The data are close to the relevant values reported in other literature in Daye City [38]. The trace elements necessary for the plant (Cu and Zn) are abundant in all type of vegetables but they are within the permissible levels proposed by the Chinese government. However, the concentrations of As, Cd and Pb in the contaminated area were higher than the permissible level indicating that they might cause a potential risk for humans. In terms of the average values, the order of the concentration for As, Cd and Pb was found to be leafy vegetables > fruits vegetables > leguminous vegetables. The order for Zn was found to be leguminous vegetables > leafy vegetables > fruits vegetables. The order for Zn was found to be leafy vegetables > leguminous vegetables > fruits vegetables.
Excessive rate of metal(loid)s in vegetables are shown in Table 3. In the study area, the concentrations of Cu and Zn in all vegetable types were lower than the permissible level. The excessive rate of Pb in the leguminous vegetables was 12.50%. The excessive rates of As, Cd and Pb in the leafy vegetables were 5.88%, 17.65% and 5.88%, respectively. The excessive rates of Cd and Pb in the fruit vegetables were 50.00% and 22.73%, respectively.
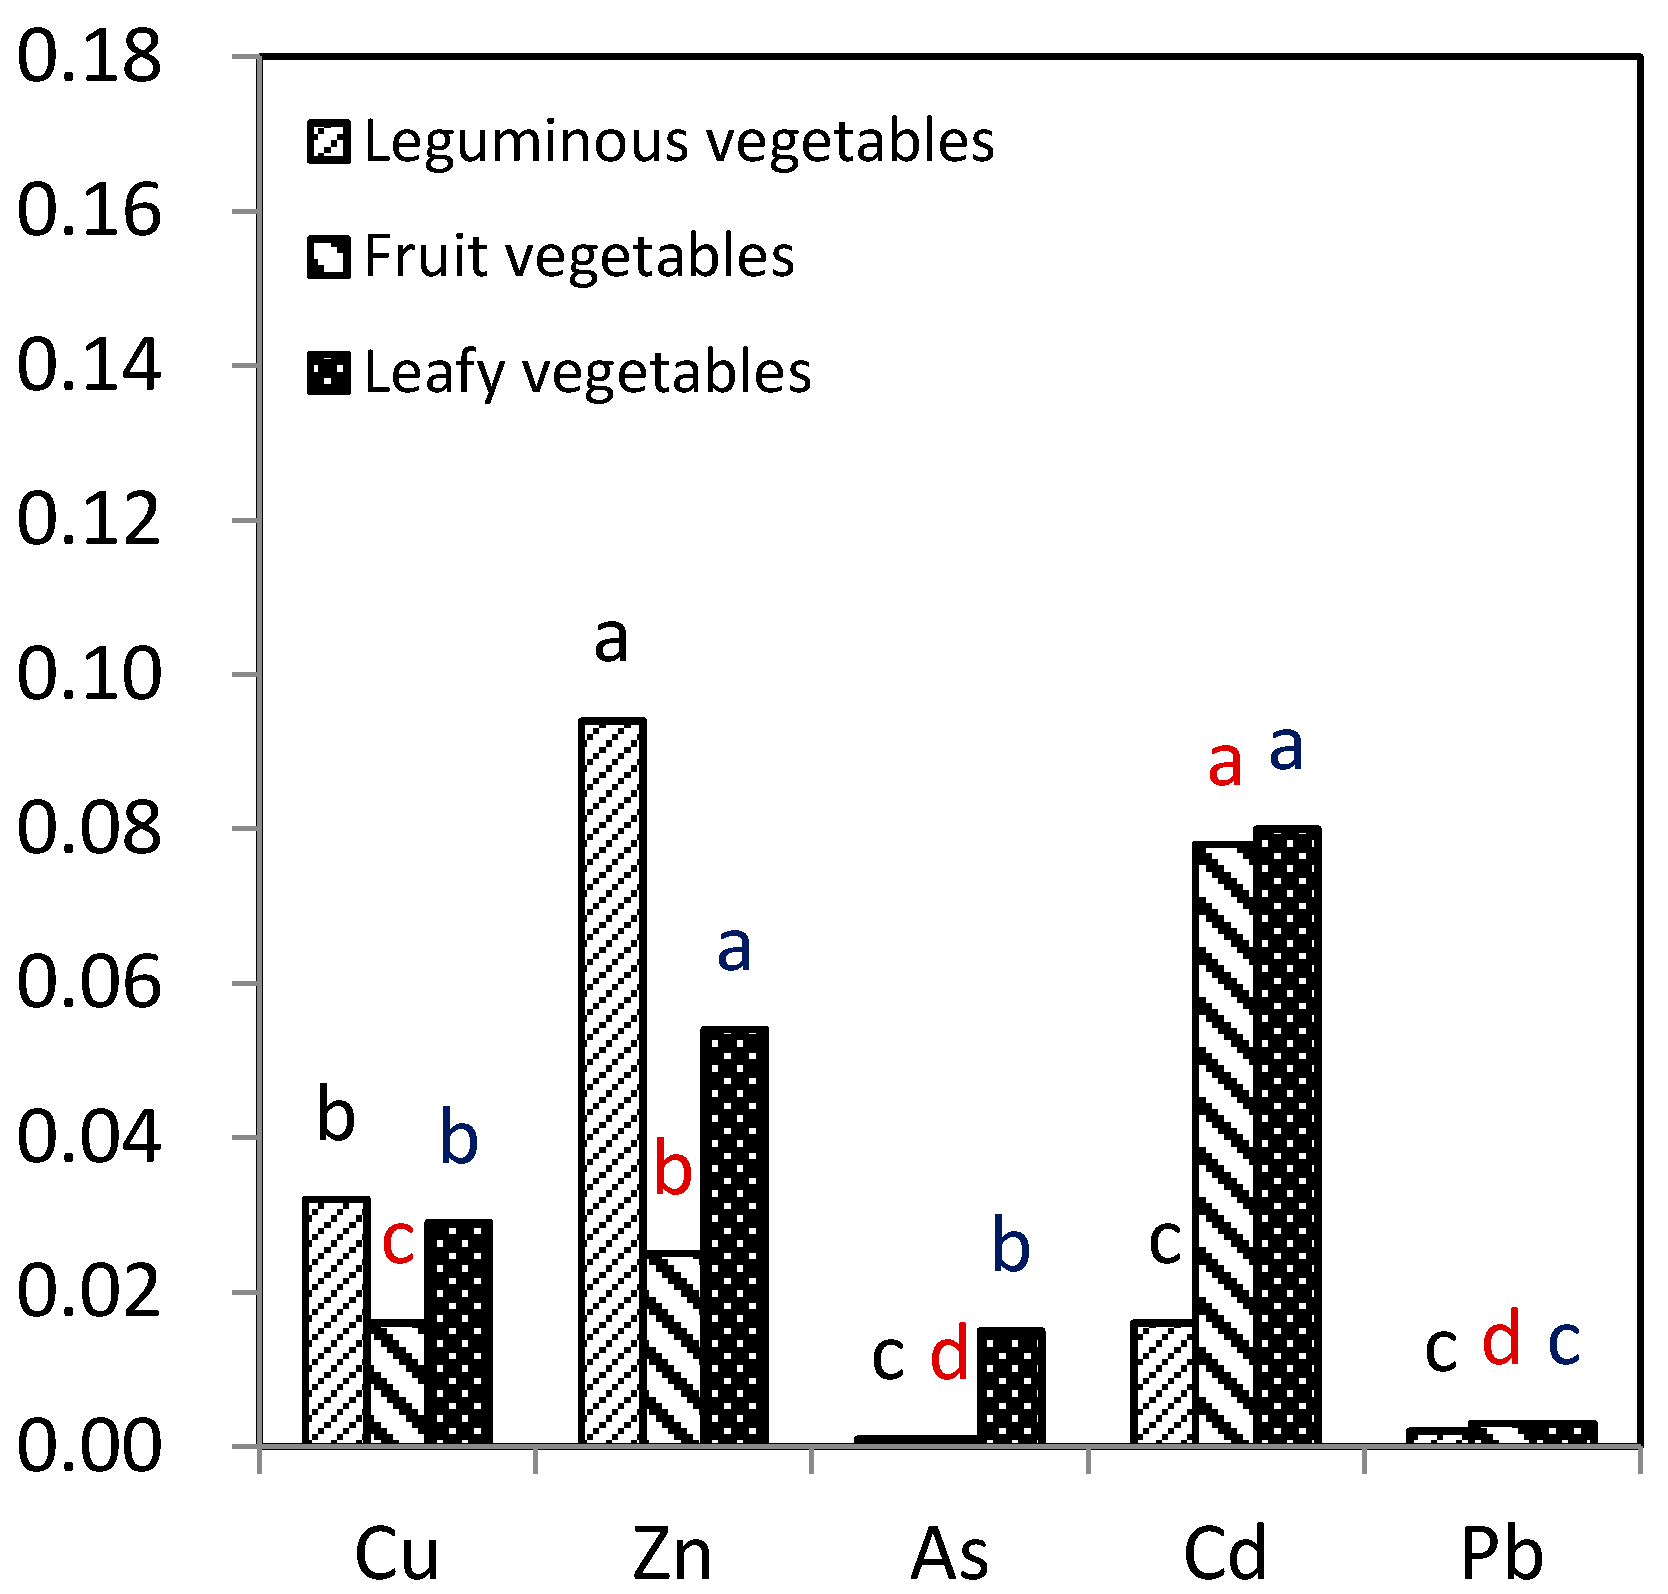
In view of the transfer factor of metal(loid)s in different vegetable types (Figure 2), the transfer factor showed a decreasing order of leguminous vegetables > leafy vegetables > fruit vegetables for Cu and Zn elements; while for As, Cd and Pb elements, the transfer factor showed a decreasing order of leafy vegetables > fruit vegetables > leguminous vegetables. The results mean that the absorptive capacity of Cu and Zn in leguminous vegetables was higher and the absorptive capacity of As, Cd and Pb in leafy vegetables was relatively higher. Cu and Zn are trace elements needed by the human body and leguminous vegetables tend to enrich trace elements. For the leguminous vegetables, the transfer factor showed a decreasing order of Zn (0.094) > Cu (0.032) > Cd (0.016), Pb (0.002), As (0.001). For the fruit vegetables, the transfer factor showed a decreasing order of Cd (0.078) > Zn (0.025) > Cu (0.016) > Pb (0.003), As (0.001). For the leafy vegetables, the transfer factor showed a decreasing order of Cd (0.080), Zn (0.054) > Cu (0.029), As (0.015) > Pb (0.003). In general, the transfer factor of all the vegetable samples showed a decreasing order of Cd (0.068), Zn (0.047) > Cu (0.023) > As (0.006), Pb (0.002), indicating that Cd is easier to transfer from soil to edible parts of vegetables. Thus, Cd needs to be strictly monitored (all sorting is based on the significant difference test results of SPSS at a 0.5 significance level).
The study of Hu [40] has shown that leafy vegetables are more likely to accumulate metal(loid)s than fruits and vegetables, which is consistent with the high enrichment coefficient of leafy vegetables in this paper. Xu [41] and Chen [42] have reported that the enrichment coefficient of Zn was significantly higher than other metals, which is consistent with the higher transfer factor in Zn. However, the Cd transfer coefficient was equivalent to Zn, probably because of the higher content of soil metal(loid)s in Daye which increased the enrichment ability of metal(loid)s in vegetables [43,44].
3.3. Analysis of Residents’ Dietary Exposure
The results of the investigation on the exposure parameters of children, adolescents and adults in the investigated area are presented in Table 4. It can be seen from the table that the distribution of the survey sample is not uniform, especially, the number of teenagers is small, which may be related to the reason that the population of the age in rural areas are mainly migrants or students.
Table 4 indicates that the exposure parameters of the height, body weight and vegetable consumption of adults in the study area are consistent with the national average level [45], which is slightly higher than the national average, except for the vegetable consumption. The weight, height and vegetable intake of each age group are generally close to the results of related research reports [46] and some parameters, such as adults’ and children’s weight are slightly different. However, the study differs from the research results of Peng et al. in Lanzhou City [47], which means that it is necessary to investigate the exposure characteristics of different regions in order to reduce the uncertainty of the health risk assessment results.
ED values of all ages used the average of the survey results and the lifetime-AT (carcinogenic) of all ages referred to the China’s Health Statistics Yearbook 2012. With the passage of time, life expectancy is increasing, which is related to the improvement of social life, economy and medical conditions. It is worth particularly pointing out that previous studies rarely consider the differences in the duration of exposure and life expectancy in different ages and the use of fixed value uniformity is different from the actual situation, obviously.
On the other hand, the survey results also show that the environmental health risk exposure parameters of the population not only have differences in ethnicity, region and so on. Even in the same area, the dietary habits of different individuals will affect individual exposure differences. It can be found from this survey that, in addition to the small changes in body weight, height and other parameters, the vegetable consumption of children, adolescents and adults have shown a large individual differences, which can be seen from the comparison of the maximum values, minimum values and the standard deviation of the vegetable consumptions from different ages.
3.4. Health Risk Assessment of Metal(loid)s through Consumption of Vegetables
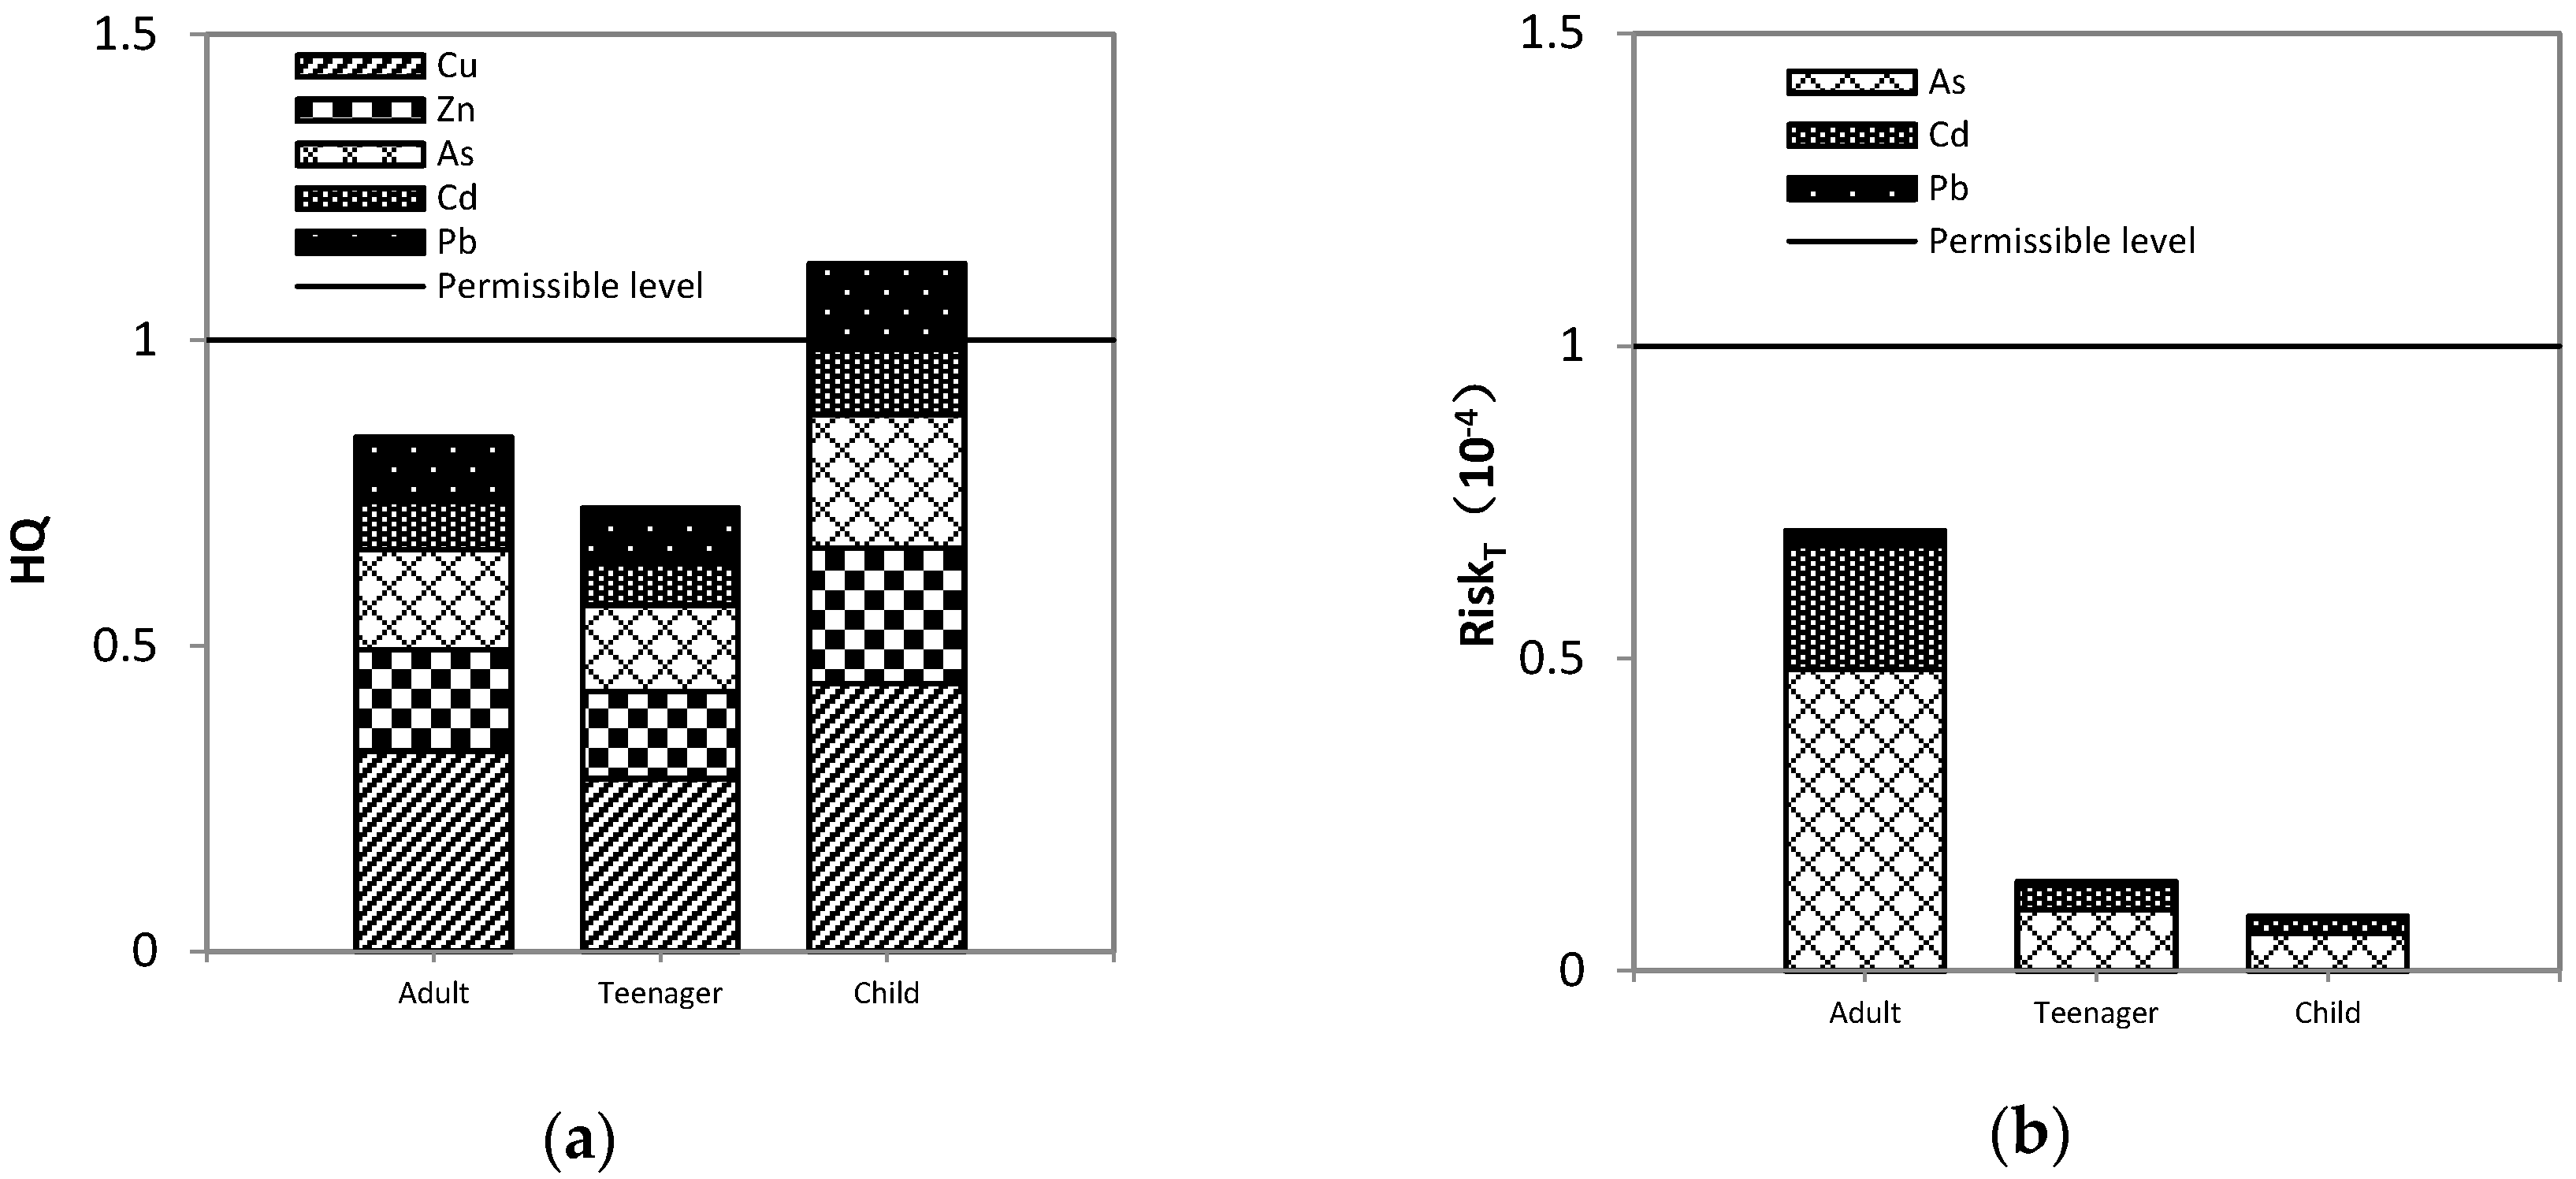
The health risks of leguminous vegetables are shown in Figure 3. The results showed that only children suffered from non-carcinogenic risk and the health risk quotients and carcinogenic risk of other populations were lower than the permissible levels recommended by the US Environmental Protection Agency. The risk of metal(loid)s in vegetables to other people’s health was acceptable. From the contribution rate of different metal(loid)s, the non-carcinogenic risk in the contaminated area followed the decreasing order of Cu > Zn > As > Pb > Cd. The contribution rate of Cu is 39.0%, followed by Zn with a contribution rate of 19.7%, As with a contribution rate of 19.4%, Pb with a contribution rate of 12.4% and Cd with a contribution rate of 9.4%. The carcinogenic risk in the contaminated area followed the decreasing order of As > Cd > Pb. The contribution rate of As was 68.5%, followed by Cd with the contribution rate of 28.2%. The results suggest that leguminous vegetable consumption should take into account the non-carcinogenic effects of Cu, Zn and As and the carcinogenic effects of As.
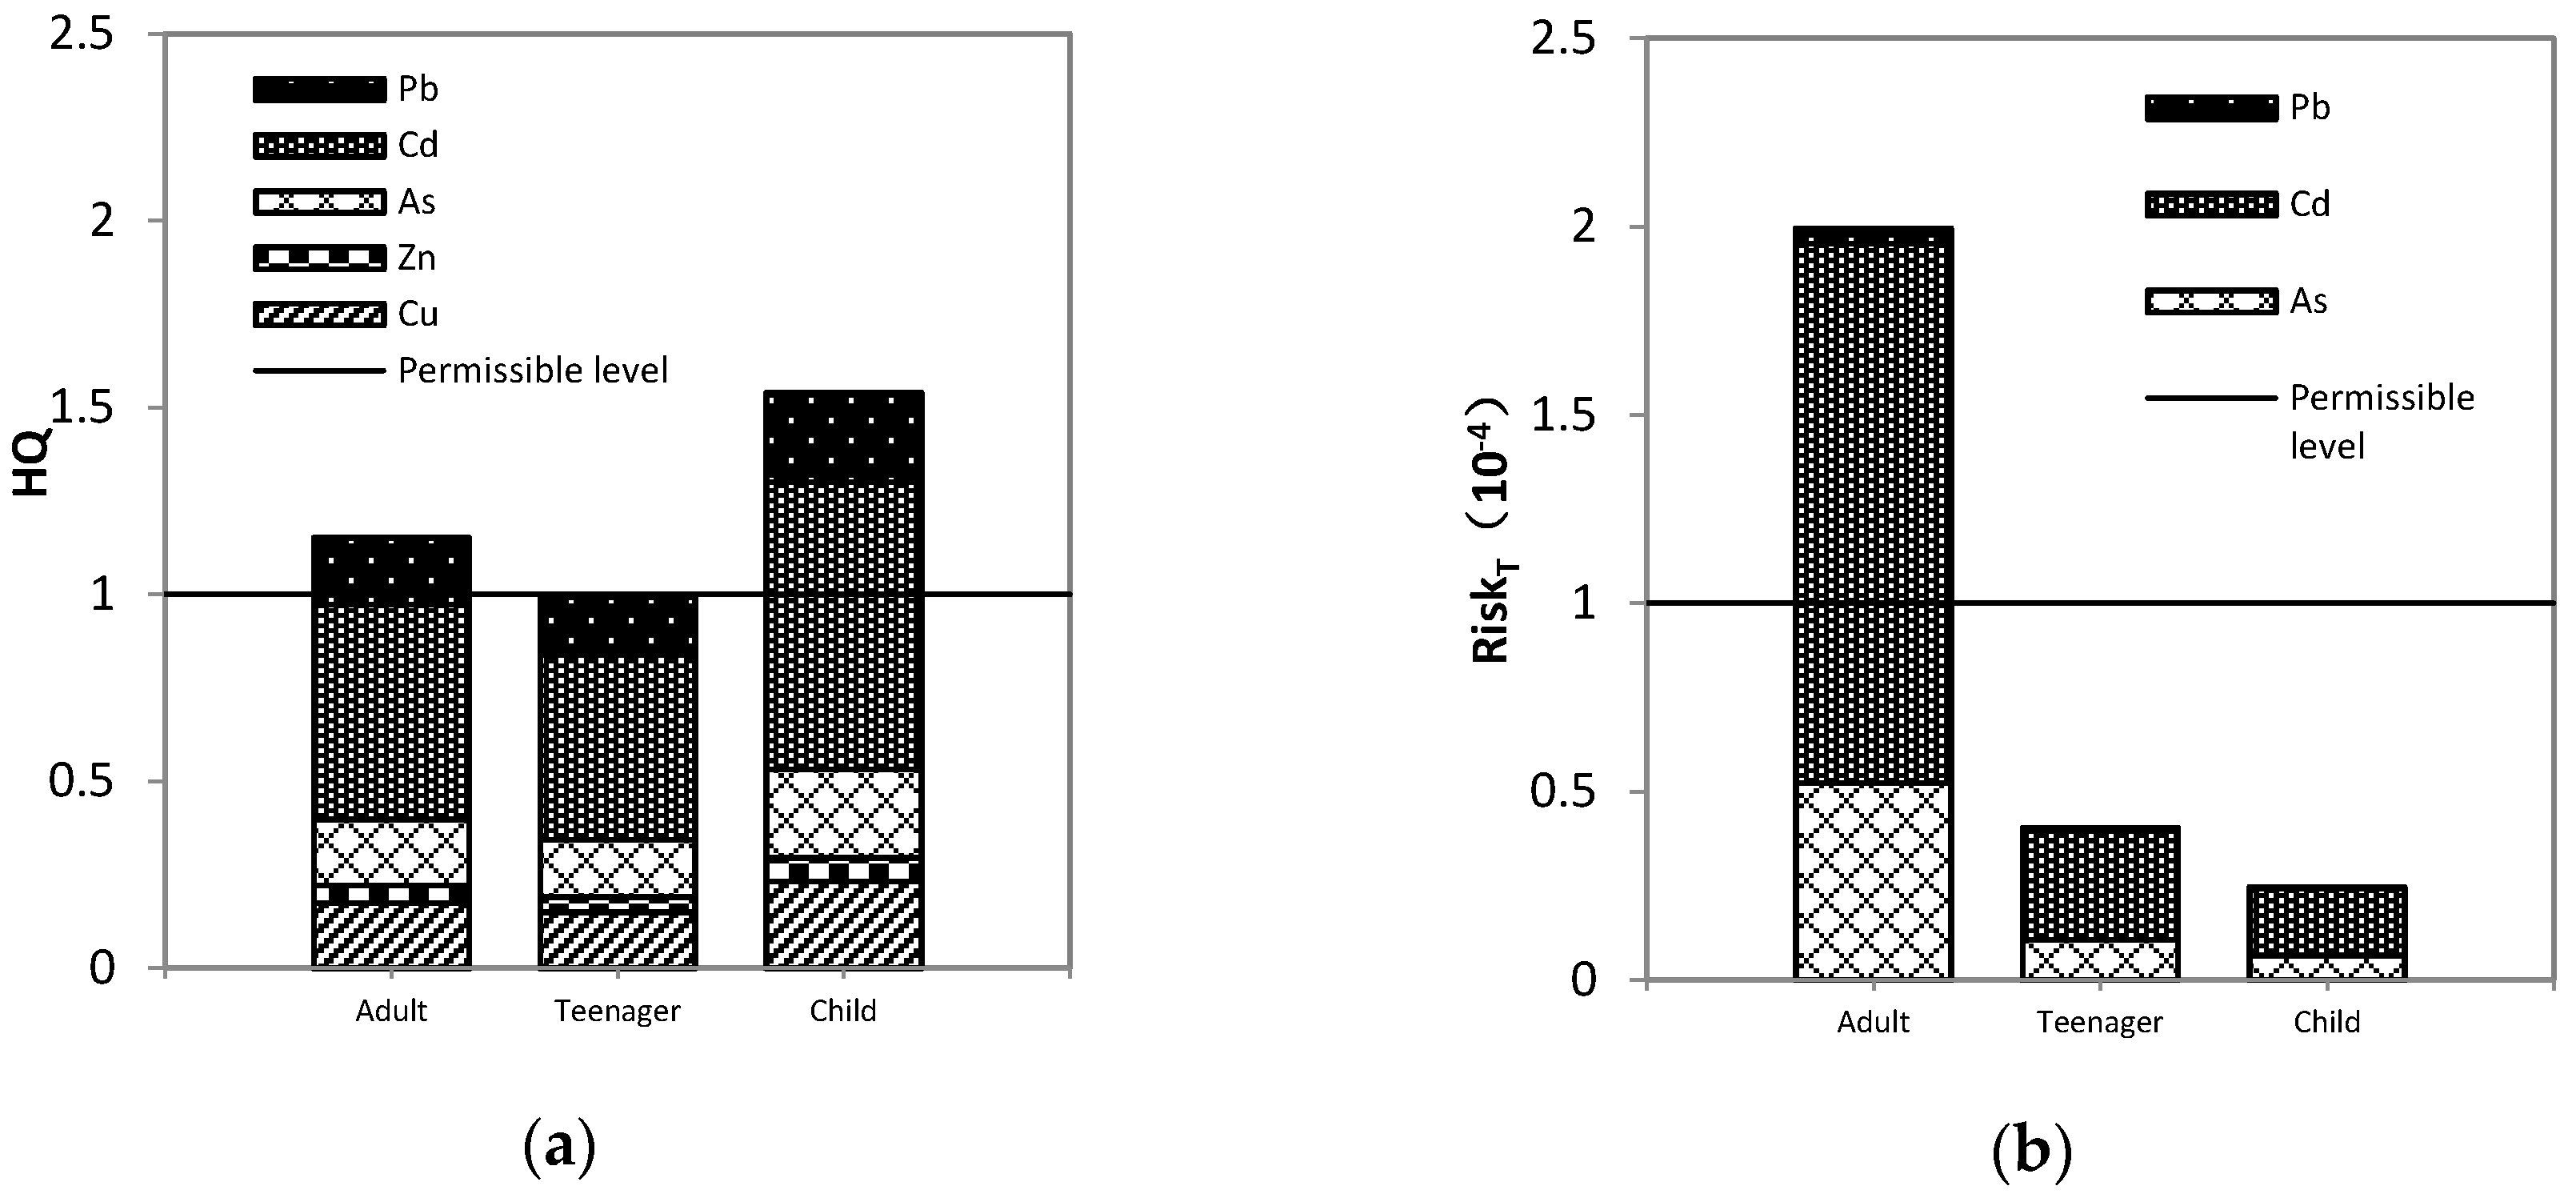
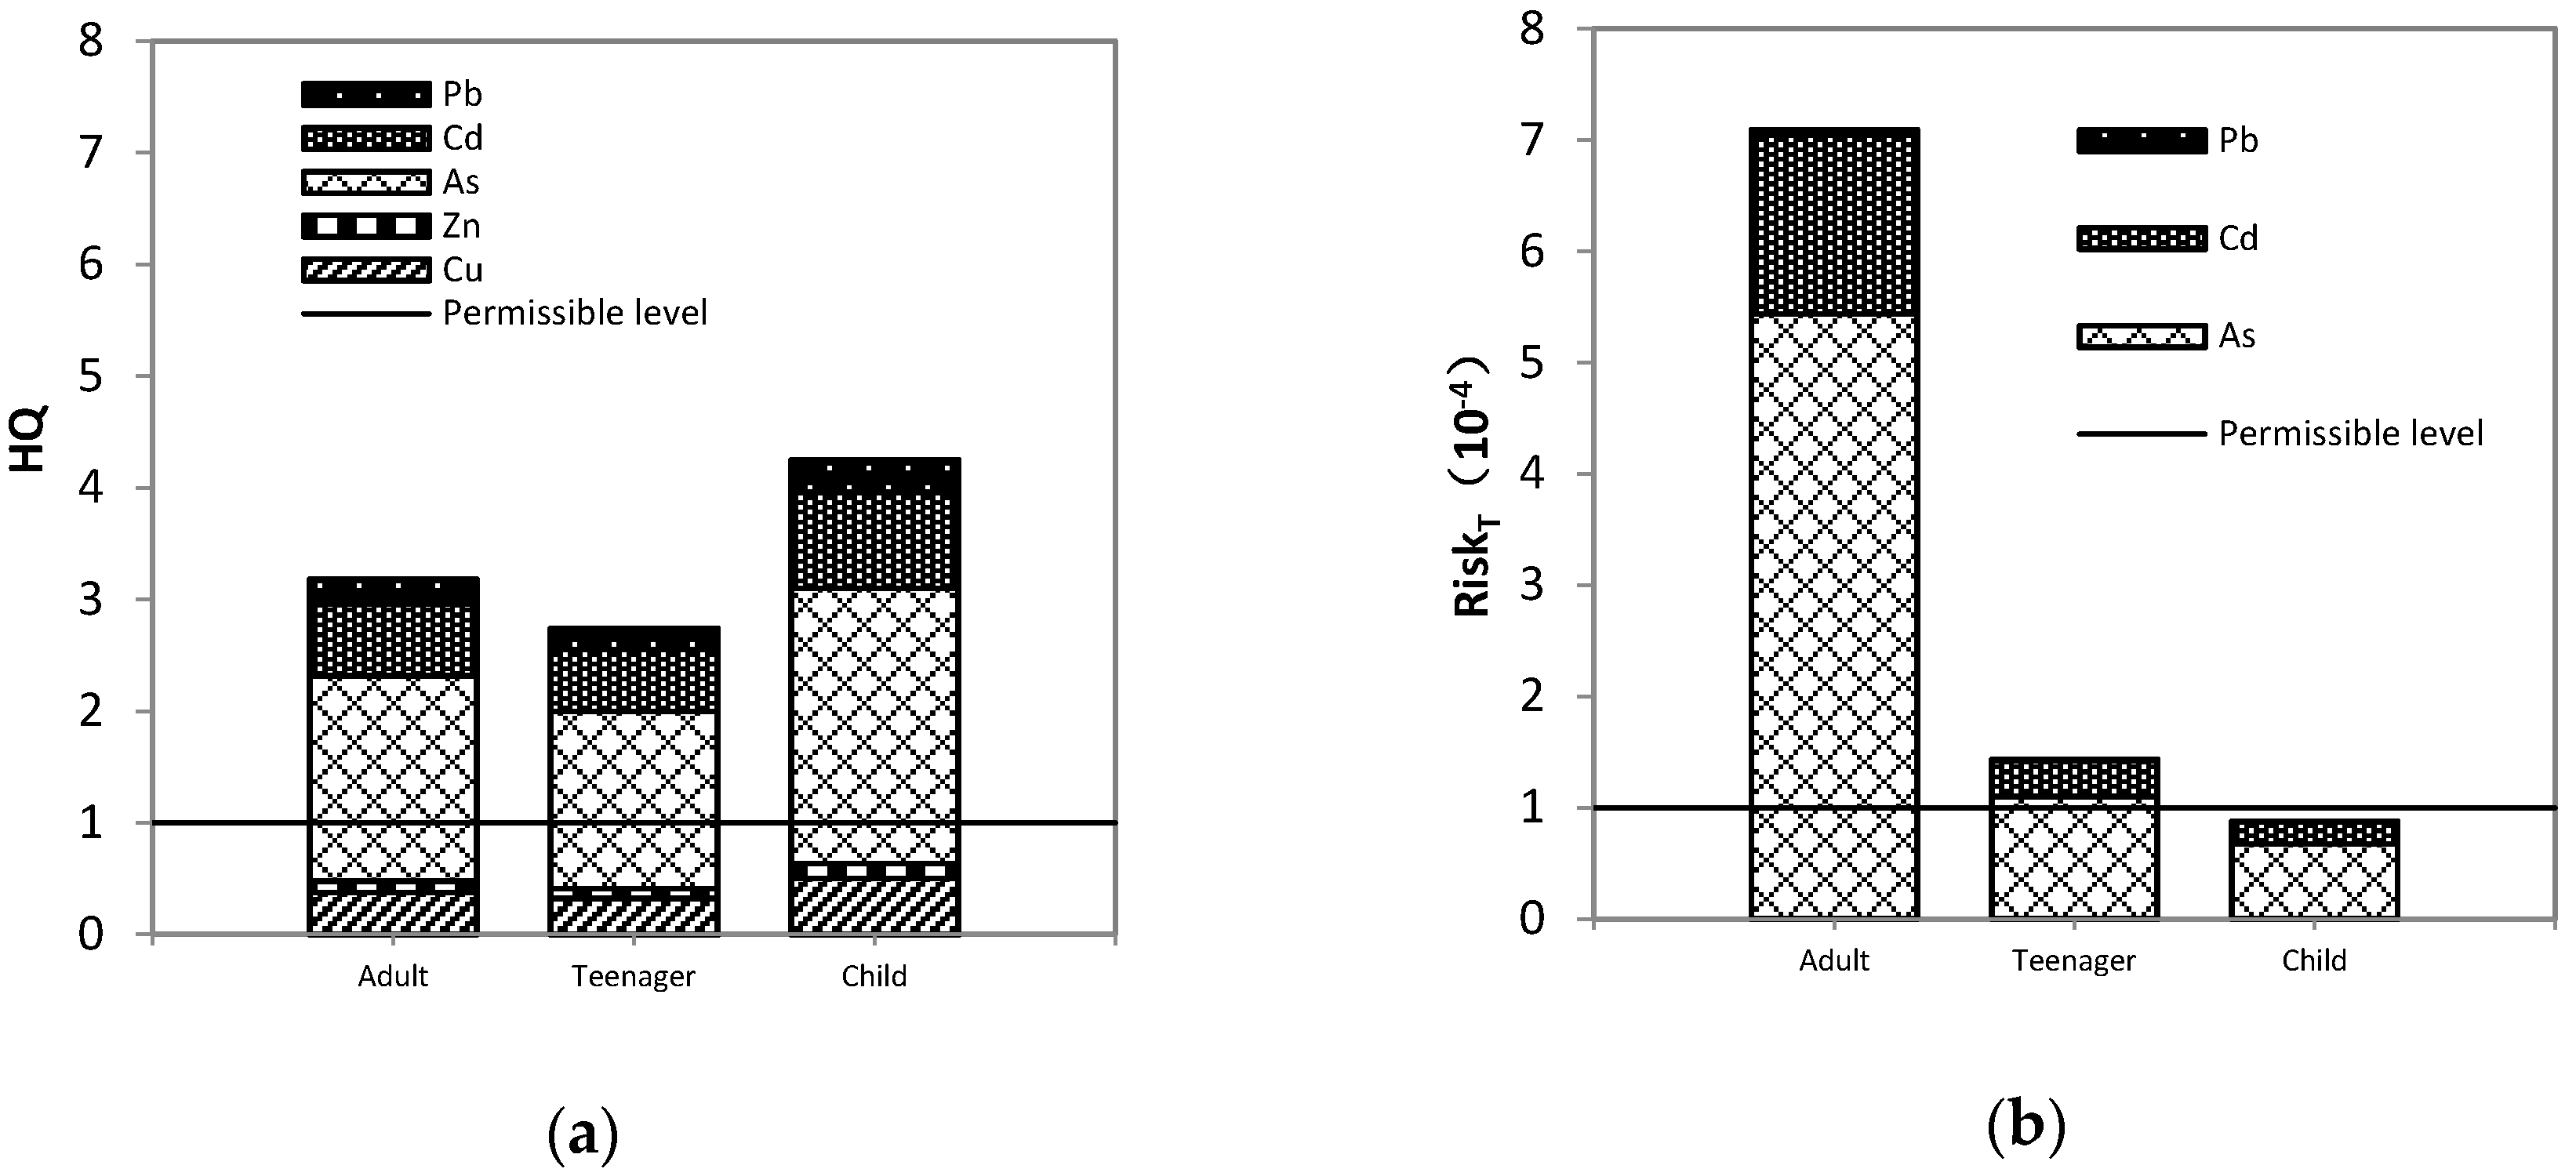
The health risks of fruit vegetables are shown in Figure 4. The results showed that the non-carcinogenic risk to all people was higher than the permissible levels and only adults suffered from the carcinogenic risk. The carcinogenic values of other populations were lower than the permissible levels. From the contribution rate of different metal(loid)s, the non-carcinogenic risk followed the decreasing order of Cd > Pb > As > Cu > Zn. The contribution rate of Cd is 49.9%, followed by Pb with a contribution rate of 15.5%, As with a contribution rate of 15.4%, Cu with a contribution rate of 15.1% and Zn with a contribution rate of 4.1%. The carcinogenic risk in the contaminated area followed the decreasing order of Cd > As > Pb. The contribution rate of As was 71.8%, followed by Cd with a contribution rate of 26.2%. The results indicate that fruit vegetable consumption should particularly take into account the non-carcinogenic effects of Cd, Pb, As and the carcinogenic effects of Cd and As.
The health risks of leafy vegetables are shown in Figure 5. The results show that only children did not suffer from the carcinogenic risk and the risks of other populations were higher than the permissible levels. The results indicate that metal(loid)s in leafy vegetables are easy to create health hazards in the population. From the contribution rate of different metal(loid)s, the non-carcinogenic risk in the contaminated area followed the decreasing order of As > Cd > Cu > Pb > Zn. The contribution rate of As is 57.9%, followed by Cd with a contribution rate of 20.3%, Cu with a contribution rate of 11.8%, Pb with a contribution rate of 6.8% and Zn with the contribution rate of 3.2%. The carcinogenic risk of the contaminated area was As > Cd > Pb. The contribution rate of As was 76.7%, followed by Cd with the contribution rate of 22.7%. The results suggest that leafy vegetable consumption should particularly take into account the non-carcinogenic effects and carcinogenic effects of As and Cd.
Generally, according to the results shown in Figure 3, Figure 4 and Figure 5, in view of the factor of age, the non-carcinogenic risk values followed the decreasing order of children > adults > adolescents and the carcinogenic risk values followed the decreasing order of adults > adolescents > children. The difference of the non-carcinogenic risk between the different age groups was not obvious, while the difference in carcinogenic risk between the different age groups was obvious. Due to the accumulation of the carcinogenic risk, the exposure time of adults is much greater than adolescents and children, thus, the cumulative carcinogenic risk was more significant than for adolescents and children. From the type of metal(loid) elements, As and Cd are the main factors among the five metal(loid)s of vegetables that have affected people’s health in the study area, therefore, they need strict monitoring. From the types of vegetables, the health risk values followed the decreasing order of leafy vegetables > fruit vegetables > leguminous vegetables. Our study is consistent with the reported results [48], which showed a higher risk of leafy vegetables than other vegetables. This is due to the higher levels of Cu and Zn in leguminous vegetables and higher levels of As, Cd and Pb in leafy vegetables. The risk factors of As, Cd and Pb are higher than those of Cu and Zn. Local residents can reduce the leafy vegetable consumption and intake more fruit and leguminous vegetables to reduce the potential and long-term health risk.
4. Conclusions
Compared with the background value of Daye, the pollution degree of the five metal(loid)s followed the decreasing order of Cd > Cu > Zn, Pb, As. Compared with the permissible levels of the national standard (GB15618-1995), the concentrations of Zn and Pb in all soil types were lower than the permissible level. The excessive rates of Cu, As and Cd were 77.8%, 11.1% and 88.9% respectively. Compared with the permissible levels in vegetables, the vegetables from the studied areas were seriously polluted by As, Cd and Pb. The transfer factor of Cu and Zn followed the decreasing order of leguminous vegetables > leafy vegetables > fruit vegetables. The transfer factor of As, Cd and Pb followed the decreasing order of leafy vegetables > fruit vegetables > leguminous vegetables. In general, the transfer factor of all the vegetable samples showed a decreasing order of Cd (0.068), Zn (0.047) > Cu (0.023) > As (0.006), Pb (0.002).
From the contribution of five metal(loid)s, Cd and As accounted for the largest sources of regional health risk. Compared with leguminous and fruit vegetables, metal(loid) concentration and the transfer factor of leafy vegetables was higher, which led to the higher exposure risk. The transfer factor and health risk of leguminous vegetables were relatively low; therefore, it was suggested that the residents in the study area should reduce the consumption of leafy vegetables and plant more leguminous vegetables. What calls for special attention is that, the difference in carcinogenic risk between adult, teenager and child groups was much obvious, related to the difference of the non-carcinogenic risk between them.
There are three issues worthy of attention to further research. First, since health risk assessment requires not only the environmental quality data but also the crowd exposure parameters, the researchers should pay attention to compare the differences between the individual exposure and the crowd exposure in particular; second, from the viewpoint of health risks, some environmental quality standards and food safety standards about metal(loid)s should be improved, particularly the standards of As in both soil and vegetables because of its significant damaging impact on human health (SF and RfD values are harsh) according to the result. Finally, the sources and transformation of metal(loid) pollution needs to be further studied to provide a basis for health risk management from the perspective of an entire mining area.
Acknowledgments
This study was financially supported by the Project supported by the China Postdoctoral Science Foundation (2015M582316) and the project was supported by the Humanities and Social Sciences Foundation of Ministry of Education of China (17YJAZH105, 17YJCZH081).
Author Contributions
Jun Yang conceived and designed this study, organized the study, conducted the data collation and analysis and wrote the manuscript. Fuhong Lv performed the experiments, conducted the data collation and analysis and wrote the manuscript. Jingcheng Zhou contributed to conceiving the study, interpretation of the analysis and revision of the manuscript. Yongwei Song contributed to conceiving the study and prepared the datasets. Fei Li contributed to preparing the datasets and the revision of the manuscript. All authors read and approved the final manuscript.
Conflicts of Interest
The authors declare no conflict of interest.
References
- Haigh, M.J. Problems in the reclamation of coal-mine disturbed lands in Wales. Int. J. Surf. Min. Reclam. Environ. 1992, 6, 31–37. [Google Scholar] [CrossRef]
- Filcheva, E.; Noustorova, M.; Gentcheva-Kostadinova, S.V.; Haigh, M.J. Organic accumulation and microbial action in surface coal-mine spoils, Pernik, Bulgaria. Ecol. Eng. 2000, 15, 1–15. [Google Scholar] [CrossRef]
- Pietrzykowski, M.; Krzaklewski, W. Soil organic matter, C and N accumulation during natural succession and reclamation in an opencast sand quarry (southern Poland). Arch. Agron. Soil Sci. 2007, 53, 473–483. [Google Scholar] [CrossRef]
- Khan, S.; Cao, Q.; Zheng, Y.M.; Huang, Y.Z.; Zhu, Y.G. Health risks of heavy metals in contaminated soils and food crops irrigated with wastewater in Beijing, China. Environ. Pollut. 2008, 152, 686–692. [Google Scholar] [CrossRef] [PubMed]
- Chabukdhara, M.; Munjal, A.; Nema, A.K.; Gupta, S.K.; Kaushal, R.K. Heavy metal contamination in vegetables grown around peri-urban and urban-industrial clusters in Ghaziabad, India. Hum. Ecol. Risk Assess. Int. J. 2016, 22, 736–752. [Google Scholar] [CrossRef]
- Li, F.; Qiu, Z.Z.; Zhang, J.; Liu, W.; Liu, C.; Zeng, G.M. Investigation, pollution mapping and simulative leakage health risk assessment for heavy metals and metalloids in groundwater from a typical brownfield, middle China. Int. J. Environ. Res. Public Health 2017, 14, 768. [Google Scholar] [CrossRef] [PubMed]
- Jolly, Y.N.; Islam, A.; Akbar, S. Transfer of metals from soil to vegetables and possible health risk assessment. SpringerPlus 2013, 2, 385. [Google Scholar] [CrossRef] [PubMed]
- Jan, F.A.; Ishaq, M.; Khan, S.; Ihsanullah, I.; Ahmad, I.; Shakirullah, M. A comparative study of human health risks via consumption of food crops grown on wastewater irrigated soil (Peshawar) and relatively clean water irrigated soil (lower Dir). J. Hazard. Mater. 2010, 179, 612–621. [Google Scholar] [CrossRef] [PubMed]
- Radwan, M.A.; Salama, A.K. Market basket survey for some heavy metals in Egyptian fruits and vegetables. Food Chem. Toxicol. 2006, 44, 1273–1278. [Google Scholar] [CrossRef] [PubMed]
- Wang, Y.F.; Li, L.Z. Food safety problem and countermeasure for vegetable in china. N. Hortic. 2014, 15, 194–197. [Google Scholar]
- Zheng, N.; Wang, Q.; Zhang, X.; Zheng, D.; Zhang, Z.; Zhang, S. Population health risk due to dietary intake of heavy metals in the industrial area of Huludao city, China. Sci. Total Environ. 2007, 387, 96–104. [Google Scholar] [CrossRef] [PubMed]
- Gupta, S.K.; Chabukdhara, M.; Singh, J.; Bux, F. Evaluation and potential health hazard of selected metals in water, sediments, and fish from the Gomti River. Hum. Ecol. Risk Assess. Int. J. 2015, 21, 227–240. [Google Scholar] [CrossRef]
- Kang, W.; Bao, J.; Zheng, J.; Xu, F.; Wang, L. Potential of woody plants from a Tonglushan ancient copper spoil heap for phytoremediation of heavy metal contaminated soil1. Int. J. Phytoremediat. 2015. [Google Scholar] [CrossRef] [PubMed]
- Du, P.; Xie, Y.; Wang, S.; Zhao, H.; Zhang, Z.; Wu, B.; Li, F. Potential sources of and ecological risks from heavy metals in agricultural soils, Daye City, China. Environ. Sci. Pollut. Res. 2015, 22, 3498–3507. [Google Scholar] [CrossRef] [PubMed]
- Zhang, J.; Li, Z.H.; Chen, J.; Wang, M.; Tao, R.; Liu, D. Assessment of heavy metal contamination status in sediments and identification of pollution source in Daye lake, central china. Environ. Earth Sci. 2014, 72, 1279–1288. [Google Scholar] [CrossRef]
- Xiao, M.S.; Li, F.; Zhang, J.D.; Lin, S.Y.; Zhuang, Z.Y.; Wu, Z.X. Investigation and health risk assessment of heavy metals in soils from partial areas of Daye city, China. In IOP Conference Series: Earth and Environmental Science; IOP Publishing: Bristol, UK, 2017; Volume 64, p. 012066. [Google Scholar]
- Hu, W.; Chen, Y.; Huang, B.; Niedermann, S. Health risk assessment of heavy metals in soils and vegetables from a typical greenhouse vegetable production system in China. Hum. Ecol. Risk Assess. Int. J. 2014, 20, 1264–1280. [Google Scholar] [CrossRef]
- Noli, F.; Tsamos, P. Concentration of heavy metals and trace elements in soils, waters and vegetables and assessment of health risk in the vicinity of a lignite-fired power plant. Sci. Total Environ. 2016, 563, 377–385. [Google Scholar] [CrossRef] [PubMed]
- Huang, J.; Li, F.; Zeng, G.M.; Huang, X.; Liu, W.; Wu, H.; Gu, Y.; Li, X.; He, X.; He, Y. Integrating hierarchical bioavailability and population distribution into potential eco-risk assessment of heavy metals in road dust: A case study in Xiandao District, Changsha city, China. Sci. Total Environ. 2016, 541, 969–976. [Google Scholar] [CrossRef] [PubMed]
- Xiang, H.L.; Yang, J.; Qiu, Z.Z.; Lei, W.X.; Zeng, T.T.; Lan, Z.C. Health Risk Assessment of Tunnel Workers Based on the Investigation and Analysis of Occupational Exposure to PM10. Environ. Sci. 2015, 36, 2768–2774. (In Chinese) [Google Scholar]
- Environmental Responsibility of Annual Special Reports. Available online: http://gongyi.sina.com.cn/greenlife/2012-08-14/101636678.html (accessed on 15 October 2017).
- Long, H.Y.; Zhu, X.; Liu, H.C.; Chen, J.; Yuan, S.H.; Lu, X.H. Study on heavy metal content in soil near Daye nonferrous smelting plant. In Proceedings of the Symposium on Integrated Control of Heavy Metal Pollution, Changsha, China, 20 March 2010. (In Chinese). [Google Scholar]
- Ministry of Environmental Protection of the People’s Republic of China. The Technical Specification for Soil Environmental Monitoring; Ministry of Environmental Protection of the People’s Republic of China: Beijing, China, 2004.
- United States Environmental Protection Agency. Method 3052: Microwave Assisted Acid Aigestion of Siliceous and Organically Based Matrices SW-846; United States Environmental Protection Agency: Washington, DC, USA, 1996.
- Bureau of quality and technical supervision of Yunnan Province. Determination of Lead, Arsenic, Iron, Calcium, Zinc, Aluminum, Sodium, Magnesium, Boron, Manganese, Copper, Barium, Titanium, Strontium, Tin, Cadmium, Chromium and Vanadium in Foods by Inductively Coupled Plasma Atomic Emission Spectrometry (ICP-AES); Bureau of Quality and Technical Supervision of Yunnan Province: Kunming, China, 2009.
- Li, F.; Qiu, Z.Z.; Zhang, J.D.; Liu, C.Y.; Cai, Y.; Xiao, M.S. Spatial Distribution and Fuzzy Health Risk Assessment of Trace Elements in Surface Water from Honghu Lake. Int. J. Environ. Res. Public Health 2017, 14, 1011. [Google Scholar] [CrossRef] [PubMed]
- Xiao, Z.H.; Yuan, X.Z.; Li, H.; Jiang, L.B.; Leng, L.J.; Chen, X.H.; Zeng, G.M.; Li, F.; Cao, L. Chemical speciation, mobility and phyto-accessibility of heavy metals in fly ash and slag from combustion of pelletized municipal sewage sludge. Sci. Total Environ. 2015, 536, 774–783. [Google Scholar] [CrossRef] [PubMed]
- Fryer, M.; Collins, C.D.; Ferrier, H.; Colvile, R.N.; Nieuwenhuijsen, M.J. Human exposure modelling for chemical risk assessment: A review of current approaches and research and policy implications. Environ. Sci. Policy 2006, 9, 261–274. [Google Scholar] [CrossRef]
- The Environment Agency. Handbook and Software to Help Assess the Risks of Contaminated Land Exposure for Human Health. Available online: https://www.gov.uk/government/uploads/system/uploads/attachment_data/file/455747/LIT_10167.pdf (accessed on 16 September 2017).
- Chang, S.H.; Kuo, C.Y.; Wang, J.W.; Wang, K.S. Comparison of RBCA and CALTOX for setting risk-based cleanup levels based on inhalation exposure. Chemosphere 2004, 56, 359–367. [Google Scholar] [CrossRef] [PubMed]
- Li, F.; Zhang, J.; Jiang, W.; Liu, C.; Zhang, Z.; Zhang, C.; Zeng, G.M. Spatial health risk assessment and hierarchical risk management for mercury in soils from a typical contaminated site, China. Environ. Geochem. Health 2017, 39, 923. [Google Scholar] [CrossRef] [PubMed]
- Li, F.; Huang, J.; Zeng, G.; Liu, W.; Huang, X.; Huang, B.; Gu, Y.; Shi, L.; He, X.; He, Y. Toxic metals in topsoil under different land uses from xiandao district, middle china: distribution, relationship with soil characteristics, and health risk assessment. Environ. Sci. Pollut. Res. Int. 2015, 22. [Google Scholar] [CrossRef] [PubMed]
- Liu, H.; Huang, L.M.; Yin, X.H. An analysis on the dietary arsenic intake level among residents in Hangzhou city. Zhejiang J. Prev. Med. 2015, 27, 547–550, 571. (In Chinese) [Google Scholar]
- USEPA. Guidelines for Carcinogen Risk Assessment; EPA/630/P-03/001F; Environmental Protection Agency: Washington, DC, USA, 2005.
- Ndanu, T.A. Heavy metal pollution of fish and fish oils from some coastal and inland waters of Ghana. Ph.D. Dissertation, University of Ghana, Legon Boundary, Accra, Ghana, 1998. [Google Scholar]
- Arora, M.; Kiran, B.; Rani, S.; Rani, A.; Kaur, B.; Mittal, N. Heavy metal accumulation in vegetables irrigated with water from different sources. Food Chem. 2008, 111, 811–815. [Google Scholar] [CrossRef]
- Wang, H.D.; Zhu, Y.M.; Zeng, L.M.; Fan, Y.Y.; Li, S.J. A study of the background value of the heavy metal ion in the soil of Huangshi-Daye area. J. Cent. Chin. Norm. Univ. 1982, 1, 98–109. (In Chinese) [Google Scholar]
- Yin, C.Q.; Sun, Q.B.; Deng, J.F. Characteristics of heavy metal pollution of farmland soil around Daye lake and assessment of potential environmental risk. J. Hubei Polytech. Univ. 2013, 29, 17–22. (In Chinese) [Google Scholar]
- Song, Q.; Qi, S.H.; Zhang, B.B.; Chen, W.; Xia, L.; Zhang, X.Y. Evaluation of soil heavy metals distribution and pollution status in the surrounding area of the Yan Shan mining area. Environ. Chem. 2011, 30, 1672–1673. (In Chinese) [Google Scholar]
- Hu, W.; Huang, B.; Tian, K.; Holm, P.E.; Zhang, Y. Heavy metals in intensive greenhouse vegetable production systems along Yellow Sea of China: Levels, transfer and health risk. Chemosphere 2017, 167, 82–90. [Google Scholar] [CrossRef] [PubMed]
- Xu, D.C.; Zhou, P.; Zhan, J.; Gao, Y.; Dou, C.M.; Sun, Q.Y. Assessment of trace metal bioavailability in garden soils and health risks via consumption of vegetables in the vicinity of Tongling mining area, China. Ecotoxicol. Environ. Saf. 2013, 90, 103–111. [Google Scholar] [CrossRef] [PubMed]
- Chen, G.; Song, Y.F.; Cheng, S.C.; Ma, H.N.; Qi, X.Q. Traceable rule of soil heavy metal enrichment in vegetable and their selective cultivation in Shouguang, Shandong. Acta Agric. Jiangxi 2013, 123, 118–119. [Google Scholar]
- Lin, J.F.; Gao, S.F.; Chen, W.P.; Wang, G.; Fang, L. Study on the ability of vegetables to enrich cadmium, copper and zinc in soil. Chin. J. Environ. Sci. 2002, 11, 248–251. (In Chinese) [Google Scholar]
- Xie, J.; Cheng, Y.X.; Wang, L.P.; Guo, T.T.; He, J.J. Analysis and evaluation of heavy metals in different vegetables in a gold mine. J. Earth Sci. Environ. 2008, 30, 425–428. (In Chinese) [Google Scholar]
- Duan, X.L. Chinese Population Exposure Parameter Manual; China Environmental Press: Beijing, China, 2013. (In Chinese) [Google Scholar]
- Zhai, F.Y. Tracking Study Chinese Dietary Structure and Nutritional Status Change; Science Press: Beijing, China, 2008. (In Chinese) [Google Scholar]
- Peng, Q.I.; Zhang, R.Z.; Zhang, B.Y.; Wang, X.J. Spatial analysis and the health risk assessment of typical heavy metal of soil-vegetable system in Lanzhou City. Arid Land Geogr. 2012, 35, 162–170. (In Chinese) [Google Scholar]
- Yang, L.; Huang, B.; Hu, W.; Chen, Y.; Mao, M.; Yao, L. The impact of greenhouse vegetable farming duration and soil types on phytoavailability of heavy metals and their health risk in eastern China. Chemosphere 2014, 103, 121. [Google Scholar] [CrossRef] [PubMed]
Figure 1.
Map of the investigated area and sampling sites in Daye.

Figure 2.
Transfer factor of metal(loid)s for different types of vegetables. Note: the black letter, red letter and blue letter indicate significantly difference test results of leguminous vegetable, fruit vegetable and leafy vegetables, respectively.
Figure 2.
Transfer factor of metal(loid)s for different types of vegetables. Note: the black letter, red letter and blue letter indicate significantly difference test results of leguminous vegetable, fruit vegetable and leafy vegetables, respectively.

Figure 3.
(a) The non-carcinogenic risk; (b) The carcinogenic risk. Health risks for metal(loid)s caused by leguminous vegetables.
Figure 3.
(a) The non-carcinogenic risk; (b) The carcinogenic risk. Health risks for metal(loid)s caused by leguminous vegetables.

Figure 4.
(a) The non-carcinogenic risk; (b) The carcinogenic risk. Health risks for metal(loid)s caused by fruit vegetables.
Figure 4.
(a) The non-carcinogenic risk; (b) The carcinogenic risk. Health risks for metal(loid)s caused by fruit vegetables.

Figure 5.
(a) The non-carcinogenic risk; (b) The carcinogenic risk. Health risks for metal(loid)s caused by leafy vegetables.
Figure 5.
(a) The non-carcinogenic risk; (b) The carcinogenic risk. Health risks for metal(loid)s caused by leafy vegetables.


Table 1.
Metal(loid) Concentration of soils in the study area (mg·kg−1).
| Element | Background Values of Soil, Daye | Study Area (n = 18) | Permissible Values (GB15618-1995) | Single Factor Index | ExcessiVe Rate (%) | ||
|---|---|---|---|---|---|---|---|
| Maximum | Minimum | Mean ± SD | |||||
| Cu * | 25.63 | 321.99 | 32.35 | 128.48 ± 101.39 | 50 | 5.01 b | 77.8% |
| Zn * | 70.80 | 181.42 | 53.53 | 103.31± 45.37 | 200 | 1.46 c | 00 |
| As | 16.58 | 56.42 | 10.16 | 20.09 ± 11.60 | 30 | 1.21 c | 11.1% |
| Cd * | 0.18 | 2.45 | 0.20 | 1.38 ± 0.81 | 0.3 | 7.67 a | 88.9% |
| Pb | 43.35 | 87.56 | 19.54 | 55.16 ± 22.40 | 250 | 1.27 c | 0 |
Note: * means the difference between the concentration of the study area and the background value is significant. The single factor index is the ratio between the average concentration and the background value, which is used to represent the degree of pollution and the letters are marked as multiple comparison results, Different lower case letters indicate significant difference, same below. Excessive rate refers to the ratio of tested samples that exceeding the national standard limit (GB15618-1995).
Table 2.
Concentrations of metal(loid)s in vegetables and maximum permissible levels set in China (mg·kg−1).
Table 2.
Concentrations of metal(loid)s in vegetables and maximum permissible levels set in China (mg·kg−1).
| Type of Vegetables | Values Contrast | Cu | Zn | As | Cd | Pb |
|---|---|---|---|---|---|---|
| Leguminous vegetables | Range | 1.33–5.90 | 4.80–18.14 | 0.01–0.05 | 0–0.05 | 0–0.40 |
| Mean ± SD | 2.14 ± 1.39 | 8.12 ± 3.90 | 0.02 ± 0.01 | 0.01 ± 0.02 | 0.07 ± 0.12 | |
| Permissible levels | 10 | 20 | 0.5 | 0.1 | 0.2 | |
| Leafy vegetables | Range | 1.31–6.61 | 2.33–12.63 | 0.021–0.92 | 0–0.71 | 0–0.38 |
| Mean ± SD | 2.44 ± 1.24 | 4.99 ± 2.63 | 0.27 ± 0.22 | 0.11 ± 0.17 | 0.14 ± 0.11 | |
| Permissible levels | 10 | 20 | 0.5 | 0.2 | 0.3 | |
| Fruit vegetables | Range | 0.46–2.10 | 1.16–4.57 | 0–0.11 | 0–0.52 | 0–1.47 |
| Mean ± SD | 1.13 ±0.48 | 2.31 ± 0.88 | 0.03 ± 0.03 | 0.09 ± 0.12 | 0.12 ± 0.30 | |
| Permissible levels | 10 | 20 | 0.5 | 0.05 | 0.1 |
Table 3.
Excessive rate of metal(loid)s in vegetables.
| Type of Vegetables | Number of Samples | Excessive Rate (%) | ||||
|---|---|---|---|---|---|---|
| Cu | Zn | As | Cd | Pb | ||
| Leguminous vegetables | 24 | 0 | 0 | 0 | 0 | 12.50 |
| Leafy vegetables | 51 | 0 | 0 | 5.88 | 17.65 | 5.88 |
| Fruit vegetables | 66 | 0 | 0 | 0 | 50.00 | 22.73 |
Table 4.
Exposure scenario of different age groups.
| Age Categories | Child (2–6 Year Old) | Teenager (7–17 Year Old) | Adult (above 18 Year Old) | Reference Value (Adult) | |
|---|---|---|---|---|---|
| Survey number (person) | 44 | 39 | 306 | - | |
| BW (kg) | 18.77 ± 6.58 | 40.71 ± 15.19 | 61.00 ± 9.54 | 60.3 | |
| H (cm) | 97.93 ± 21.02 | 138.41 ± 23.87 | 164.22 ± 7.70 | 162.7 | |
| IR (g·d−1) | Maximum | 569.86 | 790.82 | 1506.85 | - |
| Maximum | 34.95 | 45.82 | 37.41 | - | |
| Mean ± SD | 153.84 ± 98.44 | 220.37 ± 175.05 | 373.98 ± 296.82 | 396.9 | |
| ED(a) | 4.54 ± 1.37 | 11.24 ± 3.03 | 42.61 ± 15.27 | - | |
| AT (carcinogenic) (a) | 74.80 | 71.08 | 64.95 | - | |
Note: H represents body height. The meanings of other abbreviated parameters were explained in Section 2.4.
© 2017 by the authors. Licensee MDPI, Basel, Switzerland. This article is an open access article distributed under the terms and conditions of the Creative Commons Attribution (CC BY) license (http://creativecommons.org/licenses/by/4.0/).
Share and Cite
MDPI and ACS Style
Yang, J.; Lv, F.; Zhou, J.; Song, Y.; Li, F. Health Risk Assessment of Vegetables Grown on the Contaminated Soils in Daye City of Hubei Province, China. Sustainability 2017, 9, 2141. https://0-doi-org.brum.beds.ac.uk/10.3390/su9112141
AMA Style
Yang J, Lv F, Zhou J, Song Y, Li F. Health Risk Assessment of Vegetables Grown on the Contaminated Soils in Daye City of Hubei Province, China. Sustainability. 2017; 9(11):2141. https://0-doi-org.brum.beds.ac.uk/10.3390/su9112141
Chicago/Turabian StyleYang, Jun, Fuhong Lv, Jingcheng Zhou, Yongwei Song, and Fei Li. 2017. "Health Risk Assessment of Vegetables Grown on the Contaminated Soils in Daye City of Hubei Province, China" Sustainability 9, no. 11: 2141. https://0-doi-org.brum.beds.ac.uk/10.3390/su9112141
Note that from the first issue of 2016, this journal uses article numbers instead of page numbers. See further details here.