Article

The Effects of Residential Area Building Layout on Outdoor Wind Environment at the Pedestrian Level in Severe Cold Regions of China

1
School of Architecture, Harbin Institute of Technology; Heilongjiang Cold Region Architectural Science Key Laboratory, Harbin 15000, China
2
School of Architecture, University of Sheffield, Sheffield S10 2TN, UK
*
Author to whom correspondence should be addressed.
Sustainability 2017, 9(12), 2310; https://0-doi-org.brum.beds.ac.uk/10.3390/su9122310
Submission received: 1 November 2017 / Revised: 7 December 2017 / Accepted: 10 December 2017 / Published: 12 December 2017

Abstract

:
In recent years, there has been a frequent occurrence of extremely cold conditions which has had a serious impact on the life of residents of buildings in various locations around the world. However, there have only been a very limited number of studies on the effects of residential area building layout on the winter wind environments, which led to a lack of quantitative guidance for residential area planning in severely cold regions. This study aims to reveal the relationship between (1) the residential areas’ building density, floor area ratio, wind projection angle, average building height, and relative position of high-rise buildings, and; (2) the mean wind velocity ratio at pedestrian level in severe cold regions. In this study, the pedestrian-level outdoor wind environments in 24 typical residential areas of Harbin, China, are simulated using ENVI-met software. The results show that the relative position of high-rise buildings in multi-high-level mixed residential areas has little influence on the mean wind velocity ratio, and the maximum difference is 0.04. The factors of building layout have little influence on the mean wind velocity ratio of multistory residential areas. However, a significant linear correlation exists between the mean wind velocity ratio of high-rise residential areas and both the building density and wind projection angle. The prediction model of the mean pedestrian-level wind velocity ratio was then established.

1. Introduction

In recent years, the frequent occurrence of extreme cold weather has not only increased the energy consumption of building heating, but also seriously affected people’s work, life and physical health [1]. According to the report of BBC NEWS, since 1 November 2016, extreme cold weather has occurred continuously in Italy, Poland, the Czech Republic, and other European countries, which has led to more than 20 deaths and the suspension of traffic and transport in most areas [2]. Through studying the influence of cold weather on the death rate in European cities from 1990 to 2000, Analitis et al. found that for each 1 °C decrease in air temperature, the daily death rate increases 1.35%, and the prevalence rate of cardiovascular, respiratory and cerebrovascular diseases will increase by 1.72, 3.30 and 1.25%, respectively [3]. The analysis results found by Healy et al. showed that measures such as improving the outdoor environment, enhancing housing insulation performance and increasing public health expenditure could effectively reduce the death rate in winter [4].
Residential areas, as a city’s basic unit, have the closest connection with people’s living environment; the thermal environment of residential areas directly affects people’s physical and mental health, as well as human comfort sensation during outdoor activities [5,6]. The meteorological factors affecting outdoor human thermal sensation include wind velocity, air temperature and relative humidity, and so forth, of which the wind velocity plays a dominant role [7]. Therefore, in the early stage of planning, the influence of the relevant factors of residential building layout on the outdoor wind environment and thermal comfort should be fully considered to create a comfortable human settlement environment [8,9,10,11]. In recent years, several researchers, through field measurement, wind tunnel tests and numerical simulation, have studied the relationship between the building layout factors (building density, floor area ratio, building height, building orientation, sky-view factor, etc.) and the outdoor wind environment, and obtained many corresponding results [12,13,14].
Using field measured meteorological data on wind speed, air temperature, relative humidity and solar radiation in two pedestrian streets in Curitiba, Brazil, and in combination with a questionnaire survey, Krüger et al. [15] carried out a multiple regression analysis regarding thermal sensation and measured meteorological data, and demonstrated the relationship between the sky-view factor and the thermal comfort of pedestrians. In a long-term study, Johansson et al. observed the thermal environment of two streets with different aspect ratios in Fitz, Morocco, and carried out an analysis of the thermal comfort using the physiologically equivalent temperature (PET) index. The results showed that for the street with an aspect ratio of 9.7, the annual mean wind velocity is 0.4 m/s, and the PET is stable at 23–28 °C in summer; while for the street with the aspect ratio of 0.6, the annual mean wind velocity is 0.8 m/s, and the PET is more than 40 °C in summer [16].
Tsang et al. [17] studied the pedestrian-level wind environment around high-rise buildings using wind tunnel tests, and the results showed that, for a single building, increasing the building width enlarges the area of low wind speed zones, and increasing building height is conducive to natural air ventilation at pedestrian level. However, increasing building height will lead to weak natural air ventilation when the buildings are separated by a distance less than half of the building width—the podiums will seriously impede natural air ventilation, and worsen the pedestrian comfort around buildings. Williams et al. [18] carried out a large-scale wind tunnel test on the pedestrian-level wind environment of the central areas of Ottawa, Canada. They examined 16 prevailing wind directions and had 615 measuring points. The study results provide a significant reference for the future wind environment prediction and planning of the region.
Based on the renormalization group (RNG) k-epsilon turbulence model, Zhang et al. [19] performed a simulation study on the wind environment of three different kinds of building layouts. Their results showed that a staggered building arrangement is helpful for air movement, and when the wind direction is S-N or SE-NW, the natural air ventilation is the most significant. Hong et al. [20] carried out a numerical study on the outdoor wind environment and thermal comfort at pedestrian level for several different building layout patterns using the Simulation Platform for Outdoor Thermal Environment (SPOTE). Their results showed that the building layout patterns’ orientation with respect to wind has a significant effect on both the wind environment and thermal comfort, and when the longer facade of the building is parallel to the prevailing wind direction, the wind speed at the edges of the building increases. Carfan et al. [21] studied the wind environment and thermal comfort in both a densely built district and a city park using ENVI-met software. They showed that the wind speed of the high building density area is lower, and the predicted mean vote (PMV) value of both study areas is nearly the same. Emmanuel et al. [22] carried out the simulation study on the microclimate of the street canyons with different height-to-width ratio in Colombo, Sri Lanka, by ENVI-met, the results indicated that the air temperature and average radiation temperature decrease obviously, and the wind speed decreases distinctly with increasing height-to-width ratio.
The research above focuses mainly on the effect of relevant factors of building layout on the microclimate and pedestrian thermal comfort under dry heat and humid heat climate conditions; there is a lack of research on the winter outdoor wind environment under harsh climatic conditions in severe cold regions. At the same time, most of the study objects being relatively unitary, mainly concerning individual built cases, their results failed to accurately reflect the universal law of wind environment and pedestrian thermal comfort of residential areas. Furthermore, the results of some researches, because of a lack of a due consideration of actual planning and design requirements, are inapplicable to the actual urban construction projects.
Compared with field measurement and wind tunnel test, the numerical simulation, though taking less time, collects comprehensive experimental data, and in the meantime, the model parameters can be changed according to the experimental requirements. Therefore, it is more suitable for the study of many samples [19].
As a main affecting factor of outdoor thermal environment, air temperature plays an important role in thermal comfort. However through the field measurements of the winter microclimate of residential areas in cold regions, it was found that the building layouts have little impact on air temperature, but have significant impacts on the outdoor wind environment [23]. Furthermore, through the questionnaire surveys on winter outdoor thermal comfort, it was found that people are more sensitive to wind speed than air temperature, so the wind environment has more significant effects on human thermal comfort in winter of cold regions [24]. This study focuses on analyzing the outdoor wind environment of residential areas in severe cold regions, so there is no excessive discussion about air temperature.
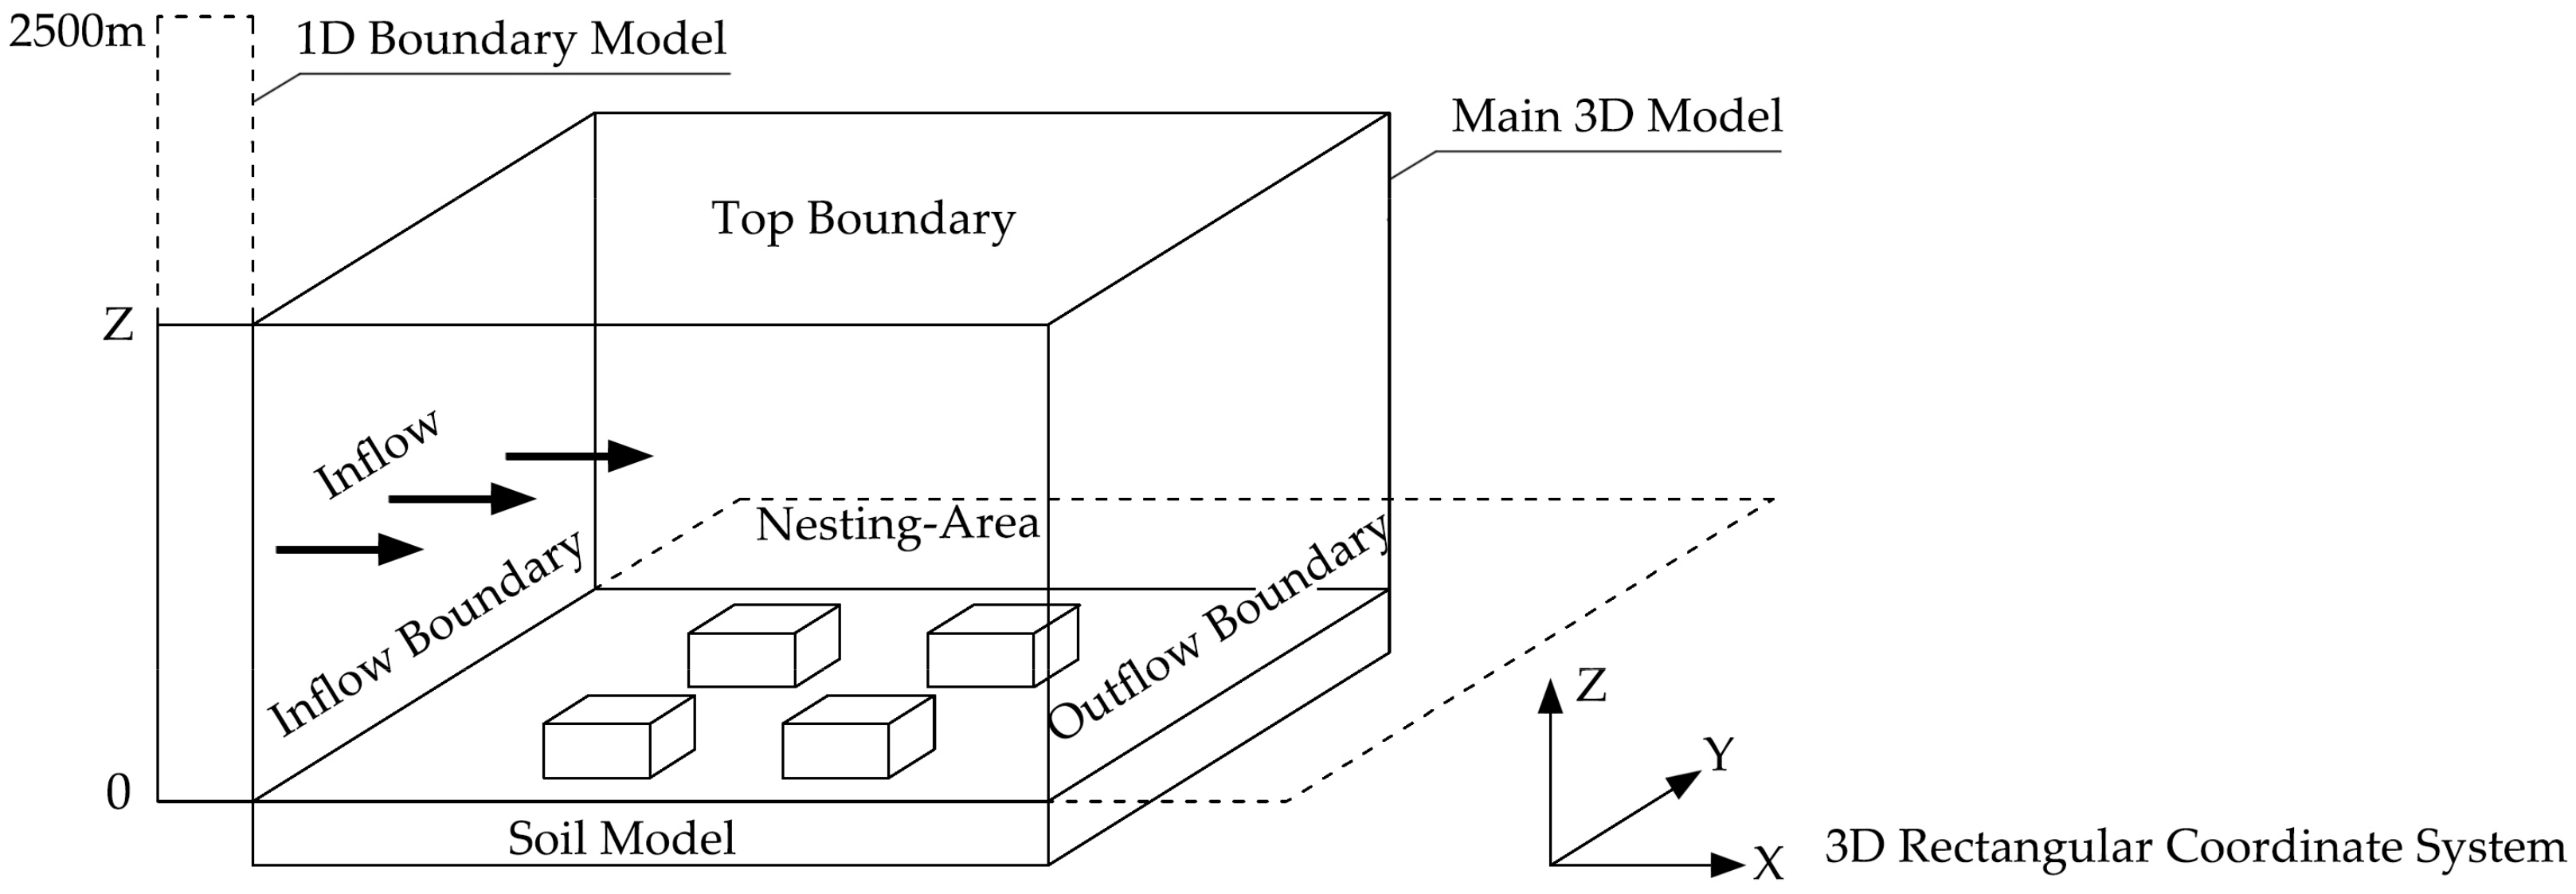
This paper aims to study the relation between the relevant factors of building layout of the residential areas in severe cold regions of China and mean wind velocity ratio at the pedestrian level. The winter outdoor wind environment of typical residential areas in Harbin are simulated by using ENVI-met software. By means of Pearson correlation analysis, scatter plots and linear-fit estimation, this paper conducts quantitative analysis on the relations between the multistory and high-rise residential areas’ building density, floor area ratio, wind projection angle (the wind projection angle of residential areas is the included angle between the prevailing wind direction and the residential area orientation, the residential area orientation defined in this paper is that of the majority buildings in the area), and average building height, with the mean pedestrian-level wind velocity ratio. Moreover, the effects of the relative position of high-rise buildings in multi-high-level mixed residential areas on the mean wind velocity ratio is investigated. Based on the above analysis, the most significant and suitable variables are chosen to establish the prediction model of the mean wind velocity ratio at the pedestrian level. It is expected that this study could provide guidance and evaluation basis for the layout planning of residential areas in severe cold regions.

2. Methodology

2.1. Simulation Software

ENVI-met is a microclimate simulation software package designed to assess surface-plant-air interactions with a typical horizontal resolution of 0.5–10 m and a typical time frame of 24–48 h with a time step of 1–5 s. ENVI-met includes a full three-dimensional (3D) computational fluid dynamics model. It calculates the temporal and spatial development of the wind speed and direction by using 3D non-hydrostatic incompressible Navier-Stokes equations. ENVI-met uses a 1.5 order turbulence closure model. Two prognostic equations for turbulent energy production (E) and its dissipation (ϵ) are used to simulate the distribution of turbulent energy.
The ENVI-met model is composed of a one-dimensional (1D) boundary model, a main 3D model and a soil model, as shown in Figure 1. In this paper, the equidistant grid is used in the main 3D model, which has the same spacing over all vertical layers, except that the lowest vertical grid cell above ground is divided equally into five sub-grid cells with 0.2∙dz in order to increase simulation accuracy at ground level. The lowest view plane of the simulation results is 0.1∙dz above the ground level, then 0.1∙dz + 0.2∙dz, 0.1∙dz + 0.4∙dz, 0.1∙dz + 0.6∙dz, and so on.
The main 3D model is nested into a 1D boundary model which extends up to 2500 m in height. The forced lateral boundary conditions for turbulence is used in this paper, which means that the logarithmic wind power profile of the kinetic energy and its dissipation rate calculated in the 1D boundary model is copied directly to inflow boundary and top boundary of the main 3D model. The main input data to ENVI-met simulation as the initial meteorological boundary conditions include wind speed and direction measured at 10 m height, roughness length at measurement site, initial temperature of atmosphere, initial temperature and humidity of the soil, specific humidity at 2500 m height, and relative humidity at 2 m height, which can be obtained from the standard meteorological station.

2.2. Model Evaluation

ENVI-met has been widely used in the urban microclimate research of different regions in the world; researchers would often use both field measured data and wind tunnel tests to demonstrate the effectiveness and accuracy of the simulation software in predicting the outdoor wind environment. Krüger et al. [15] made a comparison of the field measured wind velocity of a pedestrian street in Curitiba, Brazil, to the ENVI-met simulation results, simulated using the wind speed measured at a local weather station as the initial wind speed. The results showed that when the initial wind speed is less than 2 m/s, the simulation values perfectly match the field measured values (R2 = 0.80); when the initial wind speed is over 2 m/s, the simulation values are slightly higher than the measured values (R2 = 0.70). Huttner [25] used the field measured wind speeds from two different areas in Freiburg, Germany, to validate the simulation results from ENVI-met, and the results show that the root mean square error (RMSE) between the simulated values and the measured values in the two different areas is 0.7 m/s and 0.2 m/s, indicating a goodness of fit. Yang [26] used MISKAM software, which had been validated with wind tunnel tests, to evaluate the capability of ENVI-met in predicting the outdoor wind environment. The simulation results from each simulation software were compared for three conditions: single building; a single row of trees and complex city environment. It can be seen that both software programs have nearly the same distribution of both wind vector and wind pressure, proving the accuracy of ENVI-met simulation results for the prediction of the outdoor wind environment.
The maximum number of grids units allowed in the ENVI-met model is 250 × 250 × 25, which include the grids of main model area and nesting area. The nesting grid cells around the main model area is a buffer zone, giving the possibility to distance the model boundary from the area of interest and minimize the undesired boundary effects [27]. Considering the area of study cases, this paper chose a grid of 249 × 249 × 24 units for the entire model area, in which 239 × 239 × 19 grid units were created in the main model area and five nesting grid cells were empirically set on each side to greatly increase the numerical stability and accuracy of the simulation [28,29]. The models were simulated for 44 h starting 4 a.m. in this paper. This is because the best total calculation time should be longer than 6 h to overcome the influence of the initialization and the convergence errors [30,31]. The grid structure of all numerical models passed the check by ENVI-met.
Figure 2 shows the pedestrian-level wind velocity ratio at each data collection point, where the points were at the same position in both the ENVI-met simulation and wind tunnel test. The main model of ENVI-met used the same domain (239 × 239 × 19 grid units) surrounded by five nesting grid units, and four different equidistant grid resolutions (2 × 2 × 3 m, 3 × 3 × 3 m, 3 × 3 × 6 m and 4 × 4 × 6 m) in order to understand how it could affect the results and determine the optimal settings. Through comparing the wind velocity ratio of the wind tunnel test and numerical simulations, it was found that there is a similar correlation between the values tested and simulated with the grid resolutions of 2 × 2 × 3 m, 3 × 3 × 3 m and 3 × 3 × 6 m respectively (the R-square equal to 0.7106, 0.6986 and 0.6913 respectively). Furthermore, the root mean square error (RMSE) and the mean absolute percentage error (MAPE) were used to verify the performance of numerical models with different grid resolutions, as shown in Table 1. It can be seen that the results provided by numerical models with the gird resolutions of 2 × 2 × 3 m, 3 × 3 × 3 m and 3 × 3 × 6 m are basically consistent. Therefore, the equidistant grid with the resolution of 3 × 3 × 6 m was ultimately chosen in this paper, because higher resolutions did not effectively change simulation results of the main model of ENVI-met with 249 × 249 × 24 grid units surrounded by five nesting grid units, despite the added processing time and model complexity.
This paper used the field measurement to validate the accuracy of the ENVI-met wind environment simulation. The field testing was carried out in Harbin between 10:00 a.m. and 18:00 p.m. on 11 January 2017. A residential area which consists of multistory buildings and high-rise buildings was chosen as the observation site. Figure 3a shows the building layout of the survey site and the locations of the measurement points. The model domain with 239 × 239 × 19 grid units at equidistant grid resolution of 3 × 3 × 6 m was used in the ENVI-met simulation. The observation data from the Urban Meteorological Station in Harbin was used as the initial meteorological conditions into the simulation. The date collection points were added to the model at locations corresponding to the measurement points. Through comparing the hourly mean wind speed measured and simulated at each point from 12:00 p.m. to 16:00 p.m., it was found that the ENVI-met tends to overestimate wind speed in the observation site, as shown in Figure 3b. However, the reasonable correlation between simulated results and measured values with a R-square equal to 0.6843, indicates that the ENVI-met model is reliable for studying the wind environment of residential areas under cold climatic conditions.

2.3. Establishment of Simulation Models

The residential areas in severe cold regions of China are mainly composed of multistory buildings (4–6 floors) and high-rise buildings (greater than or equal to 10 floors), and the main layout types are the parallel and enclosed building arrangements. In order to ensure the basic living environment of residents; to use land and space resources effectively, economically and rationally; and, to improve the layout planning quality of residential areas, the urban building volume ratio and related content management regulations propose, considering the current construction status of residential areas, that the floor area ratio of multistory residential areas should not be greater than 2.0, while the building density should not be greater than 35%; the floor area ratio of high-rise residential areas should not be greater than 4.5, and the building density should not be greater than 25%.
To comprehensively consider the residential areas’ layout type, floor area ratio, building density, building height and wind projection angle in severe cold regions of China, 24 typical residential areas were selected as study cases in this paper. These areas are from Harbin, a central city in the northeast of China (latitude 45.45°N, longitude 126.39°W). Furthermore, in this study, multistory residential areas, high-rise residential areas and multi-high-level mixed residential areas (the multi-high-level mixed residential area refers to a residential area composed of both multistory and high-rise buildings) are investigated, and both the parallel and enclosed arrangement types of building layout are considered. To obtain representative research results which can be universally applied, the building layout of the 24 study cases is simplified according to the residential areas’ design requirements of sunshine spacing, fire spacing and building volume ratio in Harbin, and the corresponding simulation models are built in ENVI-met. The residential land area is set to 320 m × 270 m, the orientation is the north-south direction, and the height of each floor is 3 m. The simulation models and the parameter information are shown in Table 2 and Table 3.

2.4. Input Data of the Model

The grid numbers of the main 3D model domain are 239 × 239 × 19. The equidistant grid resolutions dx, dy, and dz are 3, 3 and 6 m, respectively (dx and dy are the X and Y resolution in horizontal direction, respectively, and dz is the resolution of Z in vertical direction), where all grid cells have the same height, except the lowest grid cell, which is divided into five sub-grid cells. In this paper, the simulation results at 1.8 m height are obtained to study the wind velocity ratio at pedestrian level. Meanwhile, five nested grids arranged based on the interval of loam and asphalt are set around the main model area to weaken the influence of the external conditions on the simulation results. To obtain more accurate simulation results of the wind environment, the total simulation time is set to 44 h [32]. The initial wind direction is 180°, 202.5°, 225°, 247.5° and 270°, and the corresponding wind projection angles of the residential areas are 0°, 22.5°, 45°, 67.5° and 90°. The observation data (observed on 24 January 2017, by the urban meteorological station in Harbin) were used as the initial meteorological conditions of the simulation, as shown in Table 4. According to the Guide to Meteorological Instruments and Methods of Observation of World Meteorological Organization [33], the roughness length at the measurement site in this paper is 0.1 m, where the terrain feature is cultivated area, low crops, with obstacles of height (H) separated by at least 20 H. In each model, about 60 data collection spots are present: these are arranged evenly.

3. Results

In this study a quantitative analysis is conducted on the relation of the multistory and high-rise residential areas’ building density, floor area ratio, average building height, wind projection angle, and the relative location of high-rise buildings within multi-high-level mixed residential areas with the mean wind velocity ratio at pedestrian level. Table 5 shows the mean wind velocity ratio at pedestrian level at each of the five different wind projection angles for every study case.

3.1. Building Density and Mean Pedestrian-Level Wind Velocity Ratio

Figure 4 shows the relationship between the building density and the mean pedestrian-level wind velocity ratio of both high-rise and multistory residential areas. Combining with a Pearson correlation analysis, it can be found that the building density is significantly negatively correlated with the mean pedestrian-level wind velocity ratio in high-rise residential areas, as shown in Table 6. When the building density is 19.5–23.4%, the interaction is more obvious, and with the increase in building density, the mean pedestrian-level wind velocity shows an obvious decreasing trend. The building density of multistory residential areas has no linear correlation with the mean pedestrian-level wind velocity ratio. The building densities of the multistory residential areas studied in this paper are mainly between 26.0 and 30.8%, which means that within this range, the building density has less effect on the mean pedestrian-level wind velocity. Since multistory residential areas have a relatively greater building density, and taken together with the fact that building facades can effectively block the airflow to reduce the wind speed, the mean pedestrian-level wind velocity ratio in high-rise residential areas is generally bigger than that in multistory residential areas.
The research results from [13] indicate that when the building density is 4.4–44.4%, the relation between the building density and the mean wind velocity shows a significant negative correlation. The reason that their study differs from the conclusion regarding multistory residential areas in this paper, is that the building layout type in the study cases examined in Razak et al. have an interspersed arrangement, whereas the multistory residential areas studied in this paper are mainly of the enclosing or parallel rows arrangement building layout type, which are both commonly seen in severe cold areas of China. Furthermore, the influence of different prevailing wind directions on the wind environment has also been considered in this paper, which has a great impact on the conclusions of the study.

3.2. Floor Area Ratio and Mean Pedestrian-Level Wind Velocity Ratio

Figure 5 shows that the relationship between the floor area ratio and the mean pedestrian-level wind velocity ratio in high-rise and multistory residential areas. When the floor area ratio of high-rise buildings ranges from 2.34 to 3.12, the mean pedestrian-level wind velocity ratio shows no obvious variation trend. However, when the floor area ratio ranges from 3.63 to 3.99, the mean pedestrian-level wind velocity ratio decreases gradually as the floor area ratio increases. Through the Pearson correlation analysis based on all values, it can be seen that a significant correlation is shown between the floor area ratio of high-rise buildings and the mean pedestrian-level wind velocity ratio, although it is weak. Moreover, the analysis based on mean values shows that there is no correlation between the both, as shown in Table 7. The floor area ratio of multistory residential areas has no linear correlation with the mean pedestrian-level wind velocity ratio. Since the building height in multistory residential areas is the same, the floor area ratio varies with the building density. Thus, there is a similar relationship between the floor area ratio and the building density. On the other hand, as the average building height in a high-rise residential area varies between residential areas, the influence of the floor area ratio on the mean wind velocity ratio is different from that of the building density.
The results from a study by Kubota et al. [34] have shown that, for Japanese detached houses with a floor area ratio of 0.19–0.69, the floor area ratio shows a significant linear negative correlation with the mean wind velocity ratio. Furthermore, for apartment houses with a floor area ratio of 0.69–1.71, there is no significant correlation between the two aforementioned factors. Their results are consistent with the analysis of the multistory residential areas in this paper. However, study cases with a relatively large floor area ratio were not investigated in study by Kubota et al., because there were great differences in relation to the climatic conditions of sites, city texture and the planning requirements of residential areas.

3.3. Wind Projection Angle and Mean Pedestrian-Level Wind Velocity Ratio

Figure 6 illustrates the relationship between the wind projection angle and mean pedestrian-level wind velocity ratio in high-rise residential areas, which shows a significant positive linear correlation, combined with the Pearson correlation analysis, as shown in Table 8. As the wind projection angle increases, the mean pedestrian-level wind velocity ratio increases gradually, and when the wind projection angle is 0–67.5° the trend is more obvious. This is because the orientation of most of the buildings in the study is south-north, where the wind projection angle is small and the lateral buildings obviously block the wind. As the wind projection angle increases, this blocking effect is gradually weakened. However, in a few study cases, the orientation of lateral buildings is east-west, so when the wind projection angle is 67.5–90°, the airflow blocking effect is enhanced, which leads to a decrease in the mean pedestrian-level wind velocity ratio.
Figure 7 shows the relationship between the wind projection angle and the mean pedestrian-level wind velocity ratio in multistory residential areas. It can be seen that as the wind projection angle changes, the mean pedestrian-level wind velocity ratio shows no obvious trend. In addition, the Pearson correlation analysis shows that there is no correlation between them both, as shown in Table 7. This is because in severe cold areas of China, an enclosure building arrangement is normally adopted in multistory residential areas to reduce the influence of the winter wind on the thermal environment within the residential area.
Hong et al. [20] studied the wind environment of multistory building blocks with six different building layout patterns under a prevailing wind direction of 0 or 90°. They showed that the orientation of the building layout had a significant effect on the wind environment. When the long facades of a building are parallel to the prevailing wind direction, this can accelerate the air ventilation to produce a more comfortable summer wind environment. Although the natural climate conditions examined in this study are quite different from those in the study by Hong et al., and the study cases are subjected to a more complex analysis with five prevailing wind directions, the results of both studies are basically in agreement.

3.4. Average Building Height and Mean Pedestrian-Level Wind Velocity Ratio

Figure 8 shows the relationship between the average building height in residential areas and the mean pedestrian-level wind velocity ratio, based on all study cases. It can be seen that as the average building height increases, the mean pedestrian-level wind velocity ratio increases slowly, but the interaction between them is not significant. In addition, when the average building height is 54 m, the mean pedestrian-level wind velocity in some of the study cases is relatively small. This is because the relatively high degree of enclosure in these residential areas blocks the air ventilation. Furthermore, through the Pearson correlation analysis, it can be found that there is a weak correlation between the average building height and the mean pedestrian-level wind velocity ratio in all kinds of residential areas, and there is no correlation between them both in high-rise residential areas, as shown in Table 9.The conclusions of a study by Jiang et al. [14] point out that with an increase in building height, the wind speed will increase, and the vortexes in front of tall buildings will gradually strengthen. The building layout type in the cases they studied was of an interspersed or parallel rows arrangement. They did not consider a layout with a high degree of enclosure, thus some of their conclusions are different from those presented in this paper.

3.5. The Relative Position of High-Rise Buildings and Mean Pedestrian-Level Wind Velocity Ratio

Figure 9 shows that the relationship between the relative position of high-rise buildings in multi-high-level mixed residential areas and the mean pedestrian-level wind velocity ratio under different wind projection angles. The study cases 19, 20 and 21 (with a building height of 18 and 36 m, respectively), and cases 22, 23 and 24 (with a building height of 18 and 54 m, respectively) were selected to examine the effect of positioning high-rise buildings on the upwind side, downwind side and both sides of the building layout. The results show that all three relative locations have little influence on the mean pedestrian-level wind velocity ratio: the maximum difference in the mean pedestrian-level wind velocity ratio is only 0.04.
The findings of a study by Deng et al. [35] show that for a business center with a building density of 32.65% and a wind projection angle of 45°, when the taller buildings are located on both sides of the layout, the mean wind velocity ratio is relatively bigger. Discrepancies may exist between their study and this paper as the studied building density and average building height vary greatly, which leads to different effects on the wind environment.

4. Prediction Model Establishment

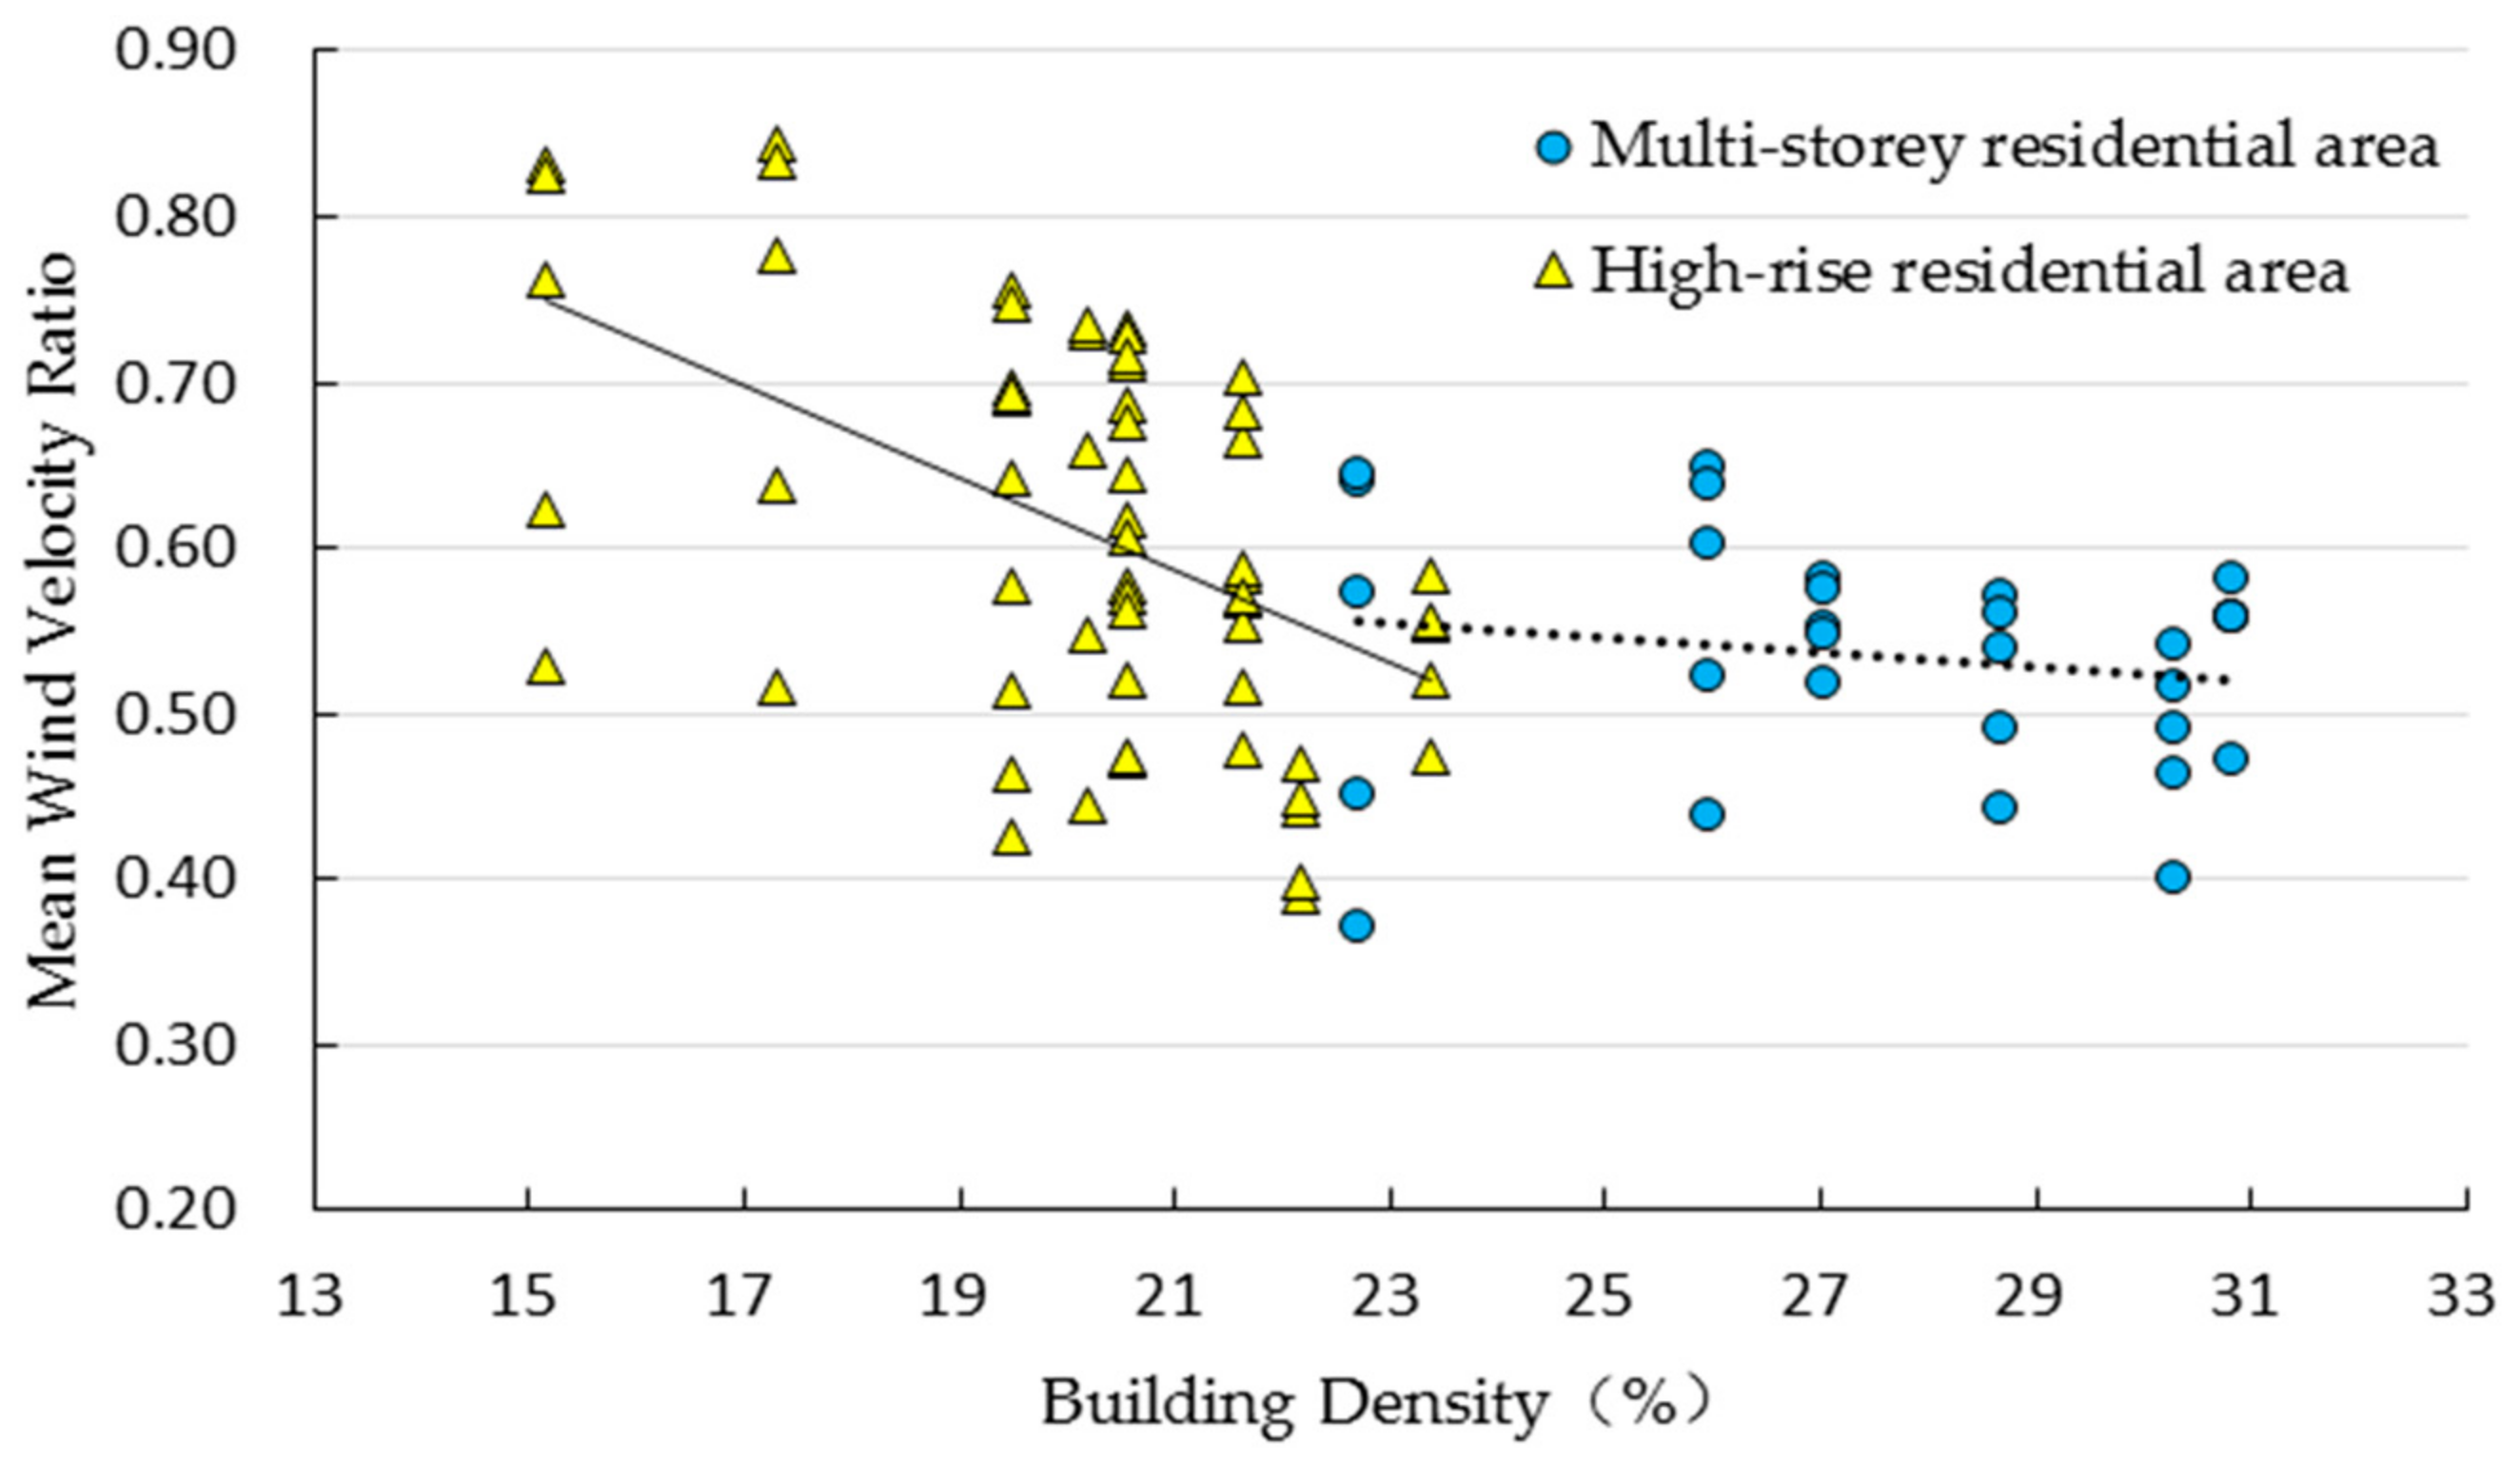
Through analysis on the relationships between the multistory and high-rise residential areas’ building density, floor area ratio, wind projection angle, and average building height, with the mean pedestrian-level wind velocity ratio, it can be found that the above building layout factors have little effect on the mean pedestrian-level wind velocity ratio in multistory residential areas. However, there exists significant linear correlations between both the building density and wind projection angle with the mean pedestrian-level wind velocity ratio, and a weak correlation between floor area ratio and the mean pedestrian-level wind velocity ratio in high-rise residential areas.
This paper analyzed a prediction model of the mean pedestrian-level wind velocity ratio in high-rise residential areas. A multiple linear regression is used in this paper to analyze the quantitative relations among the variables. Through collinearity diagnostics, floor area ratio is removed, and the most significant variables building density and wind projection angle are ultimately chosen as the independent variables.
In the regression analysis, the significance level was set to 0.05, and the total sample number was 60 (shown in Table 3 and Table 5). The regression equation was:
VRmv = 1.086 − 2.806λb + 0.002θbw
where VRmv is the mean pedestrian-level wind velocity ratio of high-rise residential areas; λb is the building density of high-rise residential areas; and θbw is the wind projection angle of high-rise residential areas. The regression summary statistics are: R = 0.738; R2 = 0.545; standard error of estimate: 0.08102; F = 34.163, and; p = 0.000 < 0.005. The building density and wind projection angle of high-rise residential areas can explain 54.5% of the variation in the mean pedestrian-level wind velocity ratio by the model.
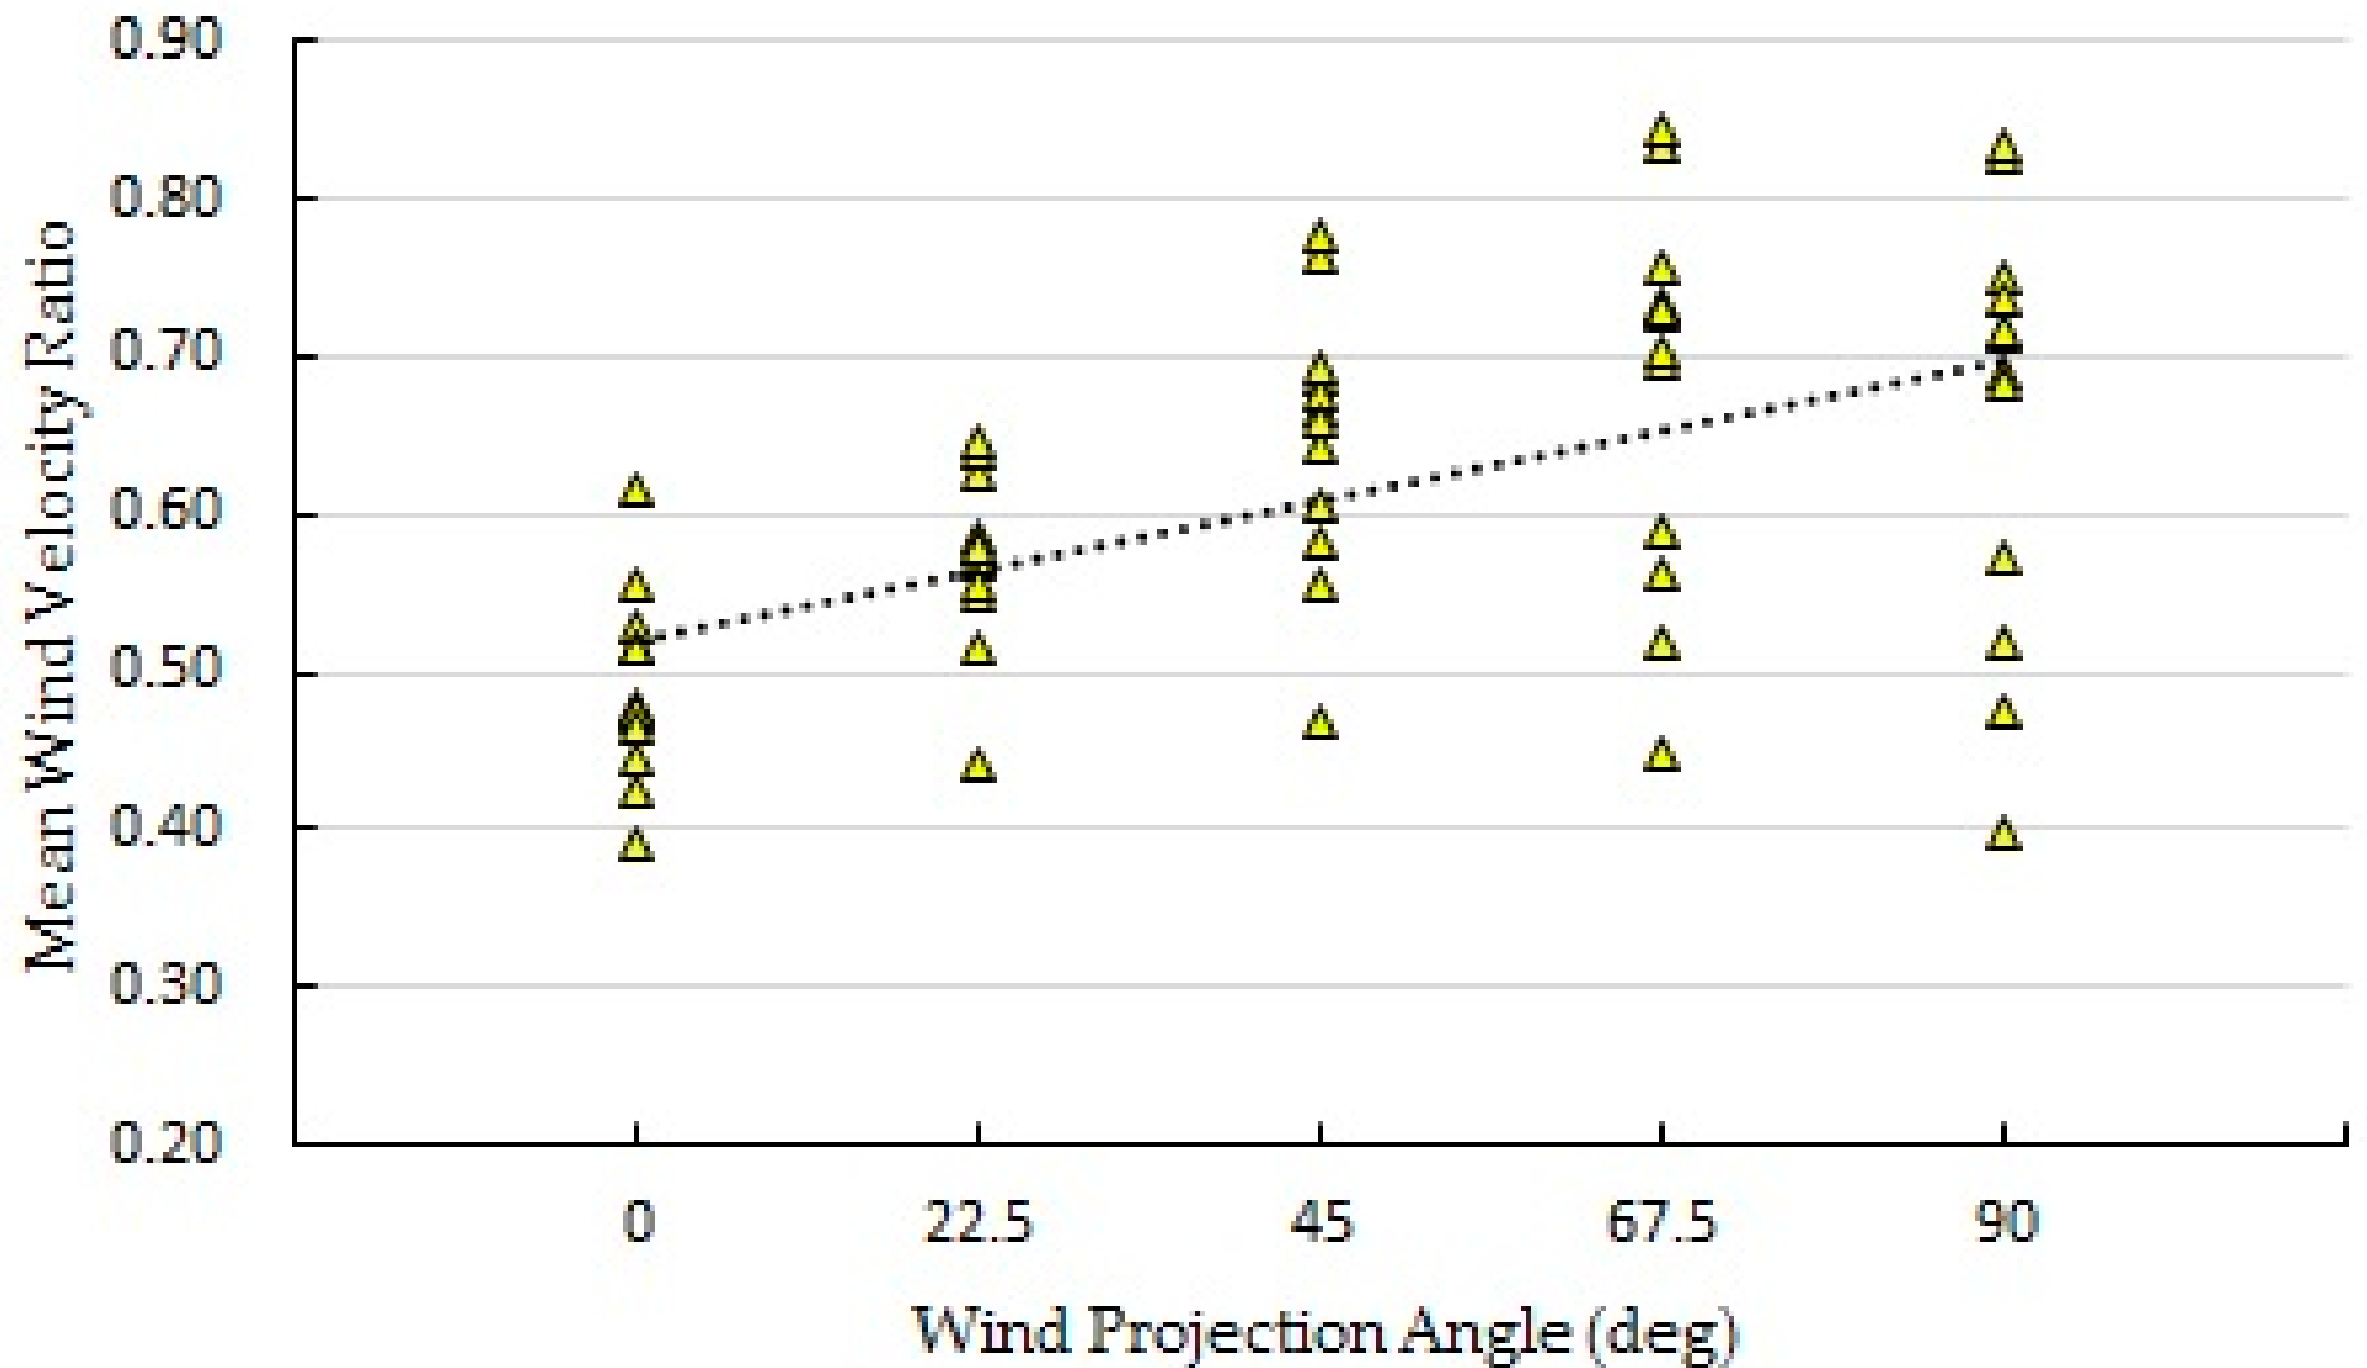
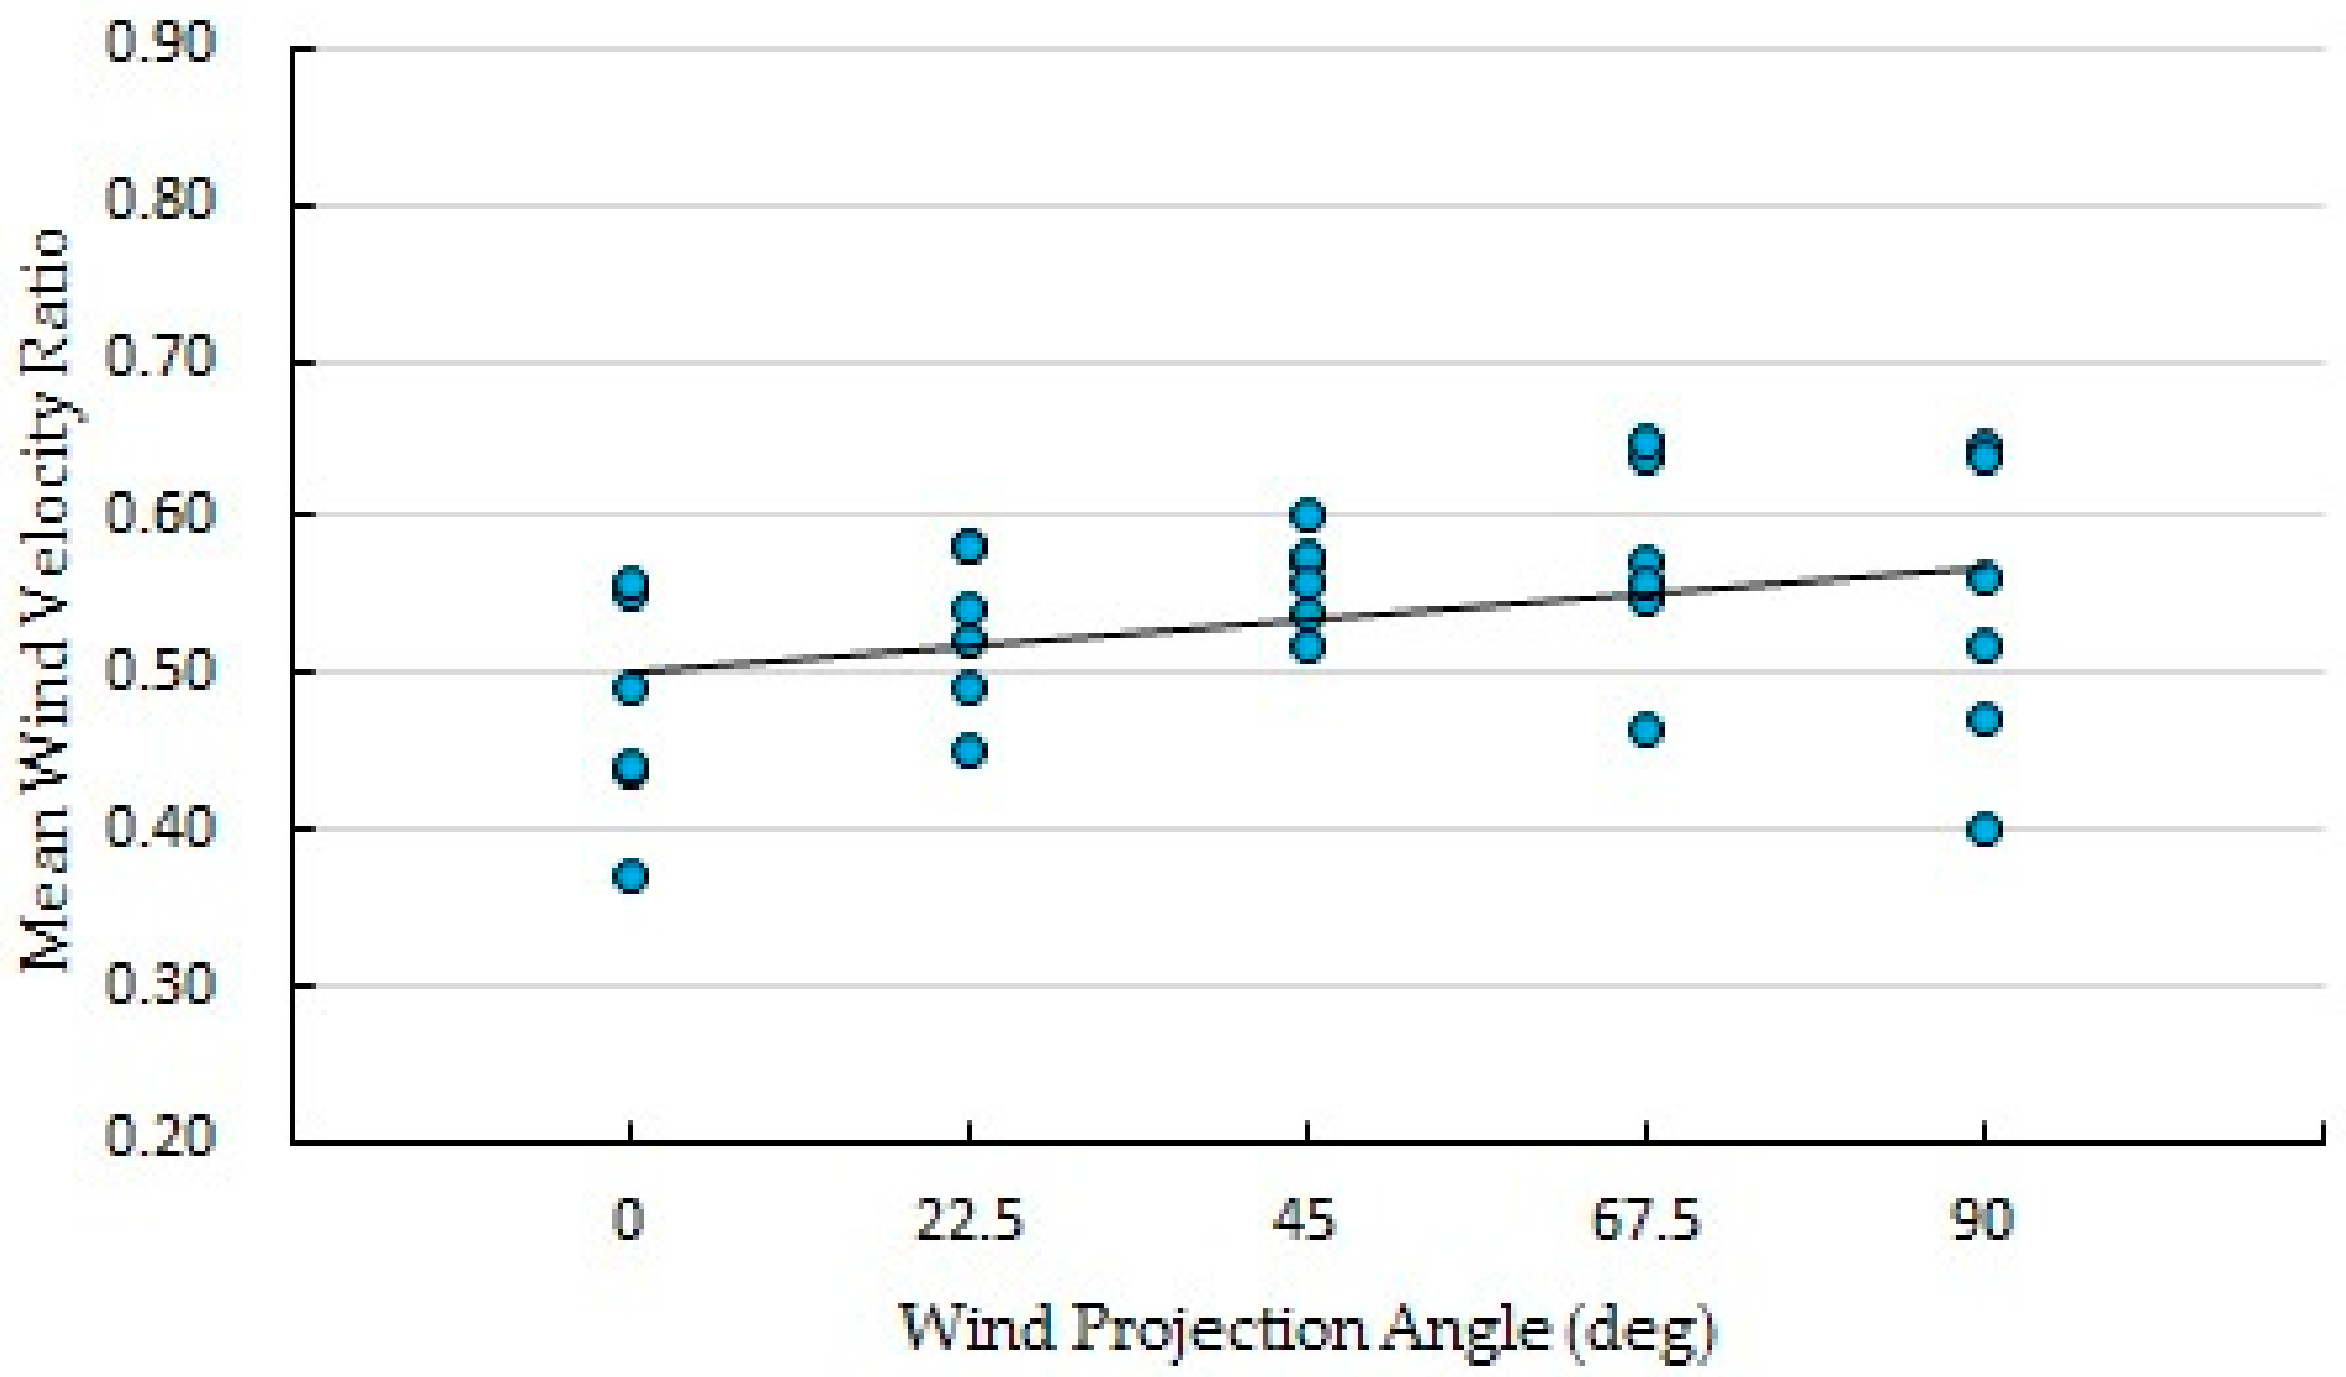
According to the Equation (1), when the building density of high-rise residential areas is held constant, the mean wind velocity ratio at pedestrian level will increase with an increase in the wind projection angle; when the wind projection angle in high-rise residential areas is held constant, the larger the building density, the lower the mean wind velocity ratio at pedestrian level becomes.

5. Conclusions

While previous researches focus mainly on the effect of relevant factors of building layout on the microclimate under dry heat and humid heat climate conditions, this paper, focusing on severe cold regions, studies the relationships between the mean wind velocity ratio at the pedestrian level and the residential areas’ building density, floor area ratio, wind projection angle, average building height, and high-rise buildings’ relative position, providing quantitative guidance for planning and evaluation for wind environment of residential areas. The conclusions are as follows:
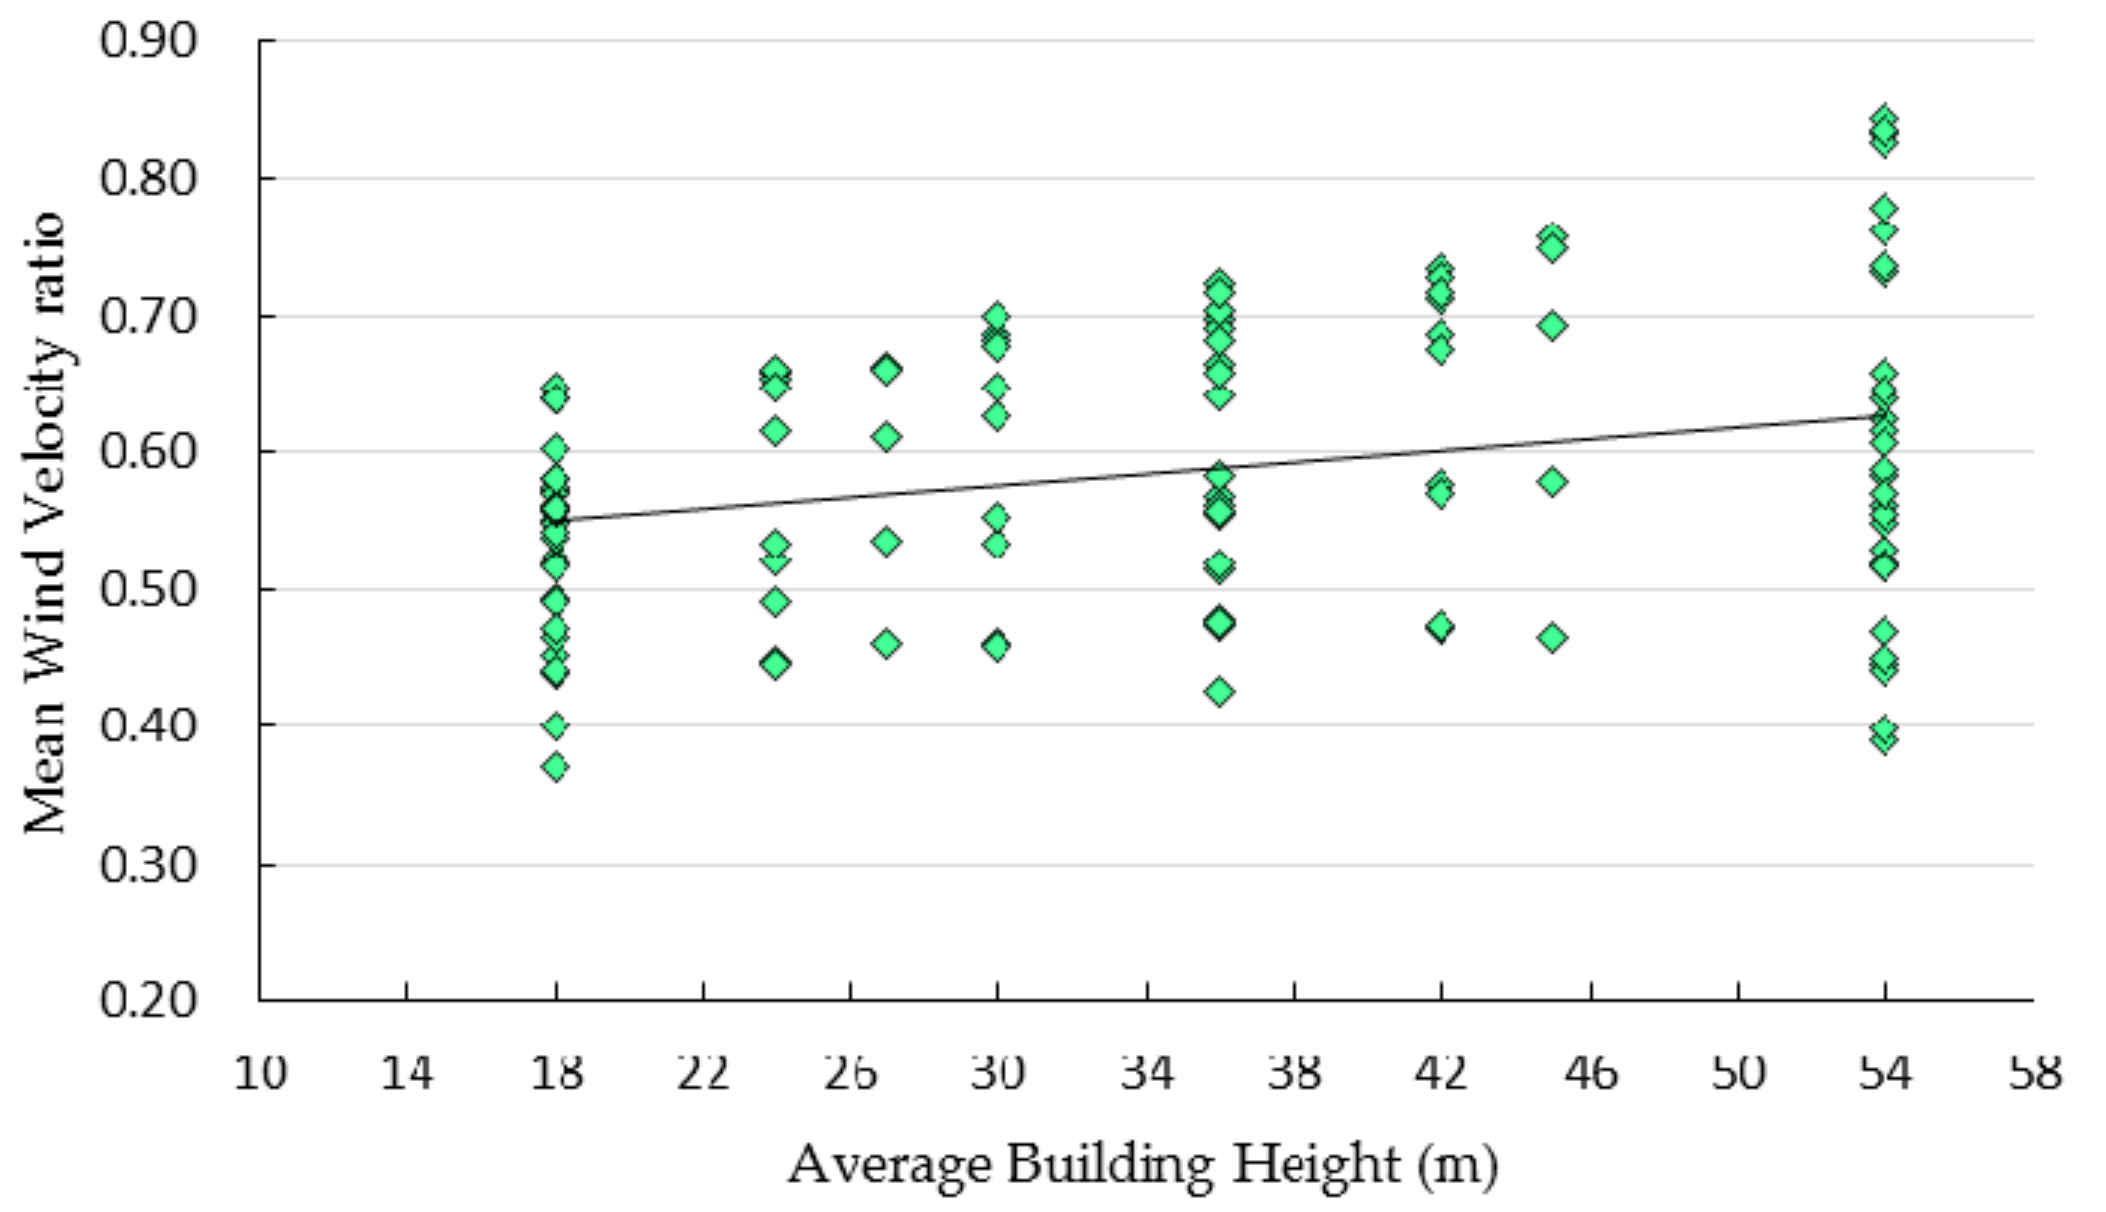
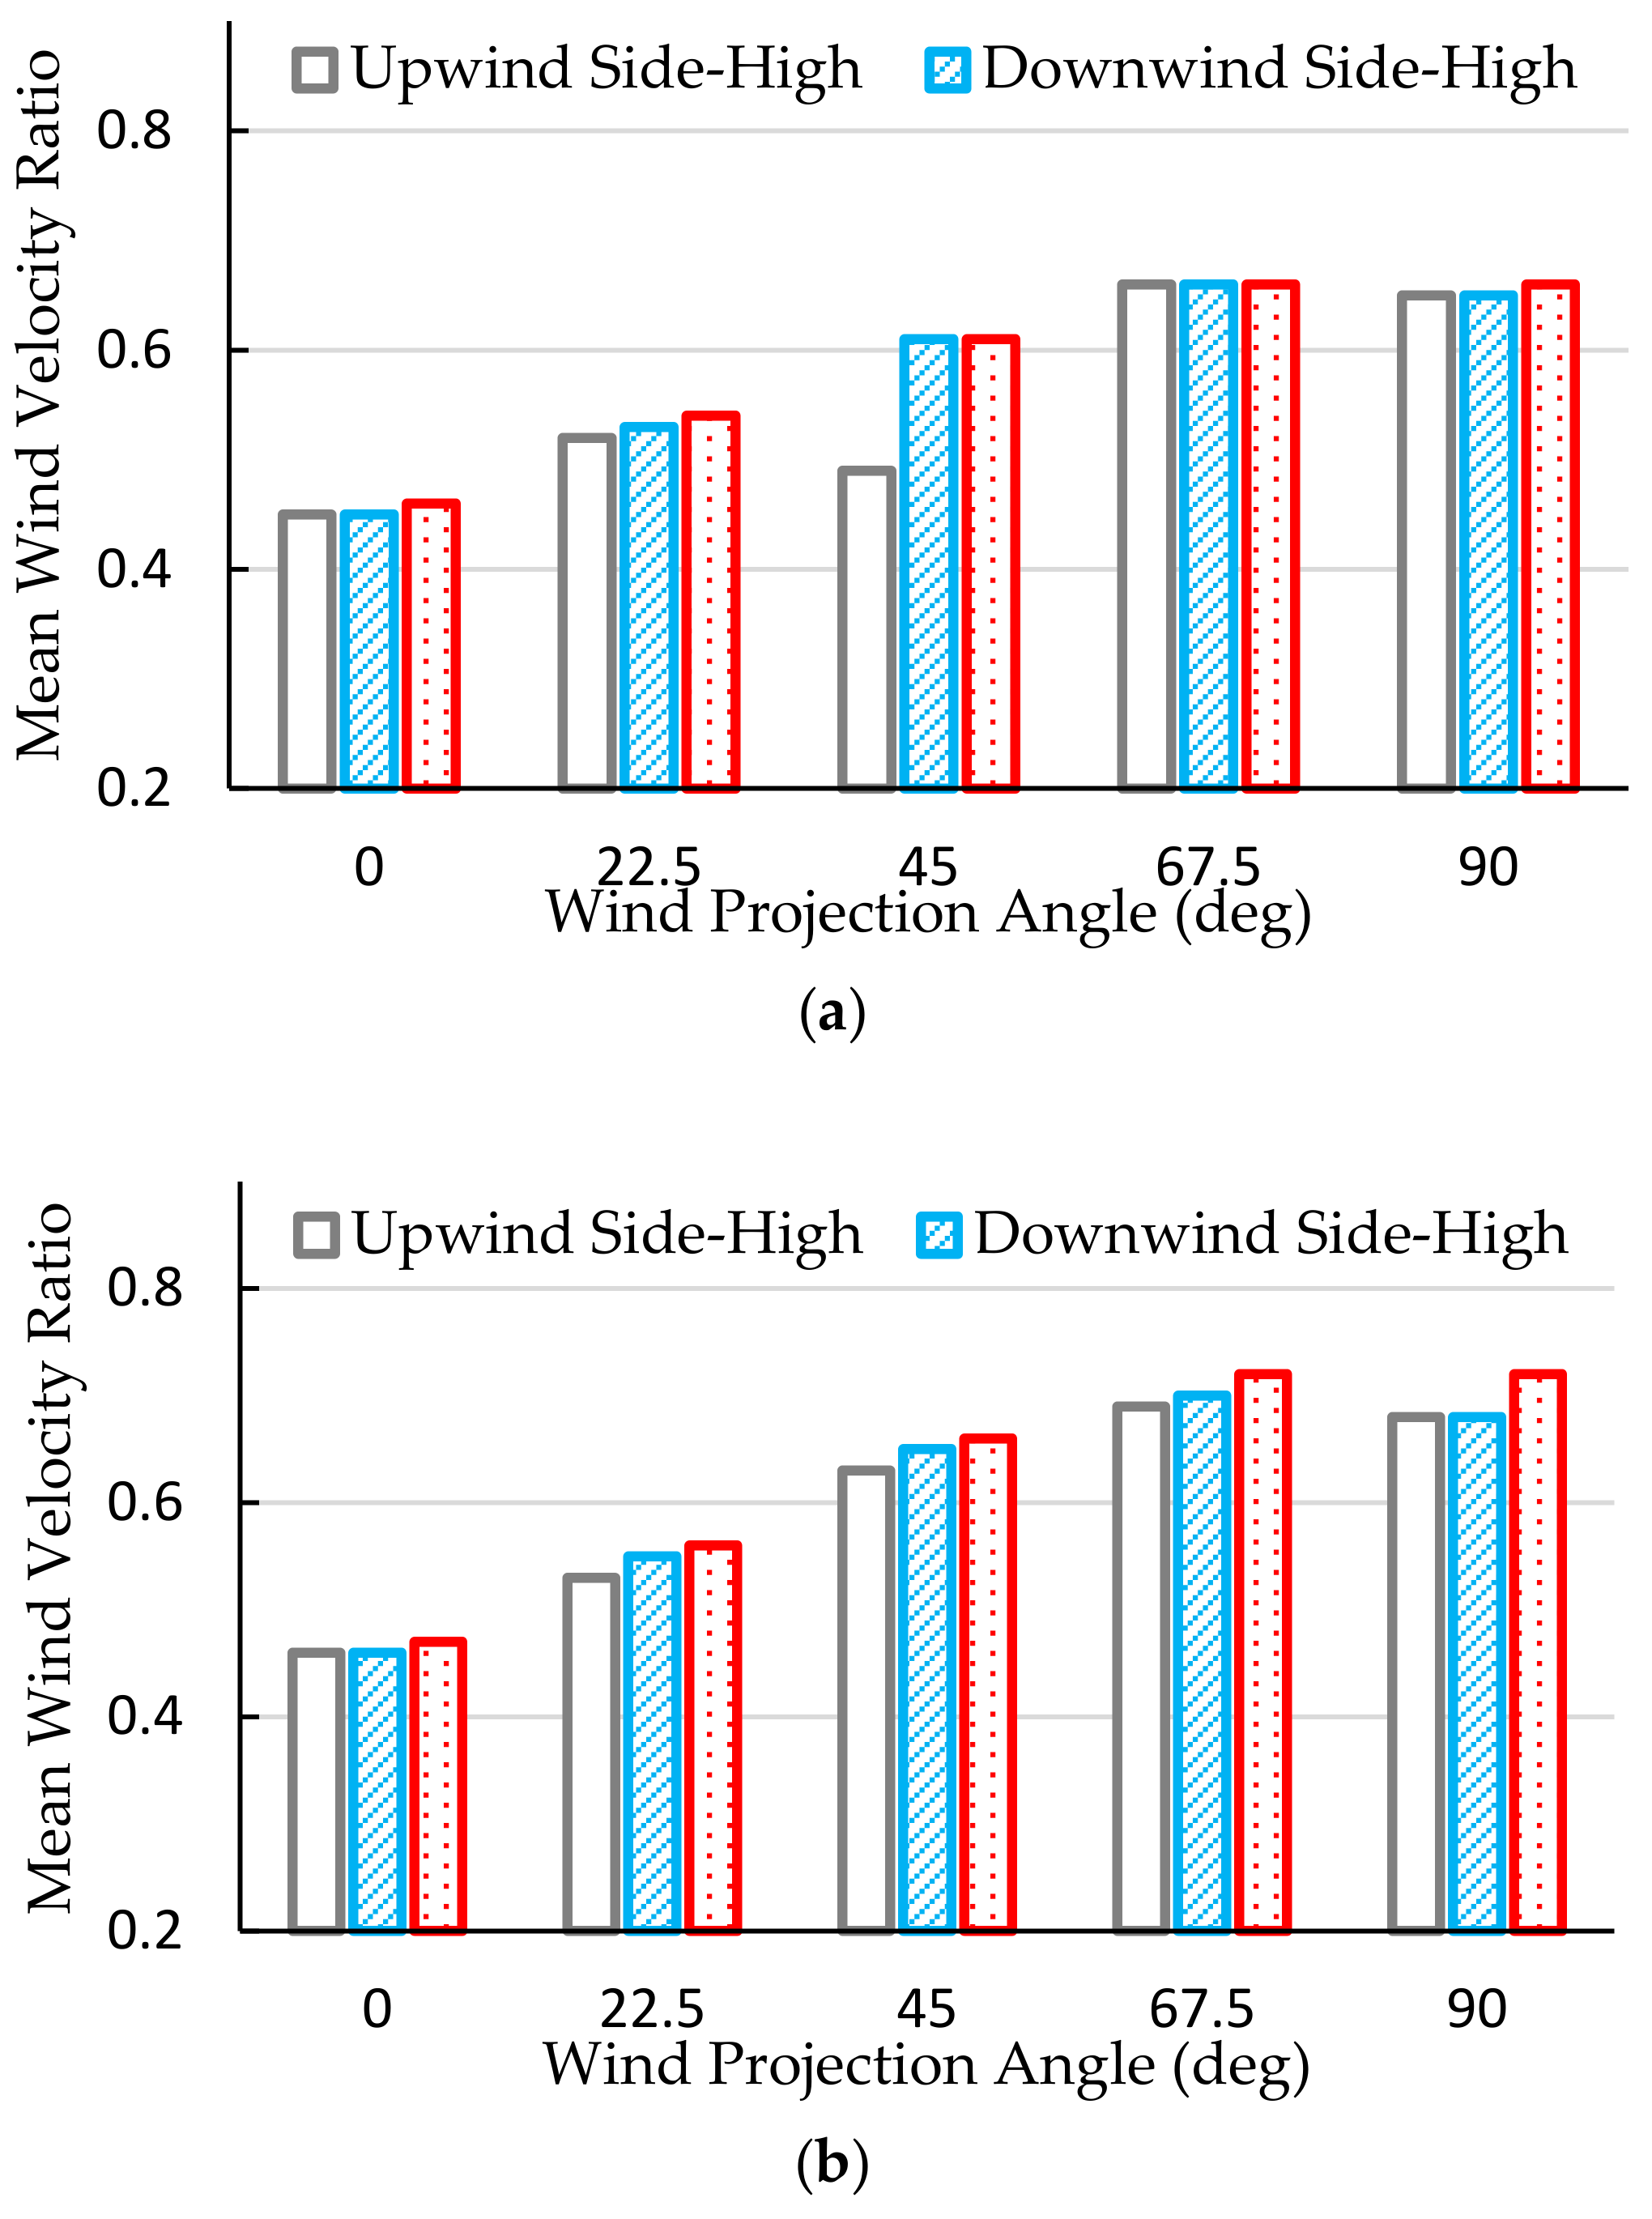
The building density of high-rise residential buildings has a significant negative linear correlation with the mean wind velocity ratio at the pedestrian level; when the building density is 19.5–23.4%, the interaction will be more significant. The building density of multistory residential areas has no linear correlation with the mean pedestrian-level wind velocity ratio. When the floor area ratio of high-rise residential areas is 2.34–3.12, the mean wind velocity ratio at pedestrian level has no obvious variation trend, and when the floor area ratio is 3.63–3.99, the mean pedestrian-level wind velocity ratio decreases gradually as the floor area ratio increases. The floor area ratio of multistory residential areas shows no linear correlation with the mean pedestrian-level wind velocity ratio. The relation between the wind projection angle and the mean pedestrian-level wind velocity ratio in high-rise residential areas is a significant positive linear correlation, and when the wind projection angle is 0–67.5°, the trend becomes more obvious. The influence of wind projection angle in multistory residential areas on the mean wind velocity ratio at pedestrian level is small. With rising average building height in residential areas, the mean pedestrian-level wind velocity ratio presents a slow increasing trend, but the correlation between the both is weak. For multi-high-level mixed residential areas, the three relative positions of high-rise buildings on the upwind side, downwind side or on both sides, have little influence on the mean pedestrian-level wind velocity ratio, which has a maximal difference of only 0.04.
Taking the building density and wind projection angle as independent variables, and through multiple linear regression analysis, a prediction model of the mean pedestrian-level wind velocity ratio of high-rise residential areas can be obtained. This prediction model has a high goodness of fit and can explain 54.5% of the variation. This prediction model can provide an accurate quantitative evaluation of the wind environment in high-rise residential areas in severe cold regions.

Acknowledgments

This work was financially supported by the National Natural Science Foundation of China (Grant Number: 51438005).

Author Contributions

Hong Jin, Zheming Liu, Yumeng Jin and Jian Kang conceived the paper and design the numerical study; Zheming Liu and Yumeng Jin performed the numerical simulation and field measurements, and analyzed the datas; Jing Liu performed the wind tunnel test; Zheming Liu drafted the paper; Jian Kang, Zheming Liu and Yumeng Jin revised the paper.

Conflicts of Interest

The authors declare no conflict of interest.

References

  1. Hassi, J.; Rytkönen, M.; Kotaniemi, J.; Rintamäki, H. Impacts of cold climate on human heat balance, performance and health in circumpolar areas. Int. J. Circumpolar Health 2005, 64, 459–467. [Google Scholar] [CrossRef] [PubMed]
  2. BBC NEWS. Europe Cold Weather Death Toll Rises. Available online: http://www.bbc.com/news/world-europe-38554357 (accessed on 6 October 2017).
  3. Analitis, A.; Katsouyanni, K.; Biggeri, A.; Baccini, M.; Forsberg, B.; Bisanti, L.; Kirchmayer, U.; Ballester, F.; Cadum, E.; Goodman, P.G.; et al. Effects of cold weather on mortality: Results from 15 European cities within the PHEWE project. Am. J. Epidemiol. 2008, 168, 1397–1408. [Google Scholar] [CrossRef] [PubMed]
  4. Healy, J.D. Excess winter mortality in Europe: A cross country analysis identifying key risk factors. J. Epidemiol. Community Health 2003, 57, 784–789. [Google Scholar] [CrossRef] [PubMed]
  5. Lai, D.; Guo, D.; Hou, Y.; Lin, C.; Chen, Q. Studies of outdoor thermal comfort in northern China. Build. Environ. 2014, 77, 110–118. [Google Scholar] [CrossRef]
  6. Abdel-Ghany, A.M.; Al-Helal, I.M.; Shady, M.R. Human Thermal Comfort and Heat Stress in an Outdoor Urban Arid Environment: A Case Study. Adv. Meteorol. 2013, 2013, 693541. [Google Scholar] [CrossRef]
  7. Steadman, R.G. Indices of wind-chill of clothed persons. J. Appl. Meteorol. 1971, 10, 674–683. [Google Scholar] [CrossRef]
  8. Jin, Y.; Kang, J.; Jin, H. Thermal Environment of Traditional Residential Street in Harbin in Winter. Build. Sci. 2016, 32, 34–38. [Google Scholar] [CrossRef]
  9. Ng, E.; Yuan, C.; Chen, L.; Ren, C.; Fung, J.C.H. Improving the wind environment in high-density cities by understanding urban morphology and surface roughness: A study in Hong Kong. Landsc. Urban Plan. 2011, 101, 59–74. [Google Scholar] [CrossRef]
  10. Abohela, I.; Hamza, N.; Dudek, S. Effect of roof shape, wind direction, building height and urban configuration on the energy yield and positioning of roof mounted wind turbines. Renew. Energy 2013, 50, 1106–1118. [Google Scholar] [CrossRef]
  11. Chen, H.; Ooka, R.; Harayama, K.; Kato, S.; Li, X. Study on outdoor thermal environment of apartment block in Shenzhen, China with coupled simulation of convection, radiation and conduction. Energy Build. 2004, 36, 1247–1258. [Google Scholar] [CrossRef]
  12. Yang, F.; Lau, S.S.Y.; Qian, F. Summertime heat island intensities in three high-rise housing quarters in inner-city Shanghai China: Building layout, density and greenery. Build. Environ. 2010, 45, 115–134. [Google Scholar] [CrossRef]
  13. Razak, A.A.; Hagishima, A.; Ikegaya, N.; Tanimoto, J. Analysis of airflow over building arrays for assessment of urban wind environment. Build. Environ. 2013, 59, 56–65. [Google Scholar] [CrossRef]
  14. Jiang, D.; Jiang, W.; Liu, H.; Sun, J. Systematic influence of different building spacing, height and layout on mean wind and turbulent characteristics within and over urban building arrays. Wind Struct. 2008, 11, 275–289. [Google Scholar] [CrossRef]
  15. Krüger, E.L.; Minella, F.O.; Rasia, F. Impact of urban geometry on outdoor thermal comfort and air quality from field measurements in Curitiba, Brazil. Build. Environ. 2011, 46, 621–634. [Google Scholar] [CrossRef]
  16. Johansson, E. Influence of urban geometry on outdoor thermal comfort in a hot dry climate: A study in Fez, Morocco. Build. Environ. 2006, 41, 1326–1338. [Google Scholar] [CrossRef]
  17. Tsang, C.W.; Kwok, K.C.S.; Hitchcock, P.A. Wind tunnel study of pedestrian level wind environment around tall buildings: Effects of building dimensions, separation and podium. Build. Environ. 2012, 49, 167–181. [Google Scholar] [CrossRef]
  18. Williams, C.D.; Wardlaw, R.L. Determination of the pedestrian wind environment in the city of Ottawa using wind tunnel and field measurements. J. Wind Eng. Ind. Aerodyn. 1992, 41, 255–266. [Google Scholar] [CrossRef]
  19. Zhang, A.; Gao, C.; Zhang, L. Numerical simulation of the wind field around different building arrangements. J. Wind Eng. Ind. Aerodyn. 2005, 93, 891–904. [Google Scholar] [CrossRef]
  20. Hong, B.; Lin, B. Numerical studies of the outdoor wind environment and thermal comfort at pedestrian level in housing blocks with different building layout patterns and trees arrangement. Renew. Energy 2015, 73, 18–27. [Google Scholar] [CrossRef]
  21. Carfan, A.C.; Galvani, E.; Nery, J.T. Study of thermal comfort in the City of São Paulo using ENVI-met model. Investig. Geogr. Bol. Inst. Geogr. UNAM 2012, 78, 34–47. [Google Scholar] [CrossRef]
  22. Emmanuel, R.; Rosenlund, H.; Johansson, E. Urban shading—A design option for the tropics? A study in Colombo, Sri Lanka. Int. J. Climatol. 2007, 27, 1995–2004. [Google Scholar] [CrossRef]
  23. Yumeng, J. Study and Design of Enclosed Residential Streets Based on Thermal-Acoustic Environment in Severe Cold Area. Master’s Thesis, Harbin Institute of Technology, Harbin, China, 2017. [Google Scholar]
  24. Siqi, L. Cold Region Pedestrian Thermal Comfort Study. Master’s Thesis, Harbin Institute of Technology, Harbin, China, 2017. [Google Scholar]
  25. Huttner, S. Further Development and Application of the 3D Microclimate Simulation ENVI-met. Ph.D. Thesis, Mainz University, Mainz, Germany, 2012. [Google Scholar]
  26. Yang, X. A Simulation Method for the Effects of Urban Microclimate on Building Cooling Energy Use. Ph.D. Thesis, South China University of Technology, Guangzhou, China, 2012. [Google Scholar]
  27. ENVI-met. Introduction. Available online: http://www.envi-met.com/introduction/ (accessed on 16 October 2017).
  28. Conry, P.; Sharma, A.; Potosnak, M.J.; Leo, L.S.; Bensman, E.; Hellmann, J.J.; Fernando, H.J.S. Chicago’s Heat Island and Climate Change: Bridging the Scales via Dynamical Downscaling. J. Appl. Meteorol. Climatol. 2015, 54, 1430–1448. [Google Scholar] [CrossRef]
  29. ENVI-met. Nesting Grids. Available online: http://www.envi-met.info/doku.php?id=kb:nesting (accessed on 5 December 2017).
  30. Salata, F.; Golasi, I.; de Lieto Vollaro, R.; de Lieto Vollaro, A. Urban microclimate and outdoor thermal comfort. A proper procedure to fit ENVI-met simulation outputs to experimental data. Sustain. Cities Soc. 2016, 26, 318–343. [Google Scholar] [CrossRef]
  31. Ng, E.; Chen, L.; Wang, Y.; Yuan, C. A study on the cooling effects of greening in a high-density city: An experience from Hong Kong. Build. Environ. 2012, 47, 256–271. [Google Scholar] [CrossRef]
  32. ENVI-met. Configuration File-Basic Settiings. Available online: http://www.envi-met.info/doku.php?id=basic_settings (accessed on 5 December 2017).
  33. Wieringa, J. Representativeness of wind observations at airports. Bull. Am. Meteorol. Soc. 1980, 61, 962–971. [Google Scholar] [CrossRef]
  34. Kubota, T.; Miura, M.; Tominaga, Y.; Mochida, A. Wind tunnel tests on the relationship between building density and pedestrian-level wind velocity: Development of guidelines for realizing acceptable wind environment in residential neighborhoods. Build. Environ. 2008, 43, 1699–1708. [Google Scholar] [CrossRef]
  35. Deng, J.Y.; Wong, N.H.; Zheng, X. The Study of the Effects of Building Arrangement on Microclimate and Energy Demand of CBD in Nanjing, China. Procedia Eng. 2016, 169, 44–54. [Google Scholar] [CrossRef]
Figure 1. Basic ENVI-met software model layout.
Sustainability 09 02310 g001
Figure 2. Comparison between the pedestrian-level wind velocity ratio result at each data collection point in the wind tunnel test and the ENVI-met simulations with different grid resolutions. (a) ENVI-met with a grid resolution of 2 m × 2 m × 3 m; (b) ENVI-met with a grid resolution of 3 m × 3 m × 3 m; (c) ENVI-met with a grid resolution of 3 m × 3 m × 6 m; (d) ENVI-met with a grid resolution of 4 m × 4 m × 6 m.
Sustainability 09 02310 g002
Figure 3. Accuracy validation of ENVI-met wind environment simulation using field measurement. (a) Simulation domain and location of measurement points; (b) Comparison between measured and ENVI-met simulated wind speed at 1.8 m height.
Sustainability 09 02310 g003
Figure 4. Relationship between building density and mean pedestrian-level wind velocity ratio in high-rise and multistory residential areas.
Sustainability 09 02310 g004
Figure 5. Relationship between floor area ratio and mean pedestrian-level wind velocity ratio of high-rise and multistory residential areas.
Sustainability 09 02310 g005
Figure 6. Relationship between wind projection angle and mean pedestrian-level wind velocity ratio in high-rise residential areas.
Sustainability 09 02310 g006
Figure 7. Relationship between wind projection angle and mean pedestrian-level wind velocity ratio in multistory residential areas.
Sustainability 09 02310 g007
Figure 8. Relationship between average building height and mean pedestrian-level wind velocity ratio in residential areas.
Sustainability 09 02310 g008
Figure 9. Relationship between the relative position of high-rise buildings and mean pedestrian-level wind velocity ratio in multi-high-level mixed residential areas: (a) the building heights are 18 and 36 m; (b) the building heights are 18 and 54 m.
Sustainability 09 02310 g009
Table 1. Quantitative verification of the ENVI-met performance with different grid resolutions based on root mean square error (RMSE) and the mean absolute percentage error (MAPE).
Grid ResolutionRMSEMAPE (%)
2 m × 2 m × 3 m0.167432.47
3 m × 3 m × 3 m0.157830.09
3 m × 3 m × 6 m0.155930.47
4 m × 4 m × 6 m0.173133.60
Table 2. Illustration of the study cases that have been modeled in the study and the images of the residential areas from Google Earth.
Multistory Residential Areas
Sustainability 09 02310 i001 Sustainability 09 02310 i002
Case 1Case 2
Sustainability 09 02310 i003 Sustainability 09 02310 i004
Case 3Case 4
Sustainability 09 02310 i005 Sustainability 09 02310 i006
Case 5Case 6
High-Rise Residential Areas
Sustainability 09 02310 i007 Sustainability 09 02310 i008
Case 7Case 8
Sustainability 09 02310 i009 Sustainability 09 02310 i010
Case 9Case 10
Sustainability 09 02310 i011 Sustainability 09 02310 i012
Case 11Case 12
Sustainability 09 02310 i013 Sustainability 09 02310 i014
Case 13Case 14
Sustainability 09 02310 i015 Sustainability 09 02310 i016
Case 15Case 16
Sustainability 09 02310 i017 Sustainability 09 02310 i018
Case 17Case 18
Multi-High-Level Mixed Residential Areas
Sustainability 09 02310 i019 Sustainability 09 02310 i020
Case 19Case 20
Sustainability 09 02310 i021 Sustainability 09 02310 i022
Case 21Case 22
Sustainability 09 02310 i023 Sustainability 09 02310 i024
Case 23Case 24
Note: Sustainability 09 02310 i025.
Table 3. The parameter information of study cases.
CaseBuilding Density (%)Floor Area RatioAverage Building Height (m)Proportion of Buildings by Height (%)
18 m36 m54 m
122.721.3618100
225.961.5618100
327.041.6218100
428.671.7218100
530.291.8218100
630.831.8518100
719.472.3436100
821.632.6036100
923.372.8036100
1020.552.92426337
1120.552.92426337
1219.472.99454456
1315.142.7354100
1417.313.1254100
1520.193.6354100
1620.553.7054100
1721.633.8954100
1822.183.9954100
1924.882.01246535
2024.882.01246535
2123.802.21274555
2223.802.34306832
2323.802.34306832
2421.632.60365050
Table 4. Initial configuration data in the ENVI-met simulation models.
Start and Duration of the Model
Date of Simulation24 January 2017
Start Time04:00:00
Total Simulation Time (h)44
Initial Meteorological Conditions
Wind Speed Measured at 10 m Height (m/s)3.1
Wind Direction (deg)180°, 202.5°, 225°, 247.5°, 270° (0° is north, 90° is east)
Roughness Length at Measurement Site (m)0.1
Initial Temperature of Atmosphere (°C)−18.2
Specific Humidity at Model Top (2500 mg/kg)7
Relative Humidity at 2 m Height (%)67.6
Table 5. Mean wind velocity ratio at pedestrian-level at each of the five different wind projection angles for every study case.
Mean Wind Velocity Ratio
Angle22.5°45°67.5°90°
Case
10.370.450.570.640.65
20.440.520.600.650.64
30.550.580.570.550.52
40.440.490.540.570.56
50.490.540.520.460.40
60.560.580.560.560.47
70.430.510.640.700.69
80.480.570.660.700.68
90.550.580.560.520.47
100.470.580.690.730.71
110.470.570.680.730.72
120.460.580.690.760.75
130.530.620.760.830.83
140.520.640.780.840.83
150.450.550.660.730.74
160.620.650.610.560.52
170.520.550.580.590.57
180.390.440.470.450.40
190.450.520.490.660.65
200.450.530.610.660.65
210.460.540.610.660.66
220.460.530.630.690.68
230.460.550.650.700.68
240.470.560.660.720.72
Table 6. Pearson correlation coefficient analysis of building density and mean pedestrian-level wind velocity ratio (correlation coefficient/p-level).
High-Rise Residential Areas (All Values)High-Rise Residential Areas (Mean Values)Multistory Residential Areas (All Values)Multistory Residential Areas (Mean Values)
−0.506/0.000−0.794/0.002−0.168/0.374−0.421/0.405
Note: All values represent the correlation analysis based on mean wind velocity ratio of every study case. Mean values represent the correlation analysis based on mean values of mean wind velocity ratios of study cases with the same building density. The significant level is set at 0.05.
Table 7. Pearson correlation coefficient analysis of floor area ratio and mean pedestrian-level wind velocity ratio (correlation coefficient/p-level).
High-Rise Residential Areas (All Values)High-Rise Residential Areas (Mean Values)Multistory Residential Areas (All Values)Multistory Residential Areas (Mean Values)
−0.308/0.017−0.475/0.119−0.168/0.374−0.422/0.405
Note: All values represent the correlation analysis based on mean wind velocity ratio of every study case. Mean values represent the correlation analysis based on mean values of mean wind velocity ratios of study cases with the same floor area ratio. The significant level is set at 0.05.
Table 8. Pearson correlation coefficient analysis of wind projection angle and mean pedestrian-level wind velocity ratio (correlation coefficient/p-level).
High-Rise Residential Areas (All Values)High-Rise Residential Areas (Mean Values)Multistory Residential Areas (All Values)Multistory Residential Areas (Mean Values)
0.538/0.0000.902/0.0360.345/0.0610.735/0.157
Note: All values represent the correlation analysis based on mean wind velocity ratio of every study case. Mean values represent the correlation analysis based on mean values of mean wind velocity ratios of study cases with the same wind projection angle. The significant level is set at 0.05.
Table 9. Pearson correlation coefficient analysis of average building height and mean pedestrian-level wind velocity ratio (correlation coefficient/p-level).
All Residential Areas (All Values)All Residential Areas (Mean Values)High-Rise Residential Areas (All Values)High-Rise Residential Areas (Mean Values)
0.268/0.0030.798/0.1060.040/0.7640.267/0.733
Note: All residential areas include multistory, high-rise and multi-high-level mixed residential areas. All values represent the correlation analysis based on mean wind velocity ratio of every study case. Mean values represent the correlation analysis based on mean values of mean wind velocity ratios of study cases with the same average building height. The significant level is set at 0.05.

