Effect of Corrosion Products and Deposits on the Damage Tolerance of TSA-Coated Steel in Artificial Seawater


1
Materials Innovation Centre, School of Engineering, University of Leicester, Leicester LE1 7RH, UK
2
NSIRC, TWI Ltd., Granta Park, Great Abington, Cambridge CB21 6AL, UK
3
Facultad de Ingeniería, Universidad Tecnológica de Bolívar, Km 1 Vía Turbaco, Cartagena 130011, Colombia
4
School of Engineering, University of Leicester, Leicester LE1 7RH, UK
5
Materials and Structural Integrity Technology Group, TWI, Granta Park, Cambridge CB21 6AL, UK
*
Author to whom correspondence should be addressed.
Surfaces 2022, 5(1), 113-126; https://0-doi-org.brum.beds.ac.uk/10.3390/surfaces5010005
Submission received: 23 December 2021
/
Revised: 7 January 2022
/
Accepted: 11 January 2022
/
Published: 20 January 2022
Abstract
:The corrosion module of COMSOL Multiphysics 5.6® software was employed to simulate the influence of the corrosion products and calcareous deposits on the damage tolerance of a Thermally Sprayed Aluminium coating (TSA) in a simulated marine immersion environment. The capacity of TSA to polarise the steel was evaluated by modelling 5%, 50%, and 90% of the sample uncoated’s area (i.e., substrate exposed). Additionally, the consumption of the sacrificial coating was simulated by Arbitrary Lagrangian-Eulerian (ALE) for the geometry of the experimental system. The parameters used in the model were obtained from polarisation curves and Electrochemical Impedance Spectroscopy (EIS) available in the literature. The results are in good agreement with measurements of Open Circuit Potential (OCP) and Corrosion Rate (CR) from experiments reported in previous studies. The model predicted the sacrificial protection offered by TSA as a function of the exposed steel surfaces, indicating the ability of TSA coating to polarise steel even with up to 90% damage. Furthermore, a 90–70% reduction in the corrosion rate of TSA was calculated with the simultaneous influence of corrosion products and deposits formed after 20 days of exposure to artificial seawater at room temperature.
1. Introduction
In offshore steel structures, galvanic anodes in conjunction with dielectric barrier coatings are often used for corrosion control. However, the complexity of installing cathodic protection system offshore add costs and risks. Furthermore, an unexpected failure of protective paint can lead to severe corrosion. The onset of pitting corrosion can act as fatigue crack initiation sites exacerbating the situation, particularly in offshore wind turbines [1]. Cathodic protection systems maintenance and coating repairs are expensive and sometimes unfeasible. It is estimated that offshore coating repairs cost 50–100 times greater than onshore installations [1,2]. Therefore, a reliable corrosion mitigation system requiring little or no maintenance is desirable.
Alternatively, sacrificial coatings based on Thermal Spray Aluminium (TSA) are often used to protect offshore structures [3]. In 2017, an offshore wind farm project developed a fully-automated TSA coating application process on an industrial scale. This technological innovation led to the installation of 60 offshore wind structures in the German Baltic Sea using TSA coating with sealant as the primary corrosion control system instead of conventional organic coating and galvanic anodes [4]. This advance is also due to the ability of TSA coating to polarise the steel in seawater, which has been demonstrated from experience [5], laboratory tests in simulated environments, and trials on site [6,7]. It is now well established from several studies that TSA coating provides corrosion protection, in the atmospheric, splash, and submerged zones [8,9].
TSA coating acts as a barrier and offers cathodic protection even if some form of damage occurs during the operational life, such as by floating debris or accidental impact. The protection mechanism offered by TSA coating with an exposed steel surface in simulated marine conditions has been explained from several investigations [6,10,11]. The process involves multiple and simultaneous reactions however, the protection can be attributed mainly to two reasons: (i) When aluminium and steel are in electrical contact, a galvanic couple is established between these metals (TSA as anode and exposed steel as cathode) hence, TSA provides cathodic protection by acting as a sacrificial anode, and (ii) the formation of deposits on steel reduces the cathodic area, and the diffusion of dissolved O is hindered [12]. Throughout this paper, the term ‘deposits’ will refer to the bi-layer on steel surface composed by brucite (Mg(OH)) and aragonite (CaCO), while Al oxides and hydroxides on TSA coating will be named as ‘corrosion products’. The formation of these compounds will be covered later in the discussion section.
The damage tolerance can be defined as the ability of TSA coating to polarise exposed steel to protective potentials without excessive consumption of the coating. Therefore, the presence of deposits on exposed steel and the passivation tendency of aluminium in seawater are crucial in determining such tolerance. The formation and stability of these protective layers are influenced by different variables such as temperature, seawater components, sea current, growth marine, time of exposure, changes in local pH, concentration of OH and Cl, just to name a few, making the study of this process a complex subject [13]. In addition, experiments conducted in the lab recognise the difficulty of distinguishing the kinetics of TSA and exposed steel using electrochemical techniques [14].
Damage to the TSA coating can occur during installation or operation, resulting in a reduction in service life due to the anodic nature of the coating. However, the quantification of the damage level that TSA can tolerate is not fully explored. While long term tests conclude that TSA provides protection when the defect surface is between 1% and 5% [6,10,14], there are limited data on damage tolerance in the presence of a large cathode.
This work seeks to address the above gaps through numerical simulations. Although extensive research has been carried out on TSA coating as a method of corrosion mitigation in offshore environments, no study exists that simulates the long-term performance and predicts the lifetime of such coating in the presence of damage. It must be recognised that corrosion simulations of sacrificial zinc and aluminium coatings [15,16,17,18], calcareous deposits formation on cathodically protected steel in seawater [19,20], and localised corrosion in aluminium alloys [21,22] have been found separately in the literature. However, simulations of TSA–steel coated with defects in seawater have not been configured simultaneously in a single model, and the complexity and influence of different variables are likely to pose challenges in modelling. Therefore, this study proposes the simulation of the damage tolerance of TSA, considering the combined effect of deposits and corrosion products using data from the previous studies of cathodic reactions by Electrochemical Impedance Spectroscopy (EIS) [14].
2. Materials and Methods
The simulation of the damage tolerance of TSA with varying areas of exposed steel was conducted using the corrosion module of COMSOL Multiphysics 5.6® software. In addition, a time-dependent model was introduced to determine TSA consumption and visualise its dissolution over time.
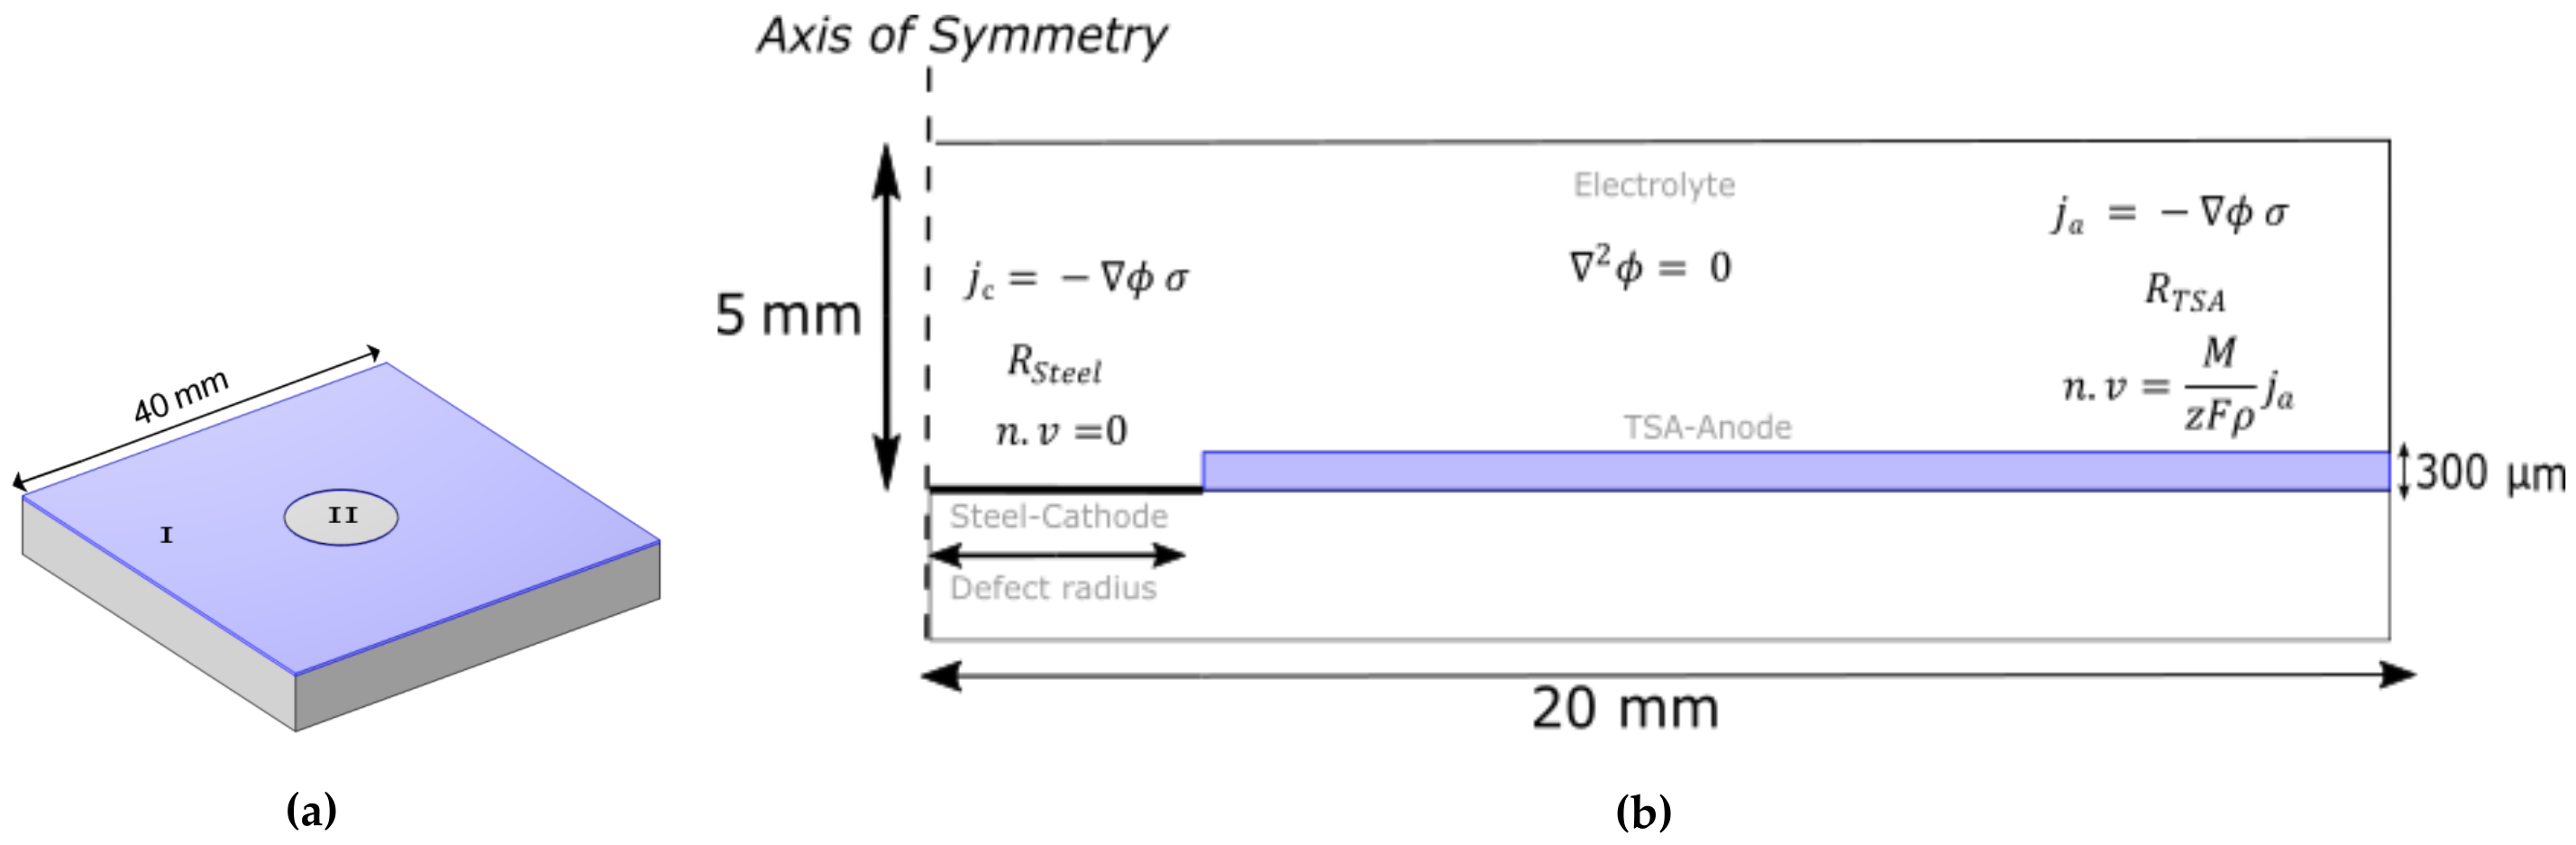
The simulated potential and corrosion rate were compared with experimental data available in the literature of the electrochemical performance of TSA coating with an intentional damage area of 5% [6,10,14]. All comparison tests evaluated the 300-m thick coating of pure aluminium (1050 alloy, 99.5 wt% Al) obtained by spraying arc wire deposited on low carbon steel samples at room temperature under conditions of total immersion using seawater artificial according to ASTM D1141-98 [23]. Details of the coating obtaining process and experimental methods can be found elsewhere [6,10,14]. Figure 1a shows schematically the shape of the physical specimen. Turning now to the model system, the equations that govern the simulation are explained below.
2.1. Governing Equations
The model is based on the transport of dissolved species in an electrolyte according to the Nernst–Planck equation (Equation (1)).
where is the flux of dissolved species i, is the diffusion coefficient of species i, is the concentration of species i, is the valence, F is the Faraday constant, R is the molar gas constant, T is the temperature, V is the fluid velocity, and is the electrical potential. Considering quiescent electrolyte, the fluid velocity V can be set to zero. Since no reactions are expected between the dissolved species, the material balance for the species is given by Equation (2):
The electrolyte is subject to an electroneutrality condition, given by Equation (3):
Transport by convection and diffusion are neglected thus, Equation (1) takes the form of the Laplace equation (Equation (4)) to calculate the distribution of potential over the electrolyte domain:
Ohm’s law is applied to calculate potential gradient on the anode and cathode boundaries, according to Equations (5) and (6) respectively.
where is the electrolyte conductivity and , are the local anodic and cathodic current densities at each electrode surface.
On the TSA surface, is the sum of aluminium oxidation and oxygen reduction current. Similarly, in the exposed steel boundary, comprises iron oxidation and oxygen reduction current, according to the expressions given in Equations (7) and (8).
where is the exchange current density of TSA or steel. and are anodic or cathodic Tafel coefficients, is the overpotential represented by Equation (9), where is the potential on the anode or cathode, is the potential over electrolyte domain, and is the corrosion potential:
To evaluate the effect of corrosion products and deposits simultaneously on the damage tolerance of TSA, a film resistance was assumed as a boundary condition on each electrode surface. The film resistance on TSA and exposed steel were designated as and , respectively, see Equations (10) and (11):
In this way, each electrode receive an extra potential contribution due to the film resistance according to Equation (12):
2.2. Time-Dependent Model
Arbitrary Lagrangian–Eulerian (ALE) is a moving mesh technique that simulates a realistic scenario of a corroding electrode over time in a galvanic couple [15,24]. TSA was assumed to only corrode in the normal direction of the electrode boundary. Thus, the ALE method was employed to calculate the consumption of the TSA and achieve the displacement of the mesh according to Equations (13) and (14).
where n denotes the normal component of velocity vector v, M is the molar mass, and the density of the dissolving species.
2.3. Geometry and Boundary Conditions
The geometry was built to match the area of the physical sample evaluated in the experiments [6,10,14] (Figure 1a). Exposed steel surfaces of 5%, 50%, and 90%, were recreated in a 2D axi-symmetric space dimension component by varying the defect radius with 5 mm, 16 mm, and 21.4 mm, respectively. Figure 1b shows the boundary conditions in the modelled geometry.
Figure 1.
(a) Schematic of the thermally sprayed coated sample used in the experiments. I-TSA coating. II-Exposed Steel 5%. (b) Boundary conditions.
Figure 1.
(a) Schematic of the thermally sprayed coated sample used in the experiments. I-TSA coating. II-Exposed Steel 5%. (b) Boundary conditions.

2.4. Parameters
Table 1 presents the kinetic parameters, taken from polarisation curves performed after 24 h of immersion in artificial seawater. The constants used in the model are also indicated.
The values to simulate the effect of corrosion products and deposits are based on the findings reported by R. Grinon et al. [14]. Hence, in this model represents deposits on the exposed steel. Similarly, acts as corrosion product layer on TSA coating. The value of these parameters are indicated in Table 2.
The combined effect of corrosion products and deposits on the TSA damage tolerance simulation will be named as follows:
- E0: No corrosion products or deposits;
- E1: Corrosion products and deposits formed in 10 d;
- E2: Corrosion products and deposits formed in 20 d.
3. Results
3.1. Potential
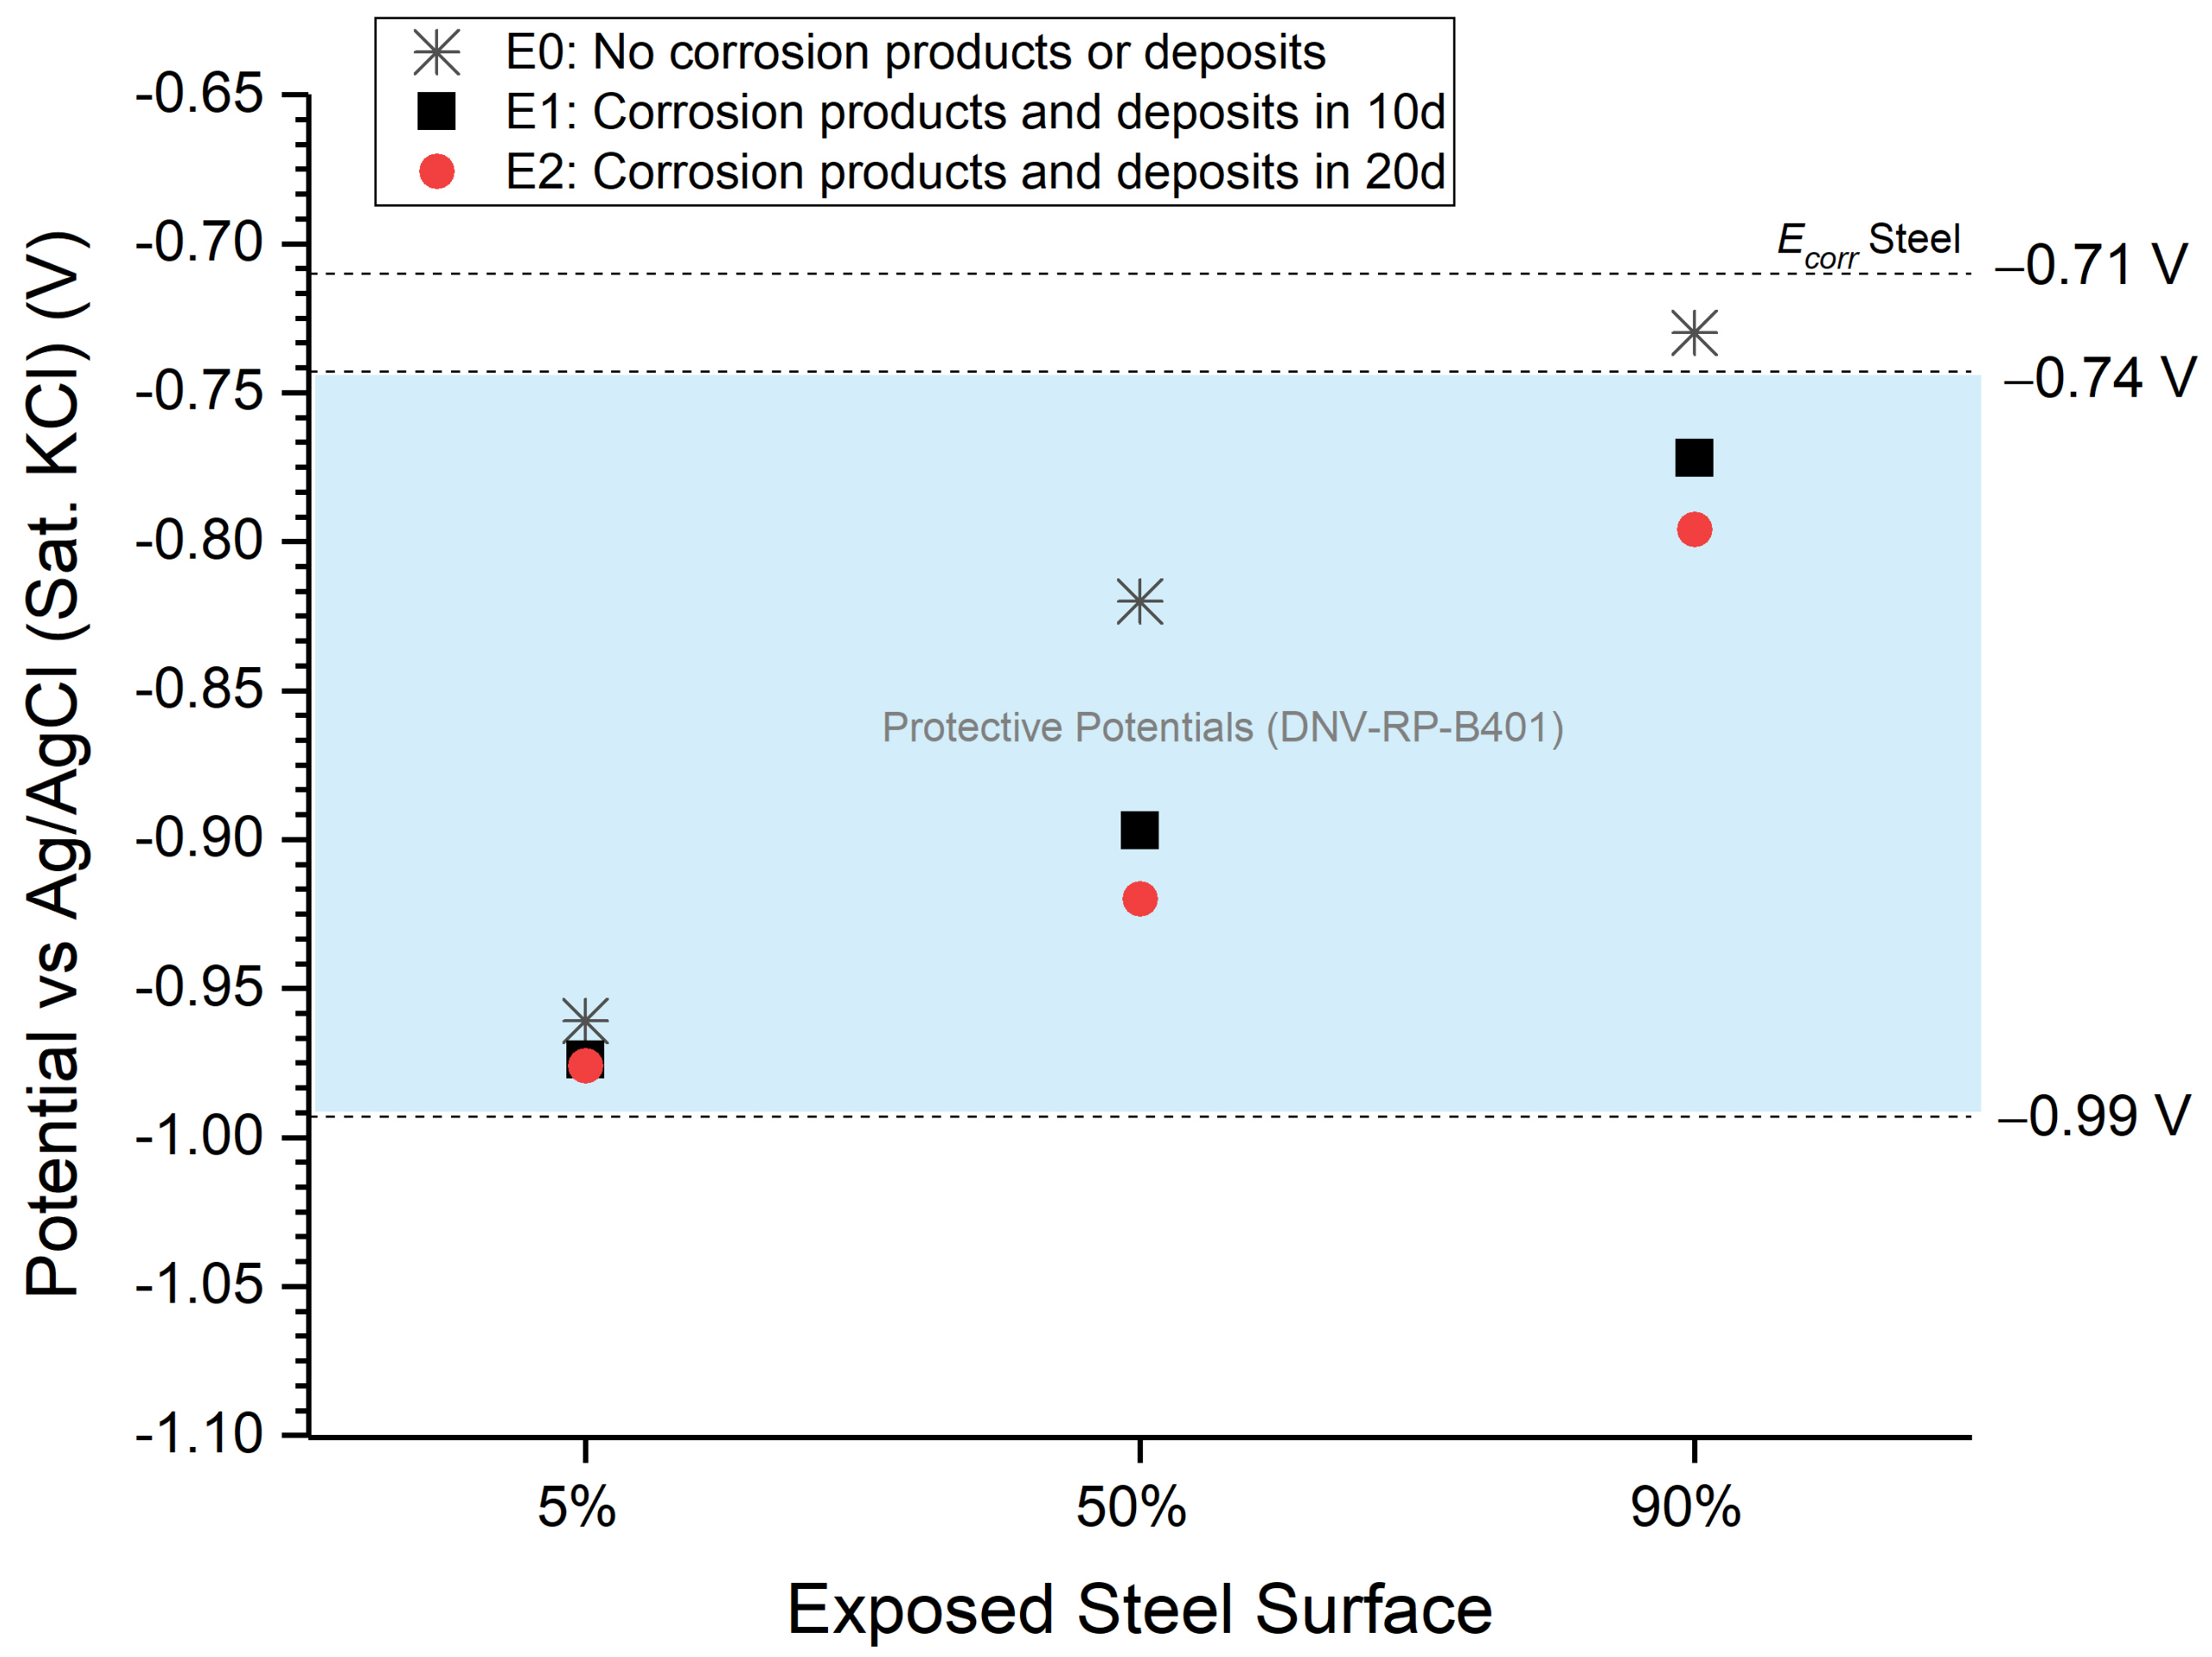
In this paper, potentials are referred to Ag/AgCl (Sat. KCl) reference electrode ( = +0.199 V vs. SHE) to facilitate comparison of results.
Figure 2 presents the simulated potential of all exposed steel surfaces configured in the model, including the simultaneous influence of corrosion products and deposits. Likewise, the ability of TSA to polarise steel within the range of protection potentials established by DNV-RP-B401 [26] is compared. This recommended practice provides requirements and guidelines for cathodic protection design in permanently immersed structures classified in corrosive category Im4 [27]. This standard advises that −0.74 V is accepted as the design protection potential for low carbon steel in seawater, and less negative values are referred to as under protection. In addition, for a properly designed galvanic anode CP system, the recommended protection potential for most of the service life is in the range of −0.84 V to −0.99 V [26].
At the start of the exposure (assuming effect E0), the computed potential represents the mixed potential between TSA and carbon steel. Due to the size of the anodic surface being larger than the cathodic surface, as expected, the calculated potential (−0.96 V) is closer to the measured free corrosion potential of TSA. Potentials of −0.974 V and −0.976 V were calculated with the effect E1 and E2, respectively. The evolution of the open circuit potential (OCP) available in the literature registered similar values. Potentials between −0.91 V and −0.97 V were found within the first 20 days of immersion [6,10,14].
The simulated potential for TSA-coated steel with 50% of exposed steel was −0.82 V. It is evident, that the potentials considering E1 and E2 conditions, led to values more negative, around −0.89 V and −0.92 V, respectively.
Finally, in an extreme damage scenario, with 90% of the exposed substrate with effect E0, a potential of −0.73 V was obtained, of which the value is outside of the protection range. In contrast, potentials computed under E1 and E2 conditions (−0.772 V and −0.796 V), are below the protection design potential. These results agree with TSA’s ability to polarise the exposed steel (90%) within the first 35 days reported in lab experiments [28].
Figure 3 shows a 3D plot of simulated electrode potential for all model configurations. The ohmic drop is neglected due to the high conductivity of the electrolyte (5 S m), which results in a uniform potential distribution in the modelled geometry.
3.2. Current Density
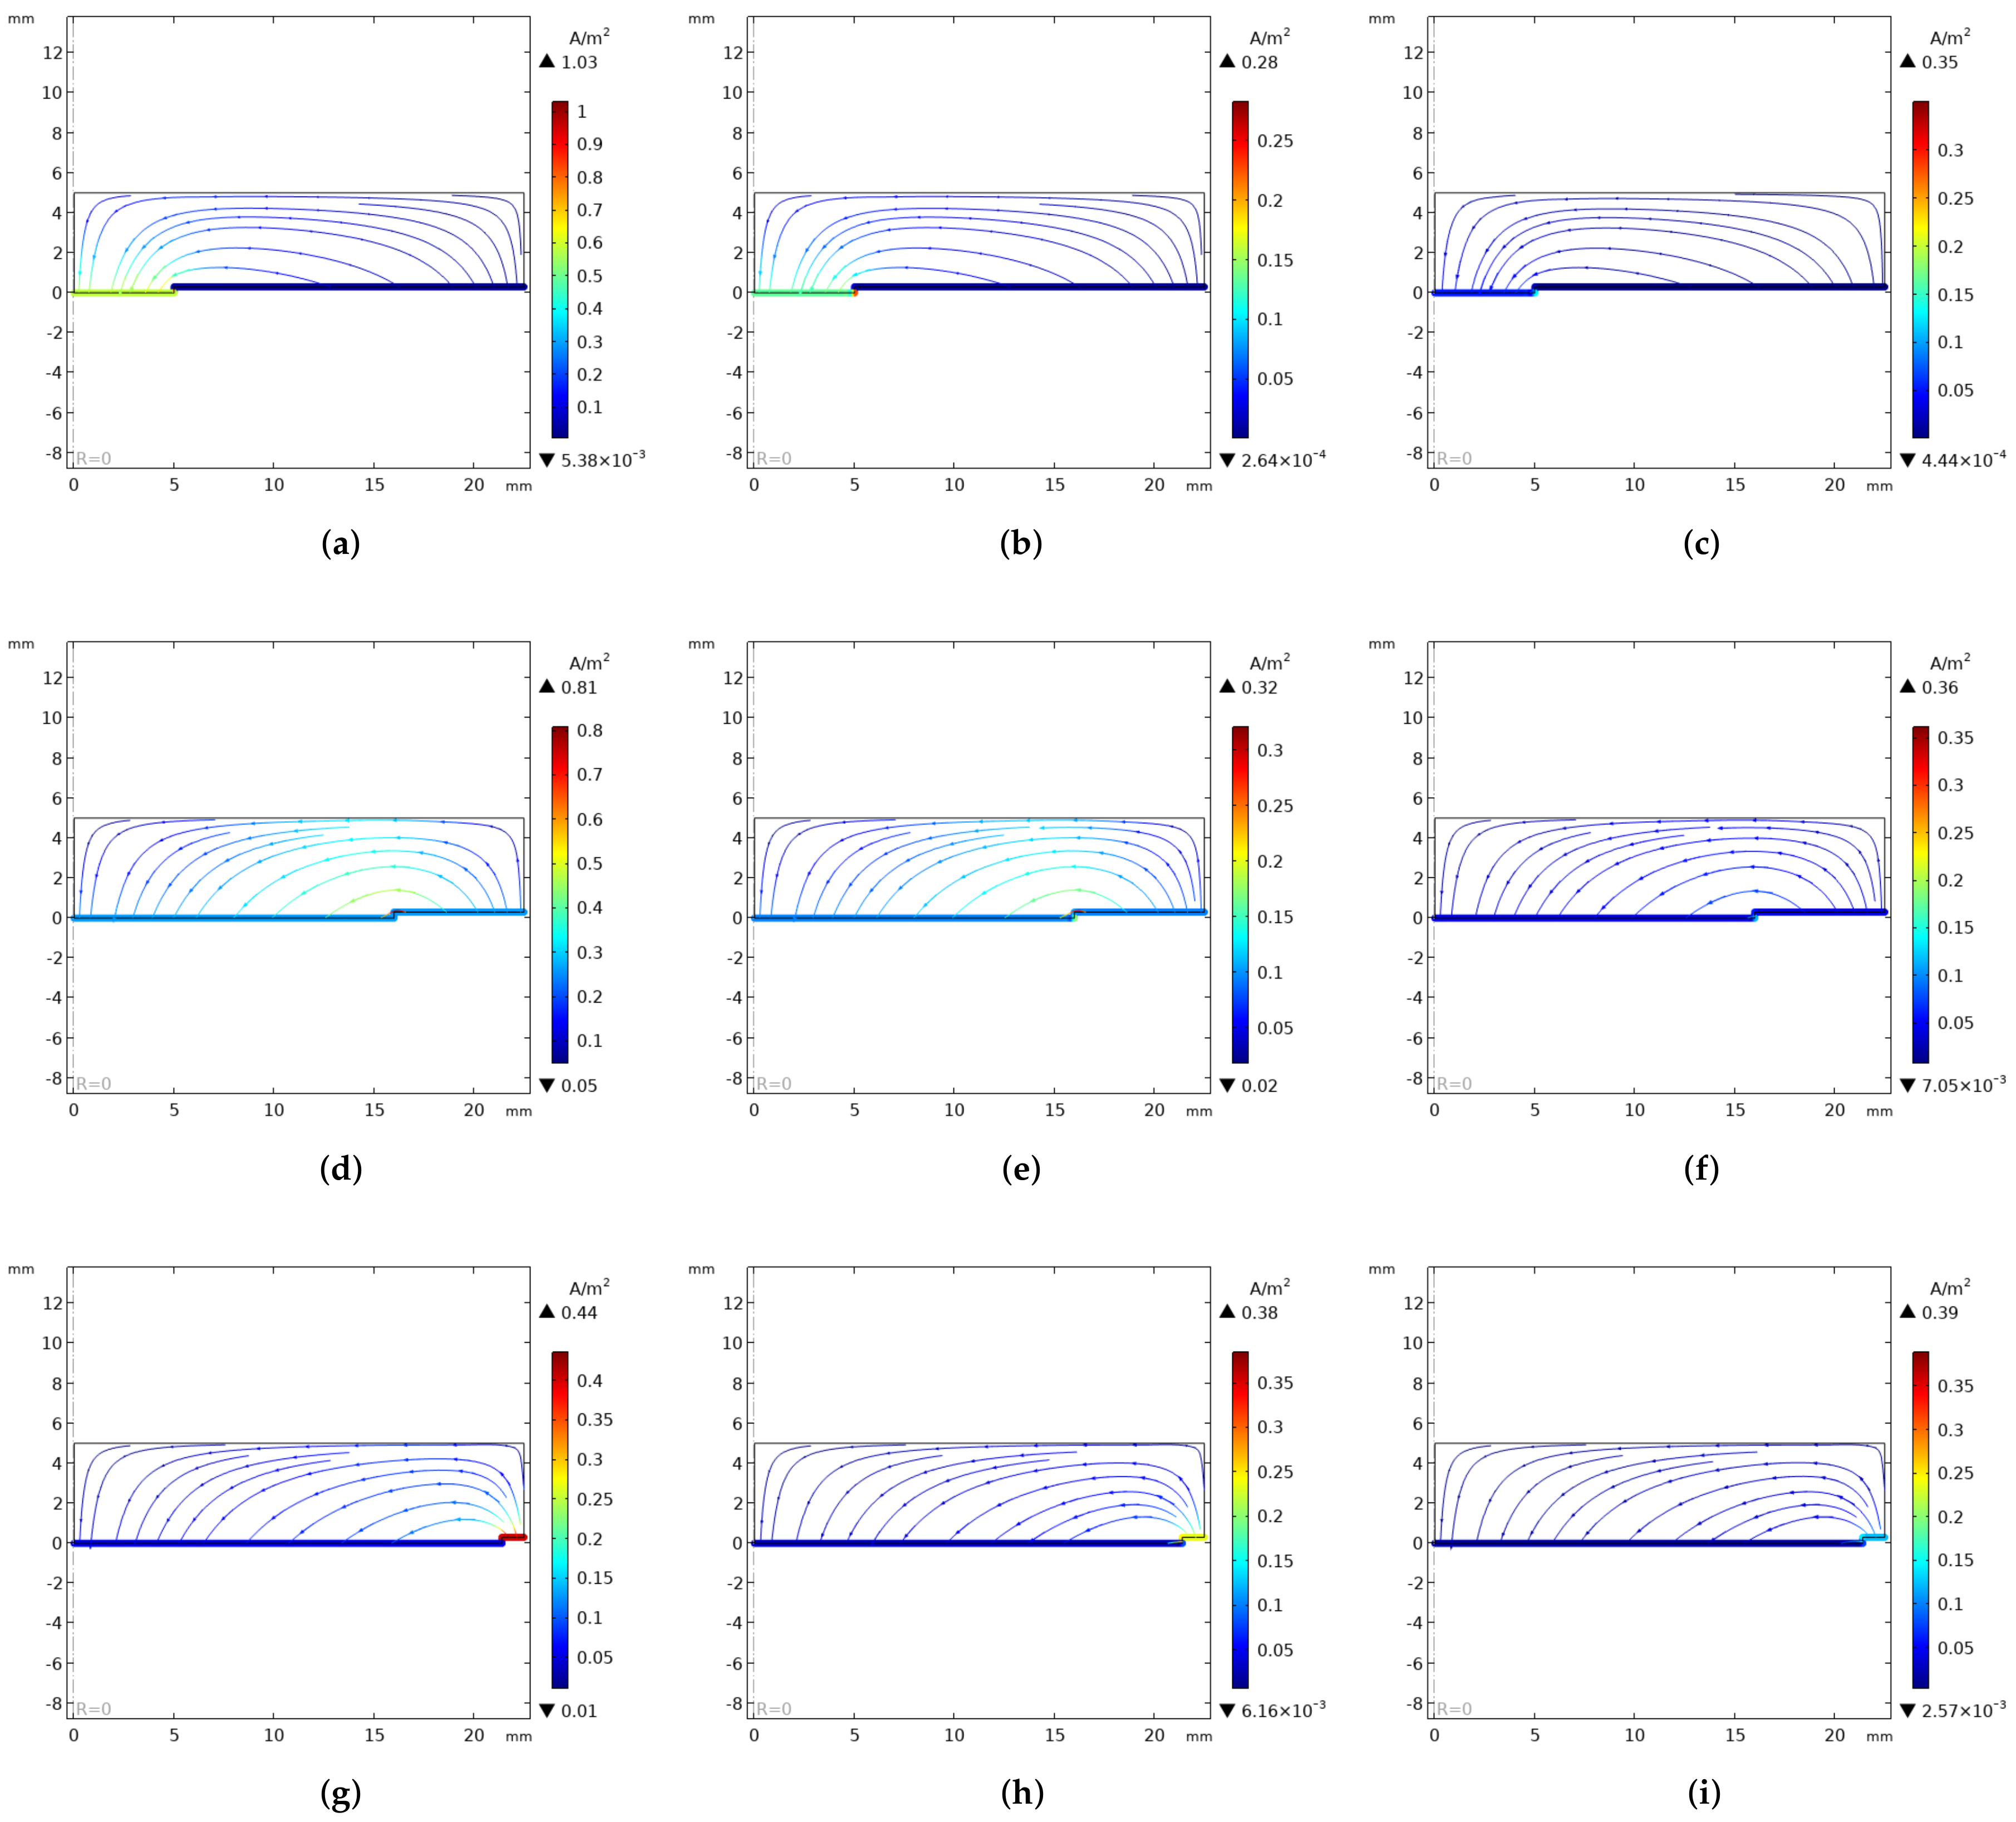
Figure 4 compares the simulated current densities (absolute values) on the modelled geometry. In all cases, the magnitude of current density decrease in both electrode surfaces with E1 and E2 conditions. It is also observed that the current density is highest at the TSA-steel interface, where a preferential dissolution of TSA is expected.
In the case of 5% of the damaged surface, the current densities decreased; this trend is in agreement with experimental data of current densities monitored in 10 d and 20 d [14]. Assuming a stable layer of corrosion products and deposits (E2), the anodic current density predicted by the model can be compared with data from experiments, while the model predicted an anodic current density of 0.003 A·m, the test in lab recorded 0.005 A·m after 20 d of exposure [14].
Figure 4d–f show the evolution of the current densities for a sample with 50% of exposed steel. The model calculated values of 0.26 A·m, 0.095 A·m, and 0.04A·m in condition E0, E1, and E2, respectively.
It is clear that a large cathode (90% exposed steel) coupled to a small anode promote a high current density on TSA, around 0.44 A·m as is observed in Figure 4g. This is due to both aluminium self-corrosion and sacrificial corrosion. However, over time, the build-up of corrosion products inhibits the anodic dissolution. On the other hand, deposits on steel mitigate corrosion by acting as physical barrier, which reasonably results in a decrease in current density under E1 and E2 conditions as is shown in Figure 4h,i, with values of 0.23 A·m and 0.124 A·m, respectively.
3.3. Corrosion Rate
According to Equation (14), the cathode is assumed not to be corroding, i.e., this boundary was set with zero displacements. Conversely, the consumption of the TSA coating is represented by the mesh movement, and it was predicted at times t = 0 and t = 200 d. Figure 5 illustrates the loss of thickness and local current density for TSA with 90% of exposed steel.
Figure 5a indicates the initial state t = 0 and E0. After 200 d, the model predicted a minor mesh displacement with E1 and E2 conditions, regarding to t = 200 d with E0.
Likewise, the ALE technique was applied for all configurations in the simulations. Thus, the corrosion rate of TSA was calculated from anodic current density using Faraday’s law, given by Equation (13), whose values are indicated in Table 3.
The results shown in Table 3 corroborate the findings of a great deal of the previous work in the estimation of corrosion rates by Linear Polarisation Resistance (LPR), for a sample with 5% of exposed steel, with values of 0.08 mm·y at the beginning of the test and 0.01 mm·y after 20 days of immersion in artificial seawater [10].
In accordance with the present results, previous studies have demonstrated that a large defect size (90% of exposed steel) lead to rapid TSA coating consumption. Corrosion rates of 0.438 mm·y and 0.42 mm·y were calculated from the model and laboratory test [28], respectively.
4. Discussion
4.1. Considerations of Modelling
This model seeks to predict the damage tolerance of TSA in artificial seawater, for the geometry modelled taking into account the following considerations simultaneously:
- The ability of TSA coating to polarise exposed steel by varying surfaces of damage;
- The formation of calcareous deposits block the diffusion of dissolved O to steel;
- The precipitation of corrosion products fill the porous of the coating, reducing the corrosion of aluminium;
- The model replicates the behaviour of corrosion products and calcareous deposits assuming a film resistance on each electrode surface. The values were taken from a depth examination of cathodic reactions by Electrochemical Impedance Spectroscopy (EIS) conducted by R. Grinon et al. [14]. This investigation introduced a new methodology to separate anodic and cathodic processes. The samples were designed so bi-electrode and electrochemical measurements can be performed separately. From this study, the charge transfer resistance, and diffusion elements trough the corrosion products to TSA and deposits to the steel were selected as parameters in the simulation. Deposits build-up on steel surfaces and aluminium corrosion products on TSA can be compared to an electrically resistant layer [12] therefore, EIS is often used to determine quantitative data about dielectric and electrical elements at the interface electrode/solution [29,30]. The record of OCP in long-term exposure tests shows that the potential reaches a plateau after approximately 20–30 days [6,14] thus, it is considered that the deposited layers are stable enough to inhibit cathodic reactions and reduce the production of OH ions. The model assumed values of electrical resistance of deposits and corrosion products measured at two specific moments (10 d and 20 d);
- Physical measurements of thickness loss in the coating are difficult to obtain since the deposits and corrosion products fill the pores. In addition, the material losses are small and localised. For this reason, electrochemical measurements are generally adopted to estimate the corrosion rate [31]. This model simulates the CR by ALE and compares the results with values obtained by LPR [10].
4.2. Steel Protection by Damaged TSA Coating
In marine environments, aluminium is widely used for its suitability as a sacrificial material to protect steel due to its position in the galvanic series. For this reason, even if TSA coating is damaged, the substrate is protected by aluminium through galvanic action, but on the other hand, it will increase the deterioration of the coating [32]. The protection system offered by TSA coating in a scenario of damage (exposed steel) can be explained as follows.
The primary protection mechanism offered by TSA is due to the potential difference between Al and steel thus, TSA acts as an anode and the dissolution is produced according to Equation (16):
The sacrificial protection of steel by TSA is correlated with the results of the simulated potential. The model predicted the ability of TSA coating to polarise exposed steel even with up to 80% damage without the presence of calcareous deposits or corrosion products, i.e., with E0 (Figure 2). Furthermore, in accordance with the mixed potential theory, when the damage surface area increases, the potential evolves to steel equilibrium potential ( Steel −0.71 V). This linear trend is observed in the distribution of potential as the size of the defect is varied as can be seen in Figure 3a,d,g.
Although TSA can polarise steel towards protective potentials, even in the presence of a large cathode, the simulated corrosion rate of TSA with E0 is very high, which means limited coating life. Table 3 shows the increase in the CR when the size of the damage augments, calculating values of 0.33 mm·y, 0.279 mm·y, and 0.438 mm·y with exposed steel surfaces of 5%, 50%, and 90%, respectively.
On the cathodic surface, in this case exposed steel, the oxygen reduction and hydrogen evolution take place, according to Equations (17) and (18). As a result of these cathodic reactions, the local pH increases due to the production of OH ions and, consequently, causes the precipitation of calcareous deposits on steel:
4.3. Effect of Calcareous Deposits
It has been acknowledged that the formation of calcareous deposits hinders the corrosion of steel, which act as a physical barrier adding protection [14]. The nature of the calcareous deposits plays an important role in the protection of steel [10]. However, in light of the particular interest of this study, the deposit formation mechanisms can be briefly described as follows.
The increase in pH near the surface of the steel leads to the co-precipitation of insoluble compounds rich in magnesium and calcium. Due to the presence of Ca and Mg ions in artificial seawater (see Table 4), the literature reports that magnesium hydroxide precipitates at a pH of about 10, while the pH of calcium carbonate precipitation is 8.7 [12]. The formation process of which can be explained by Equations (19)–(21):
From long-term tests of TSA in artificial seawater, two structures have been clearly identified through the characterisation of deposits by complementary techniques such as Scanning Electron Microscopy (SEM), Energy Dispersive X-ray spectroscopy (EDX), and X-ray Diffraction (XRD). At an ambient temperature, the calcareous deposits formed on the surface of steel present a bi-layer structure made up of brucite (Mg(OH)) in the inner layer followed by aragonite (CaCO) in the outer layer [6,10,14,28].
Such calcareous deposits have poor electrical conductivity and are beneficial as they reduce the active cathodic surface area, blocking the diffusion of oxygen to the steel. Furthermore, if the cathodic surface area is reduced, the dissolution of the aluminium (Equation (16)) will also decrease. Under this perspective, the simulations considered the effect of the deposits acting as a film resistance in the galvanic process, resulting in a decrease in cathodic current density. This trend is clearly represented by the plot of evolution of cathodic current densities shown in Figure 4 with effect E1 and E2.
From the data obtained by EIS, the magnitude of said film resistance increases with time. Due to the OCP reaching a stable value after 20–30 days of exposure, it is believed that the protective layer formed is strong enough to block the cathodic reactions. As can be seen in Table 3, the model with E2, predicted a 90%, 80%, and 70% reduction in the corrosion rate of TSA for 5%, 50%, and 90% of exposed steel, respectively. However, over time, pores interconnected through both layers of deposits will permit steel corrosion and oxygen reduction.
4.4. Effect of Aluminium Corrosion Products
Due to the presence of exposed steel, the cathodic reaction is favoured and consequently the dissolution of aluminium is accelerated. Over time, white corrosion products of Al oxides and hydroxides appear on the surface of TSA according to Equations (22)–(24):
TSA coating obtained by arc wire spray method provides several advantages however, the drawback of this technique is the porosity, usually between 5% and 15% [33]. Generally, a sealant is applied to reduce the defects and enhance the lifetime of the deposited coating. It is important to clarify that, despite the Duplex System, which compromises a sacrificial layer of (TSA), sealant and topcoat is used to protect marine structures [4], the simulation does not consider such elements because the primary purpose is to predict the level of protection provided by aluminium and its consumption rate in the event of damage during service.
Aluminium corrosion products precipitate on the surface as well as inside the pores of the coating, providing the Plugging Effect. This effect blocks the electron transfer from the metal to the solution, reducing the self-corrosion of Al, whose behaviour can be illustrated quantitatively by the plots of anodic current density in Figure 4. It is evident that the magnitude of anodic current density decrease with E1 and E2 however, the stability of the passive layer is affected by aggressive ions such as chloride, leading to localised corrosion (pitting).
Regarding the model, incorporating the mesh movement technique (ALE) allows predicting the corrosion of TSA coating over time, as can see in Figure 5. A notable reduction of coating consumption (displacement) is observed over time with E1 and E2.
Nevertheless, it is essential to note that the corrosion rate is not constant and should be considered with caution. At the beginning of the immersion, rapid corrosion of the aluminium occurs, which tends to protect the exposed steel due to its anodic nature. Over time, the corrosion rate decreases due to the accumulation of deposits/corrosion products on the exposed metal and coating surface [6,10,11,14,28].
TSA is considered a sacrificial coating that acts as uniformly distributed anodes thereby, another important aspect is the thickness of the coating. ANSI-AWS C2.18-93R [34] recommends a thickness between 200 and 350 m in submerged zones to provide corrosion protection for 25 years, i.e., the maximum allowable corrosion rate is 0.012 mm·y if a 0.3-mm thick coating is considered.
Retaking the data presented in Table 3, the simulated corrosion rates of TSA with 5% of damage are likely very optimistic. It is estimated that the coating has 86 years of useful life, even without the sealant. In the cases of 50% and 90% of exposed steel, the lifetime predicted by the model is 7 years and 2 years, respectively, if a thickness of 0.3 mm and the combined effect E2 are assumed.
Although the simulated potentials and current densities are consistent with the experiments, the extrapolation of these results should be taken with caution, since the resistivity and porosity of the deposits and corrosion products are not stable over time. Furthermore, in real life, the sea current can remove or delay the formation of these protective layers.
5. Conclusions
The model proposed in this work simulated the damage tolerance of the TSA coating by varying the surface of the exposed substrate, including the simultaneous effect of aluminium corrosion products and deposits through a time-dependent model. The simulated potential and corrosion rates are in broad agreement with experimental values obtained by electrochemical measurements on TSA-coated steel samples with 5% surface damage.
The simulation predicted a high corrosion rate when a large defect is present in TSA-coated steel. At first, there is rapid corrosion of the coating, which tends to protect the exposed steel due to its anodic nature. However, the corrosion rate decreases over time due to the accumulation of corrosion products and deposits. This behaviour is consistent with the literature.
The findings of this simulation provide insights into the correlation between defect size, protection capacity, and TSA corrosion rate i.e., the damage tolerance. It could also help estimate the life of the coating if unexpected damage occurs during installation or service.
Author Contributions
Conceptualisation, A.C.-V. and S.P.; methodology, A.C.-V.; writing—original draft preparation, A.C.-V.; writing—review and editing, S.P. and S.G.; visualisation, A.C.-V.; supervision, S.P. and S.G. All authors have read and agreed to the published version of the manuscript.
Funding
This research was funded by Lloyd’s Register Foundation and Departamento Administrativo de Ciencia, Tecnología e Innovación (COLCIENCIAS), scholarship program no. 860-2019. The APC was waived by MDPI.
Institutional Review Board Statement
Not applicable.
Informed Consent Statement
Not applicable.
Data Availability Statement
The data presented in this study are openly available at https://0-doi-org.brum.beds.ac.uk/10.25392/leicester.data.18551414, accessed on 21 August 2021.
Acknowledgments
This publication was made possible by the sponsorship and support of Lloyd’s Register Foundation. Lloyd’s Register Foundation helps to protect life and property by supporting engineering-related education, public engagement, and the application of research. The work was enabled through, and undertaken at, the National Structural Integrity Research Centre (NSIRC), a postgraduate engineering facility for industry-led research into structural integrity established and managed by TWI through a network of both national and international universities. The authors gratefully acknowledge the Colombian Ministry of Science, Technology, and Innovation (MinCiencias) for the financial support of Adriana Castro Vargas. Scholarship program no. 860-2019.
Conflicts of Interest
The authors declare no conflict of interest. The funders had no role in the design of the study; in the collection, analyses, or interpretation of data; in the writing of the manuscript, or in the decision to publish the results.
References
- Price, S.J.; Figueira, R.B. Corrosion protection systems and fatigue corrosion in offshore wind structures: Current status and future perspectives. Coatings 2017, 7, 25. [Google Scholar] [CrossRef]
- Pakenham, B.; Ermakova, A.; Mehmanparast, A. A Review of Life Extension Strategies for Offshore Wind Farms Using Techno-Economic Assessments. Energies 2021, 14, 1936. [Google Scholar] [CrossRef]
- Masi, G.; Matteucci, F.; Tacq, J.; Balbo, A. State of the Art Study on Materials and Solutions Against Corrosion in Offshore Structures. North Sea Solutions for Innovation in Corrosion for Energy. 2018. Available online: http://nessieproject.com/library/reports-and-researches/NeSSIE%20Report%20Study%20on%20Materials%20and%20Solutions%20in%20Corrosion (accessed on 21 August 2021).
- Funke, S. German Renewables Award for Offshore Wind Project Arkona. 2017. Available online: https://www.offshorewindindustry.com/news/german-renewables-award-offshore-wind-project (accessed on 10 October 2021).
- Tiong, D.K.K.; Pit, H. Experiences on Thermal Spray Aluminum (TSA) Coating on Offshore Structures. In Proceedings of the CORROSION 2004, New Orleans, LA, USA, 28 March 2004. [Google Scholar]
- Grinon-Echaniz, R.; Paul, S.; Thornton, R.; Refait, P.; Jeannin, M.; Rodriguez, A. Prediction of Thermal Spray Coatings Performance in Marine Environments by Combination of Laboratory and Field Tests. Coatings 2021, 11, 320. [Google Scholar] [CrossRef]
- Fischer, K.P.; Thomason, W.H.; Rosbrook, T.; Murali, J. Performance history of thermal-sprayed aluminum coatings in offshore service. Mater. Perform. 1995, 34, 27–35. [Google Scholar]
- Syrek-Gerstenkorn, B.; Paul, S.; Davenport, A.J. Sacrificial thermally sprayed aluminium coatings for marine environments: A review. Coatings 2020, 10, 267. [Google Scholar] [CrossRef] [Green Version]
- Syrek-Gerstenkorn, B.; Paul, S.; Davenport, A.J. Use of thermally sprayed aluminium (TSA) coatings to protect offshore structures in submerged and splash zones. Surf. Coatings Technol. 2019, 374, 124–133. [Google Scholar] [CrossRef]
- Echaniz, R.G.; Paul, S.; Thornton, R. Effect of seawater constituents on the performance of thermal spray aluminum in marine environments. Mater. Corros. 2019, 70, 996–1004. [Google Scholar] [CrossRef] [Green Version]
- Paul, S. Behavior of Damaged Thermally Sprayed Aluminum (TSA) in Aerated and Deaerated Seawater. In Proceedings of the CORROSION 2019, Nashville, TN, USA, 26 March 2019. [Google Scholar]
- Yang, Y.; Scantlebury, J.D.; Koroleva, E.V. A study of calcareous deposits on cathodically protected mild steel in artificial seawater. Metals 2015, 5, 439–456. [Google Scholar] [CrossRef] [Green Version]
- Ce, N.; Paul, S. The Effect of Temperature and Local pH on Calcareous Deposit Formation in Damaged Thermal Spray Aluminum (TSA) Coatings and its Implication on Corrosion Mitigation of Offshore Steel Structures. Coatings 2017, 7, 52. [Google Scholar] [CrossRef] [Green Version]
- Grinon-Echaniz, R.; Refait, P.; Jeannin, M.; Sabot, R.; Paul, S.; Thornton, R. Study of cathodic reactions in defects of thermal spray aluminium coatings on steel in artificial seawater. Corros. Sci. 2021, 187, 109514. [Google Scholar] [CrossRef]
- Saeedikhani, M.; Wijesinghe, S.; Blackwood, D.J. Moving boundary simulation and mechanistic studies of the electrochemical corrosion protection by a damaged zinc coating. Corros. Sci. 2020, 163, 108296. [Google Scholar] [CrossRef]
- Saeedikhani, M.; Van den Steen, N.; Wijesinghe, S.; Vafakhah, S.; Terryn, H.; Blackwood, D.J. Moving Boundary Simulation of Iron-Zinc Sacrificial Corrosion under Dynamic Electrolyte Thickness Based on Real-Time Monitoring Data. J. Electrochem. Soc. 2020, 167, 041503. [Google Scholar] [CrossRef]
- Thébault, F.; Vuillemin, B.; Oltra, R.; Allely, C.; Ogle, K. Modeling bimetallic corrosion under thin electrolyte films. Corros. Sci. 2011, 53, 201–207. [Google Scholar] [CrossRef]
- Cross, S.R.; Gollapudi, S.; Schuh, C.A. Validated numerical modeling of galvanic corrosion of zinc and aluminum coatings. Corros. Sci. 2014, 88, 226–233. [Google Scholar] [CrossRef]
- Sun, W.; Liu, G.; Wang, L.; Li, Y. A mathematical model for modeling the formation of calcareous deposits on cathodically protected steel in seawater. Electrochim. Acta 2012, 78, 597–608. [Google Scholar] [CrossRef]
- Sun, W.; Liu, G.; Wang, L.; Wu, T.; Liu, Y. An arbitrary Lagrangian–Eulerian model for studying the influences of corrosion product deposition on bimetallic corrosion. J. Solid State Electrochem. 2013, 17, 829–840. [Google Scholar] [CrossRef]
- Yin, L.; Li, W.; Wang, Y.; Jin, Y.; Pan, J.; Leygraf, C. Numerical simulation of micro-galvanic corrosion of Al alloys: Effect of density of Al (OH)3 precipitate. Electrochim. Acta 2019, 324, 134847. [Google Scholar] [CrossRef]
- Yin, L.; Jin, Y.; Leygraf, C.; Pan, J. A FEM model for investigation of micro-galvanic corrosion of Al alloys and effects of deposition of corrosion products. Electrochim. Acta 2016, 192, 310–318. [Google Scholar] [CrossRef]
- ASTM D1141-98; Standard Practice for the Preparation of Substitute Ocean Water. 2013.
- Deshpande, K.B. Validated numerical modelling of galvanic corrosion for couples: Magnesium alloy (AE44)–mild steel and AE44–aluminium alloy (AA6063) in brine solution. Corros. Sci. 2010, 52, 3514–3522. [Google Scholar] [CrossRef]
- Zheng, Z.; Fu, Y.; Liu, K.; Xiao, R.; Wang, X.; Shi, H. Three-stage vertical distribution of seawater conductivity. Sci. Rep. 2018, 8, 1–10. [Google Scholar] [CrossRef] [PubMed] [Green Version]
- Cathodic Protection Design, Recommended Practice DNV-RP-B401. 2010. Available online: https://www.engr.mun.ca/~sbruneau/teaching/8751ocean/DNV%20cathode%20design.pdf (accessed on 14 August 2021).
- ISO 12944. Paints and Varnishes — Corrosion Protection of Steel Structures by Protective Paint Systems. 2019. Available online: https://www.iso.org/standard/77795.html (accessed on 14 August 2021).
- Paul, S. Cathodic Protection of Offshore Structures by Extreme Damage Tolerant Sacrificial Coatings. In Proceedings of the NACE International Corrosion Conference Proceedings. NACE International, Phoenix, AZ, USA, 15–19 April 2018; pp. 1–12. [Google Scholar]
- Esfahani, E.A.; Salimijazi, H.; Golozar, M.A.; Mostaghimi, J.; Pershin, L. Study of corrosion behavior of arc sprayed aluminum coating on mild steel. J. Therm. Spray Technol. 2012, 21, 1195–1202. [Google Scholar] [CrossRef]
- Lee, H.S.; Singh, J.K.; Park, J.H. Pore blocking characteristics of corrosion products formed on Aluminum coating produced by arc thermal metal spray process in 3.5 wt.% NaCl solution. Constr. Build. Mater. 2016, 113, 905–916. [Google Scholar] [CrossRef]
- Paul, S.; Harvey, D. Determination of the Corrosion Rate of Thermally Spayed Aluminum (TSA) in Simulated Marine Service. In Proceedings of the CORROSION 2020, Manchester, UK, 7 September 2020. [Google Scholar]
- Thomason, W. Offshore Corrosion Protection with Thermal-Sprayed Aluminum. In Proceedings of the Offshore Technology Conference, Houston, TX, USA, 17 May 1985. [Google Scholar] [CrossRef]
- Tejero-Martin, D.; Rad, M.R.; McDonald, A.; Hussain, T. Beyond traditional coatings: A review on thermal-sprayed functional and smart coatings. J. Therm. Spray Technol. 2019, 28, 598–644. [Google Scholar] [CrossRef] [Green Version]
- C2.18-93R, A.A. Guide for the Protection of Steel with Thermal Sprayed Coatings of Aluminum and Zinc and their Alloys and Composites. Available online: https://webstore.ansi.org/preview-pages/AWS/preview_AWS+C2.18-93R.pdf (accessed on 20 June 2021).
Figure 2.
Simulated potential as a function of the exposed steel surface and combined effect of corrosion products and deposits.
Figure 2.
Simulated potential as a function of the exposed steel surface and combined effect of corrosion products and deposits.

Figure 3.
Simulated electrode potential. (a) 5% of exposed steel with E0. (b) 5% of exposed steel with E1. (c) 5% of exposed steel with E2. (d) 50% of exposed steel with E0. (e) 50% of exposed steel with E1. (f) 50% of exposed steel with E2. (g) 90% of exposed steel with E0. (h) 90% of exposed steel with E1. (i) 90% of exposed steel with E2.

Figure 4.
Simulated current densities on exposed steel (left side) and TSA coating (right side) without and with the influence of corrosion products and deposits. The lines with arrows indicate the electrolyte current density vector and the solid line represents the total current density on each surface. (a) 5% of exposed steel with E0. (b) 5% of exposed steel with E1. (c) 5% of exposed steel with E2. (d) 50% of exposed steel with E0. (e) 50% of exposed steel with E1. (f) 50% of exposed steel with E2. (g) 90% of exposed steel with E0. (h) 90% of exposed steel with E1. (i) 90% of exposed steel with E2.

Figure 5.
(ALE) Mesh moving technique and current density of TSA coating with 90% of exposed steel. Notice that only a representative part of the cathode of the entire geometry is shown. (a) t = 0 and initial condition E0. (b) t = 200 d and initial condition E0. (c) t = 200 d and condition E1. (d) t = 200 d and condition E2.


Table 1.
Parameters used in the model. Potentials are referred to Ag/AgCl (Sat. KCl).
| Parameter | Value | Description |
|---|---|---|
| Steel | −0.71 V | Corrosion potential of steel [14] |
| Steel | 9 × 10A/m | Exchange current density-cathode [14] |
| 0.114 V/dec | Anodic Tafel coefficient-steel [14] | |
| 0.538 V/dec | Cathodic Tafel coefficient-steel [14] | |
| TSA | −0.98 V | Corrosion potential of TSA [6,10] |
| TSA | 5.5 × 10A/m | Exchange current density-anode [6] |
| 0.57 V/dec | Anodic Tafel coefficient-TSA [6] | |
| 0.18 V/dec | Cathodic Tafel coefficient- TSA [6] | |
| 5 S/m | Electrolyte conductivity (Seawater) [25] | |
| M | 26.98 g/mol | Al molar mass |
| 2.7 g/cm | Al density | |
| z | 3 | Number of electrons for dissolving specie |
| F | 96,485.34 C/mol | Faraday constant |
Table 2.
Data from EIS [14].
Table 2.
Data from EIS [14].
| Parameter | Description | Exposure Time | |
|---|---|---|---|
| 10 d | 20 d | ||
| Film resistance on steel [14] | 15.5 k·cm | 46 k·cm | |
| Film resistance on TSA [14] | 2.7 k·cm | 8.7 k·cm | |
Table 3.
Corrosion rates calculated from the model.
| Exposed Steel | Corrosion Rate of TSA (mm·y) | ||
|---|---|---|---|
| E0 | E1 | E2 | |
| 5% | 0.033 | 0.008 | 0.0035 |
| 50% | 0.279 | 0.102 | 0.045 |
| 90% | 0.438 | 0.256 | 0.135 |
Table 4.
Artificial seawater composition according to ASTM D1141-98 [23].
Table 4.
Artificial seawater composition according to ASTM D1141-98 [23].
| Compound | Salt Concentration (g/L) | Compound | Salt Concentration (g/L) |
|---|---|---|---|
| NaCl | 24.53 | NaHCO | 0.201 |
| MgCl | 5.2 | KBr | 0.101 |
| NaSO | 4.09 | HBO | 0.027 |
| CaCl | 1.16 | SrCl | 0.025 |
| KCl | 0.695 | NaF | 0.003 |
Publisher’s Note: MDPI stays neutral with regard to jurisdictional claims in published maps and institutional affiliations. |
© 2022 by the authors. Licensee MDPI, Basel, Switzerland. This article is an open access article distributed under the terms and conditions of the Creative Commons Attribution (CC BY) license (https://creativecommons.org/licenses/by/4.0/).
Share and Cite
MDPI and ACS Style
Castro-Vargas, A.; Gill, S.; Paul, S. Effect of Corrosion Products and Deposits on the Damage Tolerance of TSA-Coated Steel in Artificial Seawater. Surfaces 2022, 5, 113-126. https://0-doi-org.brum.beds.ac.uk/10.3390/surfaces5010005
AMA Style
Castro-Vargas A, Gill S, Paul S. Effect of Corrosion Products and Deposits on the Damage Tolerance of TSA-Coated Steel in Artificial Seawater. Surfaces. 2022; 5(1):113-126. https://0-doi-org.brum.beds.ac.uk/10.3390/surfaces5010005
Chicago/Turabian StyleCastro-Vargas, Adriana, Simon Gill, and Shiladitya Paul. 2022. "Effect of Corrosion Products and Deposits on the Damage Tolerance of TSA-Coated Steel in Artificial Seawater" Surfaces 5, no. 1: 113-126. https://0-doi-org.brum.beds.ac.uk/10.3390/surfaces5010005