Article

Does Sex, Skeletal Class and Mandibular Asymmetry Affect Tooth Length and Asymmetry in Tooth Length?

1
Independent Researcher, Niemodlińska 63, 45-864 Opole, Poland
2
Department of Mechanics, Materials and Biomedical Engineering, Faculty of Mechanical Engineering, Wrocław University of Science and Technology, 50-370 Wrocław, Poland
3
Department of Dentofacial Orthopaedics and Orthodontics, Wroclaw Medical University, 50-425 Wrocław, Poland
4
Clinic of Integrated Dentistry, Academic Policlinic of Stomatology, 50-425 Wrocław, Poland
5
Department of Integrated Dentistry, Wroclaw Medical University, 50-425 Wrocław, Poland
*
Author to whom correspondence should be addressed.
Submission received: 25 April 2022 / Revised: 19 May 2022 / Accepted: 20 May 2022 / Published: 23 May 2022
(This article belongs to the Special Issue Dentofacial Asymmetry — Challenges and Perspectives)

Abstract

:
Introduction: The aim of our cross-sectional study is to determine whether there is a link between sex, skeletal class and mandibular asymmetry in orthodontic patients, with tooth length and asymmetry in tooth length on contralateral sides of the mandible. Methods: As the source for relevant data to answer this question, 3D cone-beam tomography (CBCT) images of a total of 95 future orthodontic patients were retrospectively selected from private practice records and were analyzed. The CBCT images were part of routine orthodontic diagnosis. Patients were divided into three groups (Class I, Class III with asymmetry and Class III without asymmetry) based on skeletal variables assessed on orthodontic cephalometric images and frontal photos of the face. Three null hypotheses were developed, and a series of statistical tests was performed in order to support or reject them. Results: We have established that there exists a sexual dimorphism in some of the teeth’s lengths in our sample. Furthermore, we failed to find a link between mandibular asymmetry and asymmetry in tooth length. We have also found a link between skeletal class and tooth length differences in some of the analyzed measurements. Conclusions: Computational models used to design orthodontic appliances and to plan orthodontic treatment should be more individualized to consider a patient’s sex and skeletal class.

1. Introduction

In recent years, a number of in vitro studies have been conducted to simulate specific tooth movements with different orthodontic methods, such as fixed appliances or aligners [1,2,3,4,5,6,7,8,9,10,11,12,13,14,15,16,17]. These studies have allowed us to better understand dental biomechanics and make it easier to plan orthodontic therapy for optimal treatment results.
These studies use the finite element method, in which the boundary conditions require the adoption of material parameters corresponding to the investigated tissues (cancellous, cortical bone and tooth material) and orthodontic appliance parameters. These mechanical properties, determined by experimental methods (such as Young’s modulus and Poisson’s ratio), can be found in abundance in the literature. However, the finite element method presents an analytical approach, describing the solution of a problem using differential equations in which the results are close enough to the exact solution. This is achieved by simplifying the geometry of the actual model or by obtaining approximate solutions to the exact physical model. In contrast to the above, there is considerable diversity in the literature on how bone and tooth anatomy is determined. For example, the integration of optical scanners and computed tomography data [1] is used, as is the manual creation of a dental model according to the principles set out by Andrews [2,18]. Some researchers also use data produced by scanning a dental demonstration model [3]. In order for these studies to faithfully reflect real tooth movements during orthodontic therapy, it is crucial to reproduce the patient’s anatomy as closely as possible in the computer simulation. Knowledge of the bone’s anatomy, as well as information on the length and shape of the teeth and possible asymmetry in the patient’s dentition, are important. This has the potential to positively influence the accuracy of mathematical predictions of dental movements in the future.
In view of this, in the authors’ opinion, studies shedding light on the anatomy of patients’ dentition and possible variability in the structure (also depending on sex and the possibility of asymmetry) are justified. This is because the length and morphology of the tooth roots are key elements affecting the tooth movements achieved in the course of orthodontic treatment [4,5,6,19,20].
Knowledge of the presence (or absence) of tooth length differences may allow clinicians to make better decisions about planned tooth movements and for aligner design software developers to potentially more effectively individualize aligners by accounting for the patient’s dental characteristics, which has the potential to result in more effective orthodontic treatment with aligners in the future.
As the morphometric features of teeth significantly influence movement during orthodontic treatment, this study aims to assess if there are differences in lower teeth length. Particular attention was paid to the dependencies resulting from sex (sexual dimorphism), skeletal class (skeletal class I and skeletal class III patients) and mandibular asymmetry (longer side/shorter side).
Three null hypotheses were developed:
  • There is no sexual dimorphism in lower tooth length;
  • There are no differences in tooth length in skeletal class III patients with asymmetry depending on the side of the mandible (with/without excessive growth);
  • There are no differences in tooth length between patients with class I and patients with class III without asymmetry.

2. Materials and Methods

The study conducted was a retrospective study; cone beam computed tomography (CBCT) scans taken between 2017 and 2021 prior to orthodontic treatment were used as part of the orthodontic diagnostic process. All scans were taken with a single CT scanner (Carestream CS 8200 CS 3D, Carestream Health, Rochester, NY, USA) and were then analyzed using CS 3D Imaging Software. The study was conducted in the context of individual private medical practice of one of the co-authors (M.W.). Every patient had signed an informed consent form to include data created during the gathering of orthodontic records (such as CBCT scans) in scientific research.
The patients’ personal data were anonymized, and a different researcher (M.S.) was responsible for the assignment of the measurement data to the corresponding research groups.
Ethical approval of the Bioethical Committee of the Wroclaw Medical University was granted for our study (number KB-231/2021, accessed on 19 March 2021), providing that all the data were anonymized (as was the case in our study).
In all patients, a lateral skull radiograph, which assessed skeletal class based on the Wits [21] measurement, as well as SNA, SNB and ANB angles according to Segner–Hasund analysis [22], was also taken as part of the diagnostic process. Patients were also examined for the presence (or absence) of asymmetry in facial features, defined as a shift of the chin greater than 5 mm relative to the facial midline (after excluding temporomandibular joint disorders and functional shifts). Patients with an anterior defect related to isolated excessive mandibular growth, without a maxillary defect, i.e., SNA angle normal, SNB angle and the Wits measurement enlarged, were considered skeletal class III patients. In our research, we identified any elements that may affect the correct measurement of tooth length, reflecting the established inclusion or exclusion criteria:
Patient inclusion criteria:
  • No history of previous orthodontic treatment;
  • Complete dentition in the lower arch from at least the 2nd molar to the 2nd molar (minimum 14 teeth);
  • Patients with skeletal class I and skeletal class III (with or without asymmetry);
  • Generally healthy patients, with no history of bone disease (past or present).
Patient exclusion criteria:
  • Incomplete root development;
  • Root resorption (due to trauma or inflammation);
  • Genetic defects in tooth anatomy;
  • Significant damage to the tooth crown, making it impossible to assess anatomy;
  • History of previous orthodontic treatment;
  • Class III problem in conjunction with other skeletal malformations, which may indicate a genetic syndrome;
  • No sex, age or race limitations were applied.
The patients were then divided into three groups: skeletal class I patients, skeletal class III patients without asymmetry and skeletal class III patients with asymmetry. A calculation of the statistical power of the test was not performed due to the lack of data in the literature specifying what difference in tooth length constitutes a clinically meaningful difference in measurements. Instead, a convenience-based sample was used. Additionally, each group was divided into subgroups of men and women. The youngest patient was 17 years old, and the oldest was 35 years old. All patients were Caucasian. In patients with skeletal class I and skeletal class III without asymmetry, teeth were grouped into left/right sides. In skeletal class III patients with asymmetry, teeth were grouped into sides with/without excessive mandibular growth. The sizes of the groups are presented in Table 1.
The length of each tooth was measured separately in the sagittal section with 3D Slicer (version 4.11.20210226. https://www.slicer.org/, accessed on 6 January 2022) using the “Create line markup” function. In single-rooted teeth, the crown and apex were identified on a single sagittal section. In multi-rooted teeth, the most prominent cusp on the mesial part of the crown and the apex of the mesial root were identified on separate sagittal sections (Figure 1).
Statistical calculations were performed using the Origin Pro 9 software (OriginLab Corporation, Northampton, MA, USA). A normal distribution of the results obtained was developed using the Shapiro–Wilk test, which can also be used for analyses of small samples. Statistical analysis was performed using a one-way ANOVA for independent samples at a statistical significance level of p = 0.05. The results were presented as means with standard deviation. Tukey’s multiple comparison test was used to compare mean values between groups. There were no cases of missing or incomplete data in our sample.

3. Results

3.1. Verification of Null Hypothesis No. 1: Hypothesis Rejected

The results of the tooth length analysis are presented in Figure 2. Studies have shown that, in patients with class I skeletal configuration, mean tooth length is greater in men (23.75 ± 2.06 mm) than in women (22.18 ± 2.01 mm), as can be seen in Figure 2a. The largest difference in tooth length between women and men was found in the case of the first premolars (34, 44). In both women and men, the longest teeth turned out to be canines (33, 43). However, the smallest difference in tooth length between women and men was found for the central incisor (31, 41).
In the case of class III without asymmetry, the mean tooth length was greater in men (24.92 ± 2.23 mm) than in women (23.75 ± 2.03 mm), as can be seen in Figure 2b. The largest difference in tooth length between women and men was found in the case of the first premolars (34, 44). The difference in the lengths of the second premolars (35, 45) between women and men was also shown to be smaller than in the case of class I. In both women and men, the longest teeth turned out to be canines (33, 43). However, the smallest difference in tooth length between women and men was found for the central incisor (31, 41).
In class III with asymmetry, it was shown that the average length of the teeth was higher on the hyperplastic side in both women and men, as can be seen in Figure 2c. In the case of women, the mean value of the tooth length on the non-hyperplastic side was 23.55 ± 2.18 mm, and on the hyperplastic side it was 24.14 ± 2.36 mm. The biggest difference between the non-hyperplastic side and the hyperplastic side in women was demonstrated for the lateral incisor (2) and first molar (6) teeth.
In the case of men, the mean value of tooth length on the non-hyperplastic side was 25.05 ± 2.26 mm, and on the hyperplastic side it was 25.51 ± 2.36 mm. The greatest difference between the non-hyperplastic side and the hyperplastic side in men was demonstrated for the canine (3) and first molar teeth (6). The smallest difference in tooth length between women and men was demonstrated on the non-hyperplastic side for the canine (3) and central incisor (1), and on the hyperplastic side, it was for the canine (3) and the incisors (1,2). These differences were not statistically significant, however, as is explained further. In all groups, the longest teeth turned out to be the lower canines (33,43).
The statistical analysis of the comparison between the sexes in the class I group showed statistically significantly longer teeth in men than in women, as can be seen in Table 2. On the right side, these differences were significant for teeth 47, 45 and 44, whereas on the left side they were significant for teeth 37, 36, 35 and 34. Statistically significant differences between the sexes were also found in the class III without asymmetry group. On the right side, these differences were statistically significant for teeth 47, 46 and 44, whereas on the left side they were significant for teeth 37 and 34. The only tooth whose length was greater in women was the lower central incisor (31,41). This was not statistically significant, however. In the class III with asymmetry group, we also demonstrated statistically significant sexual dimorphism in tooth length for some of the measurements analyzed. On the non-hyperplastic side, these differences were significant for teeth 7, 6, 5 and 4, whereas on the hyperplastic side they were significant for teeth 7, 6 and 4. The only teeth longer in women were the lower central incisors, both for the non-hyperplastic and hyperplastic side. This was not statistically significant, however.

3.2. Verification of Null Hypothesis No. 2: Hypothesis Confirmed

The statistical analysis of comparisons of class III patients with asymmetry for between-sides comparison did not show statistically significant differences at the level of p < 0.05, as can be seen in Table 3. In both women and men, teeth have been shown to be longer on the non-hyperplastic side. None of these differences were statistically significant, however.

3.3. Verification of Null Hypothesis No. 3: Hypothesis Rejected

The statistical analysis of comparisons between-groups for class I and class III patients without asymmetry has revealed that all of the teeth that were analyzed were longer in the class III without asymmetry group; however, only some of the differences were statistically significant, as can be seen in Table 4.

4. Discussion

In the current scientific studies describing the biomechanics of tooth movement using computer analyses, such as the finite element method, there is a significant discrepancy in the assumptions related to the anatomy of the teeth, the alveolar process and surrounding structures.
Calculations are performed either based on computer-generated models representing ideal dental anatomy based on Andrews’ keys [2,18], obtained from scans of a dental demonstration model [3], created de novo based on arbitrary assumptions made by the researchers [7] or on averaged models [8]. However, models most commonly found in the literature are those created based on data collected from one, or a few, patients [5,9,10,11,12,13,14,15,16].
This approach has its obvious advantages; it makes it possible to compare different methods of moving teeth relative to each other using the same geometric model. In this way, it is possible to avoid complicating calculations that account for different variations in tooth anatomy. An example of such a study may be a comparison of different shapes of aligner attachments [2].
At the same time, it should be emphasized that the individual variability of a patients’ anatomy, particularly the different lengths of the tooth roots, has a significant impact on the different biomechanics of tooth movements [4,5,6,19,20].
As a result, great caution should be exercised in extrapolating the results of currently existing studies that use the finite element method to the general population, and the calculations themselves still need to be validated by actual obtained results [20].
Some authors have noted this problem, proposing as an example the solution of individualizing calculations using segmentations of the patients’ teeth isolated from the CBCT scan with subsequent modelling of their geometry [4] and then combining them with an aligner model in order to better adjust orthodontic therapy to the patients’ individual anatomies [5].
This approach, although undoubtedly better at addressing individual patients’ anatomies and associated biomechanical challenges, may be difficult to implement in routine orthodontic practice due to the time-consuming process of isolating patients’ structures from CBCT data.
The authors of the present paper propose an alternative solution: the creation of a publicly available database of patients’ dental anatomies, individualized by distinguishing patients on the basis of sex, age, race and skeletal relationships.
Having access to such a tool, a clinician, when designing an orthodontic appliance and predicting tooth movement, can select from the available list the values closest to those characterizing his/her patient, thus obtaining an anatomical model as close as possible to the individual anatomy of the examined case.
This solution can also make it easier for companies that manufacture removable appliances (aligners) to individualize treatment based on the needs of a particular patient.
This approach seems to be a reasonable compromise between the need to account for the individual anatomy of the patient and the difficulty of using different, more advanced and complicated solutions in practice (as no additional measurements or calculations are needed here).
The presented study answers questions about asymmetry in tooth length in skeletal class III patients with mandibular asymmetry, differences in tooth length between patients with skeletal class I and III, and sexual dimorphism in tooth length. The authors showed that tooth length depends on the sex of the patient. This is important, because most of the studies using the finite element method that were analyzed in this paper do not differentiate methodologies based on the sex of the virtual patient [1,2,3,5,7,8,9,10,13,14,15,16,17]. Therefore, they report results that are averaged or specific to only one sex. Similarly, out of the reviewed papers, none but one [16] accounts for the skeletal class of the analyzed “virtual” patient; thus, they do not take into consideration whether skeletal class affects the biomechanics of tooth movement.
The authors showed that skeletal class III is directly associated with excessive mandibular growth (mandibular prognathism) and can affect the size of tooth roots and therefore the biomechanics of their movement as well. Interestingly, the study showed that mandibular asymmetry does not have a statistically significant effect on asymmetry in tooth length on opposite sides of the mandible. This opens up opportunities for further research that can explain the genesis of such a phenomenon.
The presented results clearly indicate that further research is needed to analyze factors influencing tooth root size and the relationship between those factors and the factors affecting mandibular size.
Finally, it should be noted that the measurement method presented in this paper may also be applicable to studies on variations in root anatomy in patients with genetic disorders, such as MSX1 gene mutations [23]. It has been proven that such disorders can affect the length of tooth roots [24].
The authors intentionally did not include patients with skeletal class II in the study. It has been shown in the literature that there is a greater number of genetic factors influencing the development of skeletal class III than skeletal class II [25]. Moreover, there is ample evidence that genetic factors influence the length and anatomy of tooth roots [24]. Therefore, patients with skeletal class III naturally represent the main area of interest in determining the correlation between tooth anatomy and skeletal class. However, according to the authors, further studies should be considered, including ones involving skeletal class II patients.
This study assessed only the length of the roots, without considering their volume. This is due to the pilot nature of the paper. Consideration should be given to conducting similar studies in the future using solutions, available in the literature, which enable assessing root anatomy in a more individualized manner [20].

Limitations of the Study

No class II patients were included in the study. It only included Caucasians of a certain age, even though no age or race limitations were applied. In addition, the study did not account for the possibility of individual anomalies of root structure, such as dilacerations or other shape abnormalities, due to the preliminary nature of the study. Individual bone anatomy was not accounted for, which may also be important for biomechanical calculations, especially in patients with periodontal atrophy [6]. Further research is warranted in order to eliminate some of the limitations.

5. Conclusions

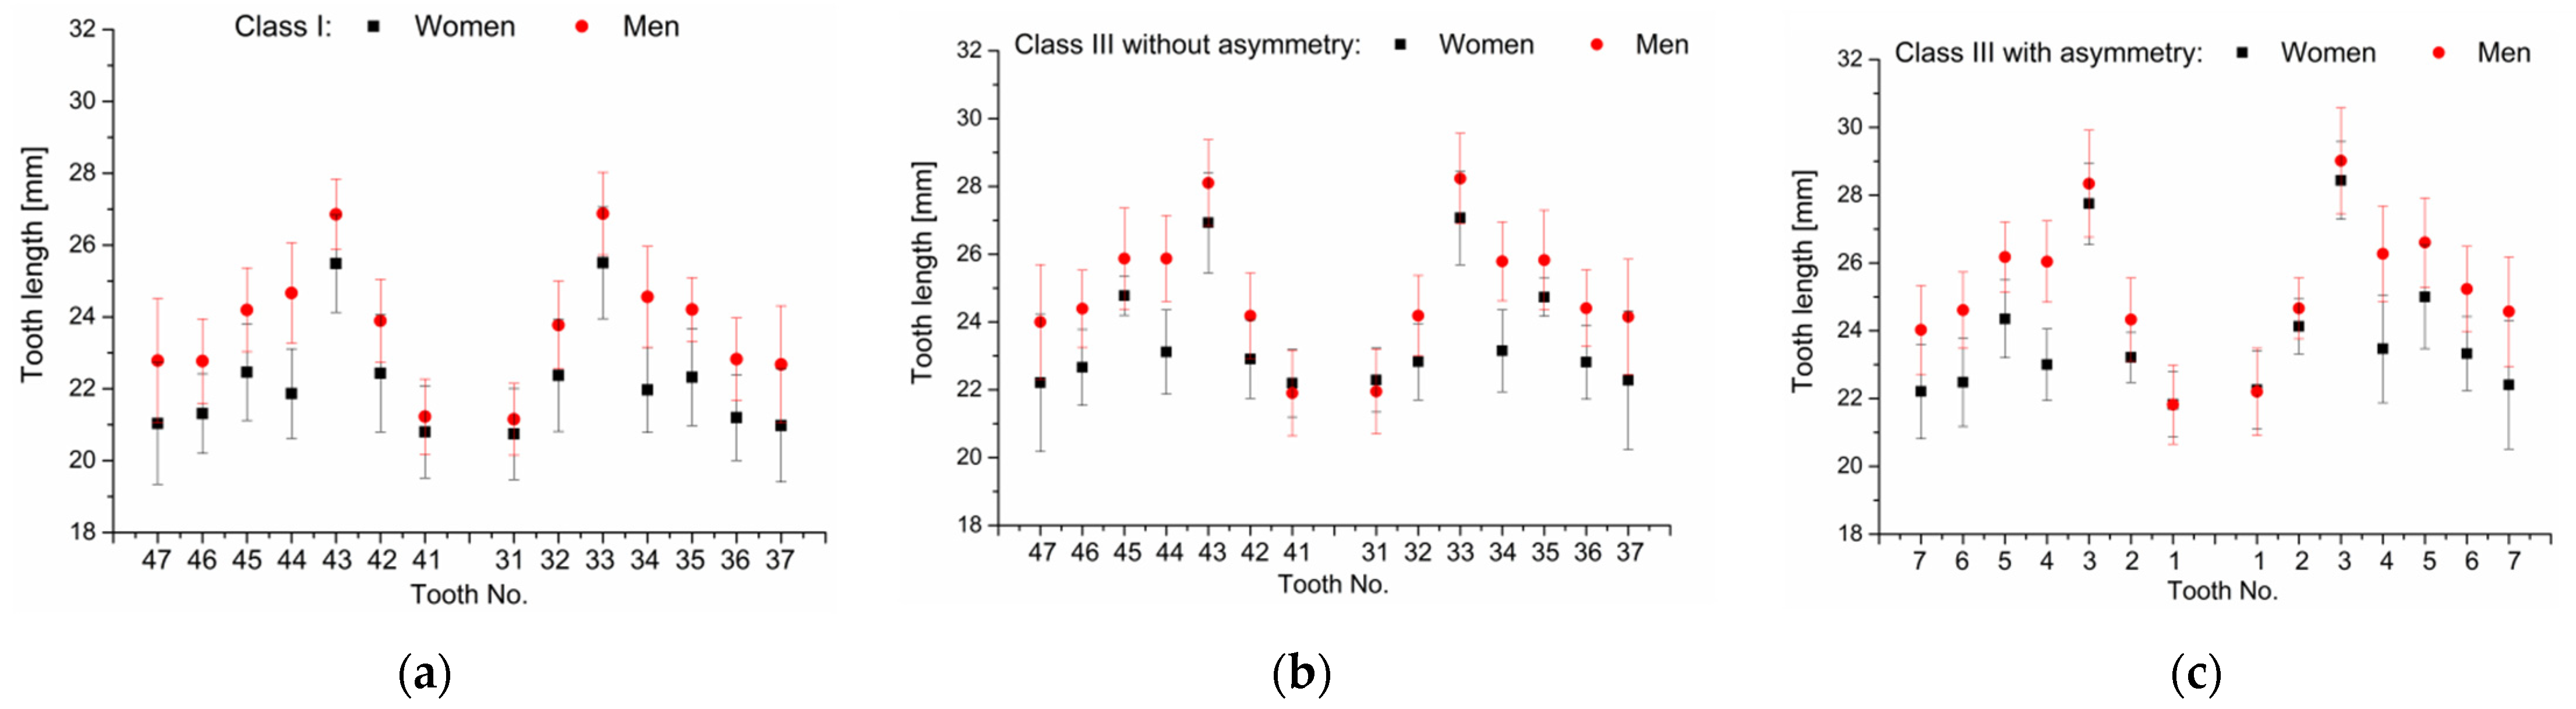
  • In all three study groups, some of men’s lower teeth were longer than women’s, so null hypothesis 1 was rejected.
  • Mandibular asymmetry and the resulting differences in the anatomy (length) of the alveolar part of the mandible on the right and left side did not affect the differences in the length of the teeth on the hyperplastic and non-hyperplastic side, so null hypothesis 2 was confirmed.
  • In skeletal class III patients without asymmetry, some lower teeth were longer than they were in skeletal class I patients, so null hypothesis 3 was rejected.
  • When creating computational models that allow for the designing of orthodontic aligners and analyzing the forces acting on teeth, software developers should account for the sex and the skeletal class of the patient. This is why current models, which do not differentiate between patients in these respects, have significant limitations and cannot be extrapolated to the whole population.
  • Clinicians should account for sex as well as the skeletal class of patients when predicting the difficulty and effectiveness of an orthodontic treatment to be implemented.
  • It may be advisable to create a database describing the dental anatomy of patients with different anatomical characteristics, which can be used by clinicians when examining their patients. This can enable simple individualization of orthodontic treatment without the need to take any additional, time-consuming steps.

Author Contributions

Conceptualization, B.K. and M.S.; methodology, M.W., B.K. and M.S.; software, M.W., M.Ż. and K.S.-P.; validation, M.Ż. and K.S.-P.; formal analysis, M.Ż. and K.S.-P.; investigation, M.W.; resources, M.W.; data curation, M.W.; writing—original draft preparation, M.W.; writing—review and editing, M.S., M.Ż. and K.S.-P.; visualization, M.W.; supervision, M.S. and B.K.; project administration, M.S. and B.K. All authors have read and agreed to the published version of the manuscript.

Funding

This research received no external funding.

Institutional Review Board Statement

The study was conducted in accordance with the Declaration of Helsinki, and approved by the Ethics Committee of Wroclaw Medical University (protocol number KB-231/2021, dated 19 March 2021).

Informed Consent Statement

Informed consent was obtained from all subjects involved in the study.

Data Availability Statement

All data generated and analyzed during this study are available from the corresponding author on reasonable request.

Conflicts of Interest

The authors declare no conflict of interest.

References

  1. Liu, L.; Zhan, Q.; Zhou, J.; Kuang, Q.; Yan, X.; Zhang, X.; Shan, Y.; Li, X.; Lai, W.; Long, H. Effectiveness of an anterior mini-screw in achieving incisor intrusion and palatal root torque for anterior retraction with clear aligners: A finite element study. Angle Orthod. 2021, 91, 794–803. [Google Scholar] [CrossRef]
  2. Ayidağa, C.; Kamiloğlu, B. Effects of Variable Composite Attachment Shapes in Controlling Upper Molar Distalization with Aligners: A Nonlinear Finite Element Study. J. Healthc. Eng. 2021, 2021, 5557483. [Google Scholar] [CrossRef]
  3. Yokoi, Y.; Arai, A.; Kawamura, J.; Uozumi, T.; Usui, Y.; Okafuji, N. Effects of attachment of plastic aligner in closing of diastema of maxillary dentition by finite element method. J. Healthc. Eng. 2019, 2019, 1075097. [Google Scholar] [CrossRef]
  4. Barone, S.; Paoli, A.; Razionale, A.; Savignano, R. Computational design and engineering of polymeric orthodontic aligners. Int. J. Numer. Method. Biomed. Eng. 2017, 33, 2839. [Google Scholar] [CrossRef]
  5. Rossini, G.; Schiaffino, M.; Parrini, S.; Sedran, A.; Deregibus, A.; Castroflorio, T. Upper Second Molar Distalization with Clear Aligners: A Finite Element Study. Appl. Sci. 2020, 10, 7739. [Google Scholar] [CrossRef]
  6. Ma, Y.; Li, S. The optimal orthodontic displacement of clear aligner for mild. moderate and severe periodontal conditions: An in vitro study in a periodontally compromised individual using the finite element model. BMC Oral Health 2021, 21, 109. [Google Scholar] [CrossRef]
  7. Cortona, A.; Rossini, G.; Parrini, S.; Deregibus, A.; Castroflorio, T. Clear aligner orthodontic therapy of rotated mandibular round-shaped teeth: A finite element study. Angle Orthod. 2020, 90, 247–254. [Google Scholar] [CrossRef] [Green Version]
  8. Liang, W.; Rong, Q.; Lin, J.; Xu, B. Torque control of the maxillary incisors in lingual and labial orthodontics: A 3-dimensional finite element analysis. Am. J. Orthod. Dentofac. Orthoped. 2009, 135, 316–322. [Google Scholar] [CrossRef]
  9. Comba, B.; Parrini, S.; Rossini, G.; Castroflorio, T.; Deregibus, A. A three-dimensional finite element analysis of upper-canine distalization with clear aligners, composite attachments, and class II elastics. J. Clin. Orthod. 2017, 51, 24–28. [Google Scholar]
  10. Gomez, J.P.; Peña, F.M.; Martínez, V.; Giraldo, D.C.; Cardona, C.I. Initial force systems during bodily tooth movement with plastic aligners and composite attachments—A three-dimensional finite element analysis. Angle Orthod. 2014, 85, 454–460. [Google Scholar] [CrossRef]
  11. Jiang, T.; Wu, R.Y.; Wang, J.K.; Wang, H.H.; Tang, G.H. Clear aligners for maxillary anterior en masse retraction: A 3D finite element study. Sci. Rep. 2020, 10, 10156. [Google Scholar] [CrossRef]
  12. Baek, S.-H.; Cha, H.-S.; Cha, J.-Y.; Moon, Y.-S.; Sung, S.-J. Three-dimensional finite element analysis of the deformation of the human mandible: A preliminary study from the perspective of orthodontic mini-implant stability. Korean, J. Orthod. 2012, 42, 159–168. [Google Scholar] [CrossRef] [Green Version]
  13. Cattaneo, P.; Dalstra, M.; Melsen, B. The finite element method: A tool to study orthodontic tooth movement. J. Dent. Res. 2005, 84, 428–433. [Google Scholar] [CrossRef]
  14. Hong, K.; Kim, W.-H.; Eghan-Acquah, E.; Lee, J.-H.; Lee, B.-K.; Kim, B. Efficient Design of a Clear Aligner Attachment to Induce Bodily Tooth Movement in Orthodontic Treatment Using Finite Element Analysis. Materials 2021, 14, 4926. [Google Scholar] [CrossRef]
  15. Kim, W.-H.; Hong, K.; Lim, D.; Lee, J.-H.; Jung, Y.J.; Kim, B. Optimal Position of Attachment for Removable Thermoplastic Aligner on the Lower Canine Using Finite Element Analysis. Materials 2020, 13, 3369. [Google Scholar] [CrossRef]
  16. Seo, J.-H.; Eghan-Acquah, E.; Kim, M.-S.; Lee, J.-H.; Jeong, Y.-H.; Jung, T.-G.; Hong, M.; Kim, W.-H.; Kim, B.; Lee, S.-J. Comparative Analysis of Stress in the Periodontal Ligament and Center of Rotation in the Tooth after Orthodontic Treatment Depending on Clear Aligner Thickness—Finite Element Analysis Study. Materials 2021, 14, 324. [Google Scholar] [CrossRef]
  17. D’Antò, V.; Bucci, R.; De Simone, V.; Ghislanzoni, L.H.; Michelotti, A.; Rongo, R. Evaluation of Tooth Movement Accuracy with Aligners: A Prospective Study. Materials 2022, 15, 2646. [Google Scholar] [CrossRef]
  18. Andrews, L.F. The six keys to normal occlusion. Am. J. Orthod. Dentofac. Orthoped. 1972, 6, 296–309. [Google Scholar] [CrossRef]
  19. Burstone, C.J.; Pryputniewicz, R.J. Holographic determination of centers of rotation produced by orthodontic forces. Am. J. Orthod. Dentofac. Orthoped. 1980, 77, 396–409. [Google Scholar] [CrossRef]
  20. Barone, S.; Paoli, A.; Razionale, A.V. CT segmentation of dental shapes by anatomy-driven reformation imaging and B-spline modelling. Int. J. Numer. Method. Biomed. Eng. 2015, 32, e02747. [Google Scholar] [CrossRef]
  21. Jacobson, A. The “Wits” appraisal of jaw disharmony. Am. J. Orthod. Dentofac. Orthoped. 1975, 67, 125–138. [Google Scholar] [CrossRef]
  22. Segner, D.; Hasund, A. Individualisierte Kephalometrie, 2nd ed.; Sietmar Segner Verlag: Hamburg, Germany, 1994; ISBN 3980270920. [Google Scholar]
  23. Paradowska-Stolarz, A. MSX1 gene in the etiology of orofacial deformities. Postepy Hig. Med. Dosw. 2015, 69, 1499–1504. [Google Scholar]
  24. De Coster, P.J.; Marks, L.A.; Martens, L.C.; Huysseune, A. Dental agenesis: Genetic and clinical perpectives. J. Oral. Pathol. Med. 2009, 38, 1–17. [Google Scholar] [CrossRef]
  25. Gershater, E.; Li, C.; Ha, P.; Chung, C.H.; Tanna, N.; Zou, M.; Zheng, Z. Genes and Pathways Associated with Skeletal Sagittal Malocclusions: A Systematic Review. Int. J. Mol. Sci. 2021, 22, 13037. [Google Scholar] [CrossRef]
Figure 1. Example measurements of the length: (a) of a single-rooted tooth using a single section; (b) of a multi-rooted tooth using more than one section.
Symmetry 14 01069 g001
Figure 2. Representation of mean teeth length in groups: (a) Class I; (b) Class III without asymmetry; (c) Class III with asymmetry: teeth from the non-hyperplastic side of the mandible are found on the left side of the graph, and teeth from the hyperplastic side of the mandible are found on the right side of the graph.
Symmetry 14 01069 g002
Table 1. The sizes of the research groups.
Group NameMandibular AsymmetrySexnAge
Class I-men1923.8 ± 2
-women1822.9 ± 2
Class IIIwithout asymmetrymen1724.1 ± 3
women1423.7 ± 3
with asymmetrymen1325.8 ± 3
women1124.4 ± 3
Table 2. Results of statistical analysis for within-group comparisons between sexes (to reject or confirm null hypothesis no. 1). Class I (Women: n = 18; Men: n = 19). Class III without asymmetry (Women: n = 14; Men: n = 17). Class III with asymmetry (Women: n = 11; Men: n = 13).
Class IClass III without Asymmetry Class III with Asymmetry
Toothp-ValueMean Diff.p-ValueMean Diff.Toothp-ValueMean Diff.
47* 0.0061.748* 0.0221.7927* 0.0191.817
460.0551.464* 0.0321.7326* 0.0022.127
45* 0.0071.7400.6081.0925* 0.0181.828
44* 8.06 × 10−82.803* 5.36 × 10−62.7604* 4.56 × 10−73.042
430.1001.3710.4871.17330.9950.590
420.0561.4600.3411.27820.5711.117
410.9990.4251.000−0.29111.000−0.007
37* 0.0081.701* 0.0101.8727 h* 0.0102.162
36* 0.0141.6260.0631.5936 h* 0.0451.909
35* 0.0011.8920.5711.0965 h0.1921.606
34* 5.90 × 10−72.594* 1.06 × 10−52.6404 h* 1.04 × 10−42.804
330.0911.3700.4751.1593 h0.9990.583
320.0721.4060.2191.3592 h1.0000.531
311.0000.4081.000−0.3371 h1.000−0.058
Total:* 1.78 × 10−81.572* 2.55 × 10−41.351Total:* 3.96 × 10−81.432
h Marks the teeth on the hyperplastic (overgrown) side of the mandible. * Marks statistically significant values at p < 0.05 with Tukey’s correction. A positive value of Mean diff. means that the tooth is longer in men. A negative value of Mean diff. means that the tooth is longer in women. The Total summarizes the mean differences in between-sex comparisons for all teeth in the given group.
Table 3. Results of statistical analysis for within-group comparisons for class III patients with asymmetry for between-sides comparisons (to reject or confirm null hypothesis no. 2). Women: n = 11; Men: n = 13.
Class III with Asymmetry
(Men)
Class III with Asymmetry
(Women)
ToothMean ± SD [mm]p-ValueMean Diff.Mean ± SD [mm]p-ValueMean Diff.
724.02 ± 1.310.9990.54122.21 ± 1.39
22.40 ± 1.89
1.0000.195
7 h24.56 ± 1.62
624.61 ± 1.130.9940.62822.48 ± 1.300.9470.846
6 h25.23 ± 1.2523.33 ± 1.09
526.18 ± 1.031.0000.42724.35 ± 1.150.9940.649
5 h26.60 ± 1.3125.00 ± 1.53
426.04 ± 1.201.0000.22823.00 ± 1.051.0000.467
4 h26.27 ± 1.4023.47 ± 1.59
328.34 ± 1.580.9880.67827.75 ± 1.200.9910.685
3 h29.02 ± 1.5628.43 ± 1.14
224.33 ± 1.231.0000.32923.21 ± 0.740.9070.915
2 h24.55 ± 0.9024.13 ± 0.81
121.82 ± 1.161.0000.38021.83 ± 0.951.0000.431
1 h22.20 ± 1.2822.26 ± 1.16
Total: 7 ÷ 125.05 ± 2.260.1820.45923.55 ± 2.180.1040.598
Total: 7 h ÷ 1 h25.51 ± 2.3624.14 ± 2.36
h Marks the teeth on the hyperplastic (overgrown) side of the mandible. A positive value of Mean diff. means that that the tooth is longer on the hyperplastic side. A negative value Mean diff. means that the tooth is longer on the non-hyperplastic side. The Total summarizes the mean differences in between-sides comparisons for all teeth in the given group.
Table 4. Results of statistical analysis for between-group comparisons for class I and class III without asymmetry groups (to reject or confirm null hypothesis no. 3). Class I (Women: n = 18; Men: n = 19). Class III without asymmetry (Women: n = 17; Men: n = 14).
MenWomen
ToothClassMean ± SD [mm]p-ValueMean Diff.Mean ± SD [mm]p-ValueMean Diff.
47I22.78 ± 1.730.0731.21921.03 ± 1.69
22.21 ± 2.03
0.1641.175
III24.00 ± 1.70
46I22.77 ± 1.18* 0.33 × 10−41.62221.31 ± 1.11* 0.0081.354
III24.39 ± 1.1322.66 ± 1.12
45I24.20 ± 1.17* 7.00 × 10−41.67422.46 ± 1.34* 3.21 × 10−62.323
III25.87 ± 1.4925.78 ± 0.58
44I24.67 ± 1.40* 0.02141.20621.86 ± 1.24* 0.0181.249
III25.87 ± 1.2723.11 ± 1.24
43I26.86 ± 0.98* 0.0131.24625.49 ± 1.35* 0.0161.444
III28.10 ± 1.2726.93 ± 1.48
42I23.89 ± 1.160.7550.29022.43 ± 1.630.5860.472
III24.18 ± 1.2622.90 ± 1.15
41I21.23 ± 1.040.1960.67620.80 ± 1.28* 0.0041.393
III21.90 ± 1.2622.19 ± 1.00
37I22.68 ± 1.63* 0.0271.47420.98 ± 1.570.1301.303
III24.15 ± 1.7022.28 ± 2.04
36I22.82 ± 1.15* 5.69 × 10−41.58321.20 ± 1.19* 0.0011.617
III24.41 ± 1.1322.81 ± 1.09
35I24.21 ± 0.89* 7.79 × 10−41.61822.32 ± 1.35* 8.99 × 10−62.414
III25.83 ± 1.4724.73 ± 9.56
34I24.56 ± 1.40* 0.0211.23121.97 ± 1.18* 0.0441.185
III25.79 ± 1.1623.15 ± 1.21
33I26.88 ± 1.15* 0.0101.36625.51 ± 1.55* 0.0111.567
III28.23 ± 1.3327.07 ± 1.38
32I23.77 ± 1.220.5280.41122.37 ± 1.560.5870.459
III24.19 ± 1.1922.83 ± 1.12
31I21.15 ± 1.000.1120.79920.74 ± 1.27* 0.0021.543
III21.95 ± 1.2522.29 ± 0.94
Total: 47 ÷ 31I23.75 ± 2.06* 2.54 × 10−91.17222.18 ± 2.01* 01.393
III24.92 ± 2.2323.57 ± 2.03
* Marks statistically significant values at p < 0.05 with Tukey’s correction. A positive value of Mean diff. means that the tooth is longer in class I group. A negative value of Mean diff. means that the tooth is longer in class III without asymmetry group. The Total summarizes the mean differences in between-sides comparisons for all teeth in the given group.
Publisher’s Note: MDPI stays neutral with regard to jurisdictional claims in published maps and institutional affiliations.

