A System Dynamics Model of the Adoption of Improved Agricultural Inputs in Uganda, with Insights for Systems Approaches to Development


1
Anheuser-Busch InBev, St. Louis, MO 63118, USA
2
Department of Engineering Management and Systems Engineering, George Washington University, Washington, DC 20052, USA
*
Author to whom correspondence should be addressed.
Systems 2018, 6(3), 31; https://0-doi-org.brum.beds.ac.uk/10.3390/systems6030031
Submission received: 9 April 2018
/
Revised: 20 July 2018
/
Accepted: 31 July 2018
/
Published: 8 August 2018
(This article belongs to the Special Issue Theory and Practice in System Dynamics Modelling)
Abstract
:Designing international development projects is challenging because the complexity of the systems on which they act makes it difficult to identify the best leverage points for intervention. This paper seeks to identify the best combinations of interventions to increase the availability of and demand for quality seeds in Uganda and similar markets. A system dynamics model simulates the current dynamics in Ugandan seed markets based on data gathered by ongoing development projects. The findings show that one intervention is critical to enabling growth—investing in a system for verifying the quality of seeds—and that a combination of quality verification with education-oriented interventions is more powerful than quality verification alone. The results have implications for systems approaches to development: they suggest that a combination of interventions in different parts of the value chain enables larger changes than any single intervention alone.
1. Introduction
International development seeks to positively influence the way social and economic systems work. Designing development interventions is challenging because the systems are complex, so it is not clear what intervention or set of interventions will achieve the desired changes. These challenges are particularly important due to the recent focus on systems approaches to development and on market systems facilitation in particular [1,2]. These approaches suggest utilizing a combination of interventions that act on various parts of the system, some of which may be relatively distant from the beneficiary of the changes.
An ongoing development project in Uganda uses such an approach. One part of the project addresses the problem of low availability of quality seeds and high prevalence of counterfeit seeds in Ugandan markets. Many farmers lack the means to check seed quality and the knowledge to value better seeds despite higher prices. Therefore, demand for quality seeds is low and agricultural dealers (“agrodealers”) may not choose to carry them, further limiting farmer access to quality seeds. There are several options for intervening in this system, including training farmers and/or agrodealers to recognize the value of paying higher prices for quality seeds, helping agrodealers to foster trust among farmer customers and to teach farmers the value of quality seeds, and working with regulatory or other authorities to put in place a verification system for genuine seeds. This paper seeks to identify combinations of interventions that can increase the availability of and demand for quality seeds, in markets like that of Uganda.
System dynamics models can simulate the outcomes of different combinations of interventions, to help in identifying the best leverage points for enabling change. This paper develops such a model to represent the dynamics described above. It focuses on how agrodealers become sellers of quality seeds and how farmers become buyers of quality seeds (or return to buying and selling low-quality seeds). The model computes the number of farmers and dealers that choose to buy/sell quality seeds, which is the key outcome of interest. Experimenting with different combinations of interventions enables us to identify the best set of interventions and examine how and why they impact outcomes. Given the scarcity of available data and the scope of this model, the results cannot be considered predictive of outcomes in Uganda, but the model can identify trends and show which interventions are likely to have larger impact than others. While the results are specific to the dynamics observed in Uganda, the analysis and conclusions are likely to be useful in any developing country context facing similar challenges. Moreover, the paper uses the findings about which intervention combinations work well in this setting to draw implications for designing market facilitation interventions in other types of contexts.
The remainder of this paper is structured as follows: Section 2 provides background on systems approaches in general and on the Uganda project in particular, and reviews relevant literature. Section 3 describes the development of a system dynamics model. Section 4 describes the results for several different intervention scenarios, Section 5 discusses their implications, and Section 6 concludes the paper.
2. Background and Related Literature
Systems approaches to development have been gaining increased attention recently [2], particularly in market systems [1]. Market facilitation is a prime example of this approach. Its aim is to stimulate markets toward positive changes, using “light-touch” interventions, such as working through private sector actors already participating in the market. Typical market facilitation projects intervene at multiple leverage points in the value chain. Such approaches aim to increase the sustainability of development outcomes by working through existing value chain participants so that changes and benefits spread widely and last past the end of the intervention.
Because facilitative approaches intervene at points in the value chain that are distant from the intended beneficiaries, and the systems they operate on are complex, it is often hard to understand the set of changes required to bring about the desired outcomes, creating challenges for both design and evaluation of projects [3,4]. In designing market facilitation interventions, this makes it difficult to determine what combination of key leverage points to intervene in. In monitoring ongoing market facilitation interventions, this makes it difficult to predict what changes are to be expected and when they are to be expected, in order to determine whether progress is meeting goals. A number of approaches have been suggested for both designing and evaluating market facilitation interventions [3,4], but few offer any predictive capabilities.
System dynamics modeling [5] offers the opportunity to investigate the expected effects of different combinations of interventions in distant parts of a complex market system [6]. The results can show which leverage points result in the most desirable outcomes and suggest the timeframe in which results would be expected. Models may also highlight potential unintended consequences. System dynamics has been used to model various aspects of agricultural systems in developing economies, generating conclusions about, for example, whether particular business models are feasible under a range of market conditions [7]; and whether policies will lead to intended consequences [8]. Many system dynamics models of agricultural systems focus on understanding how different policy decisions impact the sustainability [9,10,11] or resilience [12] of agricultural systems. This paper develops a system dynamics model of a key portion of the Ugandan market system to investigate how different intervention policies impact one key system outcome: the availability and usage of quality seed.
We investigate these dynamics in the context of a specific development project in Uganda. The Feed the Future-Value Chain (FTF-VC) project in Uganda is built on the market facilitation philosophy [13]. It seeks to increase smallholder farmer incomes by intervening with private sector actors both upstream and downstream in the value chain: agrodealers who sell inputs to other dealers and to farmers, traders who buy agricultural products from farmers or other agents, and the government actors who regulate and support the sector. The value chains for each crop are complex and face various challenges [14,15,16]; therefore, increasing farmer incomes requires a complex chain of results to occur and may involve significant delays. The authors have worked closely with the FTF-VC project to address many of these challenges, including developing system maps to better understand the system [17] and measuring how various parts of the system have been changing e.g., [18].
In this paper, we focus on one goal of the project: encouraging greater availability of and demand for high-quality (non-counterfeit) seeds [19]. According to the theory of change, before farmer incomes can improve, a regulatory framework and system must enable verification that seeds are non-counterfeit, agrodealers must choose to sell these higher-priced seeds, and farmers must choose to buy them. Each of these changes may take time to occur and spread.
In Uganda, one of the critical constraints to improving smallholder farmer incomes is a lack of access to quality seeds and other inputs (such as fertilizer) [20]. Quality seeds create higher crop yields for farmers, but many farmers do not wish to pay the higher prices for quality seeds, do not understand their value, or simply do not have access to purchase quality seed. Compounding the problem, limited monitoring and enforcement of seed quality standards has led to a widespread problem with counterfeit seed: as much as 50% of seed and 30% of fertilizer in the market may be counterfeit [21,22]. Seed certification systems been introduced, by which farmers can verify that purchased seed is of high quality. These systems have not penetrated the entire market, and not all farmers know how to verify seed quality nor understand the value of quality seed. Improving farmer incomes through widespread use of quality seed therefore requires farmers to demand quality seed, dealers to choose to sell it, and the government or other entities to enable its certification.
This paper builds a system dynamics model to represent the dynamics described above, in order to understand the most important leverage points to enabling widespread adoption of quality seeds by farmers. Derwisch et al. [23] use system dynamics to simulate farmer adoption of improved seed in Malawi. Their work focuses on farmer perceptions and decision-making, and they find that counterfeit seed’s presence in the market affects farmer adoption decisions, and that branding can stimulate farmer adoption and demand. Our work is distinguished from their model in that we focus on the interaction among farmers and dealers with regulatory entities, and we show how the presence of counterfeit seed along with other factors can stall or stimulate growth in adoption of improved seed. Others have studied the dynamics of seed suppliers in developed economies e.g., [24], but the dynamics of interest are very different in our case.
Our model draws upon and links concepts that have been implemented and/or proposed in the literature. First, an extensive amount of literature on the diffusion of innovations provides the fundamental structure for modeling how non-counterfeit quality seeds may be adopted by both farmers and dealers. The Bass diffusion model [25] has been widely used in a variety of contexts [26], including agriculture [27]. We adopt its basic structure here, not only because of its long history of representing diffusion of innovations, but also because the structure usefully represents certain aspects of systemic change as defined in the development literature. One such framework focuses on the movement from a small number of actors adopting a change to the “crowding in” of other actors (not reached directly by development interventions) who copy the change and expand or diversify it [28]. The Bass diffusion model represents precisely this dynamic. Our system dynamics model draws upon these established models along with detailed data available for Uganda (described below).
3. Approach and Methods
The sections below describe the background for the model’s development, then show how its structure was built based on a detailed understanding of the Ugandan agricultural system, and finally explain the data and assumptions with which the relationships were quantified for modeling purposes.
The model focuses on the adoption of quality seeds and uses data related to seed adoption, but its structure is general enough to represent the adoption of other types of quality agricultural inputs such as fertilizer. Therefore, we use the term “input” rather than “seed” in describing the model.
3.1. Basis for the Model: Understanding the Ugandan Market System
Understanding the relationship between interventions and outcomes in a complex system requires understanding the structure and dynamics of the system. System dynamics models simulate a system based on assumptions about the structure and strength of relationships, but it is critical to understand those relationships well enough to model them.
In this study, we take advantage of ongoing work in which the relationships and dynamics of the Ugandan agricultural market system are mapped in collaboration with a wide range of stakeholders. A system map has been built using a “Behaviors–Relationships–Conditions” mapping framework [29] that is similar to causal loop diagrams [5]. This map provides a strong conceptual basis for developing a simulation model: the map’s elements and interconnections were the basis for the variables, stocks, flows, and other relationships in the system dynamics model.
The system map used as the basis for our model was built based on a year-long effort involving several extensive engagements with system stakeholders and detailed analysis of data on various aspects of the system [29]. An initial version was created based on interviews with the key development actors, in which they described their understanding of the system based on their past four years of involvement in it. Second, the map was critiqued and updated in a workshop attended by approximately 30 stakeholders drawn from all the relevant USAID projects in Uganda. Third, extensive analysis of relevant data collected over the past three years enabled refinement of the map. Finally, a major workshop that brought together approximately 130 stakeholders from agriculture in Uganda—not only development actors but also private sector, government, and farmers—critiqued and updated all portions of the map. The resulting product is a very good reflection of our current understanding of the agricultural market system in Uganda.
Our model focuses on the portion of the map depicting how agricultural inputs such as seeds and fertilizer are sold to farmers and how farmers use them. The key dynamics of this portion of the market system were described in Section 2 above. Unsurprisingly, the model required that parts of the entire system map be left out of the model, and that other parts be represented in greater detail. Parts were left out in order to focus on the key dynamics of interest for our purposes: those related to the four interventions which we test in this paper (see the next section). Many of the dynamics left out of the model involved interaction with other ‘subsystems’ in the map, such as the financial sector (e.g., credit provision) or the outputs value chain (e.g., prices for farmer crops). Section 3.5 provides more detail on some of these omitted dynamics and their potential importance. On the other hand, the model represents some feedback loops in more detail than the original map, such as those governing dealer profitability, since the original map was meant to function as a higher-level overview of the system.
3.2. Identifying Key Outcomes and Interventions
In collaboration with USAID and their development partners, we identified two key outcomes that are desirable in reflecting widespread availability to and usage of quality seeds among Ugandan farmers:
- Dealers stock quality inputs,
- Farmers demand quality inputs.
Based on the system map, and again in collaboration with USAID and their development partners, we then identified four key interventions or leverage points that are most relevant to enabling these outcomes.
First, farmers may learn the value of quality inputs. The learning may occur through training accomplished and/or supported by a development organization directly. Alternatively, regardless of donor-supported training, farmers may learn through conversations with other farmers (or through formal or informal training conducted by the dealers from whom they buy quality inputs, as discussed in the third point below).
Second, dealers may learn the value of quality inputs, to ensure they understand why and how they can be used. Again, the learning may occur through direct training (either by a development organization or a seed supplier supported to do such training by a donor) or through conversations with other dealers. (Seed suppliers could provide training themselves without donor support, but this dynamic is not modeled explicitly.)
Third, dealers may themselves help farmers to learn the value of quality inputs, for example through trainings conducted by dealers for their farmer customers. Development organizations would not implement this training directly, but rather would initially support dealers in learning how to conduct these trainings and with ideas for how to do so. Additional dealers not initially supported by development organizations might later learn how to do such trainings through conversations with supported dealers or by imitating successful dealers.
Fourth, development organizations may support the setup of regulations and a system for verifying the quality of inputs, either through the government or private sector actors. One current system enables seed suppliers to place scratch-off ‘badges’ on products, whose validity farmers can check via text message. Therefore, the use of such a system requires that farmers understand how to verify quality using badges and that dealers stock product from seed suppliers who have chosen to use this system.
USAID has funded or considered all four of these types of interventions, and the latter three are related to the FTF-VC project. The system dynamics model represents the key dynamics that connect these interventions to the outcomes and the dynamics that might influence or “interfere” with the outcomes, as described below.
3.3. System Dynamics Model
System dynamics modeling represents changes in a complex system, and is particularly useful for simulating the stock-flow-feedback processes that typically underlie the behavior of complex systems like that we study here [5]. The modeling language relies on three main types of variables. “Stocks” represent the accumulation of something; “flows” represent the rate of flow into or out of a stock; and other variables may influence stocks, flows, and each other to govern the system. The set of stocks, flows, and variables represents a system of coupled nonlinear differential equations, which can be simulated over time to determine how stocks change.
Our system dynamics model represents the key dynamics that enable widespread availability of and adoption by farmers of quality inputs. It represents outcome (1), dealers stocking quality products, through changes in a stock of dealers who have adopted quality inputs, meaning that they choose to sell quality inputs. It represents outcome (2), farmers demanding quality products, through changes in a stock of farmers who have adopted quality inputs, meaning that they choose to buy and use them.
There are three main sections of the model, which represent dealer behavior, farmer behavior, and costs and profitability (which are relevant to decisions by both farmers and dealers). Each of these sections are described below. (Note that we use the terms “quality dealer” and “quality farmer” to signify dealers (farmers) who have chosen to sell (buy) higher-priced quality inputs. This does not guarantee that these quality inputs have been verified as such; this is a potential barrier to adoption, as discussed above.)
3.3.1. Dealer Adoption
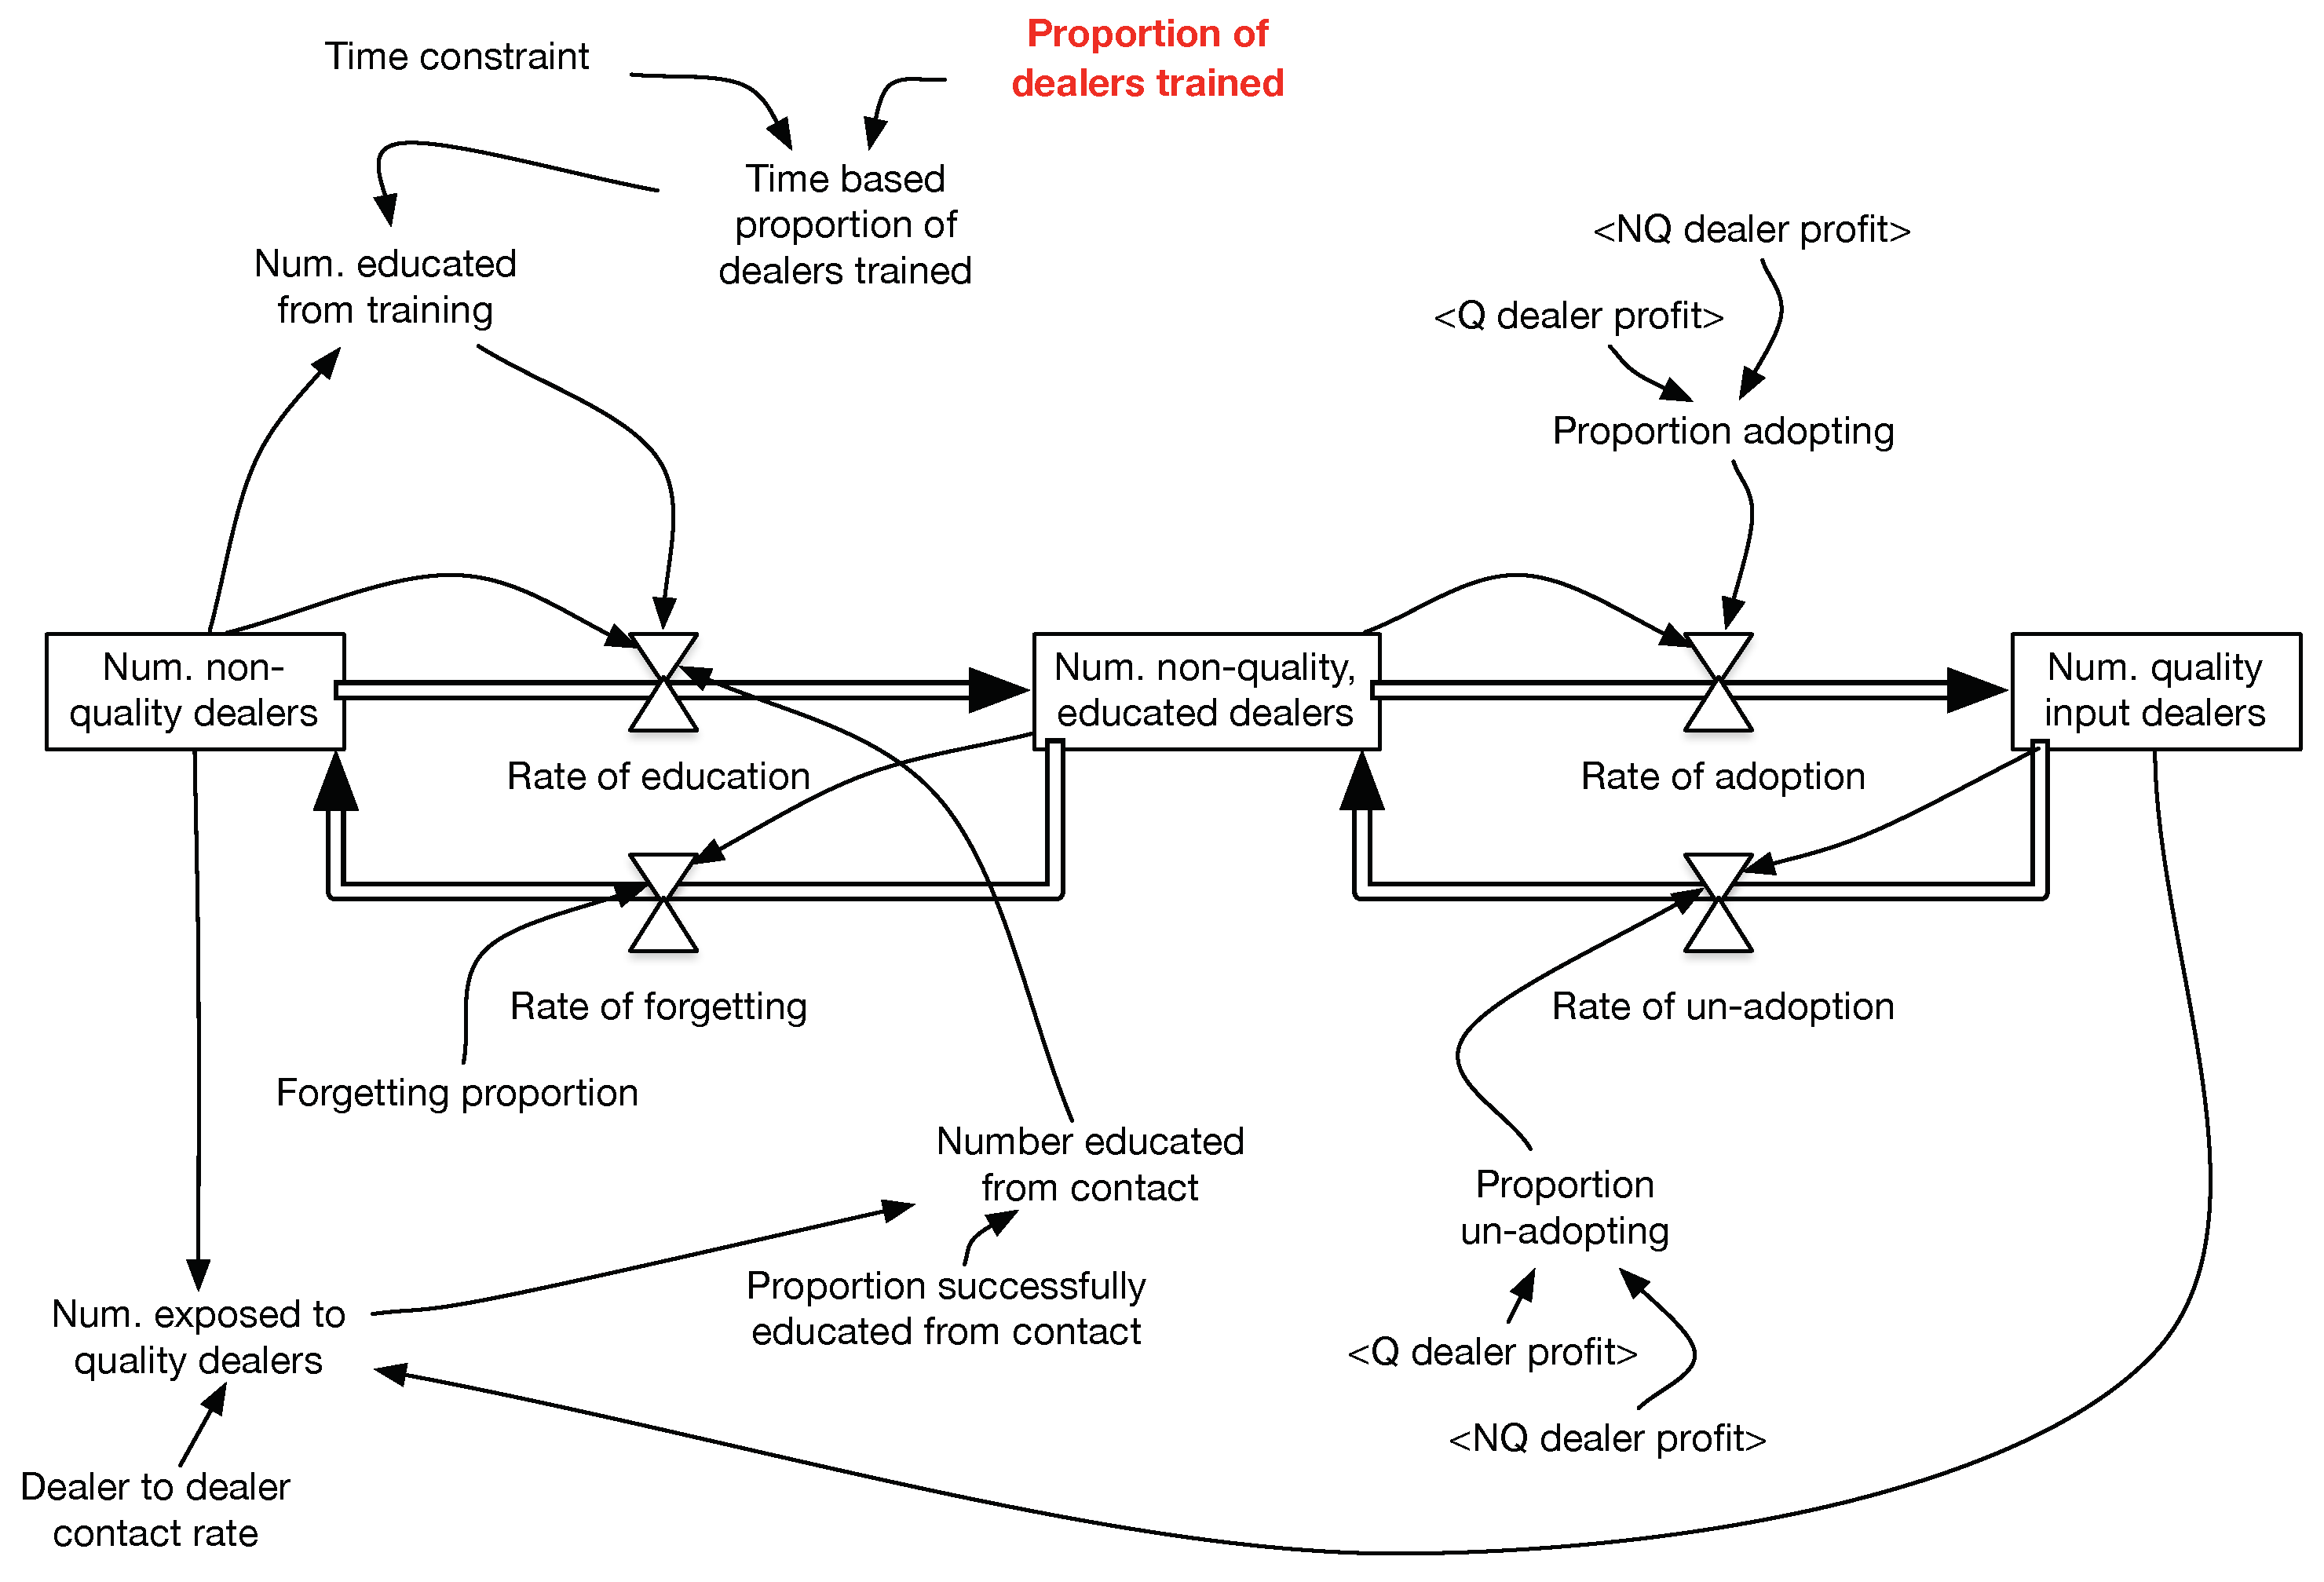
The dealer adoption section of the model is shown in Figure 1.
The key dynamic is the movement of dealers from the stock of “non-quality dealers” to the stock of “quality input dealers”, or back from quality to non-quality. This represents a key desired behavior change in which dealers choose to sell quality inputs. There are two steps in this transition: non-quality dealers first learn about the value of selling quality inputs (and move to the stock of “non-quality, educated dealers”) and then choose to become quality input dealers (move to the stock of “quality input dealers”).
In the first step, the rate at which non-quality dealers learn about the value of quality inputs is influenced by two factors. First, dealers may be educated through a donor-supported or other training. The proportion of dealers trained is tested at different values in our experiments to represent different investments in this intervention, and the intervention duration is five years, consistent with recent USAID programming (though we later test the sensitivity to this assumption). Second, dealers learn about the value of quality inputs because they see that other dealers are successfully selling quality inputs, the so-called “crowding in” or “word of mouth” effect. The rate of crowding-in depends on how often non-quality dealers come in contact with quality dealers (which depends on how many quality dealers there are) and the proportion of contacts that result in the non-quality dealer learning about the value of quality inputs. While there is no data on these parameters for dealers, their values are estimated based on values found for farmers (see Section 3.4 and Appendix A for details).
In the second step, the rate at which educated non-quality dealers choose to become quality dealers is influenced by the potential for higher profit through selling quality products. When there is more profit to be made by selling quality inputs, more dealers will choose to adopt. We make the basic assumption that when profits are equal among quality and non-quality products, only a small number of dealers will be motivated to sell them, but, as profits become higher for quality products, more and more dealers will choose to adopt (see Appendix A for details).
Thus, through these two steps, the overall movement from non-quality dealers to quality dealers is influenced by education through training, contact with successful quality dealers, and the potential profit. These are the three key factors that were identified in the system maps (described in Section 3.1) and in farmer surveys (see Section 3.4) as influencing this adoption decision.
Dealers may also un-adopt—choosing to sell non-quality inputs after selling quality inputs. A dealer’s choice to stop selling quality inputs is influenced by the profitability. If it is more profitable to sell non-quality inputs, they will be more likely to do so. The function’s parameters are similar to those for adoption: dealers will not un-adopt until profit is lower for quality than for non-quality products. Dealers who are educated about quality inputs but are not selling them (the stock of “non-quality educated dealers”) may also ‘forget’ about the value of quality inputs, at an assumed (and small) rate.
The model includes a reinforcing loop, in which changes are continually amplified: increasing numbers of quality dealers enables further education through word-of-mouth because the increased number of quality dealers make contact with them more likely. On the other hand, adoption rates are limited if the market does not support adequate profits for quality dealers.
3.3.2. Farmer Adoption
The farmer adoption section of the model is shown in Figure 2. As with the dealer portion of the model, the key dynamic is the movement of farmers from the stock of “non-quality farmers” to the stock of “quality inputs farmers” and back. This represents a key desired behavior change in which farmers choose to buy quality inputs.
This transition has two steps, analogous to adoption by dealers discussed in Section 3.3.1: farmers first must learn the value of quality inputs and then choose to purchase them. In the first step, the rate at which farmers become educated about the value of quality inputs is influenced by two factors: the number and effectiveness of trainings—which may be offered by intervening development organizations or by input dealers who sell quality inputs; and the “crowding in” or “word of mouth” effect, in which contacts with quality farmers enable non-quality farmers to learn about the value of quality inputs. The farmer to farmer contact rate and proportion of contacts resulting in education were found from a survey of farmers (see Appendix A for more details), while the likelihood of contact with a quality (rather than non-quality) dealer is the percentage of dealers selling quality products. Note that the model assumes training by word of mouth is just as effective as formal training offered by dealers or by development organizations (there is no data on whether there are differences).
In the second step, educated farmers (in the stock of “non-quality, educated farmers”) may then choose to adopt quality inputs. The rate at which they choose to adopt quality inputs is influenced by four factors, which were identified in a farmer survey as the key barriers for farmers adopting quality inputs.
First, adoption is constrained by the farmer’s access to quality inputs. Access depends on whether a quality dealer is accessible to the farmer, and whether the dealer is stocked out of quality inputs. The proportion of farmers with access to a quality dealer is driven by the number of dealers accessible to them and the proportion of dealers who sell quality products. (Most Ugandan farmers have access to only a few agrodealers who are nearby, since nearly all are smallholder farmers and few have access to motorized transportation.) In-stock probability represents the chance that each dealer is not stocked out for a farmer’s visit in each growing season (based on a market-wide average from the farmer survey). A stockout at all of a farmer’s accessible quality dealers, or a lack of access to quality dealers, prevents the farmer from adopting in that season.
Second, adoption is influenced by the percentage of farmers who see quality inputs as requiring too much labor. (This parameter’s value comes from a farmer survey).
Third, adoption is influenced by the proportion of farmers who can verify that quality inputs available in the market are not counterfeit. Farmers typically do not trust their dealers’ word on whether inputs are genuine, and the ‘badges’ with which genuine quality can be verified are not available everywhere and for all products (in other words, not all dealers who sell quality seeds sell ‘badged’ quality seeds). In addition, not all farmers understand how to use these badges to verify input quality. The “proportion who can verify quality” represents the proportion of farmers who understand how to do so and whose dealers carry products marked with the badge. (This value is one of the interventions we study, so it is varied deliberately.)
Fourth, adoption is influenced by the difference in price between quality and non-quality inputs. The function governing adoption based on price was determined based on current price differences and the reported choices made by farmers in a recent survey; see Appendix A for details.
The rate at which farmers un-adopt quality inputs—choose to buy non-quality after buying quality inputs—is influenced primarily by price and access, along with other reasons given by farmers in a recent survey. Farmers un-adopt when prices are too high, or when they cannot access a dealer who stocks quality inputs. The rates of un-adoption are based on the percentage of farmers who, in the survey, reported they had chosen to un-adopt because of either price or access combined with other reasons. (Appendix A provides details of the functions governing un-adoption due to price and access.)
As in the dealer portion of the model, there is a reinforcing loop in which, as more farmers adopt quality inputs, more farmers are convinced to do so by word of mouth. In addition, there is a second reinforcing loop that connects farmers and dealers. As more dealers choose to sell quality inputs, more farmers have access to quality inputs and (potentially) more farmers may be trained in the value of quality inputs by dealers. Conversely, if fewer dealers sell quality inputs, access for farmers goes down, limiting the number of farmers who can adopt. Other limitations on the adoption rate include in-stock probabilities, perception of increased labor, and high prices.
3.3.3. Dealer Profitability
The dealer profitability section of the model is shown in Figure 3. These two loops represent the average business performance of a non-quality and a quality dealer. Each dealer is assumed to have the same market share and the same market conditions as all the other dealers in their groups. (This assumption was made in the absence of better information but appears reasonable for our purposes because the agrodealers who sell directly to farmers tend to be single small shops who sell to their own local populations.) Profit for each (non-)quality dealer is total revenue minus total expenses for all (non-)quality dealers, divided by the total number of (non-)quality dealers. The total revenue is based on the selling price and the units sold, which in turn is influenced by the number of (non-)quality farmers. The expenses are based on the purchase price from a supplier. The purchase and selling prices are estimated based on current market prices, but we also perform a sensitivity analysis on these parameters.
3.3.4. Implementation
The model was implemented in Vensim 7 PLE (Ventana Systems, Inc., Harvard, MA, USA).
3.4. Data Sources
The relationships in the model were drawn from the system map created for the agricultural system in Uganda (described in Section 3.1), but the system map does not quantify the strength or characteristics of each relationship. To do so, we drew on several other data sources, as referenced in the preceding paragraphs.
The most important data source was a survey of farmers conducted by one of the USAID-supported activities. Data came from two growing seasons in 2015 and 2016. Additional data sources include population information from the Ugandan Bureau of Statistics, an agrodealer survey conducted by another USAID activity, and market statistics from field experts.
The farmer survey identified the key factors that constrain farmer adoption of quality inputs and enabled us to quantify the extent to which each factor does so. First, it described aspects of the relationships between farmers and their peers. Questions regarding whether farmers trained other farmers and whether they feel confident in their understanding of quality inputs informed the “word of mouth” variables in the model. Second, the survey also showed how dealers or development actors influenced farmers. Questions regarding whether farmers had been trained by dealers and/or development organizations, combined with whether they feel confident in their understanding of quality inputs, informed the training success rates in the model. Third, the survey identified barriers to adopting quality inputs. A survey question that asked farmers to explain why they did not use quality inputs informed the rates by which accessibility, labor, lack of verifiable quality, and price impede farmer adoption in the model.
Farmer and dealer populations were estimated based on available data from the Uganda Bureau of Statistics and a survey of agricultural input dealers conducted by another USAID activity. Prices for quality and non-quality inputs were gathered from summer 2017 prices in Ugandan seed markets for maize.
As in many developing country contexts, data were not available to quantify every relationship. Where data were not available, reasonable estimates were made. For example, there was limited data on “word of mouth” for dealers; estimates were made based on the data for farmers.
3.5. Assumptions and Model Boundary
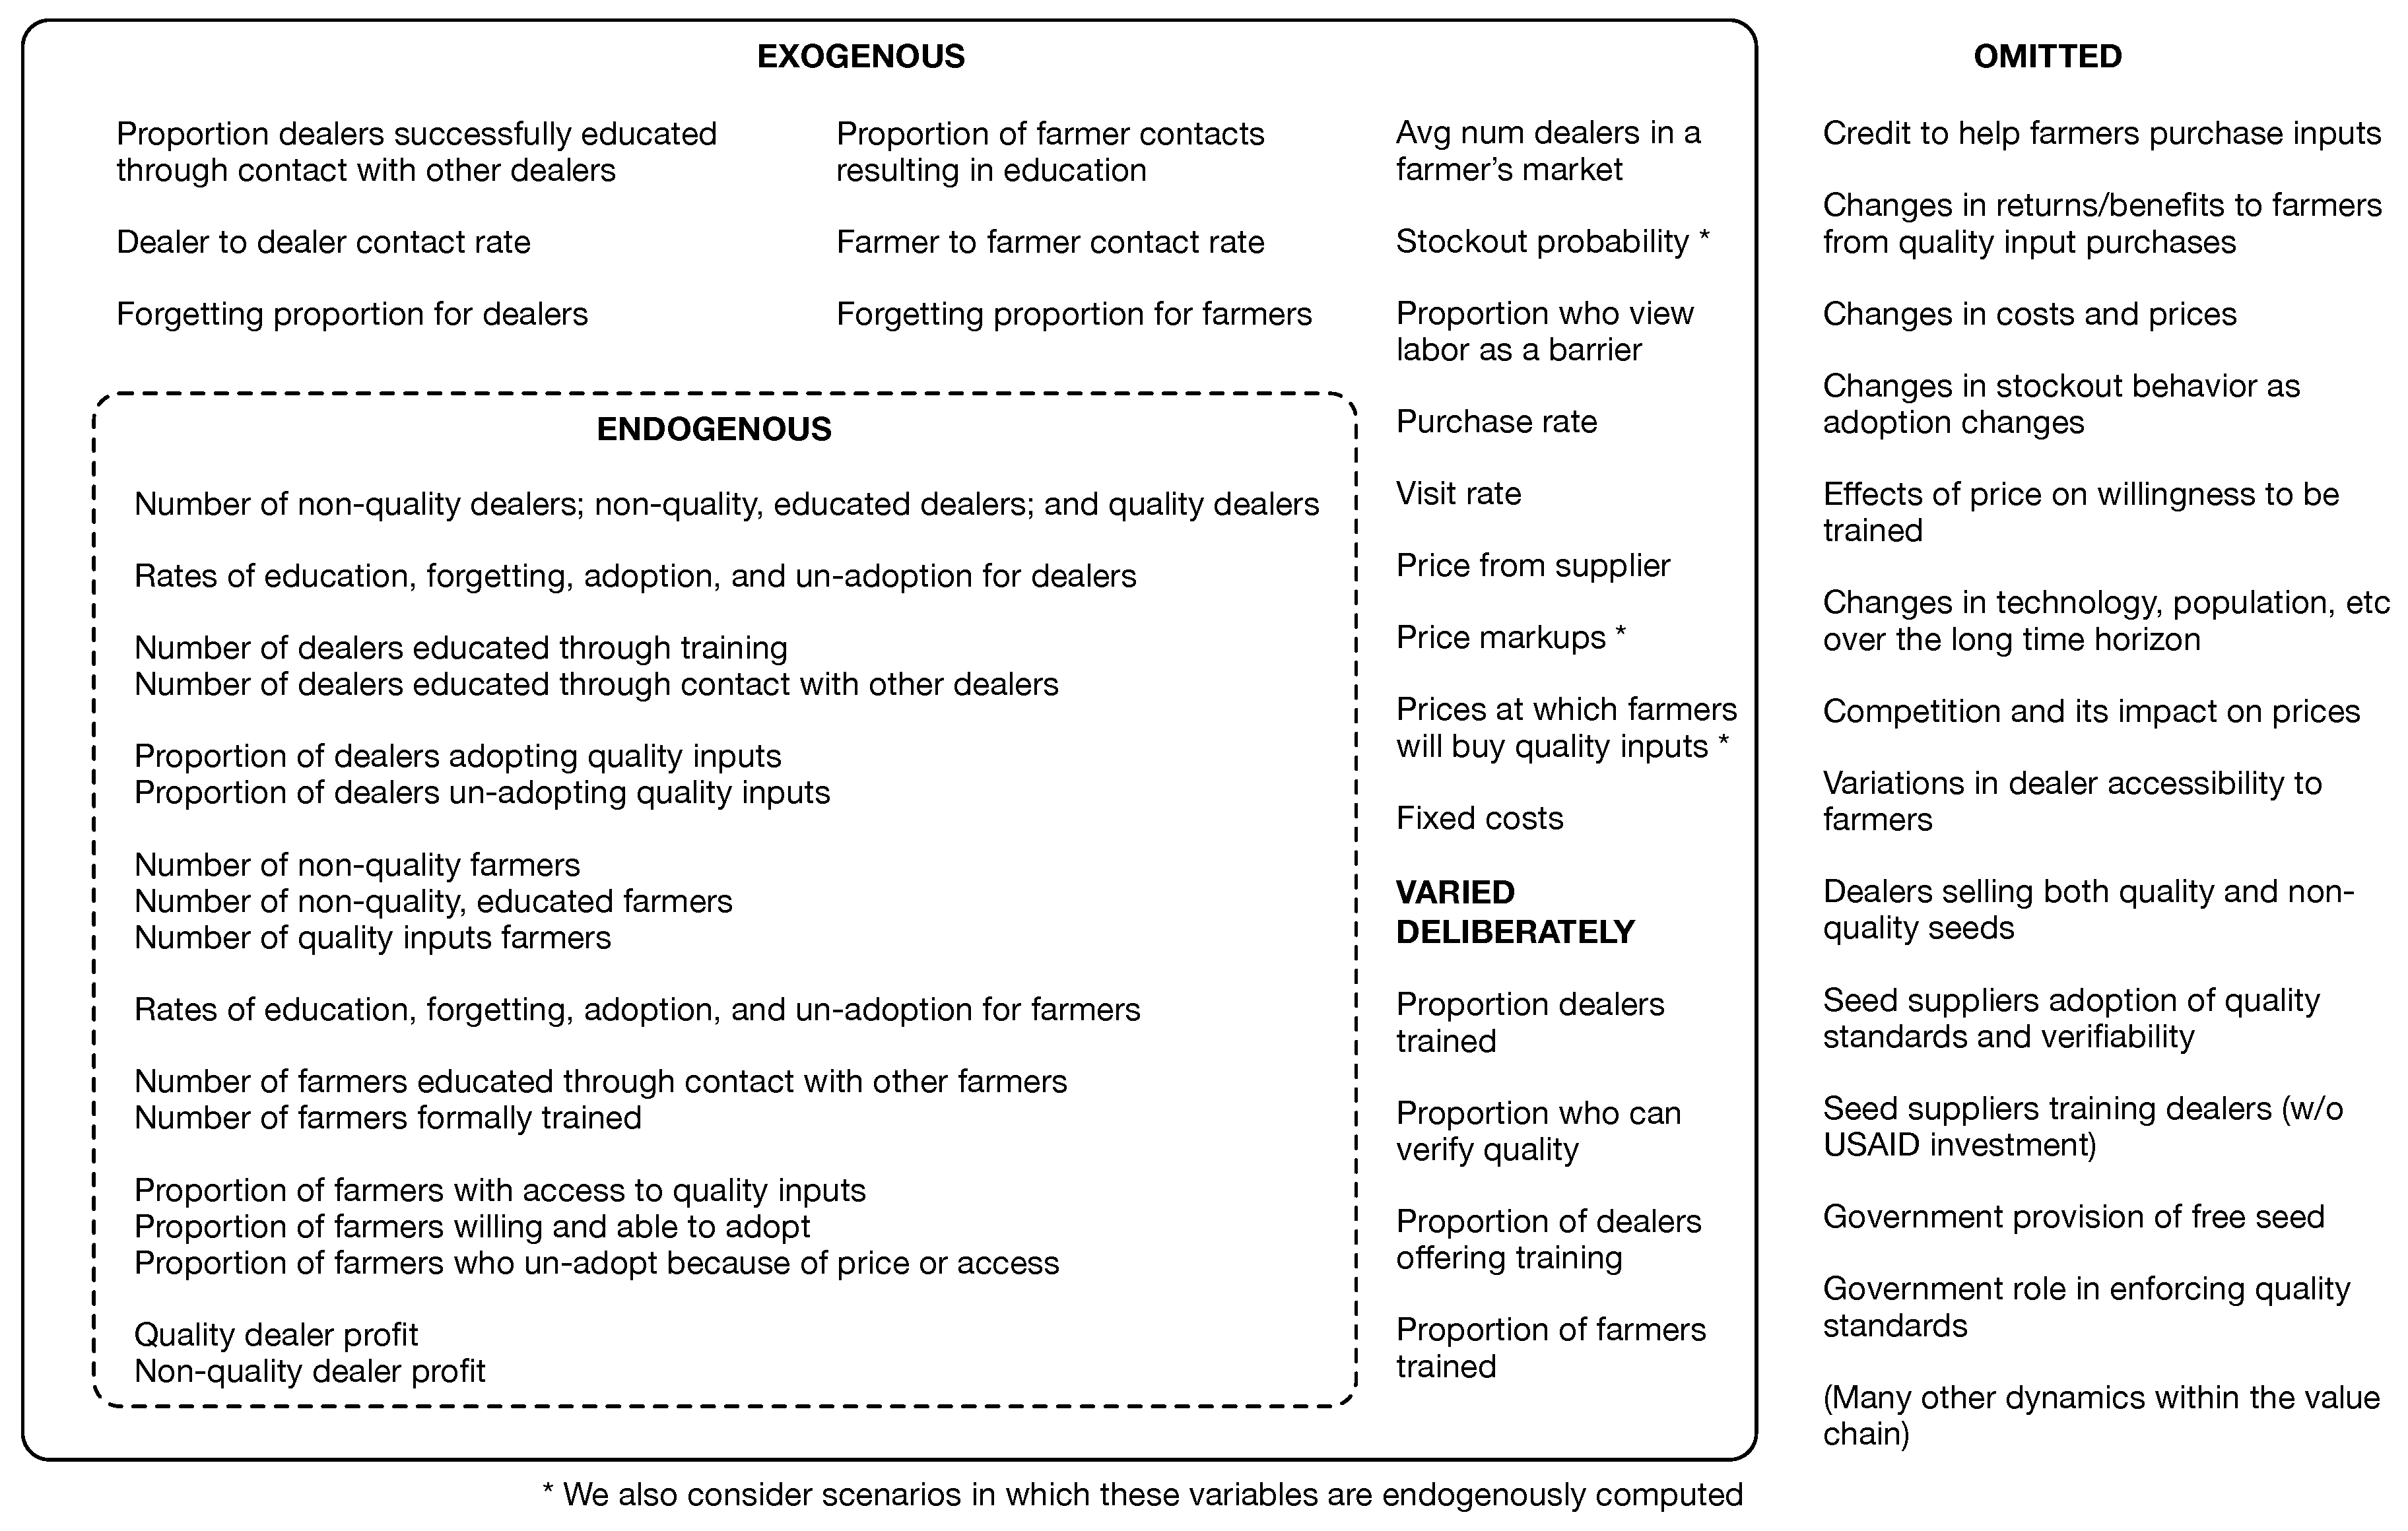
A number of potentially important dynamics were not included in this model, in order to focus on the most critical dynamics identified by our development partners (see the discussion of building a system map, in Section 3.1). Figure 4 provides a model-boundary diagram [30], which highlights which dynamics are endogenous, exogenous, and omitted from the model.
Many of the omitted dynamics represent long-term changes, such as farmer population trends, market prices, and technology. Likewise, many of the exogenous (fixed) variables, such as price markups and costs, might change over time as the system features change. A model aiming to predict performance over a long time horizon should include many of these dynamics. However, our goal is different. We seek to understand how a set of relatively short-term development investments set the system on different trajectories. The model makes assumptions consistent with a shorter time horizon in which many system features remain constant. Simulating the system over a somewhat longer 10-year time horizon (as we do in our results) helps to highlight the differences between the trajectories; the purpose is not to predict long-term results but to better understand the implications of short-term decisions. Including the longer-term dynamics (which we currently fix or exclude) might make it harder to distinguish which aspects of the results were due to the development interventions we test and which are due to other factors. However, future work should attempt to understand whether the omitted factors would differentially affect the performance of the interventions we test. We include a sensitivity analysis in Section 4.4 to identify some of the factors likely to make an important impact.
One omitted dynamic is the potential role of credit in enabling more farmers to purchase quality inputs. Indeed, provision of credit by dealers and/or financial institutions is a growing focus of development interventions. It was not modeled here, since it was not the focus of the particular project with which we worked. We expect that credit provision would enable wider adoption by farmers, and that it could potentially have a large impact. Future work should investigate this question.
A second omitted dynamic is the returns, or benefits, from investment in quality inputs, which are related to the price at which farmers sell their output. The current market rewards higher yields and some aspects of higher-quality outputs [31] with higher selling prices. The current model assumes that returns remain the same as they are in the current market because the rate of un-adoption is based on the rate at which farmers currently report un-adopting because of price (presumably because returns did not justify the additional investment). The output prices and farmer returns are unlikely to remain the same over the long term. Therefore, in Section 4.4, we examine how the results would change if output prices fall as the number of quality farmers grows. Our assessment, however, is not comprehensive, and future work should explore this issue, since our results indicate it is important.
Similarly, changes in seed prices from suppliers and markups for quality seeds are assumed fixed, although in reality they would likely change as the market expands. Here, again, there was no data to indicate how prices and markups would change. They are fixed at a constant value in this model, but we examine how the results would change if they were endogenous; see Section 4.4.
Other omitted dynamics include the behavior of seed suppliers (those who sell to dealers) and the role of the government. The list provided in the model boundary diagram is by no means comprehensive, since the system is large and complex.
3.6. Scenarios
We investigated the impact of different levels of investment in four different interventions in the system, in order to learn which interventions provide the largest benefit.
The four interventions include:
- Proportion of dealers trained: The percentage of the total non-quality dealers that are effectively taught about quality inputs by any development organization or the government. The intervention is limited to five years, aligned with the typical length of a USAID intervention (though we test the sensitivity to this assumption).
- Proportion of quality dealers successfully training farmers, or “dealer-to-farmer training”: The rate at which non-quality farmers are successfully trained by quality dealers about the value of quality inputs. In practice, these training sessions include farmer field days and educational promotions. The total number of farmers reached through these training sessions is limited by the total number of quality dealers. There is assumed to be no time limitation, since dealers may continue training farmers even after donor-supported training of dealers has ceased.
- Proportion who can verify quality: The proportion of farmers who can verify product quality, in that they know how to do so and products with the verification ‘badge’ are available in their market. There is assumed to be no time limitation, since a private-sector verification entity would continue to operate after a donor-supported intervention had ceased. The proportion is ramped up linearly from 10% to the maximum value in five years (after which it remains constant), to represent the gradual roll-out of the technology and training to use it.
- Proportion of farmers trained through development-supported organizations: The proportion of all non-quality farmers who are effectively taught about quality inputs through training by donor-supported organizations. The intervention is limited to five years, aligned with the typical length of a USAID intervention (though we test the sensitivity to this assumption).
In the results that follow, for simplicity, we examine investments in each intervention at low (10%), moderate (50%) and high (90%) levels. The “baseline” scenario includes all four interventions at minimal (10%) levels. The initial value for the total percentage of farmers who had adopted quality seeds was set at 52% (based on the farmer survey). The initial value for the percentage of dealers who had adopted quality seeds was set at 45% (from the dealer survey). All the other model parameters are based on data from the farmer survey and agrodealer survey discussed in Section 3.4.
It is important to note that, while all four of these interventions can be varied from 0% to 100%, these investments require very different levels of resources. For example, training 90% of all farmers requires more resources than training 90% of all dealers, since there are many more farmers than dealers. While our results examine investments in each intervention at 10%, 50% and 90% levels, it is important to keep in mind that the actual levels of resource investment are very different. Section 4.3 considers this issue in more detail.
We also investigated the effect of different combinations of these interventions, in order to understand whether intervening in multiple parts of the value chain is necessary in order to make progress. In particular, we considered a package of “market facilitation” interventions that involved working only with dealers and regulators or industry actors, but not with farmers, following a market facilitation ‘light touch’ approach (interventions 1, 2, and 3). We also considered all four interventions together.
Finally, we examined the sensitivity to additional important factors. Section 4.4 provides details.
4. Results
This section gives an overview of the results for one intervention at a time, and then combinations of interventions. Next, the cost-effectiveness of the interventions are considered, and sensitivity analyses and model evaluation results are provided.
4.1. One Intervention at a Time
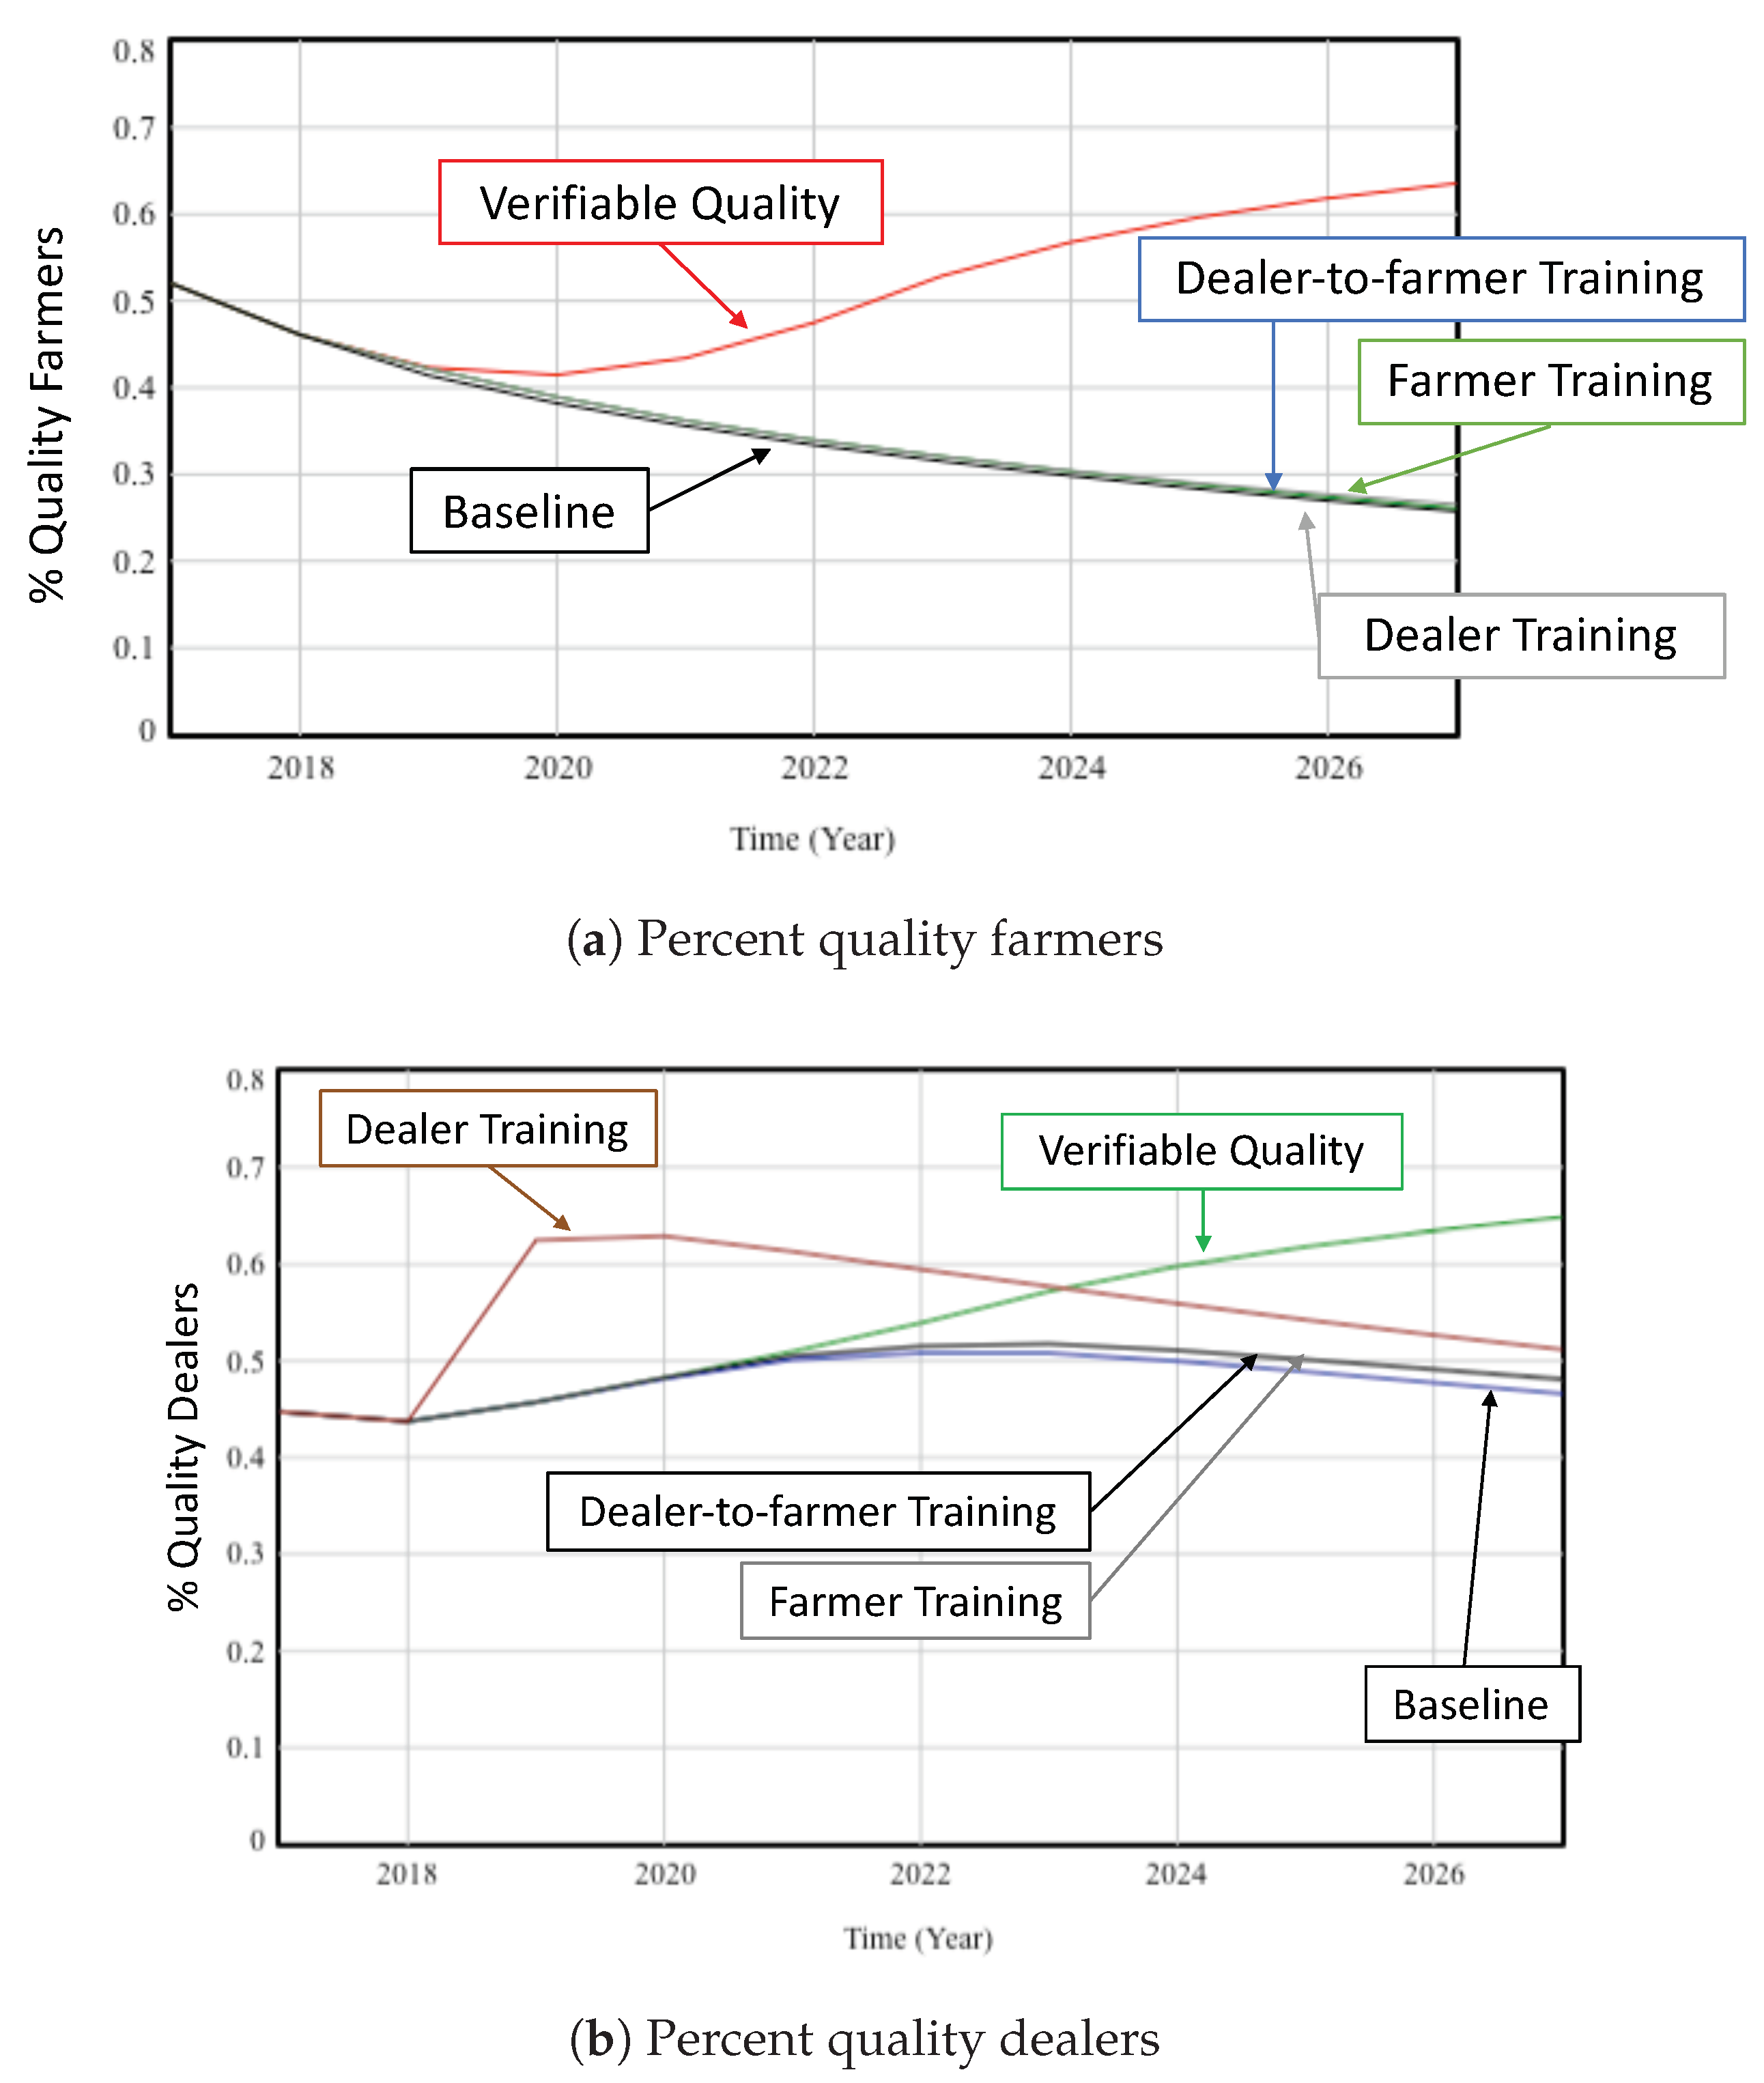
First, consider the results for selecting just one of the interventions described above. Figure 5 shows the results for each of the four individual interventions at the highest (90%) level, with all other interventions at the baseline (10%) level. Figure 5a shows the results for the percentage of quality farmers, while Figure 5b shows the results for the percentage of quality dealers.
The baseline scenario leads to a continuing decrease in the percentage of farmers choosing quality inputs. At baseline levels, the system does not change in the desired direction: toward widespread farmer and dealer adoption. The declining baseline is most likely the result of very low adoption rates, due to the significant barriers to adoption that farmers face (access to seed from nearby dealers, stockouts, labor, and price), combined with a somewhat higher un-adoption rate, due to price and access.
With the exception of verifiable quality, the individual interventions resulted in negligible increases in the overall percentage of quality farmers. While direct dealer training led to an early spike in the percentage of quality dealers, this advantage was not maintained in the long run and had little effect on farmer adoption. These scenarios follow the same decreasing trend as the baseline.
Setting verifiable quality at 90%, on the other hand, resulted in an increase in the percentage of quality dealers and quality farmers compared to the baseline scenario. The initial drop in percent quality farmers is due to the starting percentages being different than the market can actually support (we tested several different starting points, and the results eventually settle into similar trajectories, as discussed in Section 4.4). After about three years, the percentage of quality farmers and dealers begins to rise.
The results suggest that only verifiable quality has much effect, individually, on the trajectory of the system.
4.2. Combinations of Interventions
Next, we consider whether combinations of interventions lead to better results.
Market facilitation approaches tend to use a “light touch” approach that strengthens value chains rather than directly intervening with farmers. Another key feature of market facilitation is intervening at several points in the value chain at once. We therefore examine the impact of various combinations of investments in interventions 1, 2, and 3, which depend on working with dealers and with industry or regulatory bodies, rather than with farmers directly.
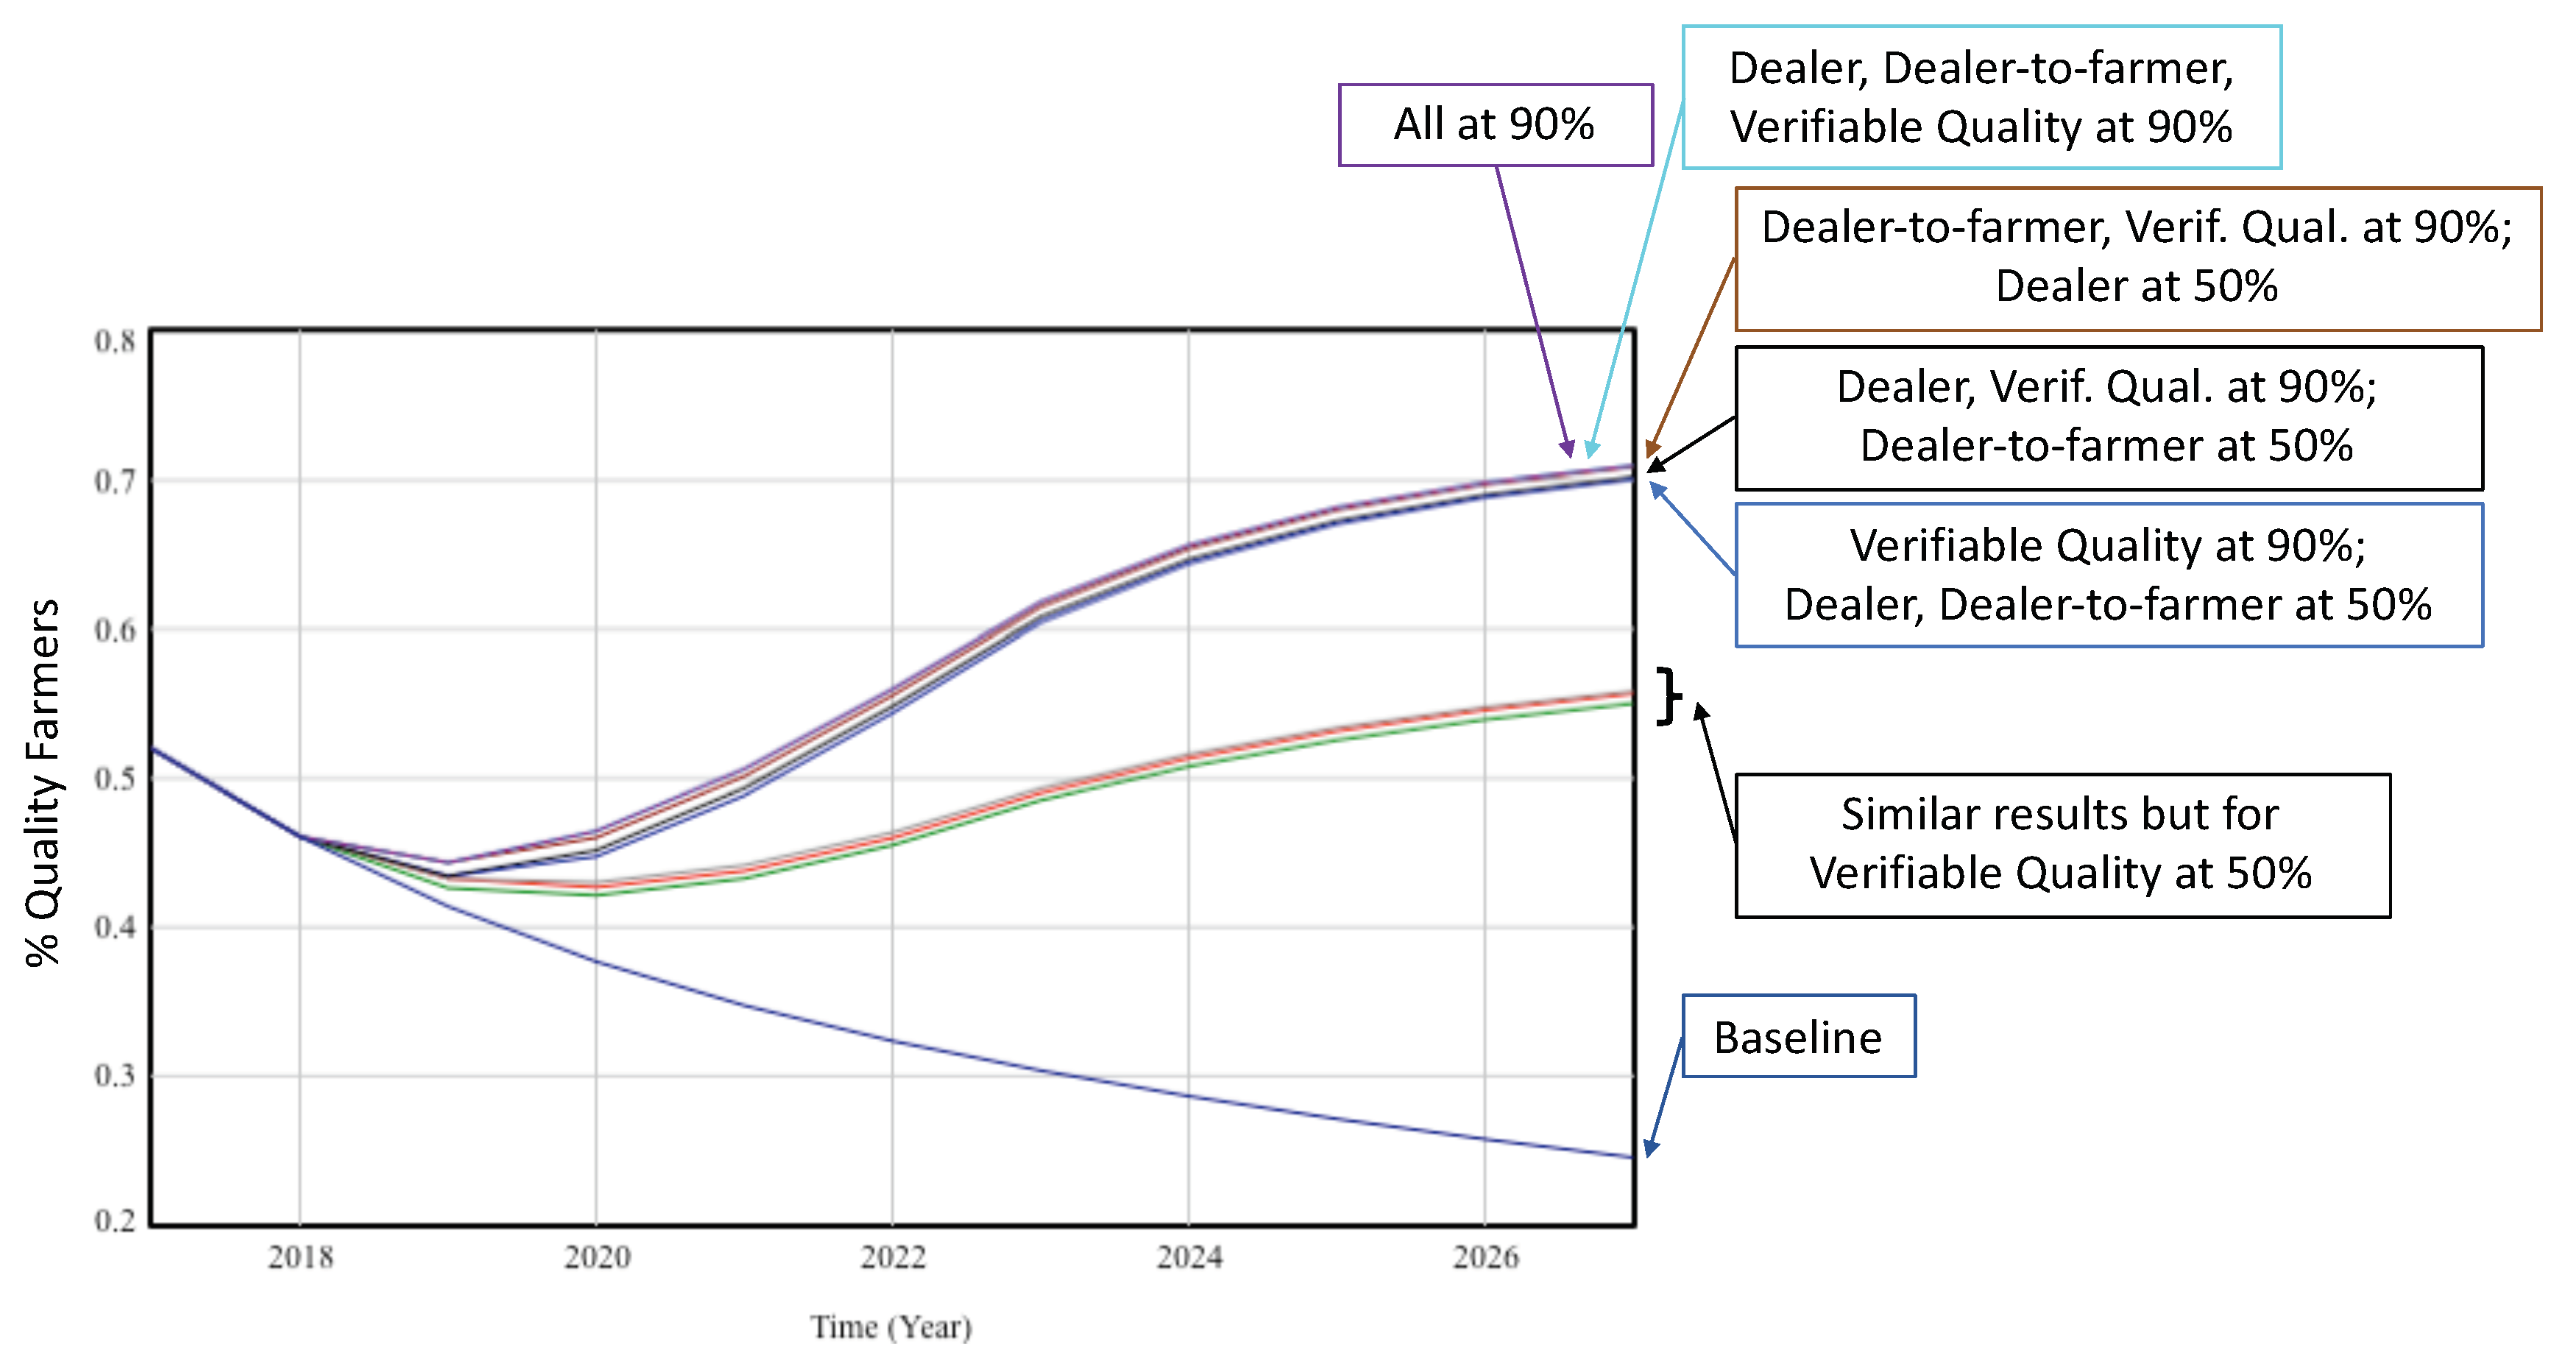
Figure 6 shows the results for all combinations of 50% and 90% investments in the three interventions that reflect a market facilitation approach. The plot also includes a line showing the effects of 90% investments in all the market facilitation interventions plus training 90% of farmers directly.
As might be expected from the results for each individual intervention, investing in verifiable quality is clearly required in order to increase the percentage of quality farmers. When combined with other investments, investing in verifiable quality at the 50% level enables the proportion of quality farmers to reach around 55% after 10 years, with small variations depending on the level of investment in the other interventions. Investing in it at the 90% level achieves around 70% quality farmers after 10 years, again with small variations depending on the level of the other investments. (Recall that verifiable quality alone reached about 63%; see Figure 5a.) A moderate investment in verifiable quality constrains the effects of other interventions: 90% investment in the other two does little to improve results when verifiable quality is only at 50%. The results show that investing in verifiable quality is most critical.
Training farmers directly is a much larger investment since there are more farmers than dealers, and reaching 90% of them is harder than reaching 90% of dealers. The results show that training farmers in addition to large investments in all three other interventions has minimal impact. This is because nearly all farmers are already trained by dealer-to-farmer training, rendering direct training of farmers unnecessary.
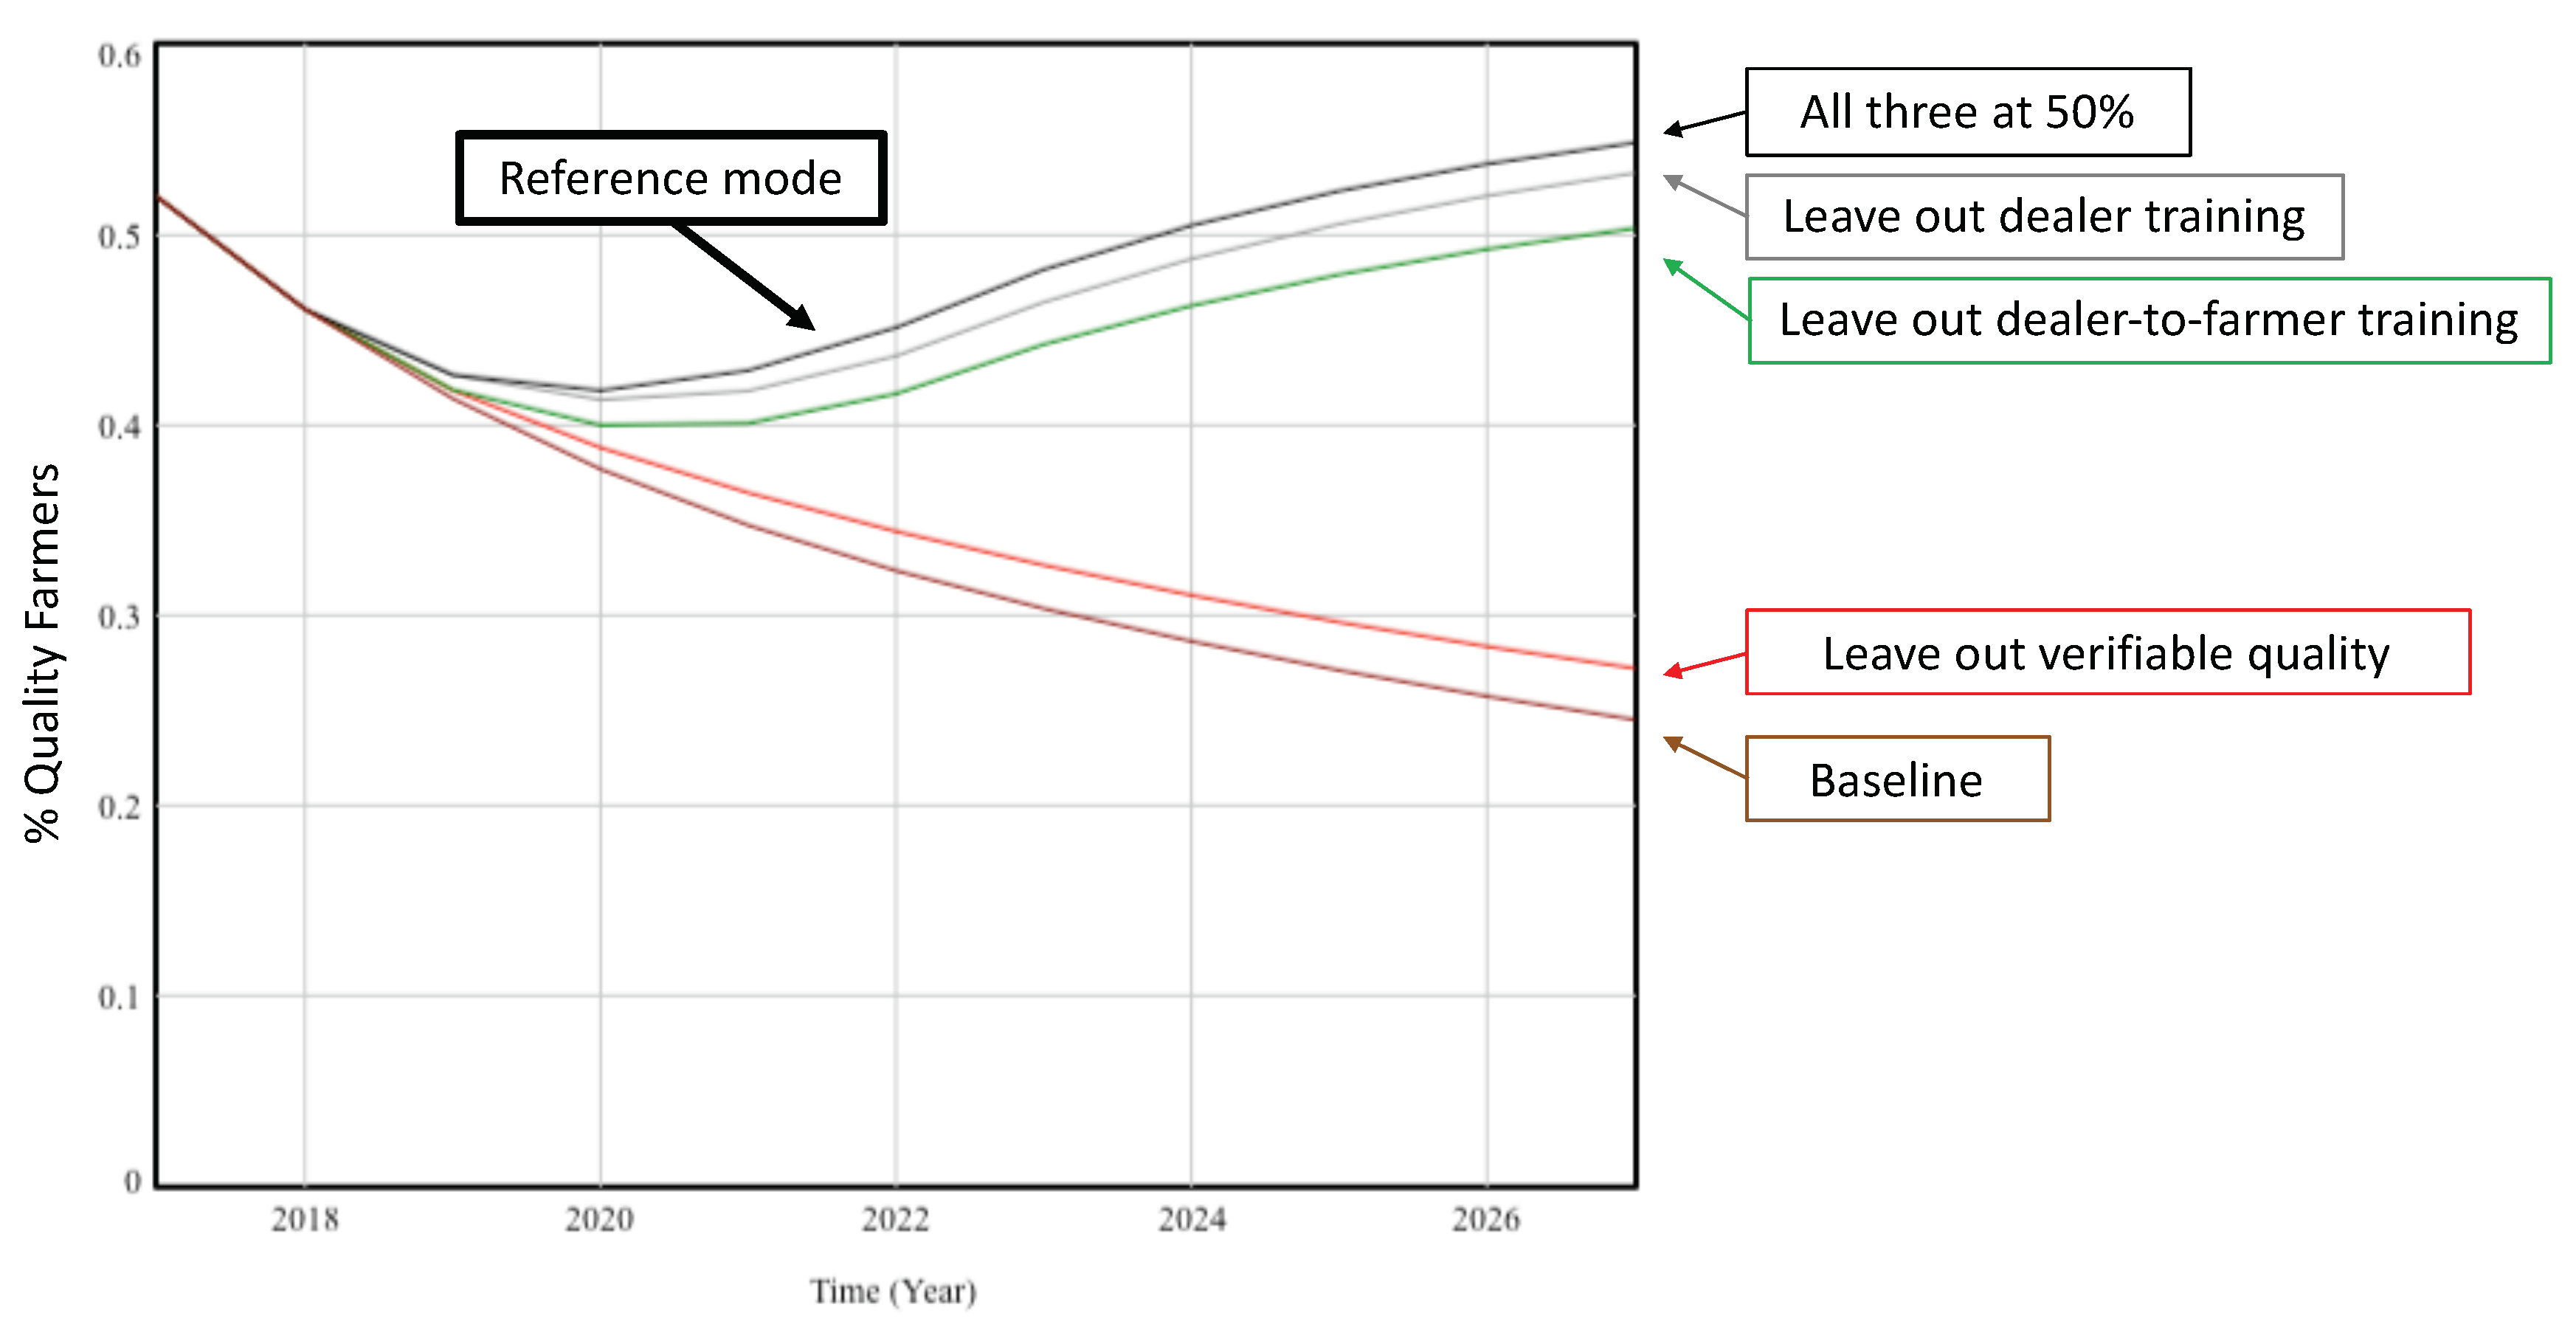
Figure 7 shows the results when one of the three ‘market facilitation’ interventions is left out (left at a 10% level of investment while the other two are at 50%). The results show that, as expected, leaving out verifiable quality leads to poor performance. Leaving out dealer training provides nearly the same results as investing in all three interventions because, when fewer dealers are actively trained, more are educated by other quality dealers through word of mouth (“crowding in”). This takes place over a slightly longer period of time, resulting in the slightly lower performance. The same effect occurs when dealer-to-farmer training is left out: more farmers are educated through crowding in. Of course, this phenomenon requires a sufficiently large population of dealers and/or farmers who have already adopted quality inputs. For scenarios in which the starting percentage of quality dealers or farmers is only 10% (not shown), leaving out the direct education of dealers or farmers, respectively, results in a much slower rising trajectory. We conclude that the education of dealers and/or farmers is most critical when there are few of them in the population.
Investing in a combination of approaches provides more benefit than investing in each one individually. For example, Figure 5a and Figure 6 show that investing only in verifiable quality (at the 90% level) is not as beneficial as investing in verifiable quality at 90% along with the other two interventions at 50%. On the other hand, not all interventions are needed at once: Figure 7 shows that investing in verifiable quality and one other intervention is nearly as good as investing in all three.
In summary, these results show which interventions provide the largest and fastest benefits, and which should be prioritized: verifiable quality is critical, and dealer-to-farmer training provides the next-biggest impact. In addition, they show that investing individually in one intervention at a time has limited potential to improve the system; combinations of interventions at different points in the value chain lead to larger and faster benefits.
4.3. Cost Effectiveness
These results have shown the effectiveness of the interventions, but not their cost-effectiveness. Unfortunately, cost data were not available for any of the interventions. However, we can estimate the relative cost of the training-related interventions by making assumptions about the relative costs of training dealers and farmers.
Two such assumptions were analyzed: (1) One assumption is that the cost is the same for training one dealer or one farmer, which is logical if each training is conducted individually or if group training sessions can be arranged with equal ease for both groups. (2) An alternative assumption is that the cost of training one dealer is the same as the cost of training all the farmers who are customers of that dealer. This assumption is logical if farmers and dealers lack transportation; in this case, trainers would have to travel to the dealer’s area, but could conduct a group training session for all nearby farmers.
To compute the costs of training under each assumption, the total number of farmers and dealers trained by development-supported organizations was computed (recall that these are conducted only in the first five years). The ‘cost’ of such trainings was found using the two assumptions above, then normalized against the baseline. (Recall that the baseline scenario included all interventions at a 10% level.)
Under the first assumption, the cost is similar to the baseline when all four interventions are included because, while the interventions cause more farmers to be trained more quickly, the baseline scenario eventually trains a similar number of farmers. On the other hand, when dealer-to-farmer training is included but direct farmer training is not, the cost is just 12% of the baseline cost. This is because dealers are training farmers at no cost to the donor.
Under the second assumption, the combination of all four interventions at 90% costs 2.2 times the cost of the baseline scenario, largely because more dealers are being trained. Leaving out farmer training but keeping all other interventions at 90% costs approximately two times the baseline scenario. The costs are higher under this second assumption because the cost of training dealers is much higher.
It is important to note that these results ignore the cost of implementing a quality verification system. This cost would, of course, drive up the costs of the interventions significantly. There are likely two major aspects to the cost of such a system: training farmers to use it, which could be accomplished in the same trainings in which farmers learn the value of quality inputs (therefore the cost is accounted for above), and working with seed companies, the government, and others to implement and advertise the system. This cost would likely remain the same across all the interventions which include verifiable quality.
In short, these results suggest that the “market facilitation” interventions—those excluding direct training of farmers—are more cost-effective than those that train farmers directly.
4.4. Sensitivity Analyses
Finally, we tested the sensitivity of the results to several key parameters and assumptions (using a simplified ‘alternative scenario’ approach [32]).
First, we examined the sensitivity of the results to the starting point: to assumptions about the current percentage of quality farmers and quality dealers. The baseline values were 52% and 45%, respectively, based on data from farmer and agrodealer surveys, but these percentages may reflect only districts already targeted by development interventions, and the Uganda-wide percentages may be lower. Therefore, we tested scenarios where each was changed to 10%. Figure 8 shows the results. No matter the starting point, the trajectories have the same trends, but after 10 years result in different percentages of quality farmers. When the initial population of quality dealers is small, the first few years see sharp declines in the number of quality farmers because of limited access to quality inputs, but eventually the trajectories rise again (as long as verifiable quality is included as an intervention). The character of the trajectory and the rank order of the interventions are insensitive to this starting percentage, but the results in the short term are not. This result highlights why it is difficult to predict the short-term results of interventions within the 5-year timeframe of the evaluation of a typical development project. For example, if the percentage of dealers selling quality inputs is artificially high due to development activities, and the market cannot support it, the percentage of quality input dealers may first decline before it begins to rise steadily.
Second, we evaluated the sensitivity of the results to the assumptions about time constraints on the interventions. Recall that we assumed a 5-year time limit on the dealer training and farmer training interventions, but no time limit on the dealer-to-farmer and verifiable quality interventions, reasoning that the latter would continue after the donor’s direct support had ceased. To test whether the lack of time constraint drove the superiority of these two interventions, we re-ran the model and removed the time constraint from all four interventions, so that dealer and farmer training also continued throughout the entire time horizon. The results (not shown) are virtually identical to those with the time constraint, because the two time-constrained interventions are successful in educating most of their respective populations within the first 5 years, and the rate at which they ‘forget’ their education is very low. With a larger ‘forget’ rate, continuing these interventions would be more critical.
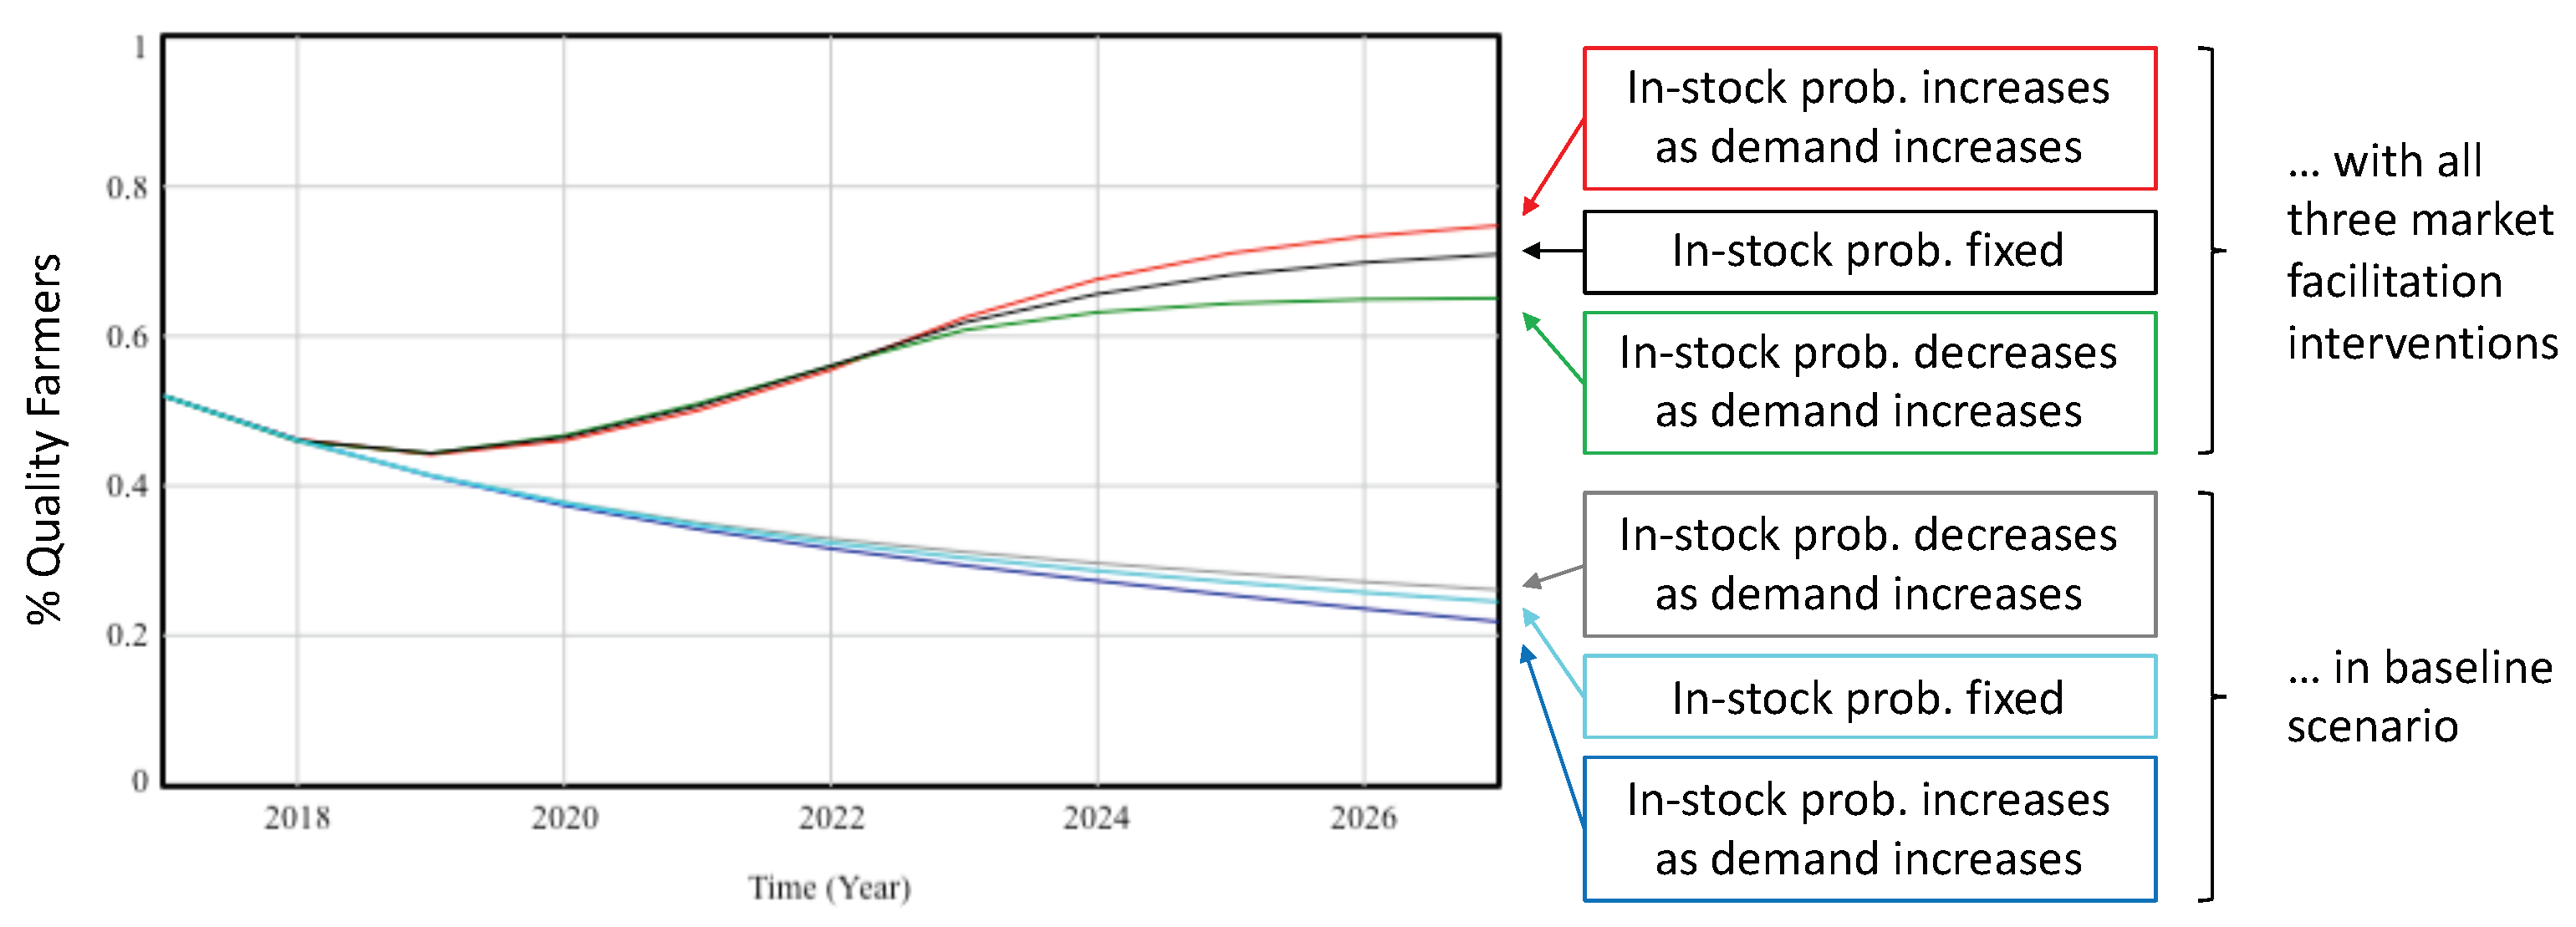
Third, we evaluated how the results would differ if stock-out rates change when the demand changes. As demand increases, suppliers may struggle to meet the rising demand, and stock-out rates could increase. Alternatively, as demand increases, suppliers may see investment in increased production as more worthwhile, and stock-out rates could decrease. To evaluate this potential behavior, we altered the model so the in-stock rate was endogenously computed: the in-stock rate was a function of the current proportion of quality farmers (which represents the demand for quality inputs). Two cases were tested. In the first case, in-stock rates rise (to 0.9) when demand increases and fall (to 0.3) when demand decreases; in the second case, in-stock rates fall (to 0.3) when demand increases and rise (to 0.9) when demand decreases. Results are shown in Figure 9. There are only slight changes to the percentage of quality farmers, in the expected directions.
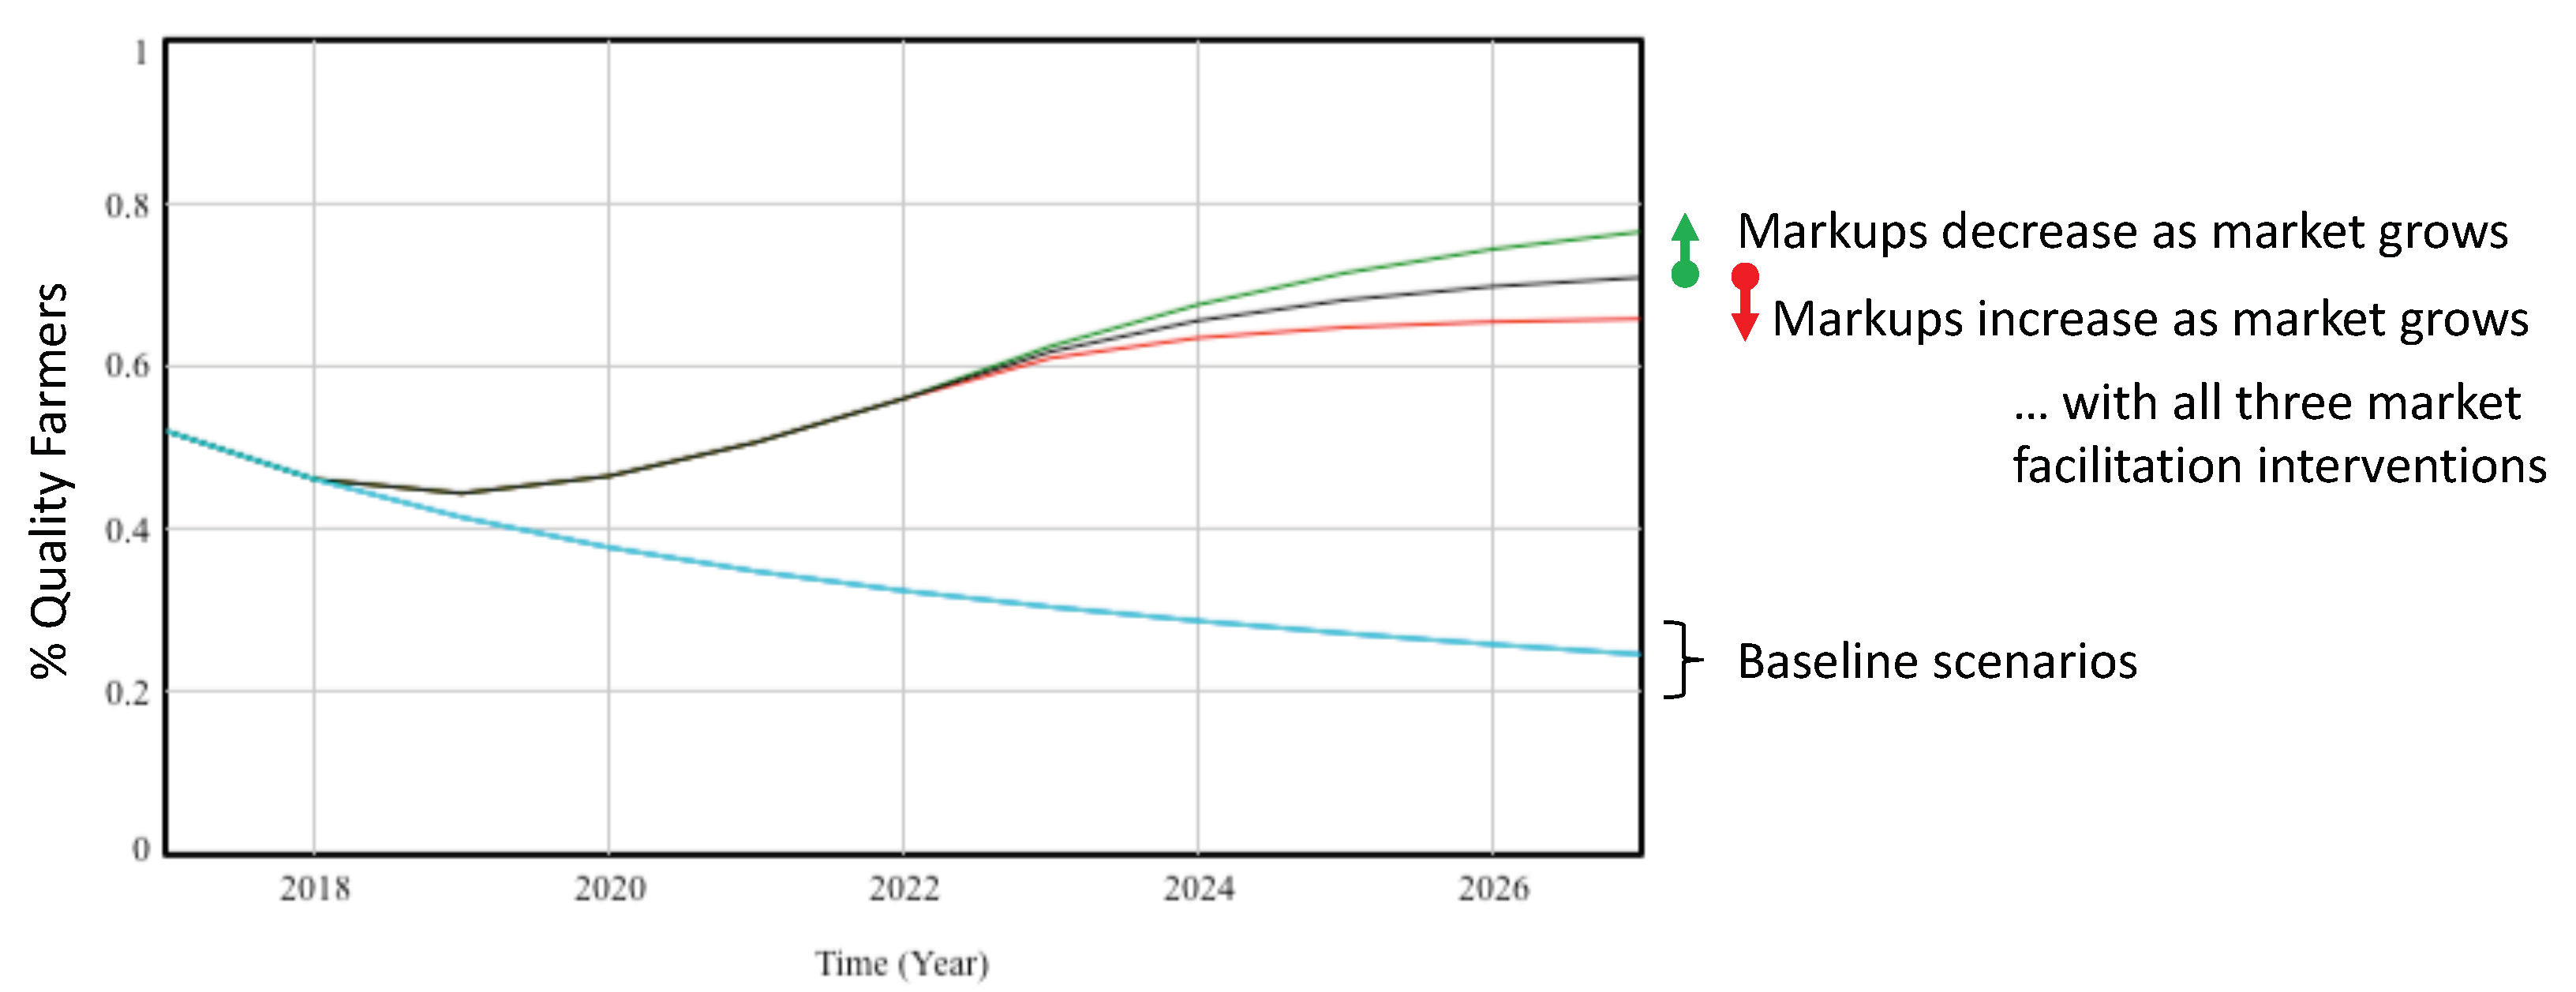
Fourth, we evaluated how the results would change if the price for farmers to purchase quality inputs rose or fell (relative to the price of non-quality seeds) as demand for quality inputs increased. To evaluate this potential behavior, the model was altered so the quality markup was endogenously computed, using a linear function in which either markup rises as the market grows (to a maximum of double the current markup for 100% quality farmers) or falls as the market grows (to a minimum of 5% markup for 100% quality farmers). The results are shown in Figure 10. Unsurprisingly, the number of quality farmers grows when markups decrease with expansion, since the price barrier is lower (and shrinks when markups increase).
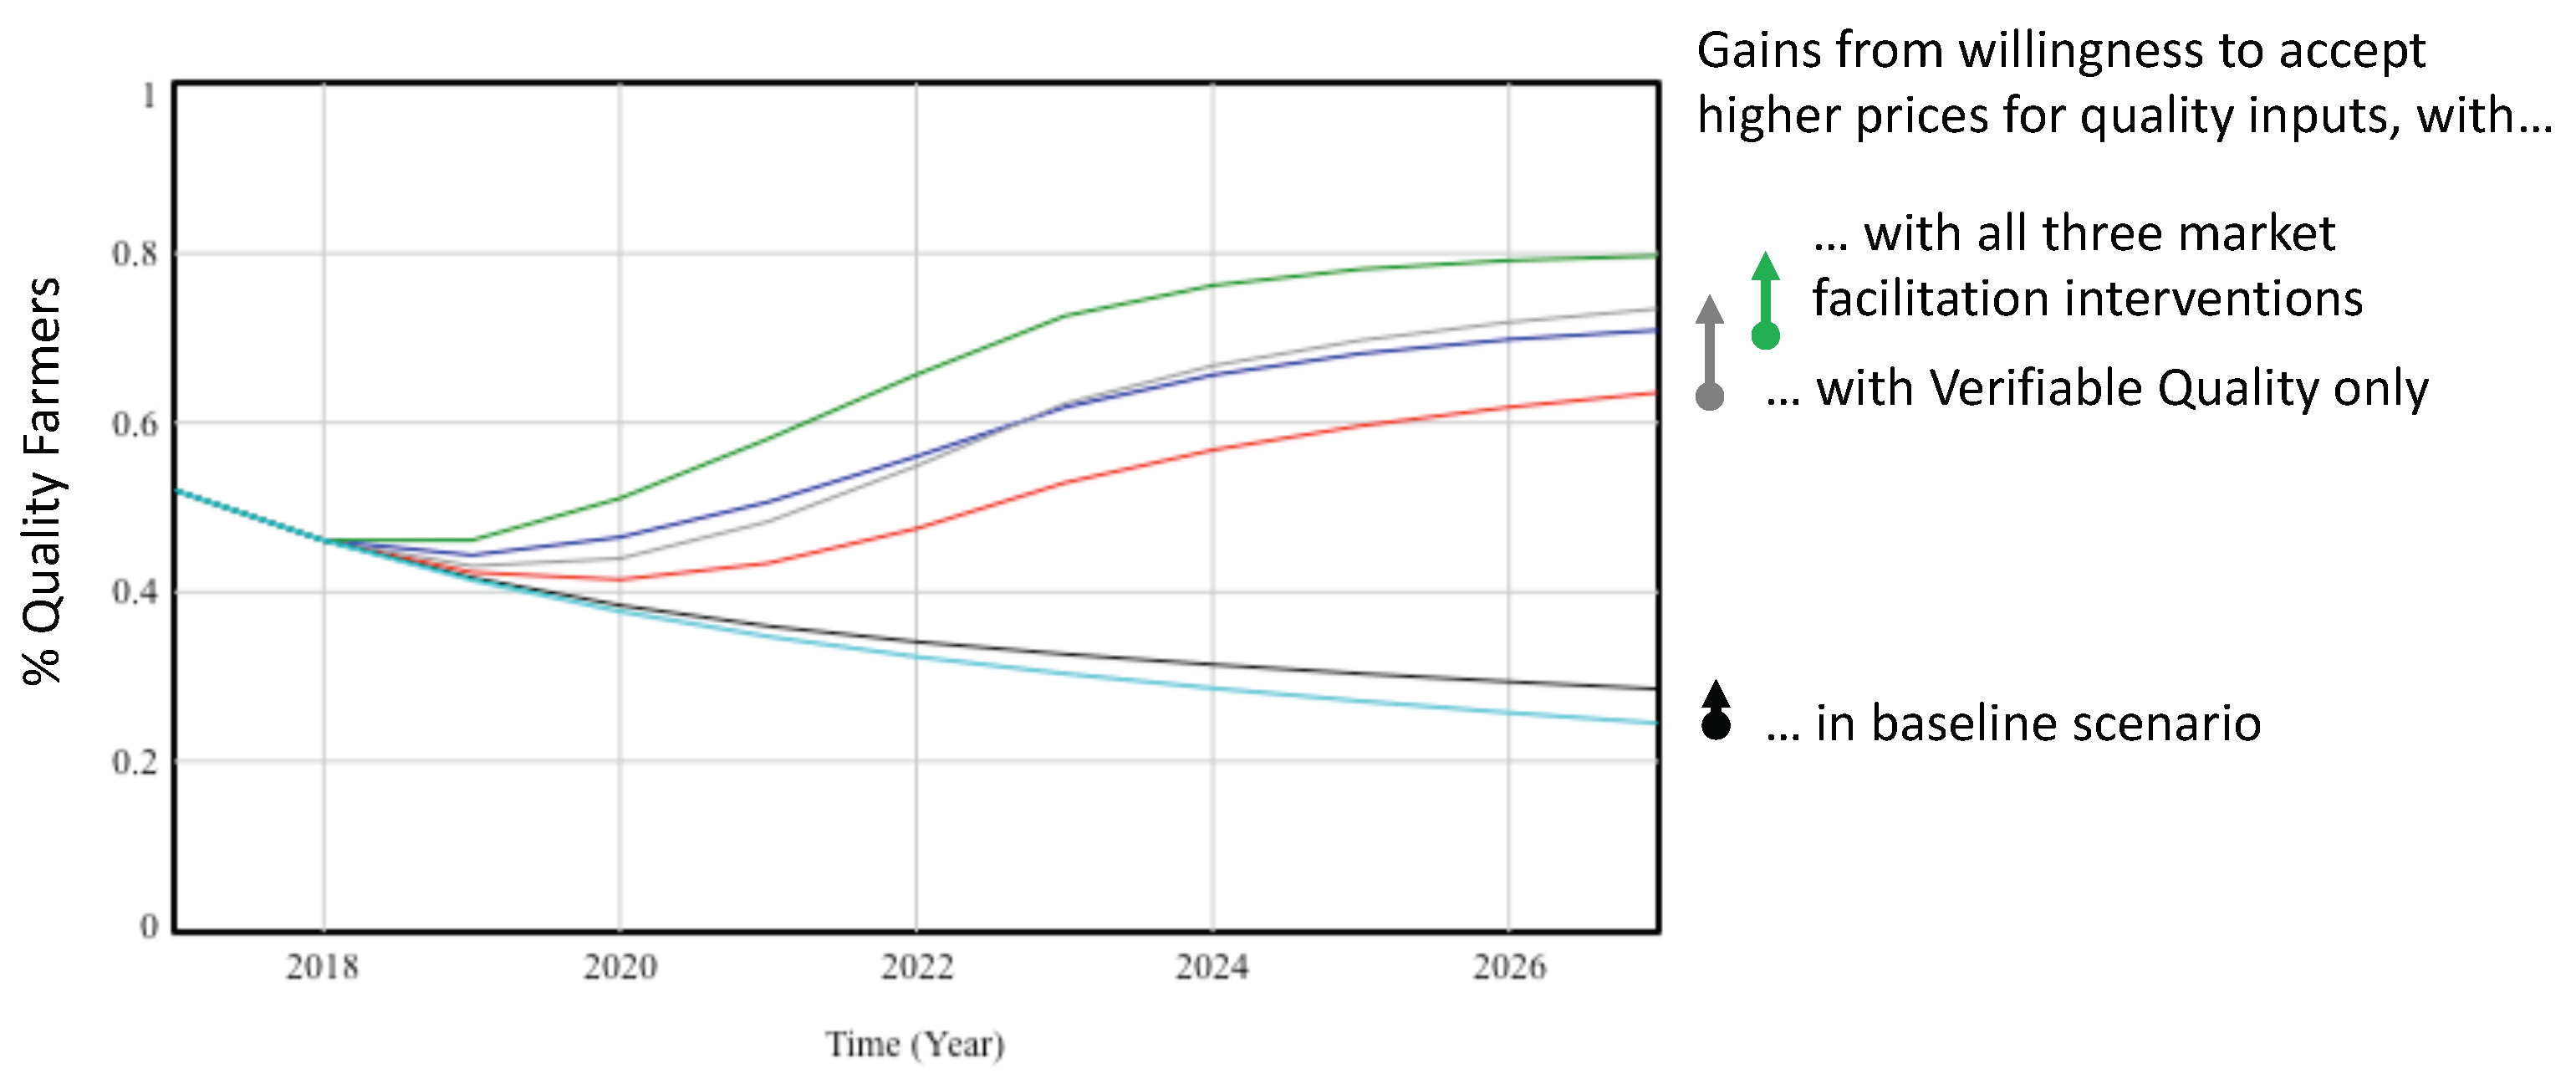
Fifth, we examined the sensitivity of the results to variations in the willingness of farmers and dealers to accept higher prices for quality than for non-quality products. The price is one of the main driving factors in dealer profitability and in whether farmers are willing to invest in quality inputs. Our initial assumptions about the willingness to accept quality input prices were fairly conservative, so we examined how the results would change if the willingness to accept higher prices was greater: specifically, we doubled the percentage of farmers willing to adopt at a given price. Figure 11 shows how the trajectories change. A greater willingness to accept higher prices for quality inputs increases the percentage of quality farmers buying quality inputs, but not by a large amount, and it acts similarly across the interventions. Therefore, we conclude that changes in the willingness to accept higher prices will increase the effectiveness of interventions but are unlikely to change which interventions provide the best leverage for changing the system.
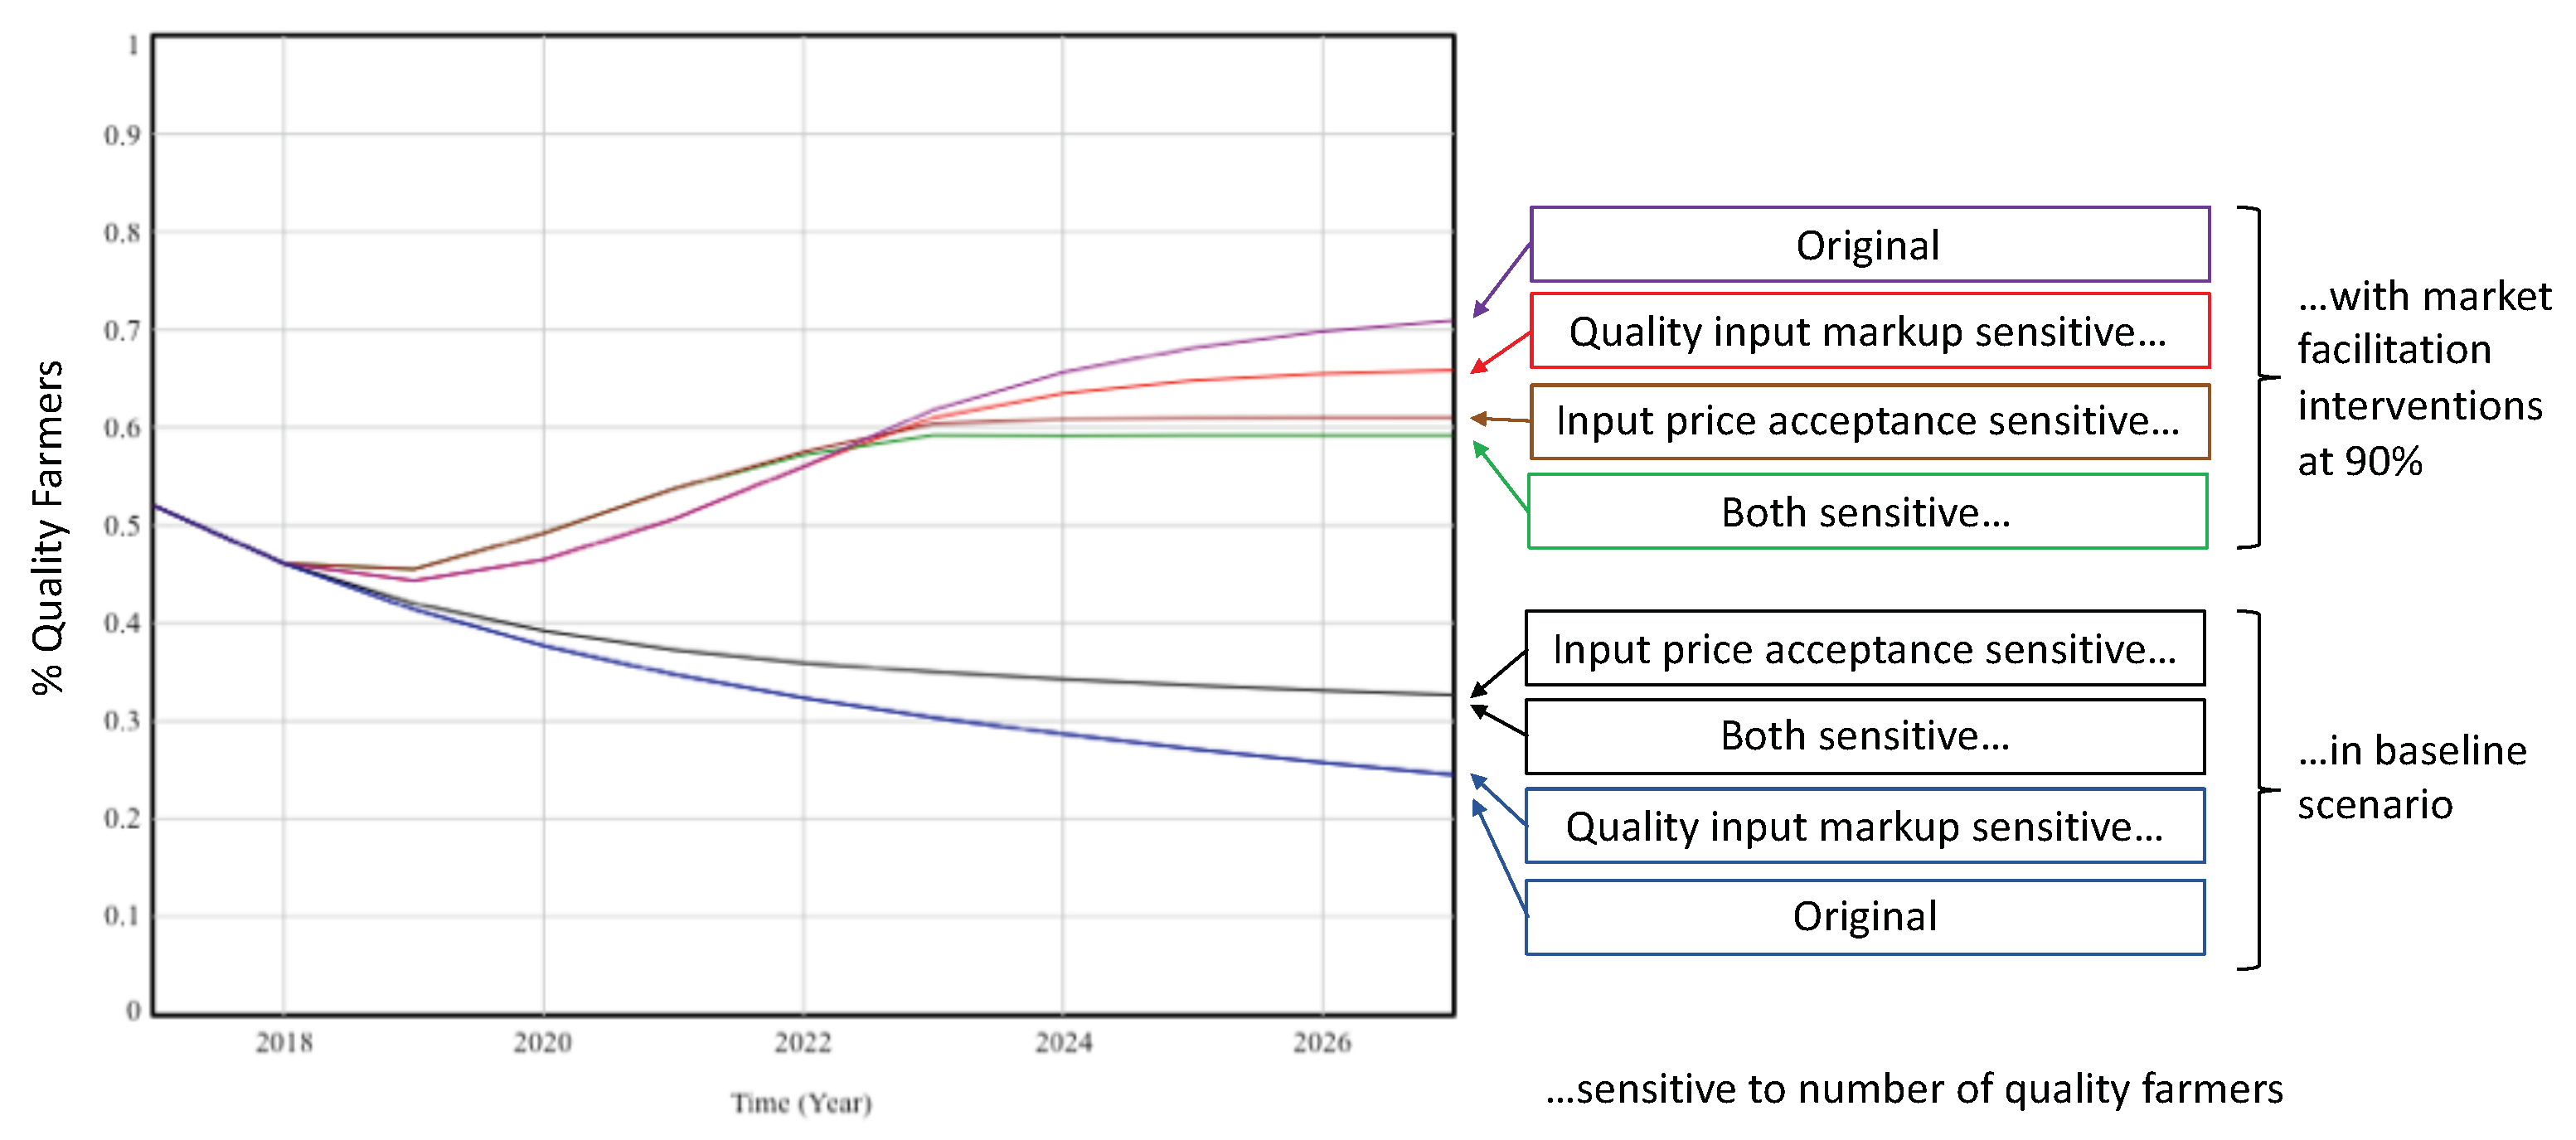
Sixth, we consider the related case in which the willingness of farmers to accept higher prices for quality inputs is not fixed (as in the previous analysis) but is dependent on the percentage of quality farmers. As the percentage of quality farmers increases, a larger supply of quality outputs would be present in the market, potentially leading to a decrease in the output prices and therefore smaller profits for quality farmers. As a result, the price at which farmers are willing to buy quality inputs would decrease (due to the decreasing returns on this investment). To represent this case, the model was modified so that the proportion willing to accept price and the proportion who un-adopt because of price both depend on the percentage of quality farmers. We assume that changes in the acceptable input price are proportional to the change in output prices, and that output prices decrease to 10% of their baseline value when all farmers are quality farmers and increase to twice their baseline value when only 10% of farmers are quality farmers. Figure 12 shows the results for this case along with three others: the original results, those for quality input price markup increasing with the percentage of quality farmers (described earlier in Figure 10), and the case where both input price acceptance and quality input markup depend on the percentage of quality farmers. The results in Figure 12 show that when the input price acceptance depends on the number of quality farmers, i.e., when output prices decrease as supply increases, the gains from development interventions are limited. The growth trajectory is halted when the output prices decrease such that farmers are no longer willing to purchase quality inputs at the available price. These results show that the interaction among input prices, output prices, and the number of quality farmers is important, especially because it could limit the beneficial effects of the interventions we study. Continuing growth requires that output prices remain high enough to make investment in quality inputs worthwhile. Future work should investigate a wider variety of scenarios to identify the conditions that enable or prevent growth.
4.5. Model Evaluation
Next, we evaluate the model using several of the approaches provided by Sterman ([5], pp. 859–861). First, consider the adequacy of the model boundary. This paper has argued that the model endogenously computes the most critical system features, but there are certainly other features that could affect the system dynamics. Most importantly, as discussed in Section 3.5, several variables are held constant which would likely change over the time horizon. We tested how the results would change if three of these variables were computed endogenously (in-stock probability, markup price for quality inputs, and the prices at which farmers will buy quality inputs; see Section 4.4). On the one hand, we found that these dynamics—the latter in particular—potentially limit the beneficial effects of the interventions, but the model and available data are not accurate enough to predict the extent to which they will do so. On the other hand, we found that while the trends changed, the ‘rank order’ of the interventions did not, suggesting that the assumptions are adequate for our current purposes. Future work should investigate these issues further.
Next, the model structure was assessed against existing knowledge of the system. As described in Section 3.1, this model was built and compared to a detailed system map vetted by experts in several successive workshops focused on characterizing the system, suggesting it depicts the system to the best of experts’ knowledge.
Next, we attempted to assess how well the model reproduces the behavior of the system. Given the lack of data on numbers of quality farmers and dealers in Uganda, especially over time, a comprehensive assessment was not feasible. We selected a reference mode corresponding to the districts targeted by recent USAID interventions because data were available from the farmer survey described in Section 3.4. In these districts, USAID’s FTF-VC invested in training dealers, training dealers to train farmers, and supporting quality verification systems. Therefore, the reference mode scenario is represented in the model by a 50% investment in dealer training, dealer-to-farmer training, and verifiable quality. The farmer survey reports adoption rates of about 14% and un-adoption rates of about 13%, so the reference mode behavior should show a relatively flat trajectory: the number of quality farmers should stay roughly constant or rise very slowly. As Figure 7 shows, the number of quality farmers decreases initially (largely due to the slow rollout of quality verification systems), but then increases to the original level and begins to flatten out. This qualitative assessment of the model’s behavior is not definitive but suggests that the model’s behavior is reasonable.
5. Discussion
5.1. Implications for Improving Adoption of Quality Inputs in Uganda
The findings from our model have several implications for designing future interventions in agricultural inputs markets, particularly in Uganda. First and most important, we found that investing in a system that enables seed or input quality to be verified is a necessary condition for widespread adoption of quality inputs. While investment in education enables farmers to make well-informed adoption decisions, farmers may nevertheless be unwilling to purchase quality inputs if their quality cannot be verified. Verifiable quality is critical because its absence limits the total population of farmers who are willing and able to adopt quality inputs (along with the other key constraints of price, accessibility, and labor). Removing these constraints is essential to enabling widespread adoption, and verifiable quality is therefore a critical leverage point in the system.
The other interventions we considered have very limited effect on the system if verifiable quality is not invested in. In combination with verifiable quality, on the other hand, dealer-to-farmer training has more impact than direct training of dealers. The larger impact is likely due to the ability to increase demand for quality inputs from farmers. Dealer education alone does not necessarily impact demand, and dealers selling quality inputs without a corresponding demand from farmers will not change the system. On the other hand, dealer education of farmers can increase demand, in turn encouraging more dealers to sell quality inputs, which may further increase demand. These results assumed similar starting proportions of quality dealers and quality farmers; if the proportion of quality dealers were very low, it might be more important to invest in training them.
The results show that, even with a combination of all interventions at a high (90%) level of investment, growth begins to flatten after about seven years with just over two-thirds of farmers adopting. The precise timing and results should not be considered a prediction, due to the scarcity of data, but the model does clearly show that these interventions alone cannot enable a more widespread adoption of quality inputs. This limitation is due to many other constraints which these four interventions cannot remove. For example, farmers’ profits and their resulting willingness to pay higher prices for quality inputs limits adoption, as our sensitivity analysis showed. Credit provision combined with interventions that support higher prices for quality outputs could address this issue. The other two major constraints limiting adoption are labor and accessibility. Accessibility is limited by the number of dealers choosing to sell quality inputs (which the interventions we studied do influence) and by the stockout probability. Interventions that help dealers avoid stockouts could partially remove this barrier. Labor was reported as a barrier by many farmers in the survey, but its meaning is not well understood, and further research would be required to understand how to eliminate this barrier.
5.2. Implications for Designing Market Facilitation Interventions
The findings from our model also have implications for designing market facilitation interventions in general. In the system we studied, we found that progress is constrained by one critical intervention (verifiable quality), without which the other interventions have very little effect. On the other hand, investing in multiple parts of the value chain simultaneously (setting up a system for verifying quality, educating dealers and farmers, and enabling dealers to train farmers themselves) led to stronger improvements than investing in each individually. Intervening with a ‘light touch’, only through setting up the verification system and supporting dealers to train farmers, is among the most effective combinations of interventions.
Examining the structure of the system, as captured in the model, explains why intervening in multiple parts of the value chain improves the impact of the interventions. Critically, demand from farmers is necessary for dealers to choose to sell quality inputs, and the availability of quality inputs from dealers is necessary for farmers to buy (and create demand for) quality inputs. Therefore, it is necessary to ‘jump-start’ both of these loops: dealers must learn the value of selling quality inputs in order to make them available, and learn how to train farmers to see that value; at the same time, farmers must be able to verify input quality and learn about input value, in order to generate demand. Intervening in multiple parts of the value chain helps to simultaneously remove the interacting constraints on growth of the quality inputs market.
These observations point to an important and more general finding. Investment in multiple parts of the system is required for change. In this system, first, farmers and dealers must learn the value of quality inputs, in order to create demand and enable the growth of the market. However, the effectiveness of these training-oriented interventions is limited by constraints on farmer adoption, including verifiable quality and the others mentioned above. Intervening in both parts of the system simultaneously is necessary to enable growth. These conclusions obviously cannot be used to find leverage points in systems with very different structures. However, extrapolating from these findings, we suggest that key leverage points may be found by looking for the key reinforcing loops that need to be ‘jump-started’ in order to enable widespread change. Likely leverage points are the removal of barriers to growth and the support of positive changes in these loops.
5.3. Limitations
This work has some important limitations. Our system dynamics model is based on the best information available on the Ugandan inputs market, but there are nevertheless significant gaps in the data. In addition, there are important limitations to the scope of the model, as described in Section 3.5. Sensitivity analyses provide some evidence that the trends are insensitive to some of these limitations, but we do not suggest that the model be used to predict the system’s behavior, in terms of actual adoption percentages. Instead, it is useful for identifying more generally the potential impact of each considered leverage point relative to the others, and finding the interventions with the greatest leverage for change.
6. Conclusions
Based on a system dynamics model of the adoption of quality agricultural inputs in Uganda, we found that intervening in multiple parts of the value chain is critical to enabling growth in the market for quality inputs. Specifically, without investing in a system for verifying input quality, the effectiveness of education-oriented interventions, such as training farmers or dealers in the value of quality inputs, is very low. Investing in both training and verifiable quality simultaneously is the best option for enabling adoption and growth.
These findings have implications for markets with conditions similar to those in Uganda. Investing in education, especially education that is passed on to farmers through other private sector actors, is helpful but not sufficient to enable growth. The simultaneous removal of other constraints on farmer adoption—in this case, the ability to verify quality (but also accessibility and potentially others)—is critical in order to enable widespread growth. Therefore, future interventions should consider both sparking adoption and removing existing constraints.
The findings also have implications for market facilitation approaches in general. In this system, we found that light-touch interventions that act through private sector actors were more effective than those that intervened directly with farmers. We also found that a combination of such interventions, working to remove barriers and jump-start positive changes on key reinforcing loops, was more powerful than any single intervention alone. The findings in this particular system therefore demonstrate the potential value of systems approaches to development.
Author Contributions
M.R. and E.G. worked together on the conceptual design of the model; M.R. programmed and ran the model and analyzed the data, with input and collaboration from E.G.; E.G. and M.R. wrote the paper.
Funding
This work was supported via a buy-in from USAID/Uganda into the Higher Education Solutions Network (HESN) Cooperative Agreement between USAID/LAB/HESN and the Massachusetts Institute of Technology (MIT, AID-OAA-A-12-00095) and a subcontract from MIT to George Washington University.
Acknowledgments
The authors would like to acknowledge our sponsors and collaborators at USAID in Uganda and in Washington, DC, USA, as well as our project team including Courtney Blair, Jarrod Goentzel, Jillian Miles, Megan Peters, Katie Picchione, Tim Russell, and Micaela Wiseman. Finally, we thank the anonymous review team (and one reviewer in particular) for helpful comments on this paper.
Conflicts of Interest
The funding sponsors had a very limited role in the design of the study: their interest in the topic inspired its design. They had no role in the analysis or interpretation of the data, the writing of the manuscript, nor in the decision to publish the results.
Appendix A. Model Documentation
This appendix provides more detailed documentation on the assumptions in the system dynamics model.
Appendix A.1. Farmer Adoption
Recall that the farmer adoption portion of the model was shown in Figure 2. The subsections below describe the details for how non-quality farmers become educated, non-quality farmers, then how educated, non-quality farmers become quality inputs farmers, and how they revert back to the earlier states.
Appendix A.1.1. Non-Quality Farmers to Educated, Non-Quality Farmers
The rate at which non-quality farmers become non-quality, educated farmers, or the rate of education, is determined by two factors: the number of farmers formally trained, and the farmers trained through other farmers, represented by the variable number educated through contact.
The first factor, the number of farmers formally trained, is found by MIN(Time-based proportion farmers trained by dev-orgs + Proportion trained by dealers, 0.8) × Number of non-quality farmers. The time based proportion of farmers trained by dev-supported orgs multiplies the time constraint by the proportion of farmers trained by dev-supported orgs. The proportion of farmers trained by dev-supported orgs is varied deliberately to test its efficacy as a development lever. The time constraint limits the length of this intervention to five years (typical for USAID). For the first five years, the function returns value 1. Anytime thereafter, the function returns 0.
Proportion trained by dealers multiplies the proportion of quality dealers successfully training farmers by proportion quality dealers in direct market. The proportion of quality dealers successfully training farmers is varied deliberately to test the efficacy of training dealers to train farmers. The proportion of farmers with quality dealers in direct market is found from the proportion of quality dealers computed in the model and the average number of dealers in a farmer’s market as the chance that one of these accessible dealers sells quality inputs.
The second factor, the number of farmers trained by other farmers, is found by :
Proportion contacts resulting in education was found using the farmer survey. It is the fraction of farmers that are confident in their ability to use quality inputs and report training with a fellow farmer.
Number of contacts with adopters, , is given by the following equation:
Farmer to farmer contact rate is the fraction of farmers that report interacting with fellow farmers in the farmer survey. This variable, multiplied by number of non-quality farmers gives the number of non-quality farmers that interact with any other farmer. The ratio of quality farmers to total farmers provides the chance that this interaction is with a quality farmer.
Appendix A.1.2. Educated, Non-Quality Farmers to Quality Inputs Farmers
The rate at which educated, non-quality farmers become quality inputs farmers, or the rate of adoption, is given by the proportion of farmers willing and able to adopt, multiplied by the number of educated, non-quality farmers.
The proportion willing and able to adopt is determined by the multiplication of four distinct proportions that represent the barriers that farmers must overcome to adopt quality inputs:
First, labor is a barrier to adoption that farmers listed in the farmer survey. Little is known about what farmers mean when they list “labor” as a barrier to adoption. For simulation purposes, we used the simple percentage of farmers that listed this barrier and kept it constant for each run.
Second, verifiable quality is a recent focus of donor interventions. Donors are trying to increase farmer confidence in input quality by setting up a program to enable verification that products are not counterfeit. As discussed in the paper, we tested the sensitivity of the model relative to different levels of this variable, representing the proportion of farmers able to accurately assess the validity of quality inputs. Its value is ramped linearly from 0.1 to the maximum value over five years, to represent the gradual rollout of training and technology over the length of a typical USAID intervention.
Third, accessibility is based on the proportion of farmers with quality dealers in direct market, i.e., accessible to them, and the proportion with in-stock dealer in market: their product is the proportion with access. The proportion with quality dealers in direct market is found from the proportion of quality dealers and the average number of dealers in a farmer’s market as the chance that one of these accessible dealers sells quality inputs. The proportion with in-stock dealer in market is computed similarly, using the in-stock probability found using reports of stock-outs in a 2016 census survey of agrodealers.
Fourth, price is also a barrier to adoption of quality inputs. The proportion willing to accept price is a function that depends on , or the price difference:
Then, the proportion willing to accept price is a linear function such that, if is 5250, 26% will accept the price difference; if is 7128, 0% will accept the price difference, and if is 0, 100% will accept the price difference. We determined this function by comparing the prices of quality and non-quality inputs provided by experts in the field and the percent of farmers that said they would not adopt due to price differences in the farmer survey from two different seasons. We assumed that equal quality and non-quality prices would eliminate the price barrier faced by farmers.
Appendix A.1.3. Farmer Reversion
Farmers can reverse states, moving from quality inputs farmers to non-quality, educated farmers by the rate of un-adoption; and from non-quality, educated farmers to non-quality farmers by the rate of forgetting.
The rate of un-adoption is found by multiplying the number of quality inputs dealers by the proportion who un-adopt. The proportion who un-adopt is the addition of the proportion who un-adopt because of access and other reasons and proportion who un-adopt because of price.
The proportion who un-adopt because of access and other reasons is a function of the proportion with access. One point on this function is found from the farmer survey: it is the percentage of farmers who switched from quality inputs to non-quality inputs over two seasons and listed accessibility or labor (a small number) as the reason. It assumes a piecewise linear function whose slope increases as access gets more limited because farmers who have already adopted might not immediately un-adopt if their local dealers do so, but would instead be willing to travel farther to find a dealer with quality inputs in stock (the farmer survey data shows this case), but when quality dealers become very scarce, they might not be able to find one. The function was fit to the one point provided in the farmer survey, along with the assumption that no farmers would un-adopt due to access when all had access, and that all farmers would un-adopt due to access when none had access. The function is for , for , for , and for , where m is 0.109 and A is 2.1 based on fitting to the data in the farmer survey and the assumptions described above.
Similar to the proportion willing to accept price, the proportion who un-adopt because of price relies on . The proportion who un-adopt because of price is also a linear function such that, if is 5250, 11% will un-adopt due to the price difference; if is 0, 0% will un-adopt, and if is 10,100, 26% will un-adopt. Again, we determined this function by comparing the price differences with the percentage of farmers that listed price as a reason for un-adoption over two different seasons in the farmer survey. We assumed that equal quality and non-quality prices would not cause farmers to un-adopt.
The rate of forgetting is a product of the forgetting proportion and the number of non-quality, educated farmers. The forgetting proportion is an assumed, constant value set at 10%.
Appendix A.2. Dealer Adoption
Recall that the dealer adoption portion of the model was shown in Figure 1. The subsections below describe the details for how non-quality dealers become educated, non-quality dealers, then how educated, non-quality dealers become quality inputs dealers, and how they revert back to the earlier states.
Appendix A.2.1. Non-Quality Dealers to Non-Quality, Educated Dealers
Non-quality dealers are educated through training or by fellow dealers. The variables that determine dealer education operate in the same manner as farmer education. Number educated from contact represents the number of dealers per year that are educated by fellow dealers and number educated from training represents the number of dealers receiving a formal training about quality inputs. Number educated from training uses the same time constraint discussed above to simulate the typical length of a USAID intervention. This is multiplied by the proportion of dealers trained, which is set at different values to test different levels of investment in training, and number of non-quality dealers to determine the number of dealers educated from interventions.
Number educated from contact relies on the variables proportion successfully educated from contact and number exposed to quality dealers. The proportion successfully educated from contact is assumed to be slightly higher than the proportion contacts resulting in education used in the farmer adoption loop, since no data was available for dealers.
Number exposed to quality dealers, , is given by the following equation:
Dealer to dealer contact rate is an assumed value of 10%. This variable, multiplied by number of non-quality dealers gives the number of non-quality dealers that interact with any other dealer. The ratio of quality dealers to total dealers provides the chance that this interaction is with a quality dealer.
Appendix A.2.2. Non-Quality, Educated Dealers to Quality Inputs Dealers
The rate at which non-quality, educated dealers become quality input dealers is governed by the proportion adopting. The proportion adopting is a function that depends on , the ratio of the profit to be made by quality dealers to that made by non-quality dealers:
Then, the proportion adopting is a piecewise linear function such that, if , 0% will adopt; if , 10% will adopt; if , 30% will adopt; and if , 80% will adopt. These assumptions were made arbitrarily to represent a reasonable set of dealer decisions. Some small number of dealers will adopt early, before profits are clearly higher for quality products, based on training or a recognition of their potential value, and in order to generate demand among their farmer customers. They may, of course, later un-adopt if the profits do not materialize. Many dealers will adopt when profits become clearly higher for quality inputs, but profits must be much larger before most dealers will do so.
Appendix A.2.3. Dealer Reversion
Quality inputs dealers become non-quality, educated dealers by the rate of un-adoption. This rate is the multiplication of the number of current quality inputs dealers by the proportion un-adopting. The proportion un-adopting depends on . It is a linear function such that, if , 0% will un-adopt; if , 10% will un-adopt; if , 30% will un-adopt; and if , 80% will un-adopt. These values were assumed, based on the idea that higher profits for non-quality products will cause more dealers to un-adopt, but if profits are equal, few dealers who have already adopted will un-adopt.
Non-quality, educated dealers become non-quality dealers at the rate of forgetting, which is simply the number of non-quality educated dealers multiplied by the same forgetting proportion mentioned above in the farmer loop.
Appendix A.3. Profit Loops
Recall that the profit portion of the model was shown in Figure 3. There are two profit loops that represent the average business performance of non-quality dealers and quality dealers, respectively. Comparisons of non-quality and quality business performance are used elsewhere in the model, as discussed above. As mentioned earlier, these loops represent average performance by assuming that each dealer has the same market share and operates under the same market conditions as the other dealers in their respective group. The quality profit loop and non-quality profit loop operate under the same logic but rely on different inputs.
For both loops, profit is determined by :
where i is the number of quality input dealers in the quality profit loop or the number of non-quality input dealers (including those educated and un-educated) in the non-quality profit loop.
The total sales revenue equals the total number of units sold multiplied by the selling price. The number of units sold is given by :
The visit rate and purchase rate are constant variables assumed to be 1, for simplicity of interpretation (since no data were available).
Appendix A.4. Assumptions and Limitations
The model contains a number of assumptions that could be modified should more data become available. It would be particularly useful to gather data about dealer behavior, since many assumptions in the dealer portion of the model are based on data from farmers. In addition, the sensitivity to price may be critical, and there is very limited data available about prices and about demand rates, which influence prices. Future work could update the model as further data becomes available.
The lack of data also limited our ability to conduct a formal model evaluation process. Here, we provide a few more details on how the behavior of the model corresponds to behavior observed (qualitatively) in reality. As discussed earlier, the reference mode (with 50% investment in all interventions except farmer training) should have a relatively flat trajectory to correspond with the roughly equal adoption (14%) and unadoption (13%) rates found from the farmer survey. The trajectory predicted by the model initially falls (due in part to the slow rollout of quality verification systems) but then rises again to a level similar to the starting point and begins to flatten out. The behavior stems from a variety of factors, but the most important are those governing adoption and un-adoption by farmers. The adoption rate of about 14% is the product of about 40% willingness to accept price, 88% who do not view labor as a barrier, 50% who can verify quality (after the 5-year rollout), and 76% with access to in-stock quality inputs. The un-adoption rate of about 12% is the sum of 9% who un-adopt because of price and 3% who un-adopt because of access. The baseline scenario (with only 10% investment in each intervention), on the other hand, has a decreasing trajectory. This results from an initial adoption rate of only 3%, due to the smaller 10% proportion who can verify quality, combined with the lack of intervention in other parts of the system. Data on dealers, from a Uganda-wide survey, indicates that this decreasing baseline behavior is reasonable: it suggests a declining number of dealers selling quality seed (based on their diminishing strong relationships with suppliers [18]), lending some credence to the behavior of our baseline scenario.
References
- Campbell, R. A Framework for Inclusive Market System Development; Technical Report; U.S. Agency for International Development: Washington, DC, USA, 2014.
- U.S. Agency for International Development (USAID). Local Systems: A Framework for Supporting Sustained Development; Technical Report; U.S. Agency for International Development: Washington, DC, USA, 2014.
- Osorio-Cortes, L.; Jenal, M. Monitoring and Measuring Change in Market Systems: Rethinking the Current Paradigm; Technical Report; SEEP: Arlington, VA, USA, 2013. [Google Scholar]
- Dunn, E.G.; Gomes, R.; Pulido, T. Monitoring Facilitation Activities; Technical Report Feb-Mar; U.S. Agency for International Development: Washington, DC, USA, 2014.
- Sterman, J.D. Business Dynamics: Systems Thinking and Modeling for a Complex World; Number HD30. 2 S7835 2000; McGraw-Hill: Boston, MA, USA, 2000. [Google Scholar]
- Newman, J.; Velasco, M.A.; Martín, L.; Fantini, A.M. A System Dynamics Approach to Monitoring and Evaluation at the country level: An application to the Evaluation of Malaria-control Programs in Bolivia. In Proceedings of the Fifth Biennial World Bank Conference on Evaluation and Development, Washington, DC, USA, 15–16 July 2003; pp. 1–16. [Google Scholar]
- McRoberts, K.C.; Nicholson, C.F.; Blake, R.W.; Tucker, T.W.; Padilla, G.D. Group model building to assess rural dairy cooperative feasibility in South-Central Mexico. Int. Food Agribus. Manag. Rev. 2013, 16, 55–98. [Google Scholar]
- Parsons, D.; Nicholson, C.F. Assessing policy options for agricultural livestock development: A case study of Mexico’s sheep sector. Cogent Food Agric. 2017, 3, 1–20. [Google Scholar] [CrossRef]
- Armendáriz, V.; Armenia, S.; Atzori, A.S. Systemic Analysis of Food Supply and Distribution Systems in City-Region Systems—An Examination of FAO’s Policy Guidelines towards Sustainable Agri-Food Systems. Agriculture 2016, 6, 65. [Google Scholar] [CrossRef]
- Shi, T.; Gill, R. Developing effective policies for the sustainable development of ecological agriculture in China: The case study of Jinshan. Ecol. Econ. 2005, 53, 223–246. [Google Scholar] [CrossRef]
- Walters, J.P.; Archer, D.W.; Sassenrath, G.F.; Hendrickson, J.R.; Hanson, J.D.; Halloran, J.M.; Vadas, P.; Alarcon, V.J. Exploring agricultural production systems and their fundamental components with system dynamics modelling. Ecol. Model. 2016, 333, 51–65. [Google Scholar] [CrossRef]
- Brzezina, N.; Kopainsky, B.; Mathijs, E. Can Organic Farming Reduce Vulnerabilities and Enhance the Resilience of the European Food System? A Critical Assessment Using System Dynamics Structural Thinking Tools. Sustainability 2016, 8, 971. [Google Scholar] [CrossRef]
- U.S. Agency for International Development (USAID). Feed the Future Multi-Year Strategy, Uganda, 2011–2015; Technical Report; U.S. Agency for International Development: Washington, DC, USA, 2011.
- DIMAT Project. Value Chain Analysis of the Bean Sub-Sector in Uganda; Technical Report; Government of Uganda, Kilimo Trust, EPSEDEC & APSEDEC: Kampala, Uganda, 2012.
- Dalipagic, I.; Elepu, G. Agricultural Value Chain Analysis in Northern Uganda: Maize, Rice, Groundnut, Sunflower and Sesame; Technical Report March; Action Against Hunger (ACF) International: Paris, France, 2014. [Google Scholar]
- U.S. Agency for International Development (USAID). Uganda Coffee Supply Value Chain Analysis; Technical Report; U.S. Agency for International Development: Washington, DC, USA, 2010.
- Market System Monitoring Activity. Market System Maps v2.0; Technical Report; MIT Humanitarian Supply Chain Lab: Cambridge, MA, USA, 2017. [Google Scholar]
- Market System Monitoring Activity. Inputs Subsystem Study; Technical Report; MIT Humanitarian Supply Chain Lab: Cambridge, MA, USA, 2017. [Google Scholar]
- Ashour, M.; Billings, L.; Gilligan, D.; Karachiwalla, N. Evaluation of the Impact of E-Verification on Counterfeit Agricultural Inputs and Technology Adoption in Uganda; Technical Report; U.S. Agency for International Development and International Food Policy Research Institute: Washington, DC, USA, 2015. [Google Scholar]
- Otieno, G.; Noriega, I.L.; Reynolds, T.W. Smallholder Access to Quality and Diverse Seed in Uganda: Implications for Food Security; Technical Report; Bioversity International: Italy, Rome, 2015. [Google Scholar]
- Bold, T.; Kaizzi, K.C.; Svensson, J.; Yanagizawa-Drott, D. Lemon technologies and adoption: Measurement, theory and evidence from agricultural markets in Uganda. Q. J. Econ. 2017, 132, 1055–1100. [Google Scholar] [CrossRef]
- Ashour, M.; Billings, L.; Gilligan, D.; Hoel, J.B.; Karachiwalla, N. Do Beliefs about Agricultural Inputs Counterfeiting Correspond with Actual Rates of Counterfeiting? Evidence from Uganda; Technical Report; International Food Policy Research Institute: Washington, DC, USA, 2016. [Google Scholar]
- Derwisch, S.; Morone, P.; Tröger, K.; Kopainsky, B. Investigating the drivers of innovation diffusion in a low income country context. The case of adoption of improved maize seed in Malawi. Futures 2016, 81, 161–175. [Google Scholar] [CrossRef]
- Gonçalves, P.; Rice, J. Investigating the Causes of Seed Returns in the Agribusiness Industry. In Proceedings of the 36th Hawaii International Conference on System Sciences, Honolulu, HI, USA, 6–9 January 2003; pp. 1–10. [Google Scholar]
- Bass, F.M. A new product growth model for consumer durables. Manag. Sci. 1969, 15, 215–227. [Google Scholar] [CrossRef]
- Mahajan, V.; Muller, E.; Bass, F.M. New Product Diffusion Models in Marketing: A review and directions for research. J. Mark. 1990, 54, 1–26. [Google Scholar] [CrossRef]
- Akinola, A.A. An application of Bass’s model in the analysis of diffusion of cocoa-spraying chemicals among Nigerian cocoa farmers. J. Agric. Econ. 1986, 37, 395–404. [Google Scholar] [CrossRef]
- Nippard, D.; Hitchins, R.; Elliott, D. Adopt-Adapt-Expand-Respond: A Framework for Managing and Measuring Systemic Change Processes Briefing Paper; Technical Report; The Springfield Centre: Durham, UK, 2014. [Google Scholar]
- Peters, M.; Goentzel, J.; Gralla, E. A system mapping framework for facilitative development approaches. 2018. under review. [Google Scholar]
- Meadows, D.H.; Robinson, J.M. The Electronic Oracle: Computer Models and Social Decisions; John Wiley and Sons: Chichester, UK, 1985. [Google Scholar]
- Market System Monitoring Activity. Quality-Differentiated Pricing among Agricultural Traders in Uganda; Technical Report; MIT Humanitarian Supply Chain Lab: Cambridge, MA, USA, 2017. [Google Scholar]
- Ford, A.; Ford, F.A. Modeling the Environment: An Introduction to System Dynamics Models of Environmental Systems; Island Press: Washington, DC, USA, 1999. [Google Scholar]
Figure 1.
Portion of the system dynamics model that represents dealers adopting or un-adopting quality inputs. The variable shown in red represents one of the interventions tested in this paper. Variables in <brackets> are computed elsewhere in the model.
Figure 1.
Portion of the system dynamics model that represents dealers adopting or un-adopting quality inputs. The variable shown in red represents one of the interventions tested in this paper. Variables in <brackets> are computed elsewhere in the model.

Figure 2.
Portion of the system dynamics model that represents farmers adopting or un-adopting quality inputs. The variables shown in red represent the interventions tested in this paper. Those shown in <brackets> are computed elsewhere in the model.
Figure 2.
Portion of the system dynamics model that represents farmers adopting or un-adopting quality inputs. The variables shown in red represent the interventions tested in this paper. Those shown in <brackets> are computed elsewhere in the model.

Figure 3.
Portion of the system dynamics model that represents dealer profitability.

Figure 4.
The model boundary diagram shows which variables are endogenous and exogenous (fixed), and highlights some of the important system dynamics that are not represented in the model.
Figure 4.
The model boundary diagram shows which variables are endogenous and exogenous (fixed), and highlights some of the important system dynamics that are not represented in the model.

Figure 5.
Results for all four interventions invested in individually at the 90% level.

Figure 6.
Results (in terms of quality farmer percentage) for ‘market facilitation’ interventions: combinations of training dealers, training dealers to train farmers, and e-verification.
Figure 6.
Results (in terms of quality farmer percentage) for ‘market facilitation’ interventions: combinations of training dealers, training dealers to train farmers, and e-verification.

Figure 7.
Results (in terms of quality farmer percentage) for the three ’market facilitation’ interventions at 50%, when one at a time is left out (at 10%). The reference mode, with these three interventions at 50%, is highlighted (see Section 4.5).
Figure 7.
Results (in terms of quality farmer percentage) for the three ’market facilitation’ interventions at 50%, when one at a time is left out (at 10%). The reference mode, with these three interventions at 50%, is highlighted (see Section 4.5).

Figure 8.
Sensitivity of results to variations in the starting percentage of quality farmers.

Figure 9.
Sensitivity of results to endogenously computed in-stock probability: either increasing or decreasing as demand increases.
Figure 9.
Sensitivity of results to endogenously computed in-stock probability: either increasing or decreasing as demand increases.

Figure 10.
Sensitivity of results to endogenously computed quality input markup: either increasing or decreasing as demand increases.
Figure 10.
Sensitivity of results to endogenously computed quality input markup: either increasing or decreasing as demand increases.

Figure 11.
Sensitivity of results to variations in willingness to accept quality input prices.

Figure 12.
Results when both input and output prices depend on the percentage of quality farmers.

© 2018 by the authors. Licensee MDPI, Basel, Switzerland. This article is an open access article distributed under the terms and conditions of the Creative Commons Attribution (CC BY) license (http://creativecommons.org/licenses/by/4.0/).
Share and Cite
MDPI and ACS Style
Reinker, M.; Gralla, E. A System Dynamics Model of the Adoption of Improved Agricultural Inputs in Uganda, with Insights for Systems Approaches to Development. Systems 2018, 6, 31. https://0-doi-org.brum.beds.ac.uk/10.3390/systems6030031
AMA Style
Reinker M, Gralla E. A System Dynamics Model of the Adoption of Improved Agricultural Inputs in Uganda, with Insights for Systems Approaches to Development. Systems. 2018; 6(3):31. https://0-doi-org.brum.beds.ac.uk/10.3390/systems6030031
Chicago/Turabian StyleReinker, Madison, and Erica Gralla. 2018. "A System Dynamics Model of the Adoption of Improved Agricultural Inputs in Uganda, with Insights for Systems Approaches to Development" Systems 6, no. 3: 31. https://0-doi-org.brum.beds.ac.uk/10.3390/systems6030031
Note that from the first issue of 2016, this journal uses article numbers instead of page numbers. See further details here.