Validation of Various Filters and Sampling Parameters for a COP Analysis


1
University Center for Orthopedic and Trauma Surgery, Faculty of Medicine Carl Gustav Carus, Technische Universität Dresden, 01307 Dresden, Germany
2
Institute of Electrical Systems and Energy Logistics, Faculty of Mechanical Engineering, Electrical and Energy Systems, Brandenburg University of Technology Cottbus-Senftenberg, 01968 Senftenberg, Germany
3
SLG Prüf- und Zertifizierungs GmbH, Medical Devices and Laser Safety, 09232 Hartmannsdorf, Germany
*
Author to whom correspondence should be addressed.
Technologies 2018, 6(2), 56; https://0-doi-org.brum.beds.ac.uk/10.3390/technologies6020056
Submission received: 16 April 2018
/
Revised: 10 June 2018
/
Accepted: 11 June 2018
/
Published: 13 June 2018
(This article belongs to the Special Issue Medical Imaging & Image Processing Ⅱ)
Abstract
:The center of pressure (CoP) is one of the most utilized quantitative measurements describing postural competency. Due to the complexity and biological variability of postural regulatory systems, a myriad of different methods and parameters have been established describing the CoP trajectory. Besides procedural variables, such as foot position, visual condition, and sampling duration, the method of data collection itself has a relevant effect on the result of the measurement. Furthermore, different methods for recording the measured data have been developed, which differ regarding the filters, frequencies, and test durations used. The goal of this study was the methodical comparison of various filters, measurement frequencies, and measurement duration, with respect to their effects on the CoP trajectory. Based on the results presented, we demonstrate that the Butterworth and Bessel filters can be recommended for analysis of CoP data, and at the very least, a second-order filter should be chosen for the process. For assessment of the cutoff frequency, a technical pendulum was used to show that a cutoff frequency of 13 Hz provided reliable data and it can be inferred that a 100 Hz sampling rate would be the minimum requirement.
Keywords:
COP; force plate; AMTI; Kistler; center of pressure; postural control; balance; filter; Butterworth; sampling duration effect1. Introduction
Postural control is an innate ability of human motion and an elementary requirement for maintaining an upright stance in static and dynamic processes. Based on the inherent complexity and close interaction between sensory perception and motor output, the full quantification of postural control capacity can prove to be challenging. For this reason, a plethora of different qualitative and quantitative methods for the evaluation of postural stability have been created, and in particular in the context of different pathologies [1]. The reported assessments for these methods claim to allow evaluation of the qualitative ability to balance, and therefore to identify patients or patient groups prone to falling, low back pain and to shed light on postural pathomechanisms.
One of the most frequently utilized quantitative processes is the evaluation of parameters to describe CoP (Center of Pressure) excursions. In an upright, bipedal stance, the CoP is the central point for all ground-reactionary forces (in the transverse plane), and measurements of CoP are made using an objective force plate over a defined time interval [2,3]. Tracking the trajectory of the CoP enables an indirect quantification of postural competence based on the body’s sway during quiet stance. The mean amplitude is a measure of instability. The sway path reflects the regulatory activity of the standing motor function. Furthermore, pathological features (e.g., abnormal patterns) of the CoP courses can be analyzed and evaluated [4]. Frequent fluctuations of the CoP indicate larger instabilities in the center of mass, which must be compensated by increasingly corrective actions, such as horizontal ground-reactionary forces, generated by muscular efforts [5,6].
Due to the complexity and extreme biological variability of postural regulation systems, a myriad of different methods and parameters have been established, describing the trajectory of the CoP. Besides procedural variables, such as foot position, visual condition, and sampling duration [7], the method of data collection itself has a significant effect on the result of the measurement.
Furthermore, a variety of different methods for recording the measured data have been developed and which differ, especially regarding the filters, frequencies, and test durations used. In this way, an abundance of scientific publications using differing procedures and varying qualities of procedural documentation can be found. A database search on “PubMed” returns 206 results for “CoP Trajectory” (March 2018). The studies presented in Table 1 have been compiled with a view to clarifying the variety of methods used and do not claim to be complete. An important aspect here is also that some authors do not describe their methodology sufficiently carefully enough and so often do not provide adequate information for filtering. This circumstance has made it difficult to trace and compare studies. The consequence of these discrepancies is that direct comparison of these studies is only possible to a limited extent or sometimes not at all [8,9].
Regarding the question as to if and how the CoP data from a force plate should be filtered, there are a great number of opinions, which is also reflected in the numerous measurement procedures utilized. A gold standard for data collection of the CoP does not yet exist, although it is the subject of discussion on various scientific forums. The need for standardization in the field of static posturography was first discussed in 1981 at the Symposium of Posturography in Kyoto [19].
There is a consensus only in the idea that CoP data values should be processed using a low pass filter and, with respect to the choice of filters, the Butterworth filter has shown to be the most popular.
Filtering the raw data is necessary because the measurement signal accumulates a “murmur” through the chain of measurements. This murmur becomes apparent graphically as a multitude of high-frequency signals with small amplitudes, which overlap with the actual measurement signal. State of the art are digital software filters that incorporate the properties of various electronic signal filters. Many filters and possible variations of filter parameters are available, which can be used depending on the area of activity and signal quality.
The filter types examined in this study are all frequency filters, all of which are notable for their characteristic behaviors. In the context of the CoP trajectory a multitude of filters are available, which differ due to their characteristics. The most commonly used filters in scientific context and provided by many evaluation programs are primarily the Butterworth filter and other Bessel and Chebyshev filters.
The first-order Butterworth filter resembles a resistor capacitor element (analogous to the combination of a resistor and a capacitor in electrical circuit technology) and is notable for a passband insulation of n × 20 dB per frequency decade, where n equals the order of the filter. The dampening at the cutoff frequency amounts to 3 dB, meaning the signal would be decayed by 1/√2 ≈ 0.707 times the original signal.
The Bessel filter, on the other hand, demonstrates optimal behavior, meaning it has a wave shape where its frequency component seems to lie within the filter’s passband (albeit with a delay), and is nearly unchanged upon exit. Thereby the amplitude curve does not bend as sharply as with the Butterworth or Chebyshev filters. The Chebyshev filter, in contrast, is designed specifically for a sharp bend in the frequency response at the cutoff frequency. Due to differing mechanisms, each filter has its own way in the processing of data.
For all filter types it can be assumed that the damping of a lowpass Filter of nth order above the cut-off frequency increases with n − 20 dB/decade. This has a direct effect on the frequencies above the frequency limit and influences the surrounding frequencies below the cut-off frequency, since a non-ideal system must also be assumed for mathematical filtering. The effect on the “good frequencies” below the cut-off frequency decreases with increasing order.
Over the course of the presented study it should be shown how Butterworth, Bessel and Chebyshev filter and sampling frequency affect the results of a posturographic measurement and in particular the CoP analysis using force plates. In addition to their suitability, the filters’ individual characteristics were compared. Using the measuring devices on the market, the effect of these filters was shown over the conventional spectrum of sampling frequency, and over a large bandwidth of possible cutoff frequencies and orders available for the filters.
2. Materials and Methods
2.1. Instruments
Over the course of this study, the CoP trajectory was recorded with a force measuring system from the company Kistler (Type 9260AA), based on a rectangular placement of force sensors in each corner.
Resolving the weight force working orthogonally to the platform (z-axis), this system also records the component sheer forces working horizontally in the x- and y-directions, from which the CoP can be determined. In this process, the measuring system uses a sampling frequency of 1 kHz. Recording of the raw data and the derivation of the CoP (i.e., the CoP trajectory), was done using LabVIEW software of National Instruments (Austin, TX, USA).
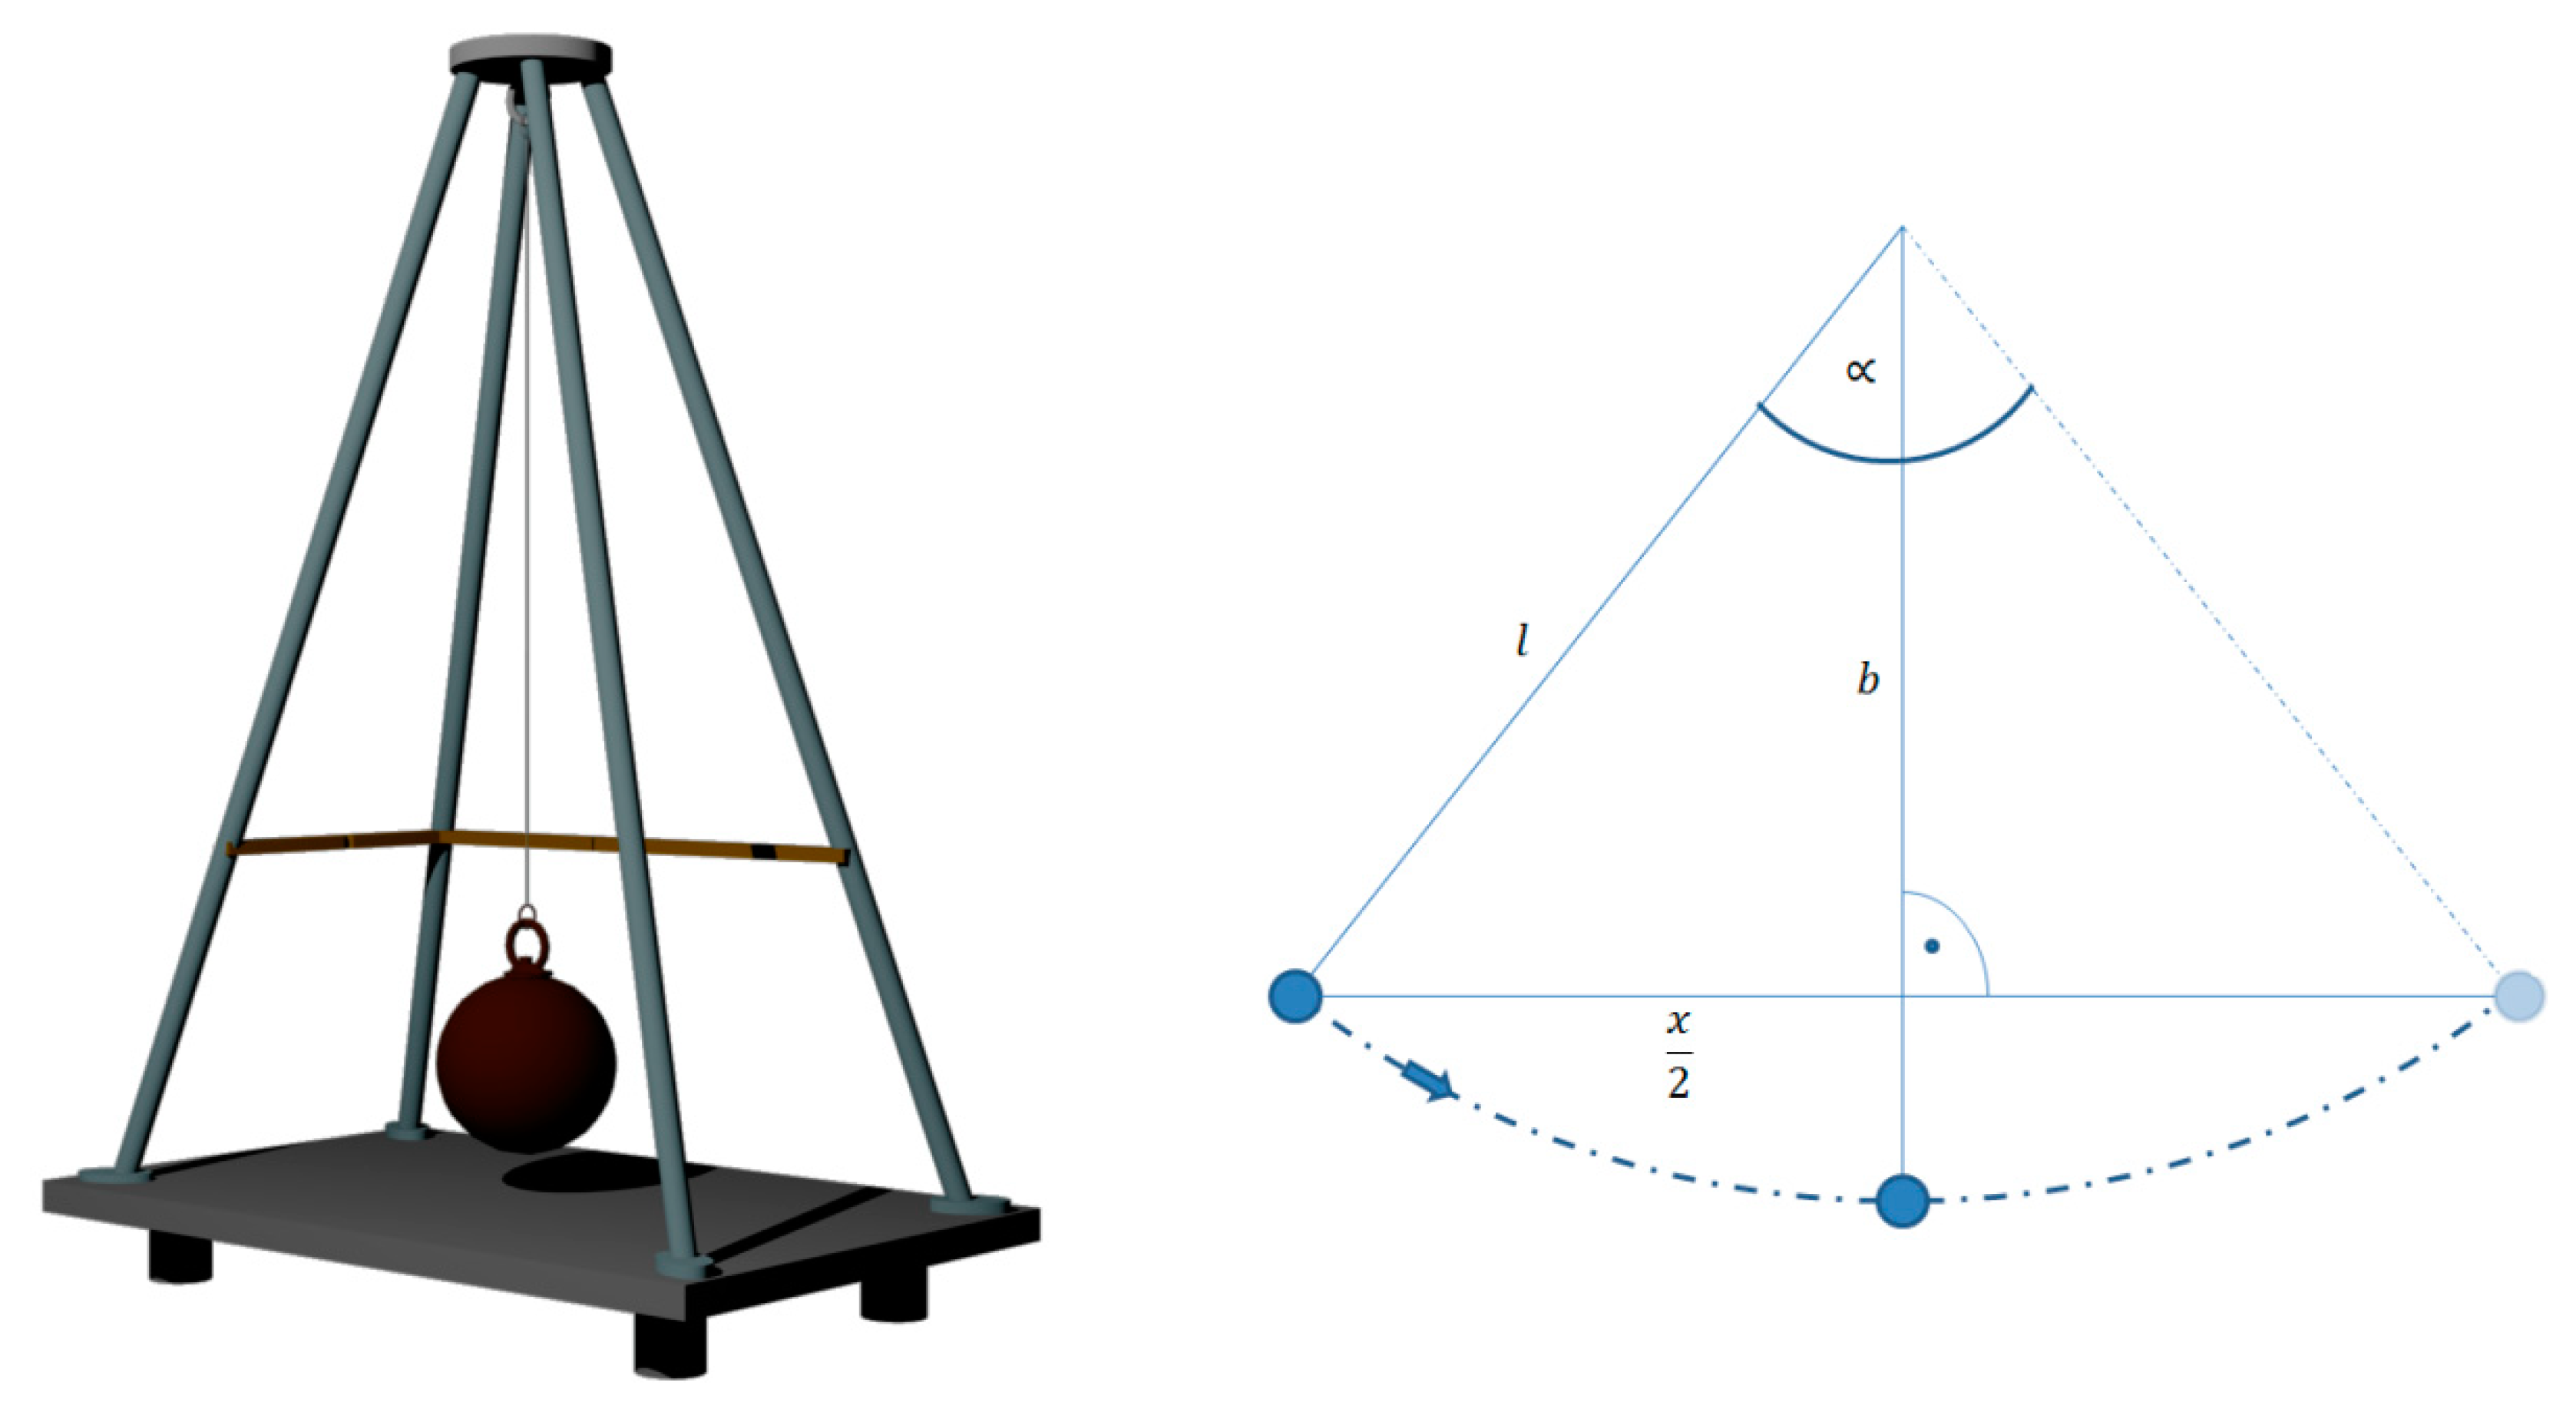
For reliable simulation of a one-dimensional, time-constant reference movement, a mechanical pendulum was used (see Koltermann et al. [20]). This apparatus (see Figure 1, left) generates a dynamic, reproducible CoP track over the time used for the analysis. The pendulum was designed in the form of a four-legged tripod with a lead ball of 25 kg fastened to the pendulum with a steel cable. Since the mass of the cable was negligible compared to that of the weight, it was excluded from further analysis. The reference values for the determination of measurement accuracy could hence, be determined using the length of the pendulum, the initial angle of release, and the sampling time, in accordance with Figure 1 (see [20]). In this study, the pendulum had a length of 97 cm.
With a sufficiently short sampling time (<15 s), the dampening of the pendulum system is negligible, so that over the course of the study the sampling time was limited to 10 s [20]. This measurement time is shorter than the 30–60 s measurement times in clinical routine. This results on the one hand from the technical conditions of the pendulum which receives an extrinsic excitation and then absorbs energy via the measuring time. On the other hand, human subjects receive an intrinsic stimulation, e.g., breathing which is continuous [8,10,13]. Furthermore, the measurement time is not decisive for the design of a filter because the filter works on frequency-dependent variables and is therefore not time-dependent. The sampling rate, on the other hand, plays a role here as it is a calculation variable for the digital filters. The measurement was repeated 20 times to generate reliable results. The theoretical expected value of the swing distance lay at 400 cm and a deviation of max. 2% was deemed legitimate for the physical system.
2.2. Method
To analyze the filters and their properties, the following experiments were conducted. Recording and interpretation of the data took place using LabVIEW software. Any values were recorded with a maximum sampling rate of 1 kHz. To achieve statistical significance, the measurement with the technical pendulum was repeated 20 times. The primary data was recorded and saved in its raw format and subsequently, the following steps were undertaken to process the data for investigation:
1. Effect of different filter systems on the CoP signal
For graphical representation of the effect of first- to third-order Butterworth filters, the CoP signal was analyzed using a Power Density Analysis in the frequency range.
For evaluation and processing of the raw data, different filter systems (Chebyshev, Bessel, and Butterworth) were examined at varying cutoff frequencies (1–50 Hz), orders (1st order–3rd order and 7th order), and sampling frequencies.
2. Effect of the sampling rate on the CoP signal
The raw signal was scaled starting at 1 kHz in 100 Hz steps up to 300 Hz.
Under 300 Hz, the steps had to be appropriately reduced, to enable a better representation of irregularities in the process. To guarantee comparability, the filters were run with a cutoff frequency of 12 Hz and with second-order filtering.
3. Results
3.1. Representation of the Effect of the 1st Order–3rd Order Order Butterworth Filters
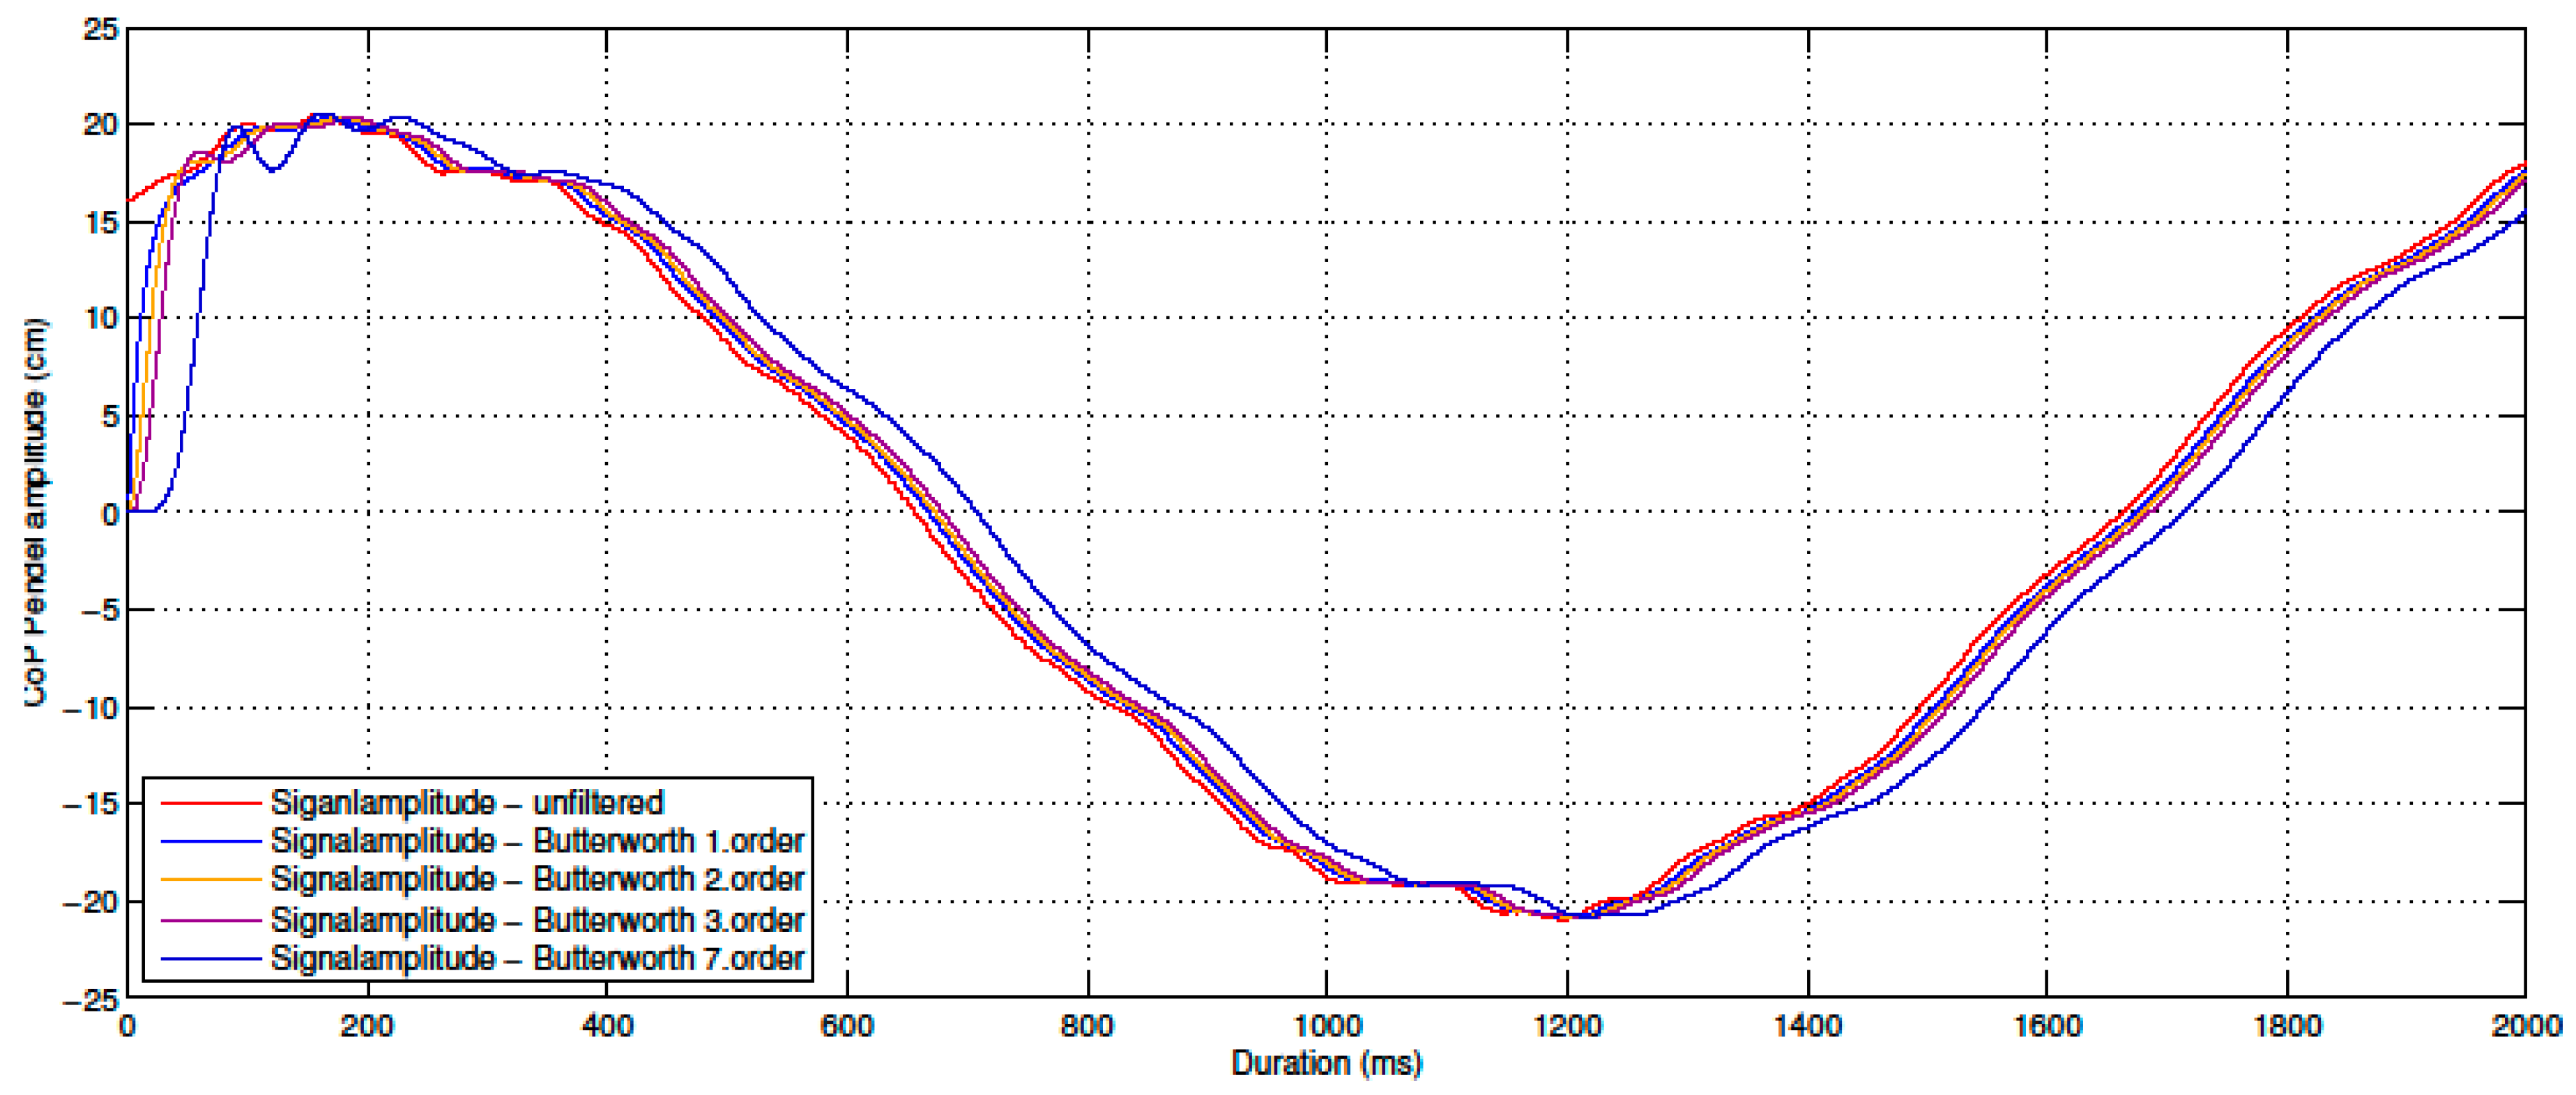
In Figure 2, the effects of the different Butterworth filters were juxtaposed based on their orders and a fixed cut off frequency of 13 Hz. The shape of the curve represents the trajectory of the x-component of a CoP track over a sampling time of 2000 ms.
In Figure 2, a noticeable discrepancy between the original, unfiltered trajectory and the processed signal trajectories can be identified, and the difference is greatest within the first 50 ms. This “loading time” is typically observed with mathematical filters and furthermore, it is apparent that with increasing order, a larger phase shift is produced in comparison to the original signal.
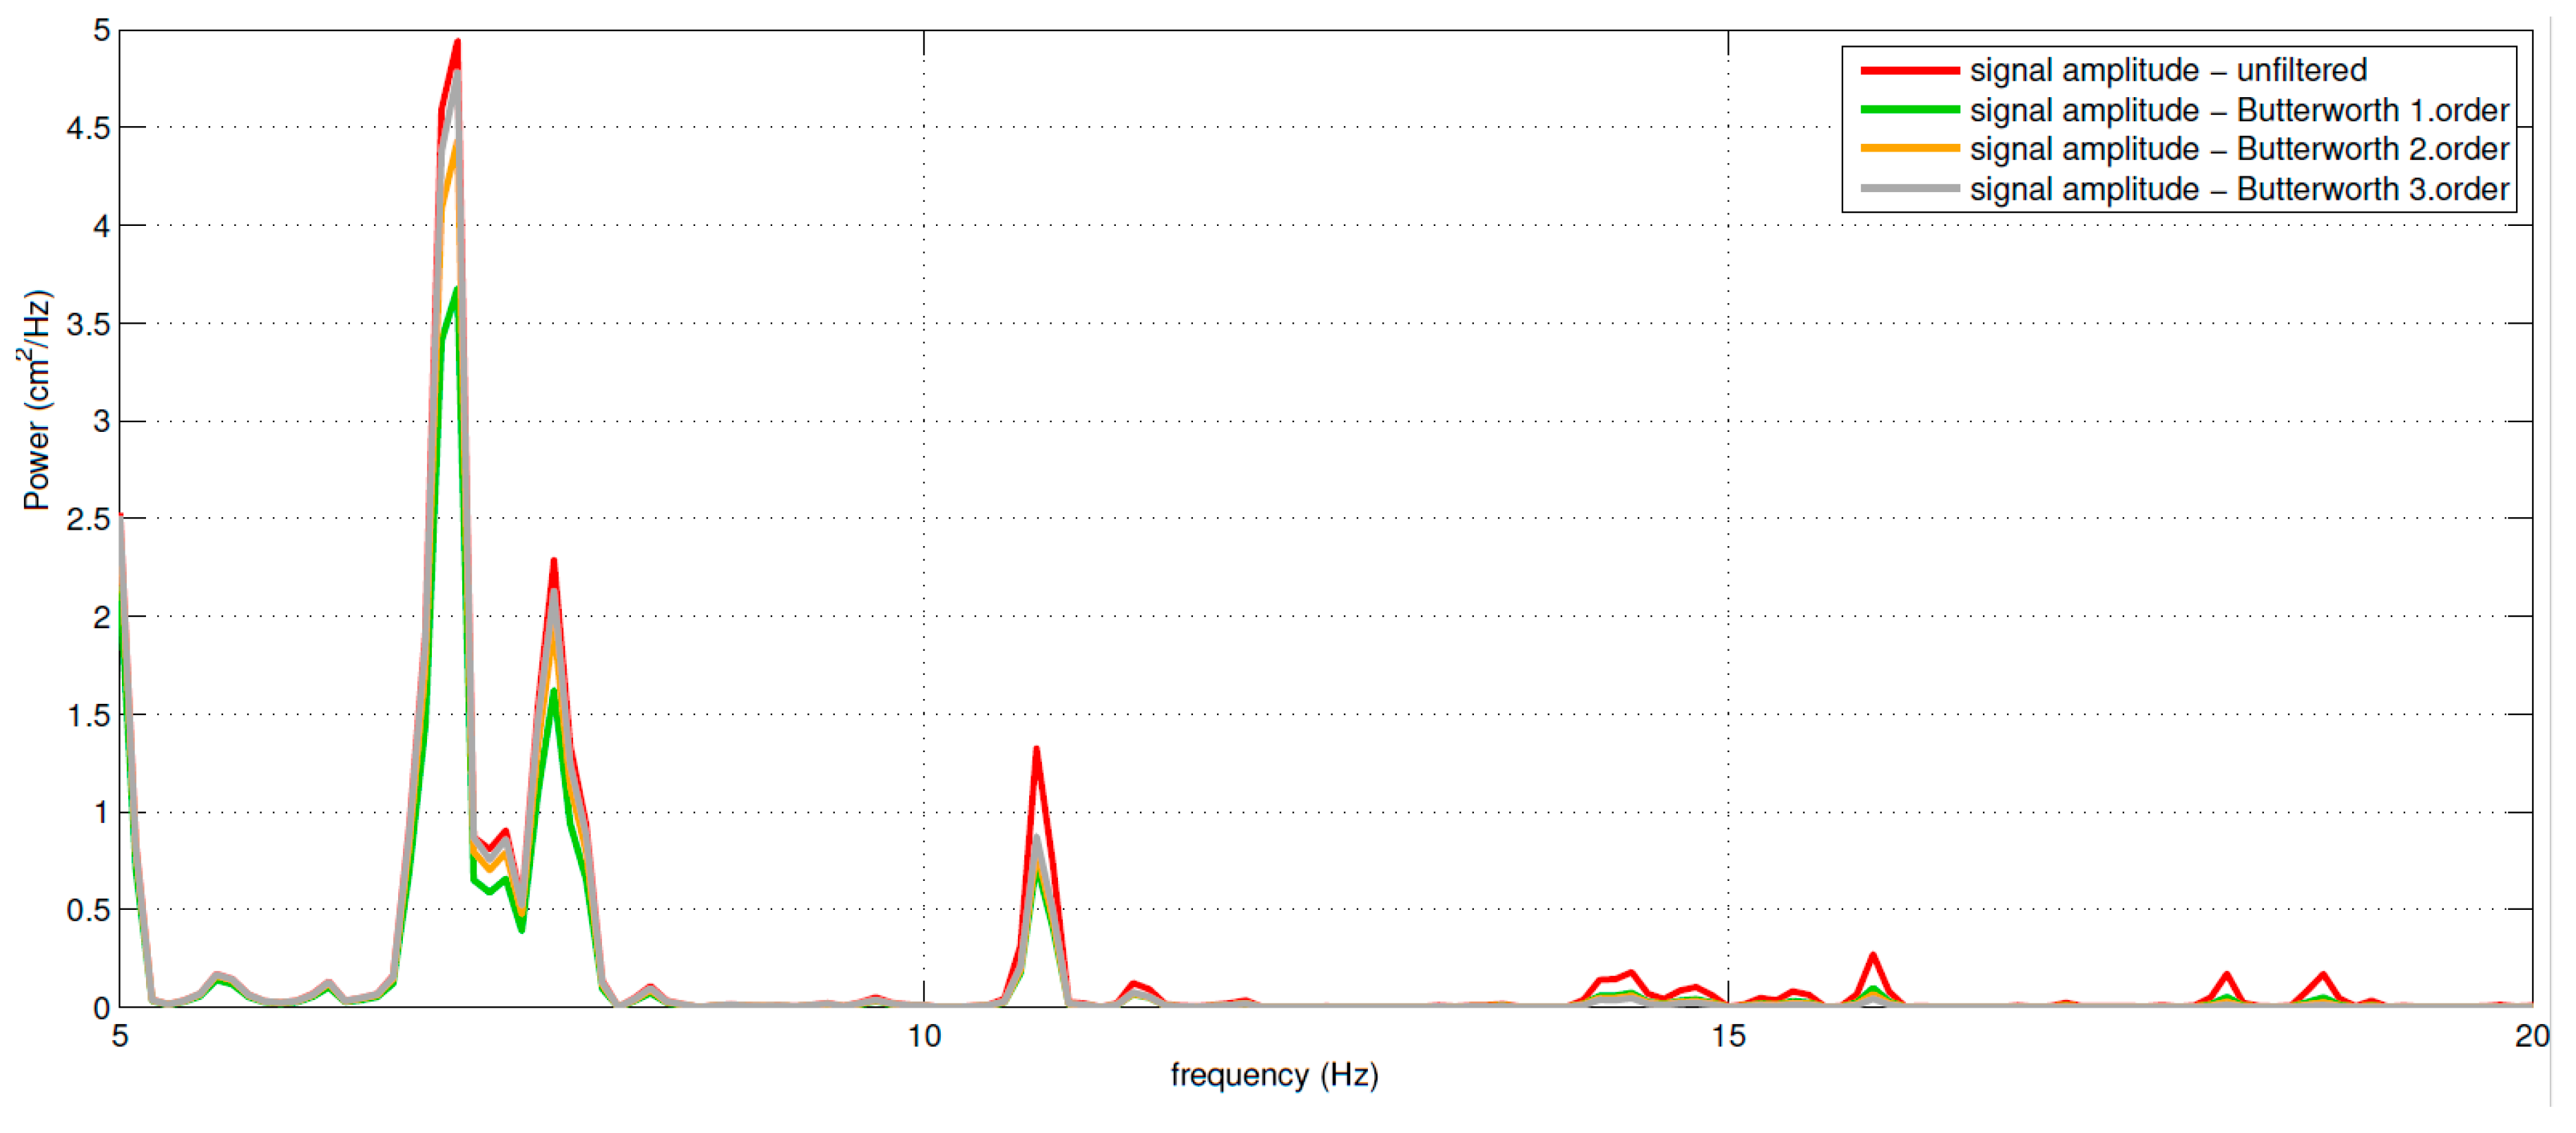
Further analysis of these results was performed to show the Butterworth filter’s effect on the measurement signal over the frequency range (see Figure 3).
Figure 3 illustrates the strength of the signal dependency on the cutoff frequency (13 Hz) of the Butterworth filter. From this graph, it can be clearly seen that the filters, and in particular their orders, not only affect frequencies above the cutoff frequencies, but also frequencies below, and the peak at 7 Hz demonstrates this strikingly. With increasing order of the filters, however, this effect decreases.
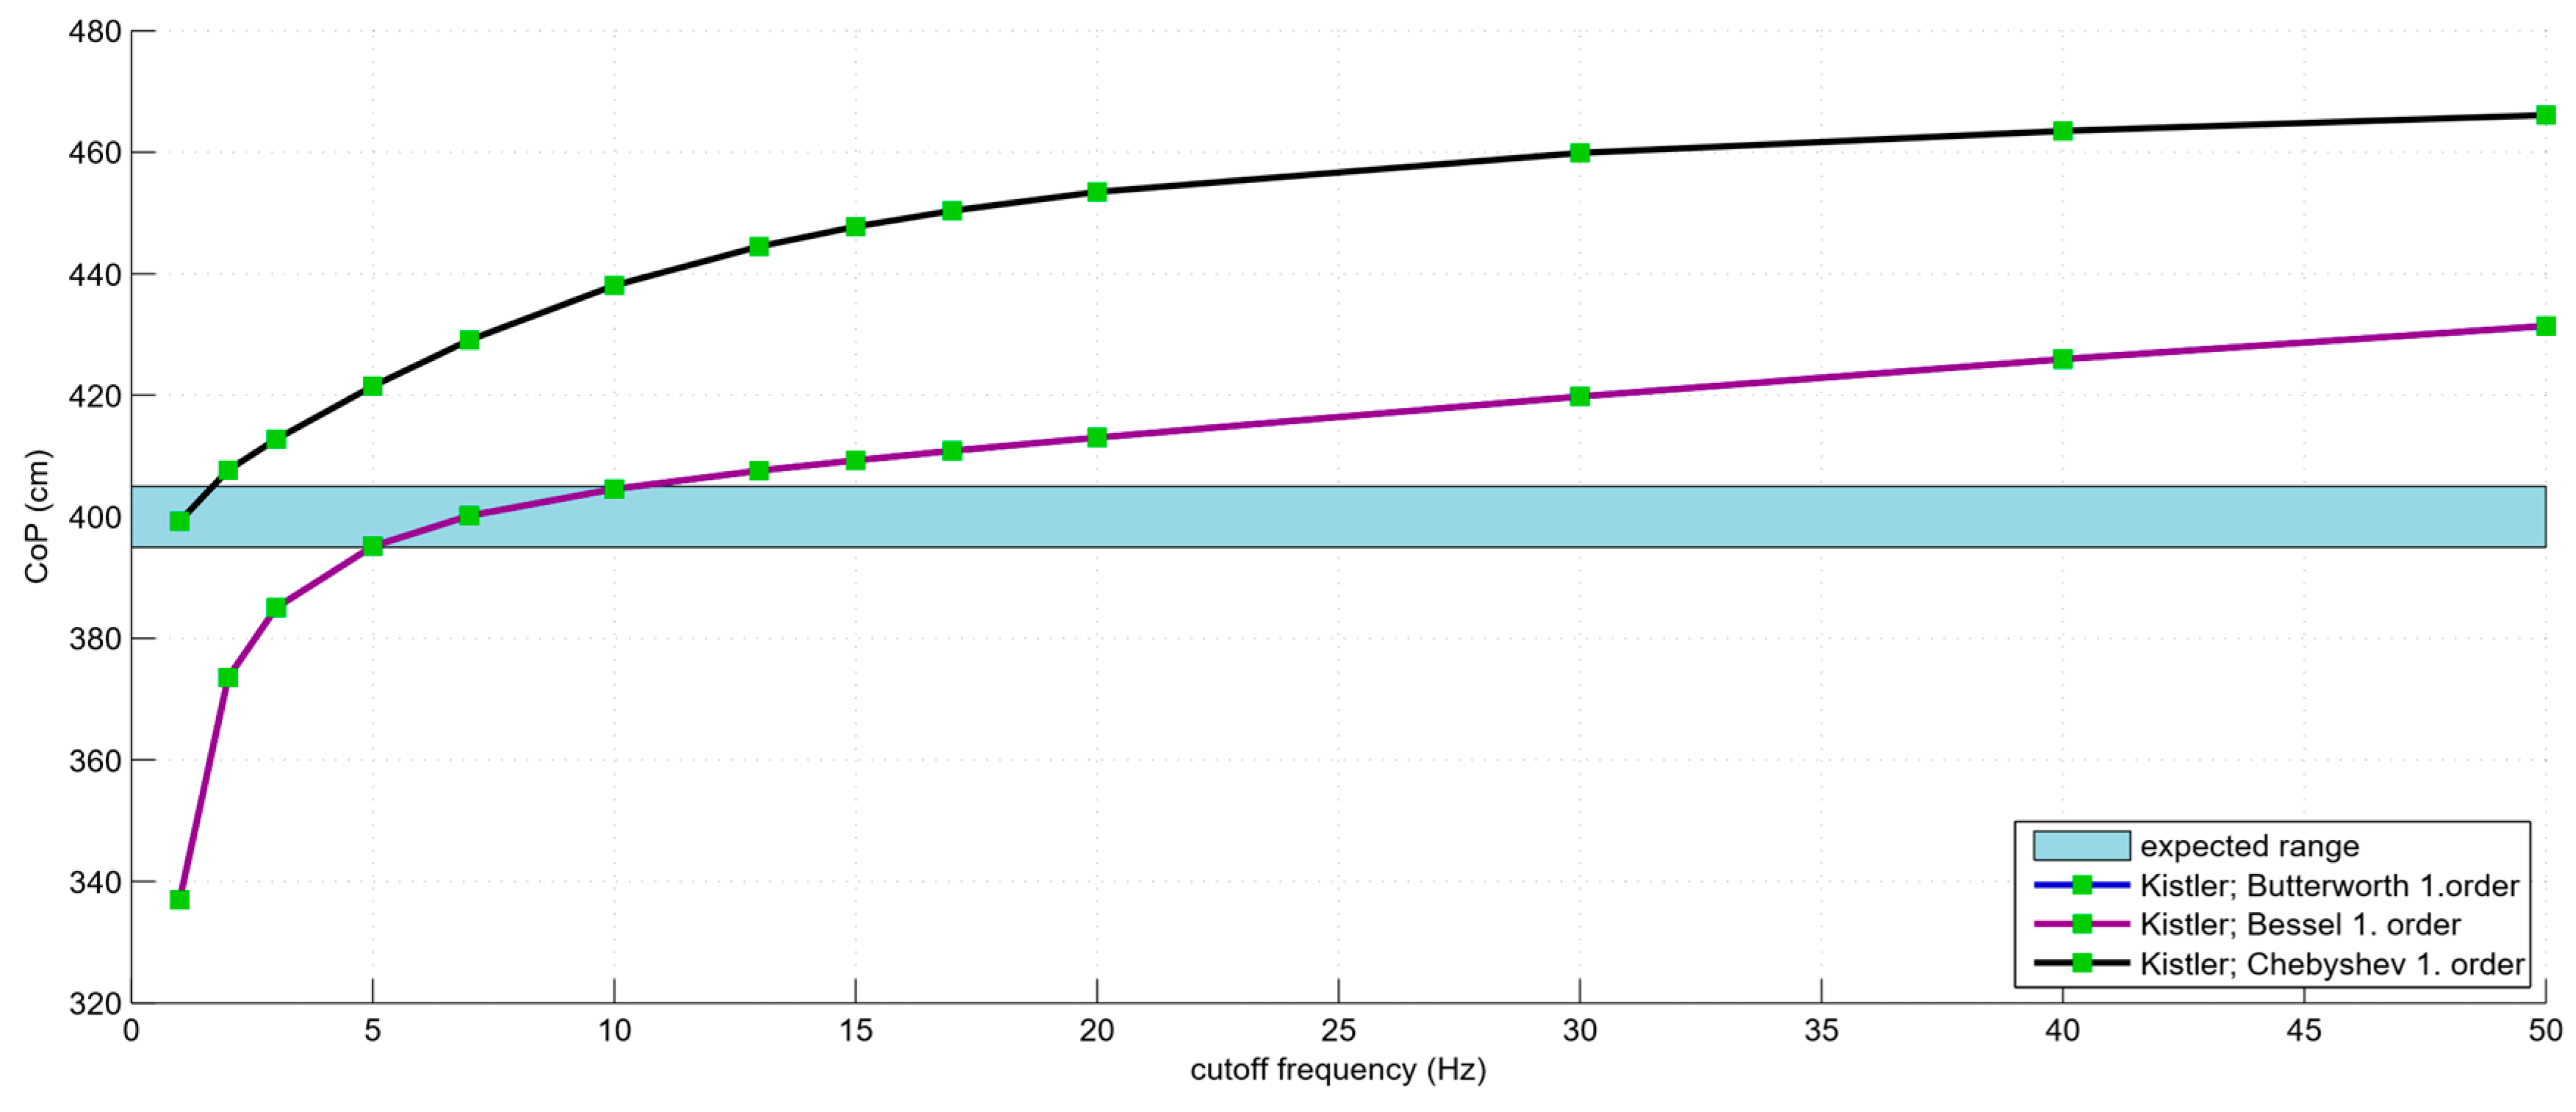
We next compared the effects of the various filter systems (Chebyshev, Bessel, and Butterworth). Besides the Butterworth filter, further filter systems exist, which depending on the scientific hypothesis being explored, may have a significant effect on the results after filtration of CoP data sets. To evaluate the effect and ultimately the suitability of the filter systems, the characteristic curves of each individual filter were plotted to measure their dependency on varying cutoff frequencies (see Figure 4). Considering the case of first-order filters, the Butterworth and Bessel filters show identical behaviors, meaning that both filter systems will have a very similar effect on the original CoP signal. The characteristic curve of the Chebyshev filter demonstrates a deviating trajectory with an elongated CoP track, independent of the base frequency. Starting at a cutoff frequency of 2 Hz, the CoP track lies considerably higher than the expected range.
In the cutoff frequency range between 10 Hz and 50 Hz, the Bessel and Butterworth filters stand out due to the predominantly linear path of their characteristic curves, while the Chebyshev filter only features a linear curve above 20 Hz. Beneath this cutoff frequency, none of the filters follow a linear tendency.
The Bessel and Butterworth filters also demonstrate a constant behavior in the CoP trajectories when filters of the second-order are investigated in the cutoff frequency range of interest (see Figure 5). In this case, it is important to note the tendency of the Chebyshev filter, which is similar to that of the Bessel and Butterworth filters, at a cutoff frequency between 10 Hz to 17 Hz.
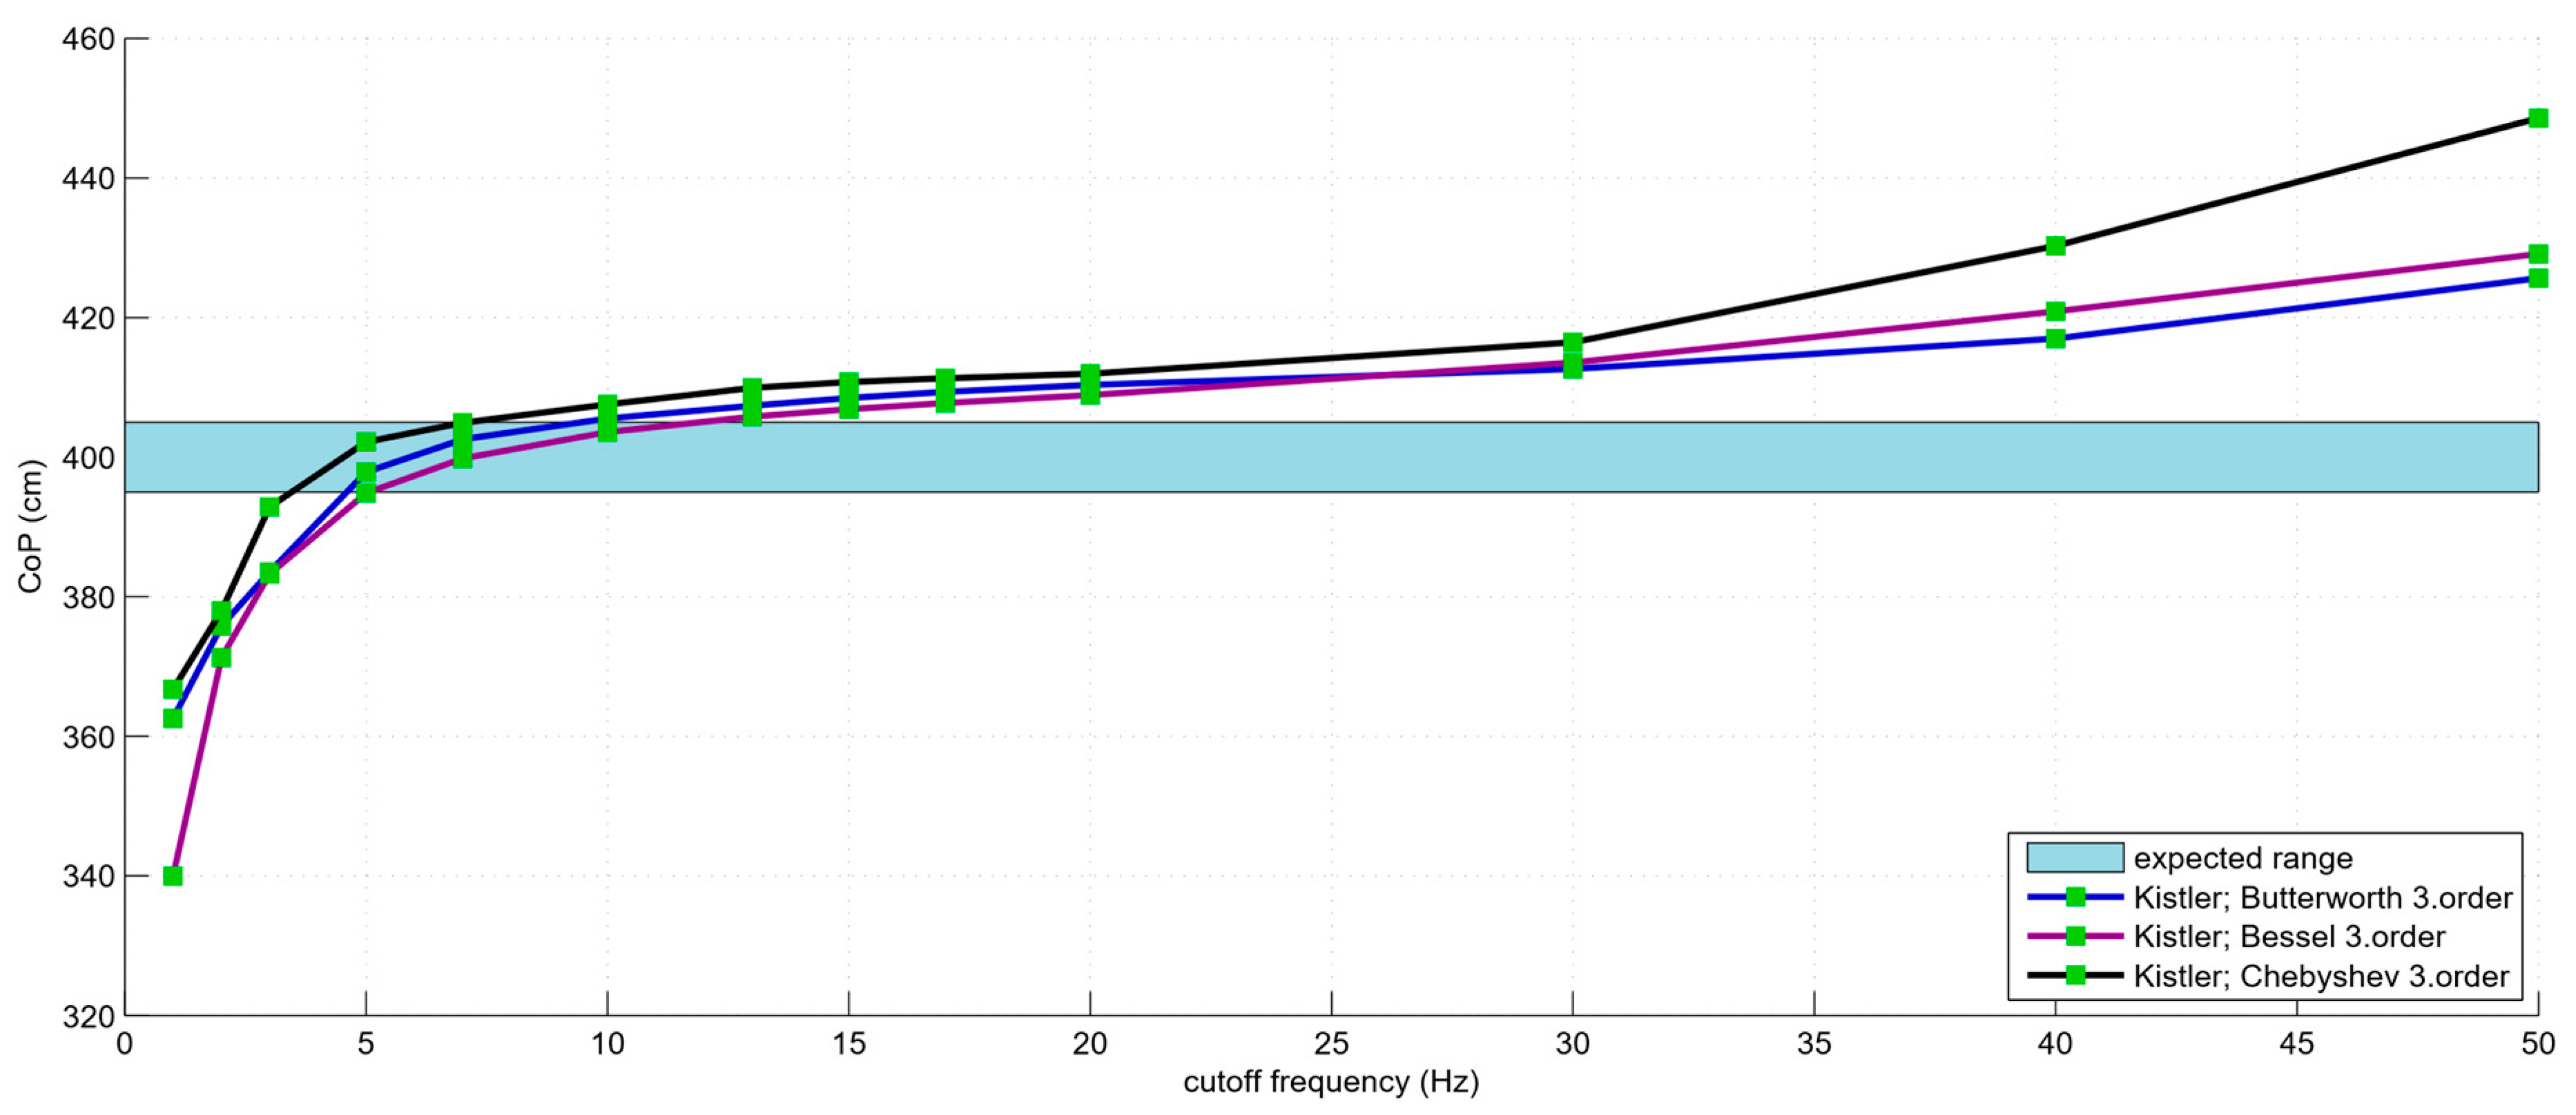
The characteristics of the filters of the third-order reveal similar behaviors for all filters in the range 13 to 20 Hz see Figure 6. In comparison to the second-order curve tendencies, the effect of the filters is mostly roughly equivalent over a broader frequency spectrum within the expected range.
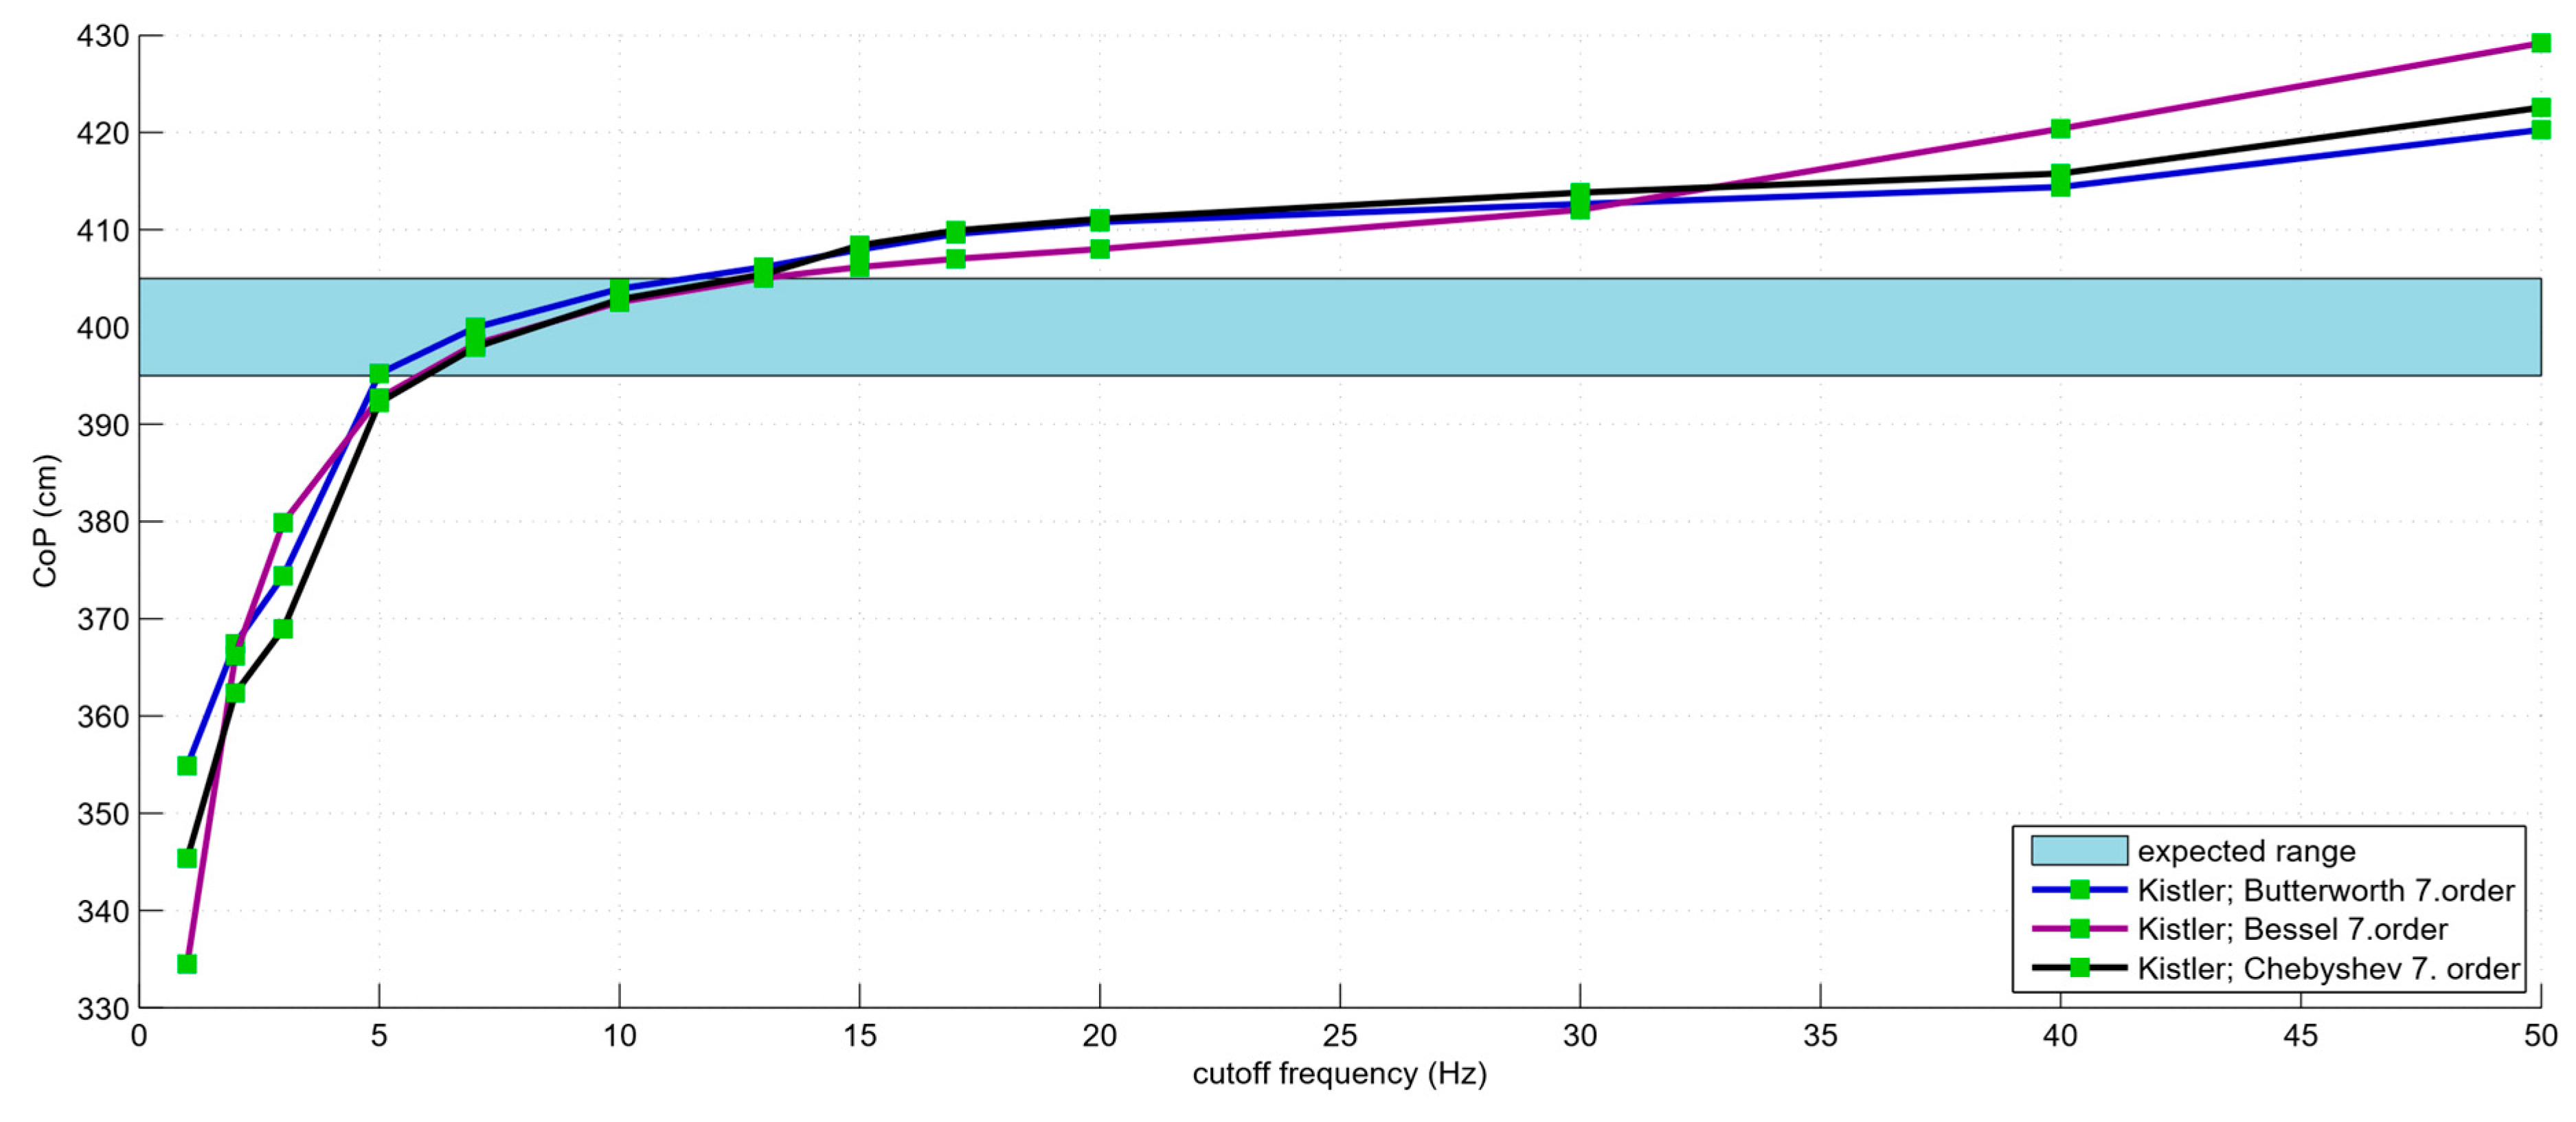
With progressively higher orders (Figure 7), the path of the Chebyshev filter becomes increasingly more similar to the Butterworth and Bessel filters. The seventh-order Bessel filter achieves the lowest variability between 10 Hz (402 cm) and 20 Hz (408 cm).
3.2. Down Sampling
In the second step of our evaluation, the paths of the CoP track were considered at various sampling frequencies. For this study, the original signal of 1 kHz was scaled down to the sampling frequency considered in the evaluation. Subsequently, the data were processed using a defined filter algorithm (second-order, cutoff frequency 12 Hz) and the CoP track was recalculated. The individual results can be seen in Figure 8.
In the range from 0 to 24 Hz, the unfiltered signal shows an asymptotic convergence with the expected value. The filters used do not deliver a usable result in this range, because the results fell short of the technical observation borders of the Nyquist criteria for the filters (twice the cutoff frequency = 24 Hz).
Above a cutoff frequency of 24 Hz, the filter results are near the expected value, whereby an abrupt increase can be observed (see Figure 8). With increasing sampling rates within the range from 25 Hz to 78 Hz, the CoP trajectories filtered with the Butterworth and Bessel filters follow the path of the unfiltered signal. In contrast, at a frequency of up to 50 Hz, the results of the Chebyshev filter demonstrate larger deviations from the original path. Above 50 Hz, the Bessel and Butterworth filters show a largely constant tendency within the expected range, but for the Chebyshev filter, this is only the case above 78 Hz.
For the raw signals of the Kistler plate used, an absolute error compared to the expected value of 9.9 cm ± 18.5 cm, the root mean square error was 20.7 cm and the standard error of the mean was 4.5 cm.
4. Discussion
The aim of the study is to describe the effect of various factors in the data acquisition and data processing of a CoP measurement. Over the course of the study described herein, different characteristics of the Butterworth, Bessel, and Chebysev filter systems were presented and compared. Furthermore, the effect of varying sampling frequencies on the results of a posturographic measurement was investigated.
The effect of the filters should also be evaluated as a function of the sampling frequency over the bandwidth of the available frequencies and orders. Based on the analyzed data, a recommendation is derived as to which filter is most effective for the analysis of the CoP data. Characteristic function mechanisms have been attributed to diverse mathematical filters, each optimal for different applications. Therefore, over the course of this study we investigated the conditions under which each filter is most appropriate for processing a one-dimensional, dynamic CoP signal.
Depending on order and cutoff frequency, the filters introduced demonstrate multiple influences on the raw signal. Experiments showed that the first-order Chebyshev filter is not suitable for processing of CoP tracks, as the filter results lie noticeably higher than the expected range throughout the path of its characteristic curve, and show a large deviation (<2%), depending on the cutoff frequency. The first-order Butterworth and Bessel filters seem to be more suitable in this case, though the paths of their characteristic curves are too steep in the expected range to determine whether the filters are dependable.
With increasingly higher orders, the filters’ paths begin to resemble each other and no longer present strong discrepancies. In general, the higher-order filters lie within the expected range (400–408 cm) over a wider spectrum of frequencies and therefore seem to be better suited. The second-order and third-order Butterworth filters stand out in particular, producing a relatively flat path (cutoff frequency > 10 Hz and < 29 Hz), and the same applies to the Bessel filter.
A further argument in favor of the use of higher order filters is revealed when examining the spectrum of frequencies. Higher order frequencies have a lessened impact on the desired frequency range of the signal and dependably eliminate the frequencies right up to the cutoff frequency. In our experiments the seventh-order Bessel filter, for example, exhibited the best results, since the path lies within the range of expected values, even at higher cutoff frequencies (up to 20 Hz). The Butterworth filter, commonly used in literature, consistently showed a good result, especially around the cutoff frequency of 13 Hz over all orders (with respect to the range of expected results).
Regarding the choice of lower cutoff frequencies, the deciding factor for the choice of filter is whether a decisive spectrum of frequencies can be identified in the measurements. The spectrum of CoP tracks in humanoids can differ greatly [21,22]. If one expands the field of observation of these results to the work of Zatsiorsky and Durate and transfers the CoP trajectories into a power density spectrum and decomposes this into the rambling and trembling parts, the filter should mainly act on the expiring parts of the trembling curve [22]. With Zatsiorsky and Durate this was the case from 2 Hz, which was also the case with data from various literature sources such as Winter et al. and Fitzpatrick et al. which still found reflex reactions in the 1–2 Hz band [23,24]. Based on the filter characteristics worked out, it is also recommended to choose a distance that is many times greater than the Nyquist criterion.
Vieira et al. showed during their studies that especially with small sampling rates the right choice of the filter also depends on the sampling frequency. Their investigation revealed a cut-off frequency of 12.5 Hz [8].
For the use of mathematical filters, it should be noted that the first 50 ms of a CoP track must be discarded, since there is significant variation in the signal output in the recorded track, resulting from the “loading” of the values into the filter. Since the data within this range in not of significance, it can be discarded (see Figure 2).
Down Sampling
Besides the choice of the filter, sampling rates also influence the results of the CoP trajectory. To quantify this influence, the CoP tracks were sampled down throughout the study, starting at 1 kHz, and compared with one another over corresponding frequency ranges.
The results of different filters when compared to the unfiltered signal, demonstrated that between the Nyquist boundary (24 Hz) and 78 Hz, the filtered signals only displayed a minimal difference to the unfiltered, raw signal. Over this range, the result of the CoP track is in the expected range but fluctuates unpredictably with increasing sampling rates.
It can be concluded that below a sampling rate of 24 Hz, for the constellation of filter parameters used here (cutoff frequency 12 Hz), the implementation of a filter is not expedient. In the range from 24 Hz to 78 Hz, a filtration of the measured signal seems not to be strictly necessary, due to only minimal discrepancy when compared to the raw signal, yet it should be considered if a measurement with a relatively low sampling rate (<100 Hz) is chosen [7]. These results coincide with studies by Leach et al. and Koltermann et al. Leach et al. compared force plates with 50 Hz sampling rate and 100 Hz sampling rate. The force gauges with 50 Hz sampling rates had a clear deviation from those with 100 Hz [20,25].
In the investigations of Koltermann et.al, force plates with a measuring frequency less than or equal to 100 Hz were compared with the standard devices Kistler and AMTI (sampling frequency 1 kHz). The investigations showed that the measured values of the devices with less than or equal to 100 Hz differ strongly from the standard devices with 1 kHz [20]. Also in the frequency analyses of Vieira et al. an influence of the sampling rate on the CoP could be proven, but here the effect cannot be separated exactly from the influence of the sampling duration effect [8].
The most important aspect of a filtration applies only when coupled power frequencies of 50 Hz resulting from an impractical setup must be eliminated.
At a sampling rate above 100 Hz, it was revealed that to plot the real measurements, a filter is undoubtedly necessary. The larger a sampling frequency becomes, the closer the measurements lie and consequently the influence of the murmur-effect rises, brought forth by electronic components in the measurement set-up, for example (e.g., amplifiers).
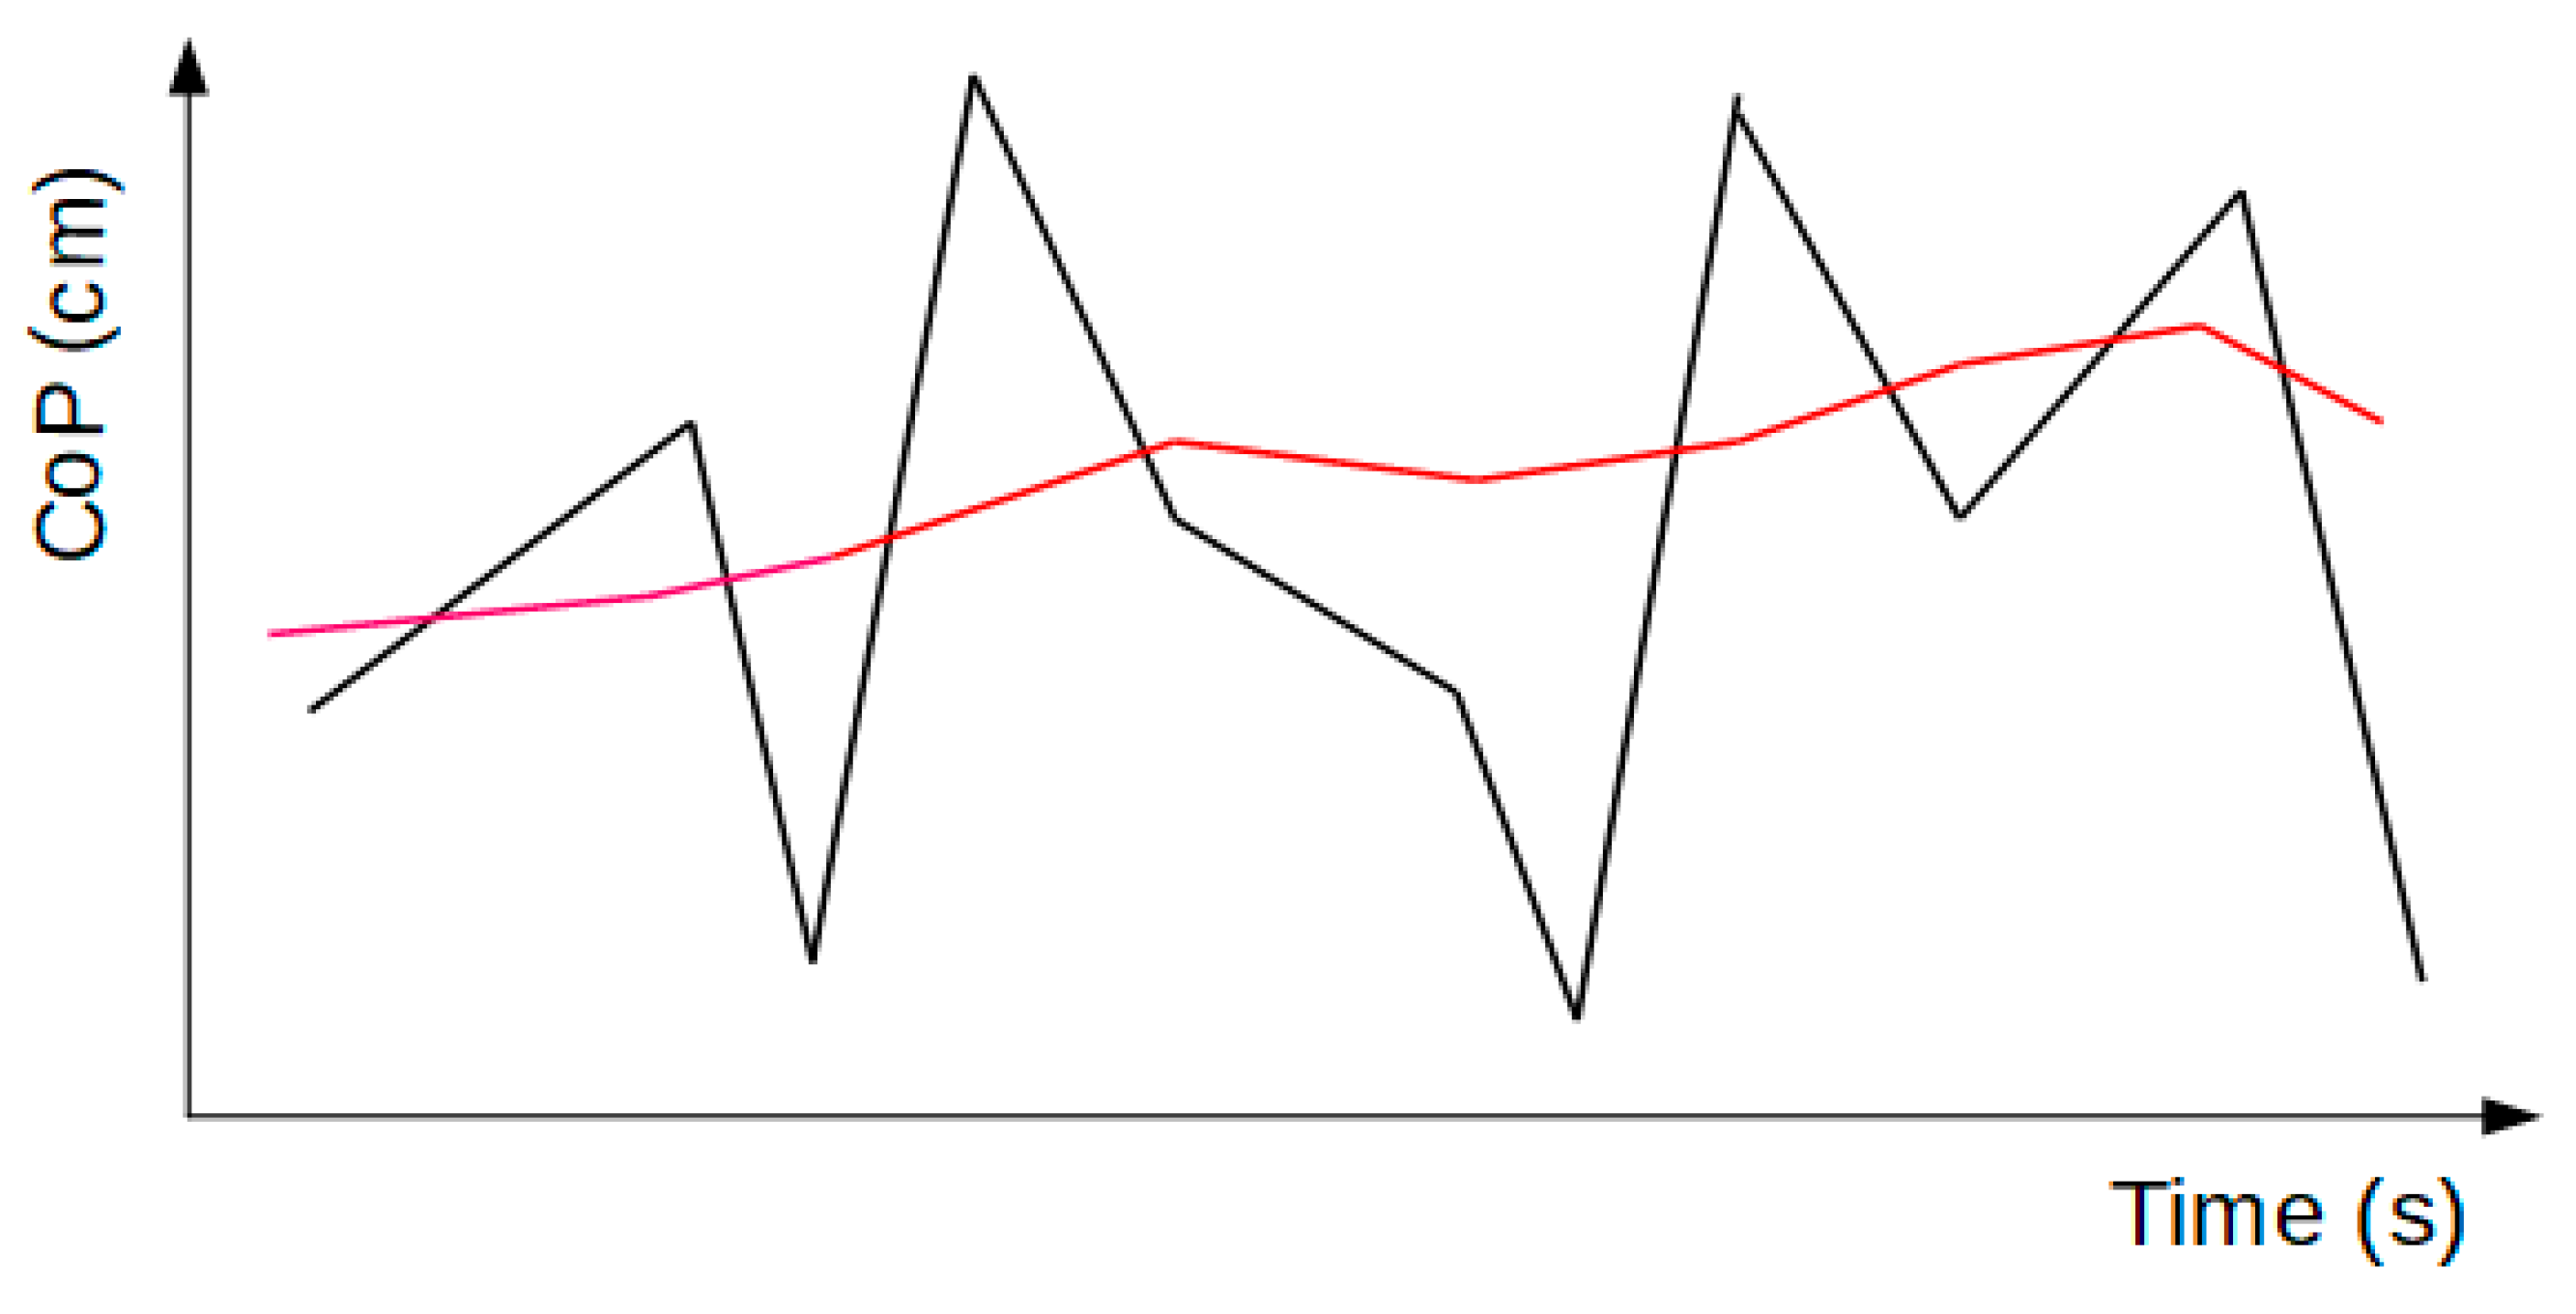
When measuring a CoP track, significant differences in length can develop over time. In Figure 9, this difference in length is schematically represented by a signal with a murmur and its filtered equivalent. Although the data points have the same values on the time axis, the movement of the CoP is notably dissimilar. This becomes clearer when imagining the signal paths as stretched out lines, where the filtered signal (red line) would be significantly shorter than the murmur (black line).
Our results corroborate the conclusion that a filtration of the CoP track is undeniably necessary in the relevant range above 100 Hz. Depending on the murmur, the results of an unfiltered signal appear above the expected values, depending on sampling frequency. For a sampling rate of 1 kHz, we show that this led to a deviation of approximately 25% in our measurements, and since this murmur is highly frequent as a rule, its effect can be removed quite well with a low-pass filter. The choice of filters is independent of the sampling rate in frequencies greater than 100 Hz [8].
5. Conclusions
In the broad field of CoP trajectory measurements, there exists a multitude of methods for recording and interpreting data. The goal of this study was to develop recommendations regarding the choice of a suitable filter and associated sampling frequencies.
Based on our results, the following can be recommended:
- Based on the filters examined here, the Butterworth and Bessel filters seem to be most suited to the interpretation of CoP data.
- For the choice of cutoff frequencies, a frequency of 13 Hz was found to generate reliable results using a technical pendulum.
- When choosing the filter order, at least a second-order filter should be used.
- In the range between 100 Hz to 1 kHz, the choice of sampling rate had no impact on the result of filtration, so that a minimum sampling rate of 100 Hz should be required.
In certain circumstances, scrutiny of the data prior to the selection of a filter is recommended, and to then choose the optimal filter for the data being analyzed.
The results could be used as the basis for another study to investigate the effects with volunteers. This further study should methodically follow the same approach to gain further findings on the way to a standardization of CoP measurement and data processing.
Author Contributions
J.J.K. and M.G. conceived and designed the experiments; J.J.K. performed the experiments; J.J.K., M.G. and M.B. analyzed the data; J.J.K., H.B. and M.B. contributed reagents/materials/analysis tools; J.J.K. and M.G. wrote the paper.
Funding
This research received no external funding.
Conflicts of Interest
The authors declare no conflict of interest. The founding sponsors had no role in the design of the study; in the collection, analyses, or interpretation of data; in the writing of the manuscript, and in the decision to publish the results.
References
- Tyson, S.; Connell, L. The psychometric properties and clinical utility of measures of walking and mobility in neurological conditions: A systematic review. Clin. Rehabil. 2009, 23, 1018–1033. [Google Scholar] [CrossRef] [PubMed]
- Visser, J.E.; Carpenter, M.G.; van der Kooij, H.; Bloem, B.R. The clinical utility of posturography. Clin. Neurophysiol. 2008, 119, 2424–2436. [Google Scholar] [CrossRef] [PubMed]
- Guskiewicz, K.M.; Perrin, D.H. Research and clinical applications of assessing balance. J. Sport Rehabil. 1996, 5, 45–63. [Google Scholar] [CrossRef]
- Hufschmidt, A. Die Quantitative Beschreibung der Spontanen Körperschwankenung im Stehen: Meßmethoden, Meßgrößen, Experimentell-Physiologische und Klinische Anwendung. Ph.D. Thesis, Tu Freiburg, Freiburg, Germany, 1977. [Google Scholar]
- Peterka, R.J. Simplifying the complexities of maintaining balance. IEEE Eng. Med. Biol. Mag. 2003, 22, 63–68. [Google Scholar] [CrossRef] [PubMed]
- Winter, A.D. Human balance and posture control during standing and walking. Gait Posture 1995, 3, 193–214. [Google Scholar] [CrossRef]
- Ruhe, A.; Fejer, R.; Walker, B. The test-retest reliability of centre of pressure measures in bipedal static task conditions—A systematic review of the literature. Gait Posture 2010, 32, 436–445. [Google Scholar] [CrossRef] [PubMed]
- Vieira, T.M.; Oliveira, L.F.; Nadal, J. Estimation procedures affect the center of pressure frequency analysis. Braz. J. Med. Biol. Res. 2009, 42, 665–673. [Google Scholar] [CrossRef] [PubMed] [Green Version]
- Duarte, M.; Freitas, S.M. Revision of posturography based on force plate for balance evaluation. Rev. Bras. Fisioter. 2010, 14, 183–192. [Google Scholar] [CrossRef] [PubMed]
- Carpenter, M.G.; Frank, J.S.; Winter, D.A.; Peysar, G.W. Sampling duration effects on centre of pressure summary measures. Gait Posture 2001, 13, 35–40. [Google Scholar] [CrossRef]
- Kim, S.; Nussbaum, M.A.; Madigan, M.L. Direct parameterization of postural stability during quiet upright stance: Effects of age and altered sensory conditions. J. Biomech. 2008, 41, 406–411. [Google Scholar] [CrossRef] [PubMed]
- Kunkel, M.; Freudenthaler, N.; Steinhoff, B.J.; Baudewig, J.; Paulus, W. Spatial-frequency-related efficacy of visual stabilisation of posture. Exp. Brain Res. 1998, 121, 471–477. [Google Scholar] [CrossRef] [PubMed]
- Lafond, D.; Champagne, A.; Descarreaux, M.; Dubois, J.D.; Prado, J.M.; Duarte, M. Postural control during prolonged standing in persons with chronic low back pain. Gait Posture 2009, 29, 421–427. [Google Scholar] [CrossRef] [PubMed]
- Brumagne, S.; Cordo, P.; Verschueren, S. Proprioceptive weighting changes in persons with low back pain and elderly persons during upright standing. Neurosci. Lett. 2004, 366, 63–66. [Google Scholar] [CrossRef] [PubMed]
- Paulus, W.M.; Straube, A.; Brandt, T. Visual stabilization of posture. Physiological stimulus characteristics and clinical aspects. Brain 1984, 107, 1143–1163. [Google Scholar] [CrossRef] [PubMed]
- Vuillerme, N.; Danion, F.; Marin, L.; Boyadjian, A.; Prieur, J.M.; Weise, I.; Nougier, V. The effect of expertise in gymnastics on postural control. Neurosci. Lett. 2001, 303, 83–86. [Google Scholar] [CrossRef]
- Foo, J.; Paterson, K.; Williams, G.; Clark, R. Low-cost evaluation and real-time feedback of static and dynamic weight bearing asymmetry in patients undergoing in-patient physiotherapy rehabilitation for neurological conditions. J. Neuroeng. Rehabil. 2013, 10, 1–8. [Google Scholar] [CrossRef] [PubMed]
- Clark, R.A.; Bryant, A.L.; Pua, Y.; McCrory, P.; Bennell, K.; Hunt, M. Validity and reliability of the Nintendo Wii Balance Board for assessment of standing balance. Gait Posture 2010, 31, 307–310. [Google Scholar] [CrossRef] [PubMed]
- Kapteyn, T.S.; Bles, W.; Njiokiktjien, C.J.; Kodde, L.; Massen, C.H.; Mol, J.M. Standardization in platform stabilometry being a part of posturography. Agressologie 1983, 24, 321–326. [Google Scholar] [PubMed]
- Koltermann, J.J.; Gerber, M.; Beck, H.; Beck, M. Validation of the HUMAC Balance System in Comparison with Conventional Force Plates. Technologies 2017, 5, 44. [Google Scholar] [CrossRef]
- Zatsiorsky, V.M.; Duarte, M. Instant equilibrium point and its migration in standing tasks: Rambling and trembling components of the stabilogram. Motor Control 1999, 3, 28–38. [Google Scholar] [CrossRef] [PubMed]
- Zatsiorsky, V.M.; Duarte, M. Rambling and trembling in quiet standing. Motor Control 2000, 4, 185–200. [Google Scholar] [CrossRef] [PubMed]
- Fitzpatrick, R.C.; Gorman, R.B.; Burke, D.; Gandevia, S.C. Postural proprioceptive reflexes in standing human subjects: Bandwidth of response and transmission characteristics. J. Physiol. 1992, 458, 69–83. [Google Scholar] [CrossRef] [PubMed]
- Winter, D.A.; Patla, A.E.; Prince, F.; Ishac, M.; Gielo-Perczak, K. Stiffness control of balance in quiet standing. J. Neurophysiol. 1998, 80, 1211–1221. [Google Scholar] [CrossRef] [PubMed]
- Leach, J.M.; Mancini, M.; Peterka, R.J.; Hayes, T.L.; Horak, F.B. Validating and calibrating the Nintendo Wii balance board to derive reliable center of pressure measures. Sensors 2014, 14, 18244–18267. [Google Scholar] [CrossRef] [PubMed]
Figure 1.
left: pendulum with attached weight, mounted on a Kistler force plate [18]; right: Mathematical model of the pendulum stand for the quantification of the pendulum swings with the length of the pendulum l, the angle of release α and the projected path x.
Figure 1.
left: pendulum with attached weight, mounted on a Kistler force plate [18]; right: Mathematical model of the pendulum stand for the quantification of the pendulum swings with the length of the pendulum l, the angle of release α and the projected path x.

Figure 2.
Paths of the X components of the CoP-track, without filter and with first- to third-order Butterworth filters.
Figure 2.
Paths of the X components of the CoP-track, without filter and with first- to third-order Butterworth filters.

Figure 3.
Representation of the signal frequency components and the associated effect, without filter (blue) and with the Butterworth filters in different orders.
Figure 3.
Representation of the signal frequency components and the associated effect, without filter (blue) and with the Butterworth filters in different orders.

Figure 4.
Representation of characteristic curves of first-order Bessel, Butterworth, and Chebyshev filters. The Butterworth (blue) and Bessel filters (magenta) possess the same behavior, so the characteristic curves are congruent.
Figure 4.
Representation of characteristic curves of first-order Bessel, Butterworth, and Chebyshev filters. The Butterworth (blue) and Bessel filters (magenta) possess the same behavior, so the characteristic curves are congruent.

Figure 5.
Representation of the characteristic curves of second-order Bessel, Butterworth, and Chebyshev filters.
Figure 5.
Representation of the characteristic curves of second-order Bessel, Butterworth, and Chebyshev filters.

Figure 6.
Representation of the characteristic curves of third-order Bessel, Butterworth, and Chebyshev filters.
Figure 6.
Representation of the characteristic curves of third-order Bessel, Butterworth, and Chebyshev filters.

Figure 7.
Representation of the characteristic curves of seventh-order Bessel, Butterworth, and Chebyshev filters.
Figure 7.
Representation of the characteristic curves of seventh-order Bessel, Butterworth, and Chebyshev filters.

Figure 8.
Representation of the effect of the testing frequency on the measurement, with a detailed view of the sampling frequency of 0 Hz and 200 Hz.
Figure 8.
Representation of the effect of the testing frequency on the measurement, with a detailed view of the sampling frequency of 0 Hz and 200 Hz.

Figure 9.
Schematic representation of a filtered signal (red) and its counterpart with the murmur (black).
Figure 9.
Schematic representation of a filtered signal (red) and its counterpart with the murmur (black).


Table 1.
Overview of different Measurement strategies and the applied parameters.
| Study | Recording Frequency | Filter | Measuring Time |
|---|---|---|---|
| Carpenter et al. [10] | 20 Hz | “5 Hz” | 120 s |
| Kim et al. [11] | 100 Hz | not specified | 75 s |
| Kunkel et al. [12] | 16.7 and 20 Hz | not specified | 62 and 30 s |
| Lafond et al. [13] | 100 Hz | “zero-lag sixth order Butterworth low-pass filter at 10 Hz cutoff frequency” | 60 s |
| Brumagne et al. [14] | 500 Hz | “low pass filtered (fc = 5 Hz)” | 60 s |
| Paulus et al. [15] | 20 Hz | “0.09 Hz high pass 40 Hz low pass” | 60 s |
| Vuillerme et al. [16] | 200 Hz | not specified | 10 s |
| Foo et al. [17] | 40 Hz | “Wavelet-based filter with a low pass cutoff frequency of 10 Hz” | 20 s |
| Clark et al. [18] | 40 Hz | “eighth-order Butterworth filter with a low pass cutoff frequency of 12 Hz” | 30 s |
© 2018 by the authors. Licensee MDPI, Basel, Switzerland. This article is an open access article distributed under the terms and conditions of the Creative Commons Attribution (CC BY) license (http://creativecommons.org/licenses/by/4.0/).
Share and Cite
MDPI and ACS Style
Koltermann, J.J.; Gerber, M.; Beck, H.; Beck, M. Validation of Various Filters and Sampling Parameters for a COP Analysis. Technologies 2018, 6, 56. https://0-doi-org.brum.beds.ac.uk/10.3390/technologies6020056
AMA Style
Koltermann JJ, Gerber M, Beck H, Beck M. Validation of Various Filters and Sampling Parameters for a COP Analysis. Technologies. 2018; 6(2):56. https://0-doi-org.brum.beds.ac.uk/10.3390/technologies6020056
Chicago/Turabian StyleKoltermann, Jan Jens, Martin Gerber, Heidrun Beck, and Michael Beck. 2018. "Validation of Various Filters and Sampling Parameters for a COP Analysis" Technologies 6, no. 2: 56. https://0-doi-org.brum.beds.ac.uk/10.3390/technologies6020056
Note that from the first issue of 2016, this journal uses article numbers instead of page numbers. See further details here.