Integrating Animated Computational Fluid Dynamics into Mixed Reality for Building-Renovation Design


Division of Sustainable Energy and Environmental Engineering, Graduate School of Engineering, Osaka University, Suita, Osaka 565-0871, Japan
*
Author to whom correspondence should be addressed.
Technologies 2020, 8(1), 4; https://0-doi-org.brum.beds.ac.uk/10.3390/technologies8010004
Submission received: 30 November 2019
/
Revised: 24 December 2019
/
Accepted: 26 December 2019
/
Published: 29 December 2019
(This article belongs to the Special Issue Computer-Aided Architectural Design)
Abstract
:In advanced society, the existing building stock has a high demand for stock renovation, which gives existing buildings new lives, rather than building new ones. During the renovation process, it is necessary to simultaneously achieve architectural, facilities, structural, and environmental design in order to accomplish a healthy, comfortable, and energy-saving indoor environment, prevent delays in problem-solving, and achieve a timely feedback process. This study tackled the development of an integrated system for stock renovation by considering computational fluid dynamics (CFD) and mixed reality (MR) in order to allow the simultaneous design of a building plan and thermal environment. The CFD analysis enables simulation of the indoor thermal environment, including the entire thermal change process. The MR system, which can be operated by voice command and operated on head-mounted display (HMD), enables intuitive visualization of the thermal change process and, in a very efficient manner, shows how different renovation projects perform for various stakeholders. A prototype system is developed with Unity3D engine and HoloLens HMD. In the integrated system, a new CFD visualization method generating 3D CFD animation sequence for the MR system is proposed that allows stakeholders to consider the entirety of changes in the thermal environment.
1. Introduction
Developed countries are shifting from a society of mass production and mass consumption to a society that uses accumulated stock to realize sustainability and wealth. Existing building stocks have huge social, economic, and environmental impacts. There is a great demand for stock renovation, which is not simply a renewal or modification but a remake of buildings following the current social climate [1]. Unlike dismantlement and rebuilding, stock renovation produces no significant amount of construction waste, reflecting a more environmentally friendly approach that is in line with societal priorities.
As one of the main objectives for the stock renovation, the buildings should be designed to save energy, be environmentally friendly, and create a comfortable living space [2]. Bad indoor thermal experience accounts for a large proportion of householders’ complaints [3]. Consequently, home renovation has become a common choice for improving their indoor thermal environment, which typically includes window replacement, better insulation, installation of a more efficient heating system, and improvements in house airtightness and natural ventilation, using mechanical ventilation systems [4]. However, improvements in thermal indoor environments are hampered by an outmoded renovation design process that fails to efficiently coordinate design aspects (architectural, facilities, structural, and environmental) while problem-solving issues and handling the feedback loop in a timely manner. Therefore, the integration of building performance feedback in the design process is increasingly being considered as a core element of the decision support framework that currently drives sustainable building, from early conception to fabrication [5]. During the renovation process, it is necessary to achieve simultaneous architectural, systematic, structural, and environmental design to accomplish a healthy, comfortable, and energy-saving indoor environment, prevent delays in problem-solving, and achieve a timely feedback process. The renovation design process typically follows a waterfall model, which is sequential and noniterative. Because all the design steps are not synchronized and thermal design is a later consideration in the waterfall approach, feedback from customers comes too late [6]. If any design steps conducted at the latter process finds some problems, there is no scope to feedback the design of the former process. This problem has resulted in occupants facing uncomfortable experiences. In recent years, several new methods for a more efficient building-design process have been proposed which encourage stakeholders to collaborate in a synchronized manner [7]. Building information modeling (BIM), which contains up-to-date geometry information and building properties, is an emerging method for managing building lifecycles [8], and it has been proposed for realizing simultaneous building design with consideration to the lifecycle data of the entire structure [9]. Additionally, computational fluid dynamics (CFD), which uses numerical methods to solve fluid mechanics problems, can be used to analyze fluid flows in the design of thermal environments. Building designs using CFD and BIM can streamline the design cycle and enhance the coordination of all building-design departments. However, simply input CFD information to the BIM model does not allow all stakeholders to participate in environmental design. For the stakeholders, one of the challenges lies in how to integrate BIM intuitively with CFD software. In fact, methods of integrating BIM and CFD, such as Autodesk CFD and DesignBuilder, have been proposed [10,11]. CFD analysis produces a large amount of numerical data that can be used in three-dimensional (3D) modeling by using the proposed post-processing software. However, such software is not open source and cannot export the arrows and color map information of simulation results as vector data [12]. Integrating CFD results with other systems has many limitations. Additionally, there is difficulty in building a relationship between the CFD model and the BIM model in the 2D display. If the indoor environment can be displayed immersive to provide a more intuitive experience, the communication between designers from the different departments will lead to more accurate and faster implementation of a design so as to increase satisfaction among customers. Mixed reality (MR) is a technology that blends digital content with real-world content, enabling users to experience the interaction between the real world and the digital one in real time [13]. Therefore, the method of integrating CFD and MR to combine CFD results and the real-world is proposed in this research.
This research developed an integrated system for stock renovation that includes CFD and MR methods to enable simultaneous design of the building and thermal environment. The integrated system mixed the real-world indoor environment (augmented by digitized CFD data in 4D (3D plus time)) and simulated indoor environment (augmented by real world data). The CFD results are visualized on head-mounted display (HMD), which enabled stakeholders to fully understand the design concept. In addition, users are free to change the indoor layout and then simulate and evaluate these proposals using the proposed system, such that they are presented with a variety of design options that they can better understand as they experience and interact with them. The main novelties of the developed system, including, but not limited to, automatic animation generation sequence, anchor cube, vertex shaders, sight tracking component, and voice command function, are introduced in Section 3.
2. Literature Review
Virtual reality (VR) is an artificial environment generated by computer graphics (CG) that can reproduce the human sensory experience so as to bring the virtual world closer to reality [14]. Compared with the conventional method of displaying CFD results in 2D using an LCD monitor, the various methods of visualizing data in 3D space are said to provide a better immersive experience. Hence, VR technology has been proposed to bridge the communication gap between building designers and their clients. Unity game engine and video is one such interactive visualization system [15], although time-line information of CFD simulation results is not available, and the results are displayed on a 35-megapixel video wall (8k in 4 × 4 2k screens) that is not immersive enough. To provide the most effective VR experience, a cave automatic virtual environment (CAVE) has also been proposed [16], but it is very expensive, with a great deal of low-versatility equipment. Savioja et al. [17] conducted a CFD analysis in the lecture room and displayed the CFD analysis result together with the display of the building model. The airflow behavior and intensity are clearly shown by the visualized CFD results, but the created VR world has no connection to objects in the real world, which makes it feel different from the real world.
New methods with high versatility and high immersion using an HMD to view the thermal environment have been proposed in recent years. Fukuda et al. visualized a 3D design plan and the results of a CFD analysis in VR space [12]; however, the CFD results could only be displayed as a heat map, and changes in the heat map at different positions could not be viewed in real time. To solve these real-time display problems, they proposed, in another study, integrating CFD and VR using the Visualization Toolkit (VTK) library [18] to make the indoor thermal environment easy to understand by having users observe the entire 3D model of CFD results.
However, because VR is a completely virtual environment, the building plans must be computer generated, and more realistic models come with a price tag. In addition to the time and cost of generating building models in VR, the VR environment is rarely designed to interact with the real world. Consequently, other researchers in the building-design field are looking at augmented reality (AR) to visualize the thermal environment. AR extends or enriches the real world by superimposing digital content onto a real-world display. Research on visualization by AR superimposing models in the real world was being conducted. Goldsmith et al. [19] made a visualization of data on temperature and volume in real time, using a wireless sensor network. However, simple superimposing sensor data and real-world objects don’t make users quickly understand the thermal intelligence. Malkawi and Srinivasan [20] built an AR system that displays an indoor thermal room environment, calculated by CFD, using information collected by sensors on conditions in the room. Furubayashi et al. output their CFD results to a virtual reality modeling language (VRML) file and used the AR method to locate the point group data, which contains the CFD results, with natural feature points to visualize the VRML file in large outdoor space [21]. Heuveline et al. also used marker-less AR to display outdoor airflow, which was calculated by CFD, using information collected from a global positioning system (GPS), gyro, and acceleration sensors [22]. Another interactive visualization system using marker-based AR was proposed in order to enhance the connection of CFD results with the real world [23]. Although this system could display CFD results on a video see-through HMD, it could only display the thermal environment at discrete points in time; therefore, the result could not express the entire thermal environment changing process. This AR system overlaid the CFD information onto the video as heat maps and arrows without occlusion, which means that the interaction with users depends on the AR marker and that the relationship between the CFD results and the real world was very weak. Moreover, the user activity area was restricted owing to the AR marker, which also caused a diminished user experience. The conventional interactive device between the system and humans such as PC keyboard, mouse [24], or gamepad [23] need time to get used to. Moreover, when wearing the HMD, the line of sight is concentrated on the screen, and users are laborious to see the interactive device. This brings a lot of trouble to the immersive experience. Therefore, the voice-control AR system has been proposed which simplifies the operation steps, and users without any computer experience can quickly get started with the AR system [25].
In buildings’ energy consumption, daylight always takes a significant portion of energy use. It has an important influence on building energy consumption where solar radiation raises the indoor temperature and solar illuminance affects the artificial light. Daylight is an indispensable external factor that must be considered in order to predict the indoor environment accurately [26]. Researchers usually analyze indoor daylighting to predict indoor illuminance. An annual daylight simulation method has been proposed to predict daylight illuminance [27]. Moreover, a new model was proposed to correctly simulate indoor illuminance [28]. In these research studies, temperature was not the main consideration. The present study attempts to address this by treating daylight as one of the factors that affect the indoor thermal environment. One method of combatting the increase in temperature by solar radiation is to improve the energy performance of building envelopes. Windows are considered as weak spots in the building envelope. Hence, new window technologies, materials and structures have been proposed, to control the influence of solar radiation on buildings in order to reduce energy consumption. Thermotropic windows, for example, can change the light-transmission-behavior reversibly [29], and electrochromic glazing of windows can modulate the entry of solar energy by application of voltage [30]. Before any of these solutions are adopted in building renovations, simulations should be carried out to determine their effectiveness, using simulation software such as DeST [31], DIAL+ [32], ANSYS CFD [33], and so on.
Of the factors that influence a building’s thermal environment, air temperature is absolutely fundamental. Indoor ventilation and thermal comfort are closely related. Poor ventilation can lead to high concentrations of indoor carbon dioxide, which makes people sleepy and can adversely affect their health. Natural ventilation improves indoor air quality by promoting indoor–outdoor air exchange. The positive effects of natural ventilation can be enjoyed even during cold winter nights. One study showed that opening the window just wide enough improves air quality and comfort during sleep, even though it slightly lowers the indoor temperature [34]. Natural ventilation not only has health benefits but also saves energy. Thus, a low-cost natural ventilation solution can contribute to cooling buildings and improving indoor comfort during the summer [35].
3. Proposed MR System with Animated CFD
3.1. Overview of the Proposed Method
In order to bring together stakeholders, such as owners and designers, and involve them in the decision-making process from the early building-design process, enabling simultaneous design of the building and thermal environment, the MR system was proposed. Building the system involved the following four steps: BIM modeling, mesh generation, CFD analysis, and MR visualization, as shown in Figure 1. At first, the target room’s BIM model was created according to the design drawings by using the BIM software. All the information about geometry, material, components properties, and so on were input at this step. Secondly, the mesh used in the CFD calculation was generated based on BIM geometry information. Thirdly, the boundary conditions were set based on BIM properties, and the initial conditions were input. Both operations were completed manually. Then, steady-state fluid simulation was executed by the CFD software. Fourthly, the CFD simulation results were exported, and these data were converted to another format in order to generate the CFD animation. The animated CFD results were visualized in full-scale and small-scale by simultaneous localization and mapping (SLAM)-based MR technology. Finally, the voice command system was built to switch the observation scene. Users can easily understand the indoor thermal environment by switching scenes between different room scale, plan, heat map, comfort map, and streamline animation.
3.2. BIM Modeling and Mesh Generation
The BIM model was created by BIM software, manually. As an evaluation system, the BIM model can manage the lifecycle of the entire project, enabling users to obtain information immediately. It also provides the volume mesh required for CFD analysis. There are several methods to generate the mesh. Some methods require building the mesh from scratch; others, like mesh-generation software and 3D-modeling software, can convert a 3D model to mesh. Whichever the method, they all require BIM information, and the output mesh must be manually corrected before importing to CFD software. Moreover, the more complex the BIM model, the more time it will take. Mesh-generation software should be used to build the mesh in this research. The mesh data were packaged into polymesh, for import by CFD software.
3.3. CFD Analysis
For CFD analysis, the boundary properties related to the wall, ceiling, floor, window, table, and heat source were set manually, on the basis of BIM information. Initial conditions, including indoor temperature and airflow conditions, were set for the different case studies. A daylight factor was introduced, and its intensity was determined by solar direction and insolation, which were set in reference to the government database [36]. In this study, it was assumed that the thermal environment of the building was in a stable state. After system settings, such as parallel setting and time control, were completed, CFD analysis was executed by open-source CFD software.
3.4. MR Visualization
Numerical data of the indoor thermal environment were calculated after CFD analysis. The data were imported into post-processing software and converted to 3D graphics information by adding different filters. Subsequently, the data were exported in VRML format, frame-by-frame. Next, the VRML files were converted to a different format that can be imported to game engine platform, which should be widely used for integration system development. However, as the imported data files were converted from point cloud data, most game engines could not correctly read the complete data information. Specifically, the geometric data are interrelated; thus, after the data files are imported into the scene, the CFD model can be rendered. However, temperature information was stored in the vertices as numeric data only. To display temperature in game engine platform, temperature data were associated with RGB values by programming a shader script to recognize the vertex color. With the addition of this script, the complete CFD results, including geometry and color data, were able to display in the Unity Engine. In addition, the diameter of streamline and airflow speed were linked together.
The conventional way to create the CFD animation is to convert the same angle of the 3D model, at different times, into frame animation [37]. However, the CFD animation with the same angle would have many limitations, which might increase the difficulty of communication among the stakeholders. If we want to achieve a free observation angle, each angle change needs to be rendered in real time, which requires many system resources. Therefore, another solution is proposed. The imported data files were organized into a sequence, and each time step imported the next frame model and destroyed the previous frame model. A component based on JavaScript was programmed in order to control this operation. By this method, users could watch the animated CFD data from all directions.
The CFD animation and MR system were operated on different hardware, personal computer (PC) and HMD. The HMD Toolkit is a plug-in used to adjust the MR system, pack the game engine contents onto the HMD, and integrate the animated CFD post-processing data with the MR system. To ensure the correct display position of the simulated airflow model, the coordinates of the virtual world and the real world must be unified. A cube, created to locate the CFD result and target room, was also set as the world anchor, termed the “anchor cube”, to be able to adjust and ensure a stable registration. It was bound to the SLAM-generated mesh to avoid manual re-registration every time the application started up. Figure 2 is screenshots of the MR visualization results from the HMD which shows the initial state of indoor thermal environment in areas around the three different air conditioners; the streamline color indicates the temperature gradient, and the streamline diameter indicates the airflow rate.
As time passes, the airflow simulation results gradually became complicated, and users lose the big picture of the entire indoor environment. To solve this problem, a scale-change function was added into the MR system, where users can switch between full-scale and small-scale. Figure 3 shows the effect of small-scale model based on the CFD results of room 411. In the full-scale mode, users could experience and observe the surrounding airflow (as in Figure 2); in small-scale mode, users had a view of the entire room and therefore had a better overall understanding of the indoor thermal environment (as in Figure 3).
In addition to switching the scale, the thermal images and comfort maps that are commonly used in the thermal evaluation are integrated into the MR system, which makes it easy for nonprofessionals to participate in the design process.
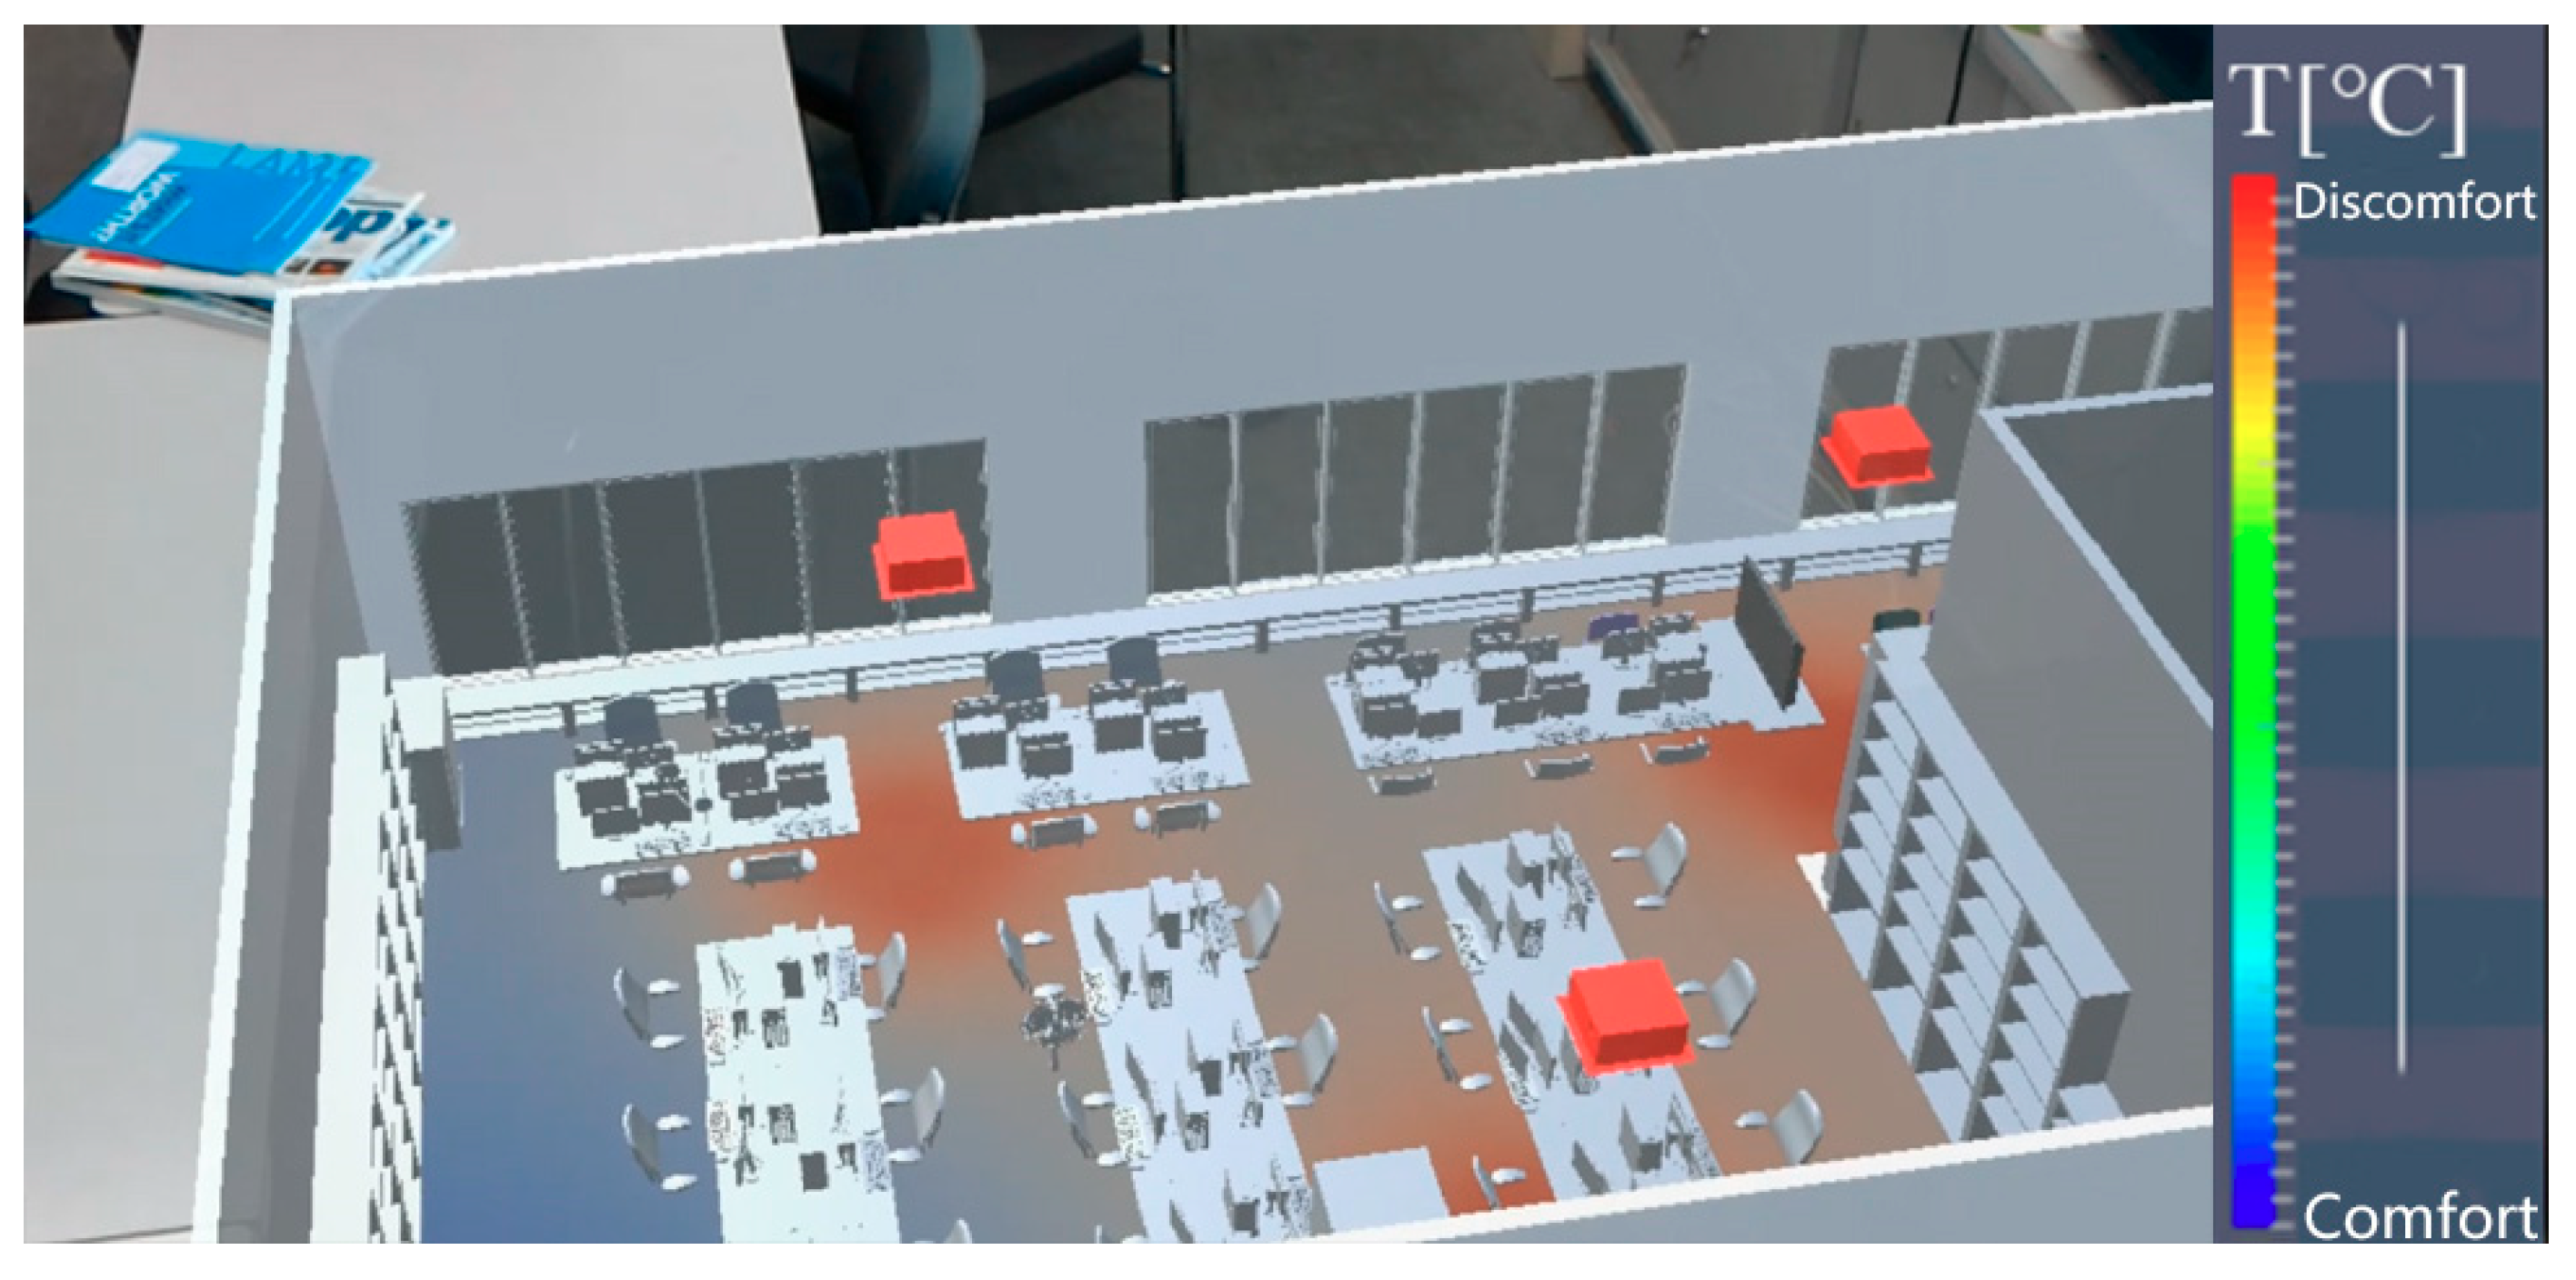
The heat map, calculated by CFD software, is registered in the real world by SLAM. The screenshots of the MR visualization result are shown in Figure 4. The three rectangular occlusions near the left ceiling light are the location of the air conditioner used in the calculation, and the occlusion around the bookcase and wall edges is generated in real time. Figure 5 shows the user’s visual experience of the heat map, combined with a small-scale model of room 411. Figure 6 shows the user’s visual experience of comfort map, where comfort zone shows blue color and discomfort zone shows red color. The comfort zone is where the indoor temperature is 27.2 °C in summer and 17 °C in winter, meanwhile, the upper and lower temperature difference is within 3 degrees [38,39]. Referring to Figure 5 and Figure 6, the user can easily know that the cause of the three circular red discomfort zones in Figure 6 is because the upper and lower temperature difference is too large under the air conditioners, and the corner red discomfort zone is formed because it is too far to transmit heat from the air conditioner in a short amount of time.
The convenient interaction methods are important for nonprofessionals. Currently, many of the HMD use gestures instead of mouse and keyboard to control the MR system. But gestures often fail to do some complicated operations and users feel tired after using gestures for a long time [25]. Compared with the gestures, the voice commands allow users to work hands-free and can easily complete a series of complicated operations [40]. Therefore, the voice commands were added to enable users to shift between different room scale, plan, heat map, comfort map, and streamline animation, to compare alternate designs.
4. Implementation
To test the proposed MR system with animated CFD in chapter 3, we developed the prototype system. An evaluation test was carried out in room 411, building M3, Suita Campus, Osaka University (north latitude: 34.82°; east longitude: 135.521°). Building M3 was completed in January 2015 and serves as a research building for the Graduate School of Engineering. The research office, lecture room, and laboratory were mixed, and room 411 is a student office. The total area of room 411 is 150 m2. There were three operating air conditioners and 18 windows without curtains; the anchor cube was set next to the front door (the same position in both the real and digital world), where registration was provided (Figure 7). The start date and time of analysis were set at 9:15 of 17 and 18 December, in winter (GMT + 9). The solar altitude was 20.65°, and the solar azimuth angle was 141.08° (due north, east, south, and west; azimuth is 0°, 90°, 180°, and 270°, respectively). As a control group, the shading plates were used on December 17 to cut off daylight. In the CFD analysis, the sun’s position was determined by using the above information. Solar radiation was 90.28 W/m2 in reference to the Japan Meteorological Agency database.
4.1. System Data Flow
The system data flow is shown in Figure 8. First, the BIM model is built with Autodesk Revit Architecture 2016. The completed full-scale model is exported in STL format. Normally, the mesh used in the CFD simulation is generated by the BlockMesh method or SnappyHexMesh software. The BlockMesh method creates a hexahedral structure lattice by inputting a vertex list and a rectangular parallelepiped. SnappyHexMesh software generates a hexahedron-based unstructured lattice by reforming the mesh created by BlockMesh according to the shape model as in the input STL files [41]. Pointwise is a mesh generation software that is widely used in various fields of research. It contains more supported interfaces than the normal methods, covering all of preprocessing from geometry model import to flow solver export [42]. The STL files are imported into Pointwise software, serving as a bridge between the model in Revit and the mesh in OpenFOAM (v1706). OpenFOAM is open-source software that is used to simulate the fluid mechanics phenomenon [43]. Imported STL files are generated to the grid, which must be manually modified because that generates a number of geometry errors. After error correction, the mesh is exported as geometry files into the solver folder in OpenFOAM. During CFD analysis, using OpenFOAM, users choose a specific solver to solve a class of problems. Different solvers have different physical property settings (e.g., viscosity coefficient, thermal expansion coefficient, and reference temperature). Altogether, the physical properties determine the thermal diffusivity (α), which measures the rate of heat transfer of material from the hot side to the cold side [44]. The thermal diffusivity (α) is equal to ν divided by ρr, where ν is the viscous diffusion rate and ρr is the Prandtl number. Gravity is normally set as 9.8 N/kg. Since a turbulence model has a stable state and an unstable state, for this study, situations were set to a stable state with several models built for each situation. As there were not many complex conditions in the simulated target for this study, the standard κ–ε model was chosen. Calculations used the finite-volume method to discretize partial differential equations. The buoyanBoussinesqPimpleFoam solver was chosen; the SolarLoad model was used to analyze the daylight factor; and boundary conditions, including mesh property, air pressure, temperature, and flow rate from the generating source, were set based on the BIM information. CFD analysis results were output in VTK format. After the VTK files were imported into ParaView, the point cloud data were transformed into a model containing temperature and airflow-distribution data. Then, the VRML files were converted to FBX files, using 3ds Max software. To output the results of the dynamic indoor thermal environment to HMD, importing the model files into Unity Engine and generating the animation sequence were first implemented. Finally, the project was packaged into an application and installed on the HMD.
MR visualization was implemented with HoloLens, an optical see-through HMD that projects virtual objects directly onto a translucent screen, to enable users to view the real-world scene directly. It uses four environment understanding cameras, with simultaneous localization and mapping algorithms to implement registration.
4.2. Analysis Conditions
4.3. Operating Environment
A prototype application was developed to verify the feasibility of the proposal. The prototype was completed according to the proposed method in Section 3.1. BIM modeling, mesh generation, and MR visualization were implemented with a desktop PC (A) (Specifications in Table 3). The CFD analysis was executed by using OpenFOAM software, which is developed by C++ language, running under the Linux system. Therefore, two solutions were available: a virtual machine that operated the OpenFOAM software and the Windows/Linux twin system. The former solution placed limits on CPU performance, as CFD analysis required a number of computing resources. A weak CPU performance slowed down the calculation speed such that feedback was delayed with modifications to the renovation design. The Windows/Linux twin system was very unstable, and systematic errors often occurred. Therefore, the prototype was split into two PCs, and CFD analysis was executed on PC (B) (specifications in Table 4).
4.4. Real-World Measurement
The system is not applied in the game field, but in the engineering field, for renovation design. We hope to reduce the gap between real-world sensors and simulation results by MR. Therefore, a measurement experiment was conducted for getting the tolerance value.
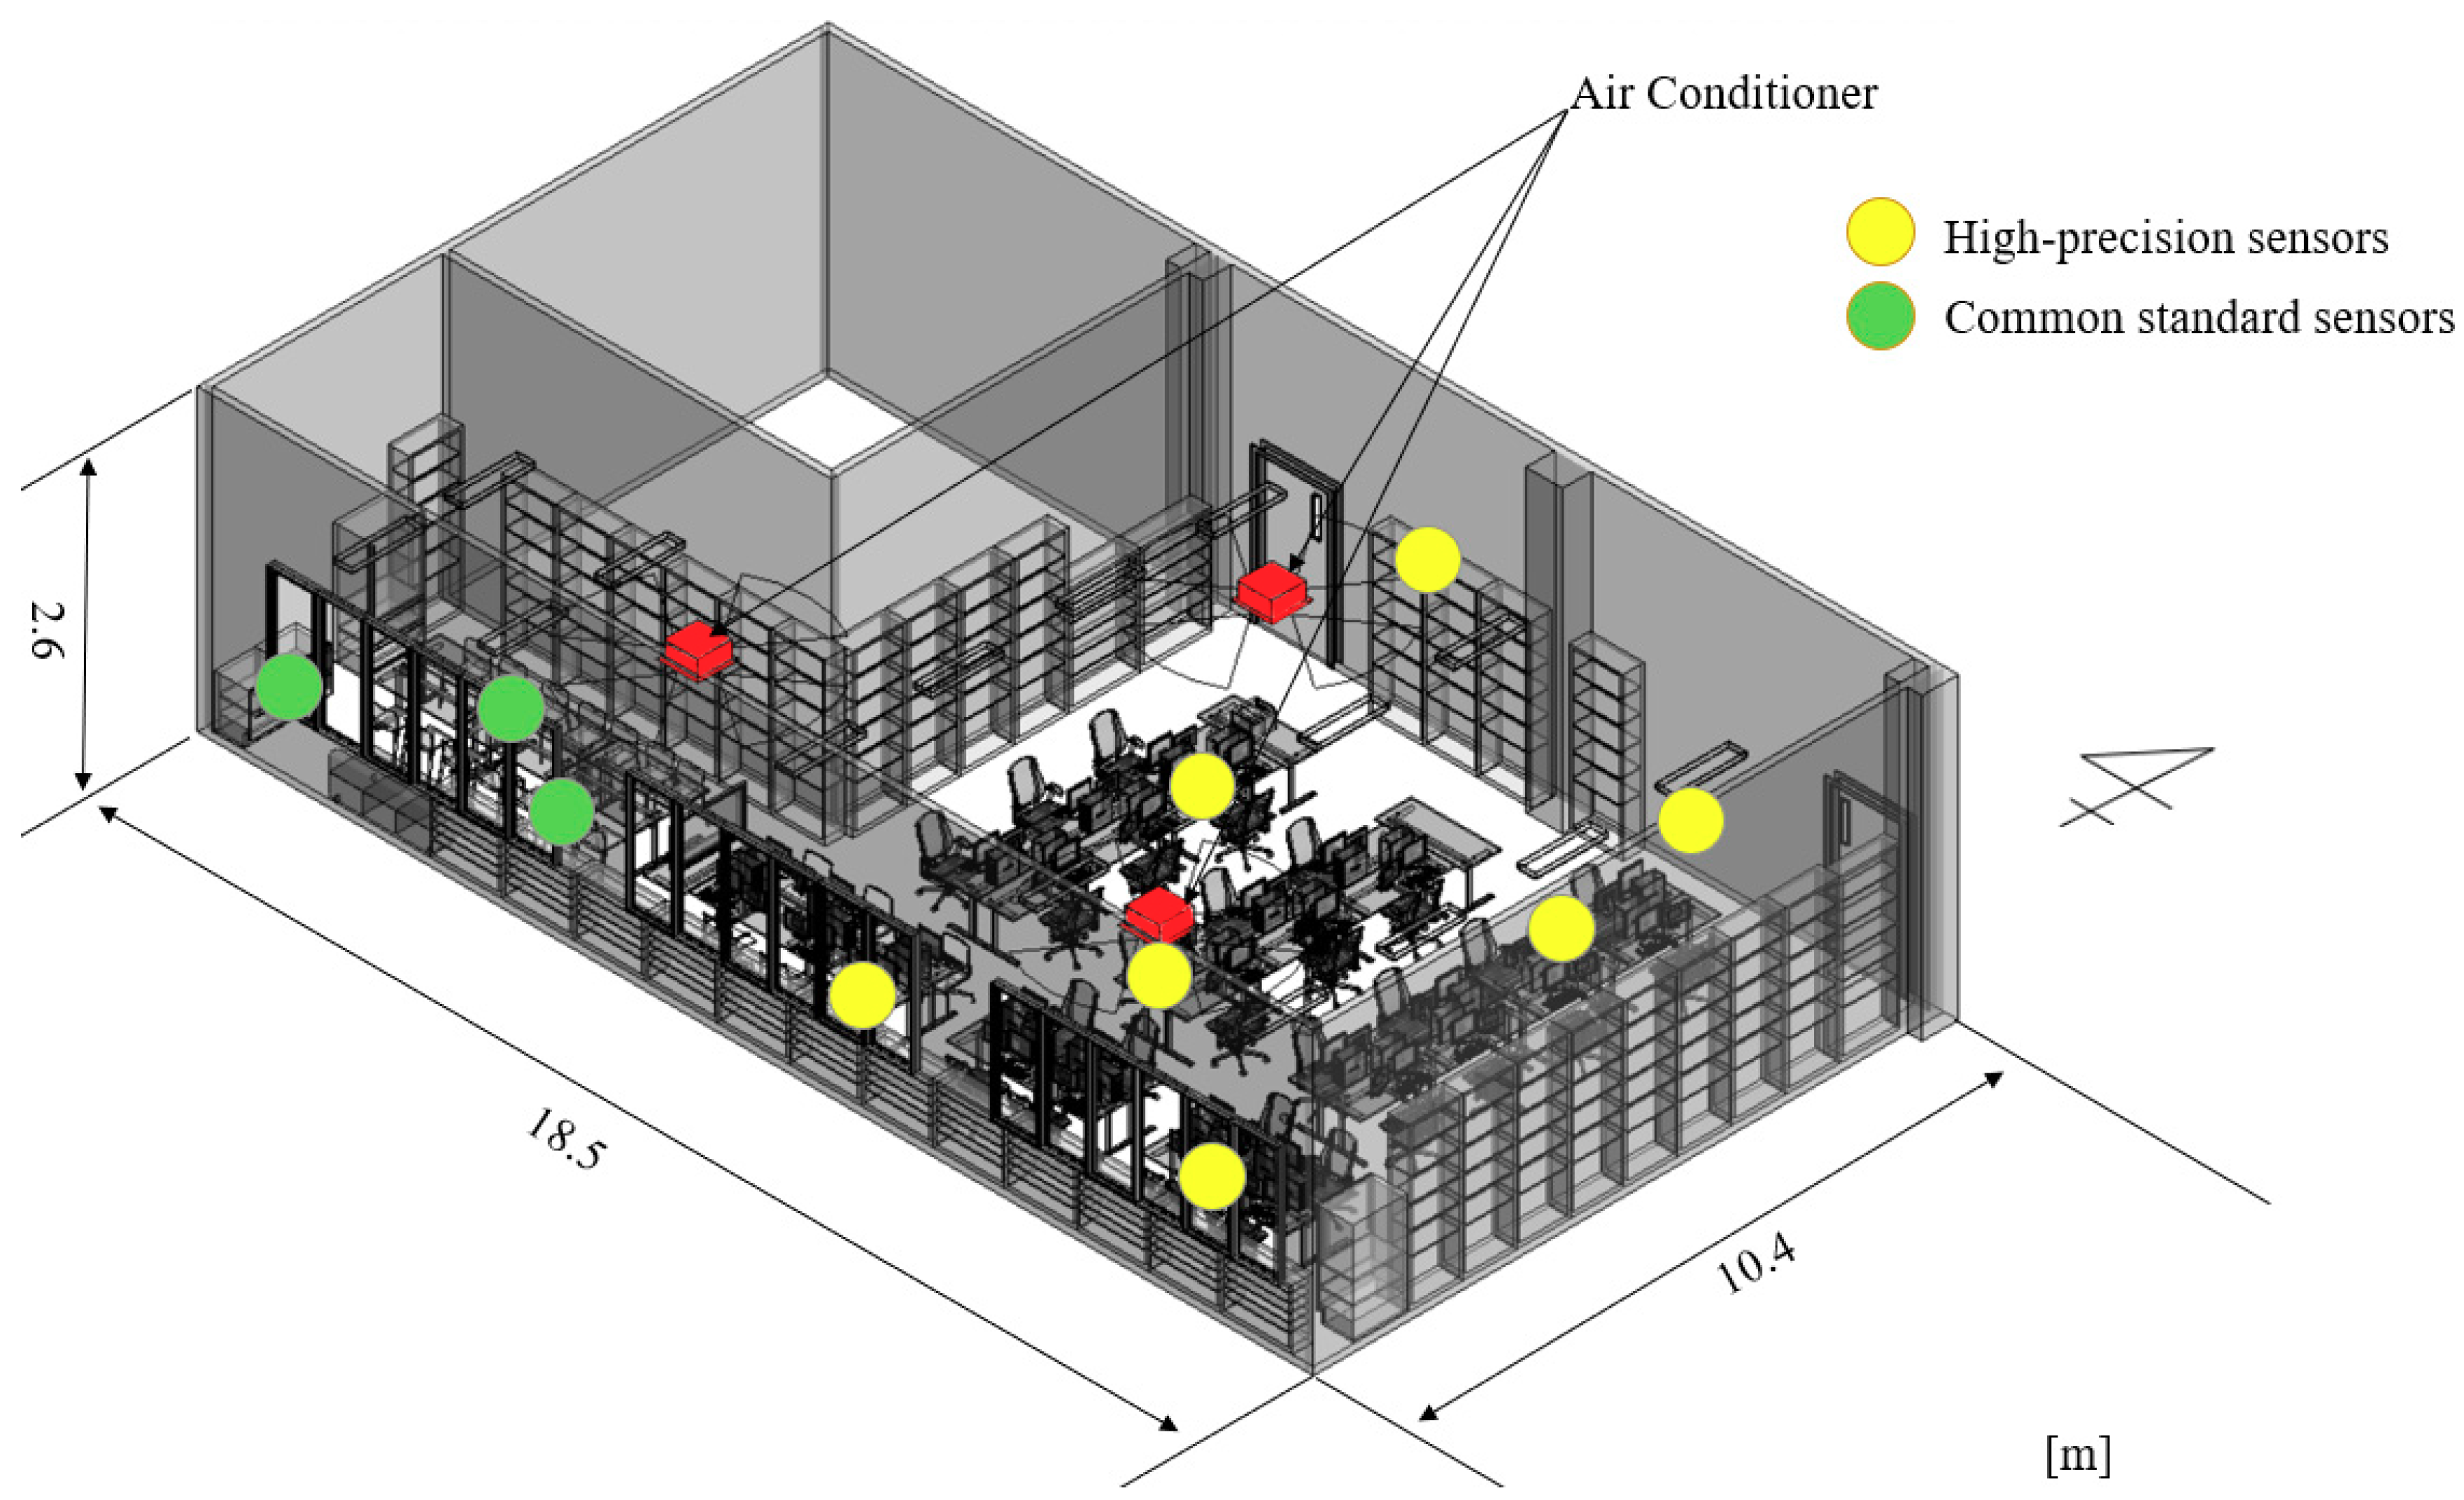
(1) Sensor installation: Ten sensors (Thermoclone G type, KN Laboratories) [45], as shown in Figure 11 and Table 5, were evenly distributed throughout the room.
(2) Comparison between experimental values and CFD simulation values: The analysis target time was set at 9:15 on 17 December, without daylight (with shading plates), and on 18 December, with daylight in winter. The air conditioner ran for 2 min, to get dynamic data. The measurement results in winter are shown in Table 6 and were compared with the simulated temperature values in Table 7. Each simulation contained more than 370,000 data points. The maximum and minimum temperature values were removed to eliminate systematic errors. For the remaining data, decimal points were removed to obtain an approximate value. According to the results, the average temperature difference in the experimental results was 2.8 °C, the average temperature difference for the simulation was 2.91 °C, an acceptable error difference of 0.11 °C. The tolerance without daylight is 0.55 °C, and the tolerance with daylight is 0.66 °C.
4.5. Simulation of Renovation Proposal
To operate the prototype system, we assume that room 411 needs renovation, and a survey of students was conducted to make different renovation plans.
The results of the survey were as follows:
- The east and west sides of the room hardly experienced any cool air from the air conditioner.
- Noise from the kitchen occasionally disturbed the student study area.
- Seats near the window were greatly affected by daylight.
The first problem related to uneven distribution of cool air from the air conditioner; the farther the distance from the air conditioner, the weaker its effects. Therefore, there needed to be some method to redistribute the cool air. To address the second problem of kitchen noise, installation of a partition wall between the kitchen and the study room was proposed. To address the third problem, the most direct way was to weaken the effects of daylight radiation on the indoor environment by changing the design of the windows.
The following settings were assumed in the evaluation experiments:
- Case a: Divide kitchen and students’ study space to reduce kitchen noise by partition.
- Case b: Divide the room into two parts: one provided with natural light and ventilation and the other enclosed in an air-conditioned environment, in order to meet the different needs of students.
- Case c: Divide according to the ratio of air-conditioning and room area for uneven temperature distribution of the air-conditioned room.
Three new building meshes were generated, as shown in Figure 12. The same boundary conditions as in Table 1 and Table 2 were applied, and the air conditioner ran for 2 min, same as the validation. Each case was divided into three solutions: the original single-glazing window design and the new proposal, double-glazing window design, combined with the original metal sash material and the resin sash material. The window thermal transmittance properties were calculated according to the method of Hosokawa et al. [19]. The values are shown in Table 8. Daylight affects the temperature of the indoor room, while the sash of different materials and the window of different structures would affect its result. Therefore, an experimental group without daylight is necessary.
5. Results
5.1. Numerical Results
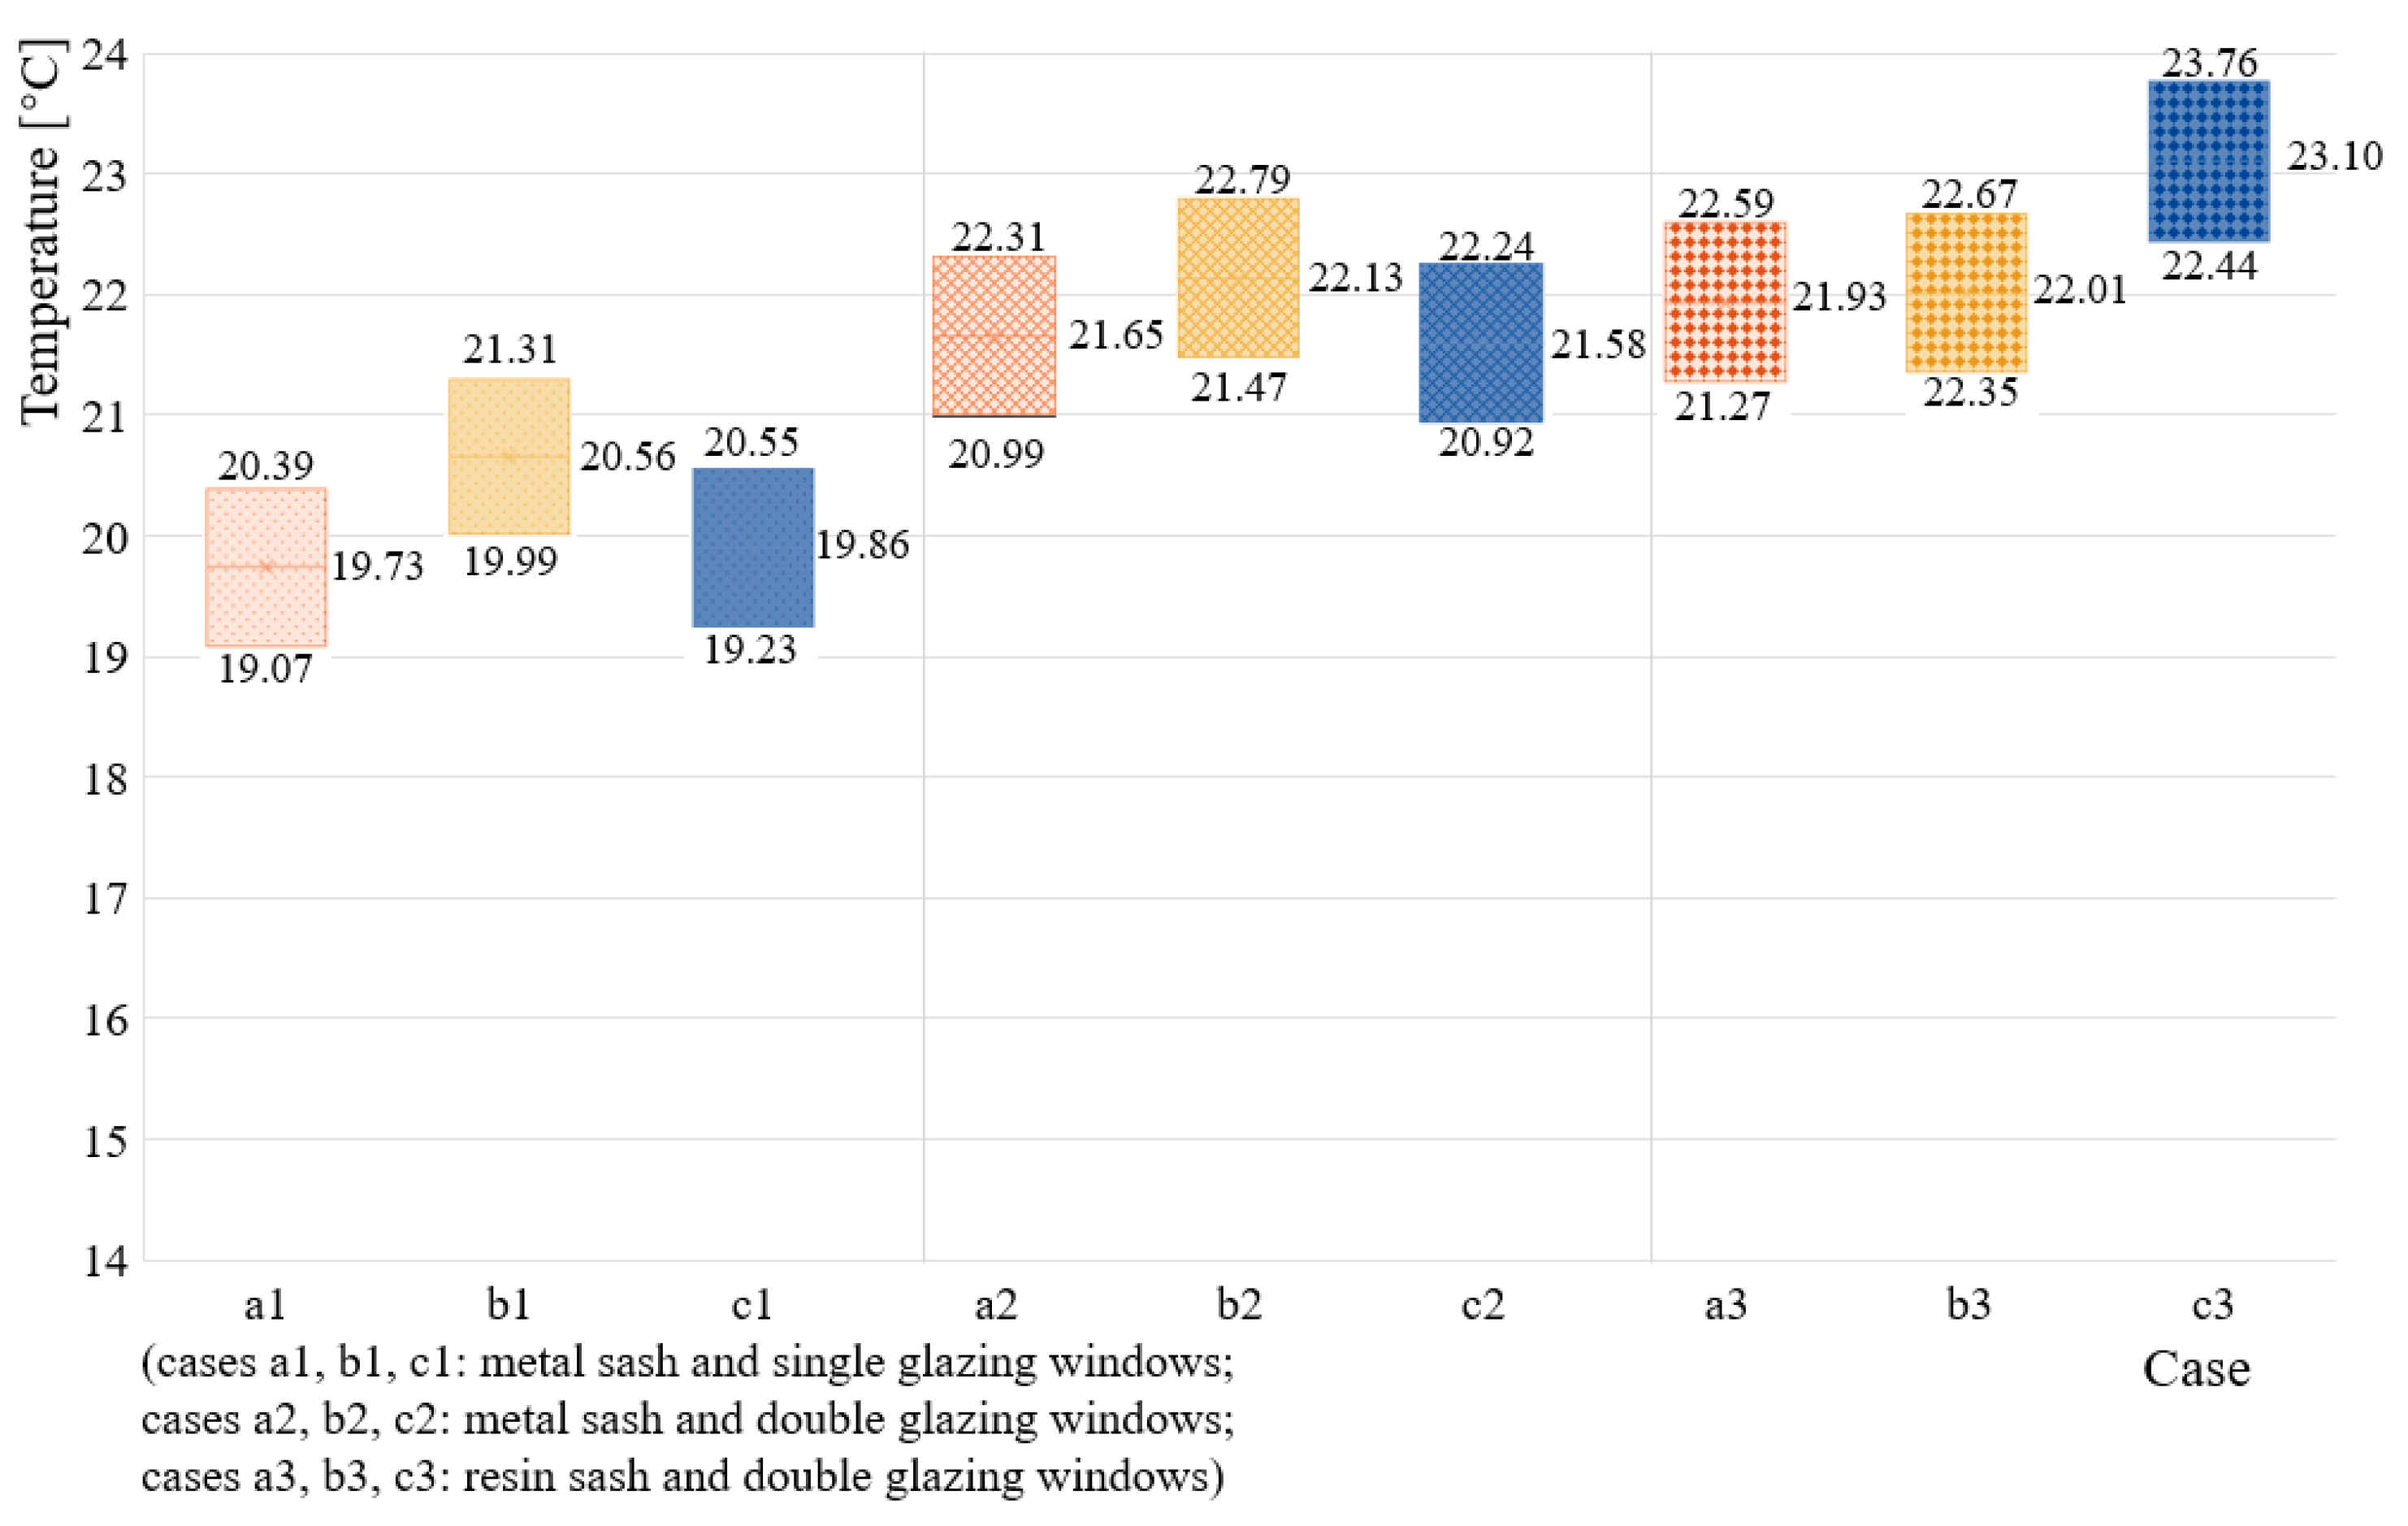
After combining three kinds of partition settings and three kinds of window designs, we simulated nine situations in OpenFOAM. The average temperature distribution of the CFD simulation results is shown in Figure 13. The results show that cases a3, b3, and c3 are the fastest warming proposals than the other cases, indicating that the resin sash and double glazing did help to improve the indoor thermal insulation effect. The highest average temperature was for case c3, which was 3.37 °C higher than that for case a1, which had the lowest average temperature. The temperature increased by 17.08% compared with the original data. In addition, adding the partition slightly improved the room temperature by improving the indoor airflow. The box diagram of the average temperature results (plus positive and negative error values: 0.66) shows in Figure 13 that, as the windows increase from single glazing to double glazing, the sash changes from metal to sash, the average temperature gradually rises. Some data from the proposed improvement methods reported lower temperatures. Therefore, an experimental group without daylight was conducted. The results in Table 9 show that, with the improvement of sash and window, the indoor average temperature has increased in accordance with the expected step. The reason for these results was that the metal sash can absorb the heat of daylight faster than resin sash, and it will cause the illusion that the indoor average temperature rises rapidly in the short time of the experiment. Therefore, the results were acceptable overall.
5.2. Visualization Results
The proposed cases a3, b3, and c3, using resin sash and double-glazing windows, showed a relatively good heating effect, with the least heat loss. They were visualized by the proposed integrated system installed at the HMD-HoloLens for further evaluation. HoloLens is a wireless HMD, so users can wear it indoors and move freely. The different renovation plans and visualized CFD results were displayed in the HoloLens. CG animation dynamically streams the indoor thermal environment, cycling 12 frames of model changes, one frame per second, so that the entire process of temperature and airflow changes can be observed. Users without professional skills can intuitively understand the CFD results and discuss the visual impact of the new renovation plan.
Figure 14, Figure 15 and Figure 16 show different visual effects of partition designs in cases a3, b3, and c3, respectively. The observational position and field of view of these screenshots are shown in Figure 17. These images show how the partitions affect airflow and how airflow gets around the partitions. Viewers thereby can witness the thermal changes in the environment as a result of the renovation. The occlusion of the partitions and CFD animation showed correctly, therefore, the partitions set in different cases seemed quite real. The thermal environment was expressed dynamically for viewers to experience the entire process of temperature and airflow changes. All of the above scenarios can be switched by voice commands like big (change to full scale), small (change to 1:10 scale), and change (change renovation plan). During the MR experience, the viewer found that, in case a3, although the air conditioner is close to the kitchen, the hot air does not quickly flow into the kitchen (Figure 14). As a result, the temperature of the kitchen is lower than the other area. In case b3, the viewer observed that the window area heats up quickly, and the streamline around the viewer is always blue, which means the temperature is still low (Figure 15). This is because the two air conditioners are isolated in the window area, which makes it difficult for the temperature in the other area to rise. The case c3 looks reasonable: the hot air quickly flowed around the room, and the streamline color quickly turned red. This means that the temperature in the room quickly reaches the set value. Therefore, after the MR experience, case c3 looks better than other proposals in terms of thermal environment. This experience allows all stakeholders to intuitively understand the designer’s ideas and more efficiently evaluate different renovation plans.
6. Discussion
In conventional renovation projects, the building design process tends to be inefficient because the client does not fully understand the designer’s intention. Therefore, this study attempted to tackle the issue by building an MR system that integrates CFD results to enable users. The indoor thermal environment, which is an important part of the building renovation, is selected as the target of this verification. To visualize indoor temperature and airflow using the HMD-HoloLens, the visualization of the results in HoloLens showed that the proposal is feasible for indoor thermal environmental design analysis during the building design process. The observer can switch between different scenes by using voice commands. While observing the design from different angles in an immersive and interactive way, the different thermal environment results brought by different designs are also visualized. Conventional CFD numerical data are difficult for nonprofessionals. On the other hand, visualization through CFD animation (i) is intuitive, (ii) is easy to understand, and (iii) directly transmits information to users. In a typical design process, there is a lack of coordination between designers from different departments. Hence, there is a need for an evaluation method that is accurate, quick, and easy to understand. When introducing renovation plans to stakeholders, the expertise of different departments is not interlinked. Therefore, the method proposed in this study can visually show all the necessary information, which strengthens the communication between different departments, and also new proposals can be presented in a short period of time. In this research project, we proposed three renovation plans to improve the indoor environment of the target room. During the experience, observers quickly understood the indoor thermal environment information brought by the animated CFD visualization results, and it is easy to visually feel the difference brought by the three plans. This proves that this proposal is really helpful for nonprofessionals to quickly understand and compare different renovation designs. The CFD results were presented on HMDs as full-scale models, firstly to enable viewers to experience the superimposition of virtual objects onto the real world. However, one disadvantage of the full-scale models is that the detailed information is too rich, resulting in users having no concept of the big map. It was found that, in some cases, viewers understood a phenomenon more quickly by using a small-scale model rather than a full-scale model. Therefore, the conversion function between two models controlled by voice command has been added into this system. In the small-scale model, viewers can quickly understand the entire indoor thermal condition. Nevertheless, compared with the full-scale method, this method replaces the real indoor environment with the BIM model, which leads to a lack of immersion for the observer. The registration accuracy of the SLAM-based MR was verified by measuring the location of two anchor cubes at a distance of 5 m in the real world and compared it with the model in the virtual world. The accuracy of the SLAM-based method is based on the environment-scan data of the RGB-D cameras. Therefore, the accuracy will increase with the richness of the scan data. As a result, after three scans of the surrounding environment, the average of the error is 5 mm.
The disadvantage of the HoloLens is that, despite its field of view, which is approximately 33.4° in the horizontal direction and 17.5° in the vertical direction, the experience is like viewing the digital world through a small magic window at the center of one’s field of vision.
CFD analysis requires numerous resources and real-time calculation: a future research topic for investigation. The average calculation time for CFD analysis in the case studies was 68 minutes and 38 seconds for PC (B) and about 20 minutes of manual operation for PC (A). Alternatively, fast fluid dynamics (FFD), which is a real-time technique, calculates fluid visualization with calculation speeds that are hundreds of times faster compared with CFD [46]. Although FFD sacrifices accuracy, its real-time feedback poses a huge potential for building-design simulation. If real-time feedback and evaluation are implemented, they will greatly increase the effectiveness of renovation design. Therefore, an FFD-based system is a consideration.
7. Conclusions
This research proposed a new methodology to support building-renovation design by integrating CFD analysis and MR technology. In addition, a prototype application was developed to verify the feasibility by visualizing indoor thermal environment, in order to enable the simultaneous designing of the building plan and thermal environment during the renovation process. The proposed system provided an intuitive and efficient solution, in comparison to conventional methods, by using CFD animation and MR experience. The entire thermal-change process was animated in HMD. Different partition designs, window design, and glass material were compared in the simulation, and the optimal proposal could be studied. After the immersive experience of different renovation plans, comparing their pros and cons, people without professional skills could also understand the design content independently and participate in the building design more smoothly. The owners are enabled to put forward their own ideas and then discuss immediately with design specialists, within the MR system, about design possibilities.
As a future work, the proposed method will be introduced into other targets of building-renovation design. Similarly, the objective is to make stakeholders easy to understand and easy to communicate. Aside from the current indoor environmental factors simulated in this study, there are many other factors, such as artificial light, facility, and sound, which are also necessary for building-renovation design. Adding these new factors into simulation systems will contribute to the improvement of renovation plans. Moreover, the targets of visualization are not limited to CFD results. Any numerical value and information difficult for nonprofessionals to understand could be added to the proposed system after being visualized. The system can be used in any other building-renovation process, to improve the efficiency of the communication of stakeholders.
Additionally, it is necessary to find an alternative optimization method in order to simplify the CFD animation generation process. Currently, the process is a complex sequence that entails a lot of manual operation, which brings a lot of inconvenience to the designers. Moreover, the process to obtain the CFD simulation results is also a long-time operation. Because timely feedback is important to building consensus, a renovation design system that provides visualization information in real time should be considered. If CFD simulation and animation can be carried out in real time, the results of a proposed design can be experienced immediately, and design feedback is thereby greatly enhanced. Therefore, using methods such as GPU calculation to speed up CFD calculation to real-time standards, or switching the CFD simulation tool to a faster one, such as FFD, are topics for future work.
Author Contributions
Conceptualization, Y.Z. and T.F.; methodology, Y.Z. and T.F.; software, Y.Z.; resources, T.F. and N.Y.; writing—original draft preparation, Y.Z.; writing—review and editing, T.F. and N.Y; visualization, Y.Z. and T.F.; funding acquisition, T.F. All authors have read and agreed to the published version of the manuscript.
Funding
This research was funded by a research grant from the Nohmura Foundation for Membrane Structure’s Technology and by JSPS KAKENHI Grant Number JP16K00707.
Conflicts of Interest
The authors declare no conflicts of interest.
References
- Banjo, S.; Masayuki, H. Existing housing-related housing policy trends. In Stock & Renovation 2014; Yasuyo, W., Ed.; HOME’S Research Institute: Tokyo, Japan, 2014; pp. 16–27. [Google Scholar]
- Tanabe, S.; Iwahashi, Y.; Tsushima, S.; Nishihara, N. Thermal Comfort and Productivity in Offices Under Mandatory Electricity Savings after the Great East Japan Earthquake. Archit. Sci. Rev. 2013, 56, 4–13. [Google Scholar] [CrossRef]
- Zhu, Y.; Ouyang, Q.; Cao, B.; Zhou, X.; Yu, J. Dynamic Thermal Environment and Thermal Comfort. Indoor Air 2016, 26, 125–137. [Google Scholar] [CrossRef]
- Hurnik, M.; Specjal, A.; Popiolek, Z.; Kierat, W. Assessment of Single-family House Thermal Renovation based on Comprehensive On-site Diagnostics. Energy Build. 2018, 158, 162–171. [Google Scholar] [CrossRef]
- Chronis, A.; Dubor, A.; Cabay, E. Integration of CFD in Computational Design: An evaluation of the current state of the art. In Proceedings of the 35th International Conference on Education and Research in Computer Aided Architectural Design in Europe, Rome, Italy, 20–22 September 2017; Volume 1, pp. 601–610. [Google Scholar]
- Laplante, P.A.; Neill, C.J. The Demise of the Waterfall Model Is Imminent and Other Urban Myths. Acmqueue 2004, 1, 10–15. [Google Scholar]
- Den Hartog, J.P.; Koutamanis, A.; Luscuere, P.G. Possibilities and Limitations of CFD Simulation for Indoor Climate Analysis. In Proceedings of the 5th International Conference on Design and Decision Support Systems in Architecture and Urban Planning—Part One: Architecture Proceedings, Nijkerk, The Netherlands, 22–25 August 2000; pp. 152–167. [Google Scholar]
- Eastman, C.; Teicholz, P.; Sacks, R.; Liston, K. BIM as a Lifecycle Platform. In BIM Handbook: A Guide to Building Information Modeling for Owners, Managers, Designers, Engineers and Contractors, 3rd ed.; Rafael, S., Chuck, E., Ghang, L., Paul, T., Eds.; Wiley: Hoboken, NJ, USA, 2018; pp. 18–19. [Google Scholar]
- Ghassemi, R.; Becerik-Gerber, B. Transitioning to Integrated Project Delivery: Potential barriers and lessons learned. Lean Constr. 2011, 32–52. Available online: https://www.leanconstruction.org/media/docs/ktll-add-read/Transitioning_to_Integrated_Project_Delivery_Potential_barriers_and_lessons_learned.pdf (accessed on 28 December 2019).
- Albatayneh, A.; Alterman, D.; Page, A.; Moghtaderi, B. Discrepancies in Peak Temperature Times using Prolonged CFD Simulations of Housing Thermal Performance. Energy Procedia 2017, 115, 253–264. [Google Scholar]
- Emond, F.; Ahn, J.; Kim, J. Computing Thermal Bridge of VIP in Building Retrofits using DesignBuilder. Energy Procedia 2015, 78, 400–405. [Google Scholar]
- Fukuda, T.; Mori, K.; Imaizumi, J. Integration of CFD, VR, AR and BIM for Design Feedback in a Design Process—An Experimental Study. In Proceedings of the 33rd International Conference on Education and Research in Computer Aided Architectural Design in Europe, Vienna, Austria, 16–18 September 2015; Volume 1, pp. 665–672. [Google Scholar]
- Steuer, J. Defining Virtual Reality: Dimensions determining telepresence. J. Commun. 1992, 42, 73–93. [Google Scholar] [CrossRef]
- Savioja, L.; Mantere, M.; Olli, I.; Seppo, Ä.; Matti, G.; Jyrki, I. Utilizing Virtual Environments in Construction Projects. J. Inf. Technol. Constr. 2003, 8, 85–99. [Google Scholar]
- Goldsmith, D.; Liarokapis, F.; Malone, G.; Kemp, J. Augmented Reality Environmental Monitoring Using Wireless Sensor Networks. In Proceedings of the 12th International Conference on Information Visualization, Shanghai, China, 9–11 July 2008; pp. 539–544. [Google Scholar]
- Milgram, P.; Kishino, F. A Taxonomy of Mixed Reality Visual Displays. IEICE Trans. Inf. Syst. 1994, 77, 1321–1329. [Google Scholar]
- Berger, M.; Cristie, V. CFD Post-processing in Unity3D. Procedia Comput. Sci. 2015, 51, 2913–2922. [Google Scholar] [CrossRef] [Green Version]
- Ohno, N.; Kageyama, A. Scientific Visualization of Geophysical Simulation Data by the CAVE VR System with Volume Rendering. Phys. Earth Planet 2007, 163, 305–311. [Google Scholar] [CrossRef]
- Hosokawa, M.; Fukuda, T.; Yabuki, N.; Michikawa, T.; Motamedi, A. Integrating CFD and VR for indoor thermal design feedback. In Proceedings of the 21st International Conference on Computer-Aided Architecture Design Research in Asia, Melbourne, Australia, 30 March–2 April 2016; pp. 663–672. [Google Scholar]
- Malkawi, A.M.; Srinivasan, R.S. A New Paradigm for Human-Building Interaction: The Use of CFD and Augmented Reality. Autom. Constr. 2005, 14, 71–84. [Google Scholar] [CrossRef]
- Furubayashi, S.; Yabuki, N.; Fukuda, T. Development of Display System of Environmental Simulation Results Using Point Cloud Data and Augmented Reality. In Proceedings of the International Conference on Cooperative Design, Visualization and Engineering, Osaka, Japan, 2–5 September 2012; JSCE: Kansai Branch, Japan, 2012; Volume 6, pp. 1–2. [Google Scholar]
- Heuveline, V.; Ritterbusch, S.; Ronnas, S. Augmented Reality for Urban Simulation Visualization. Prepr. Ser. Eng. Math. Comput. Lab 2011, 16, 1–8. [Google Scholar]
- Fukuda, T.; Yokoi, K.; Yabuki, N.; Motamedi, A. An indoor thermal environment design system for renovation using augmented reality. J. Comput. Des. Eng. 2018. [Google Scholar] [CrossRef]
- Fiorentino, M.; Uva, A.E.; Gattullo, M.; Debernardis, S.; Monno, G. Augmented reality on large screen for interactive maintenance instructions. Comput. Ind. 2014, 65, 270–278. [Google Scholar] [CrossRef]
- Nishihara, A.; Junior, J.O. Object Recognition in Assembly Assisted by Augmented Reality System. In Proceedings of the 3rd International Conference on SAI Intelligent Systems Conference, Fukuoka, Japan, 10–11 November 2015; pp. 400–407. [Google Scholar]
- Buratti, C.; Palladino, D.; Moretti, E. Prediction of Indoor Conditions and Thermal Comfort Using CFD Simulations: A Case Study Based on Experimental Data. Energy Procedia 2017, 126, 115–122. [Google Scholar] [CrossRef]
- Yoon, Y.; Woo Moon, J.; Kim, S. Development of Annual Daylight Simulation Algorithms for Prediction of Indoor Daylight Illuminance. Energy Build. 2016, 118, 1–17. [Google Scholar] [CrossRef]
- Fakra, H.; Miranville, F.; Boyer, H.; Guichard, S. Development of a New Model to Predict Indoor Daylighting: Integration in CODYRUN Software and Validation. Energy Convers. Manag. 2011, 52, 2724–2734. [Google Scholar] [CrossRef] [Green Version]
- Yao, J.; Zhu, N. Evaluation of Indoor Thermal Environmental, Energy and Daylighting Performance of Thermotropic Windows. Build. Environ. 2012, 49, 283–290. [Google Scholar] [CrossRef]
- Bernard, P.; Eloise, S.; Samuel, P.; Julien, B. Electrochromic Glazings: Dynamic Simulation of Both Daylight and Thermal Performance. Energy Procedia 2017, 122, 199–204. [Google Scholar]
- Yan, D. DeST—An Integrated Building Simulation Toolkit Part I: Fundamentals. Build. Simul. 2008, 1, 95–110. [Google Scholar] [CrossRef]
- Paule, B.; Flourentzou, F.; Pantet, S.; Boutillier, J.; Heeren, N.; Voellinger, A.B.T. DIAL+ Suite: A new suite of tools to optimize the global energy performance of room design. In Status Seminar; ETH-Zürich: Zürich, Switzerland, 2012. [Google Scholar]
- Panchal, H.; Shah, P. Modeling and verification of hemispherical solar still using ANSYS CFD. Int. J. Energy Environ. 2013, 4, 427–440. [Google Scholar]
- Zhangping, L.; Chuanping, L.; Li, W.; Na, L. Effect of Natural Ventilation on Indoor Air Quality and Thermal Comfort in Dormitory during Winter. Build. Environ. 2017, 125, 240–247. [Google Scholar]
- Kubota, T.; Chyeeb, D.T.H.; Ahmadc, S. The Effects of Night Ventilation Technique on Indoor Thermal Environment for Residential Buildings in Hot-Humid Climate of Malaysia. Environ. Eng. 2009, 41, 829–839. [Google Scholar] [CrossRef]
- Japan Meteorological Agency. Annual Solar Report. Available online: http://www.data.jma.go.jp/ (accessed on 30 November 2019).
- Michael, L.; Seth, B.; Michael, T.; Gary, M. 3D Shape and Texture Morphing Using 2D Projection and Reconstruction. Comput. Graph. 2015, 51, 146–156. [Google Scholar]
- Matsuo, J.; Murayama, T.; Tochihara, Y. Effects of Different Vertical Air Temperatures on Thermal Comfort and Mental Performance. Jpn. Soc. Biometeorol. 2006, 43, 79–89. [Google Scholar]
- Jin, M.; Zuo, W.; Chen, Q. Improvements of Fast Fluid Dynamics for Simulating Air Flow in Buildings. Numer. Heat Transf. Part B Fundam. 2012, 62, 419–438. [Google Scholar] [CrossRef]
- Werrlich, S.; Daniel, A.; Ginger, A.; Nguyan, P.A.; Notni, G. Comparing HMD-based and Paper-based Training. In Proceedings of the 17th International Conference on IEEE International Symposium on Mixed and Augmented Reality, Munich, Germany, 16–20 October2018; pp. 134–142. [Google Scholar]
- Open CAE Society. Numerical Analysis of Heat Transfer and Flow by OpenFOAM; Yusuke, F., Ed.; Mori Kita: Tokyo, Japan, 2018. [Google Scholar]
- Pointwise. CFD Meshing Tool. Available online: http://www.pointwise.com/ (accessed on 30 November 2019).
- OpenFOAM. Release History. Available online: https://www.openfoam.com/ (accessed on 30 November 2019).
- Thakre, S.S.; Joshi, J.B. CFD modeling of heat transfer in turbulent pipe flows. AIChE J. 2000, 46, 1798–1812. [Google Scholar] [CrossRef]
- Thermoclon. Temperature Data Logger “Thermoclon G Type”. Available online: http://www.kn-labs.com/thermochron.htm (accessed on 30 November 2019).
- Katsuno, J.B.; Jal, R.H.; Kikuchi, Y. Investigation of the Thermal Comfort and Overall Comfort in the Living Room; Architectural Institute of Japan: Tokyo, Japan, 2011; pp. 385–386. [Google Scholar]
Figure 1.
System overview.

Figure 2.
Thermal environment performance in the head-mounted display (HMD).

Figure 3.
HMD view of room 411 small-scale model (1/10) using computational fluid dynamics (CFD) results.
Figure 3.
HMD view of room 411 small-scale model (1/10) using computational fluid dynamics (CFD) results.

Figure 4.
HMD view of indoor heat map.

Figure 5.
Heat map of room 411 small-scale model (1/10).

Figure 6.
Comfort map of room 411 small-scale model (1/10).

Figure 7.
Room 411 floor plan.

Figure 8.
System data flow.

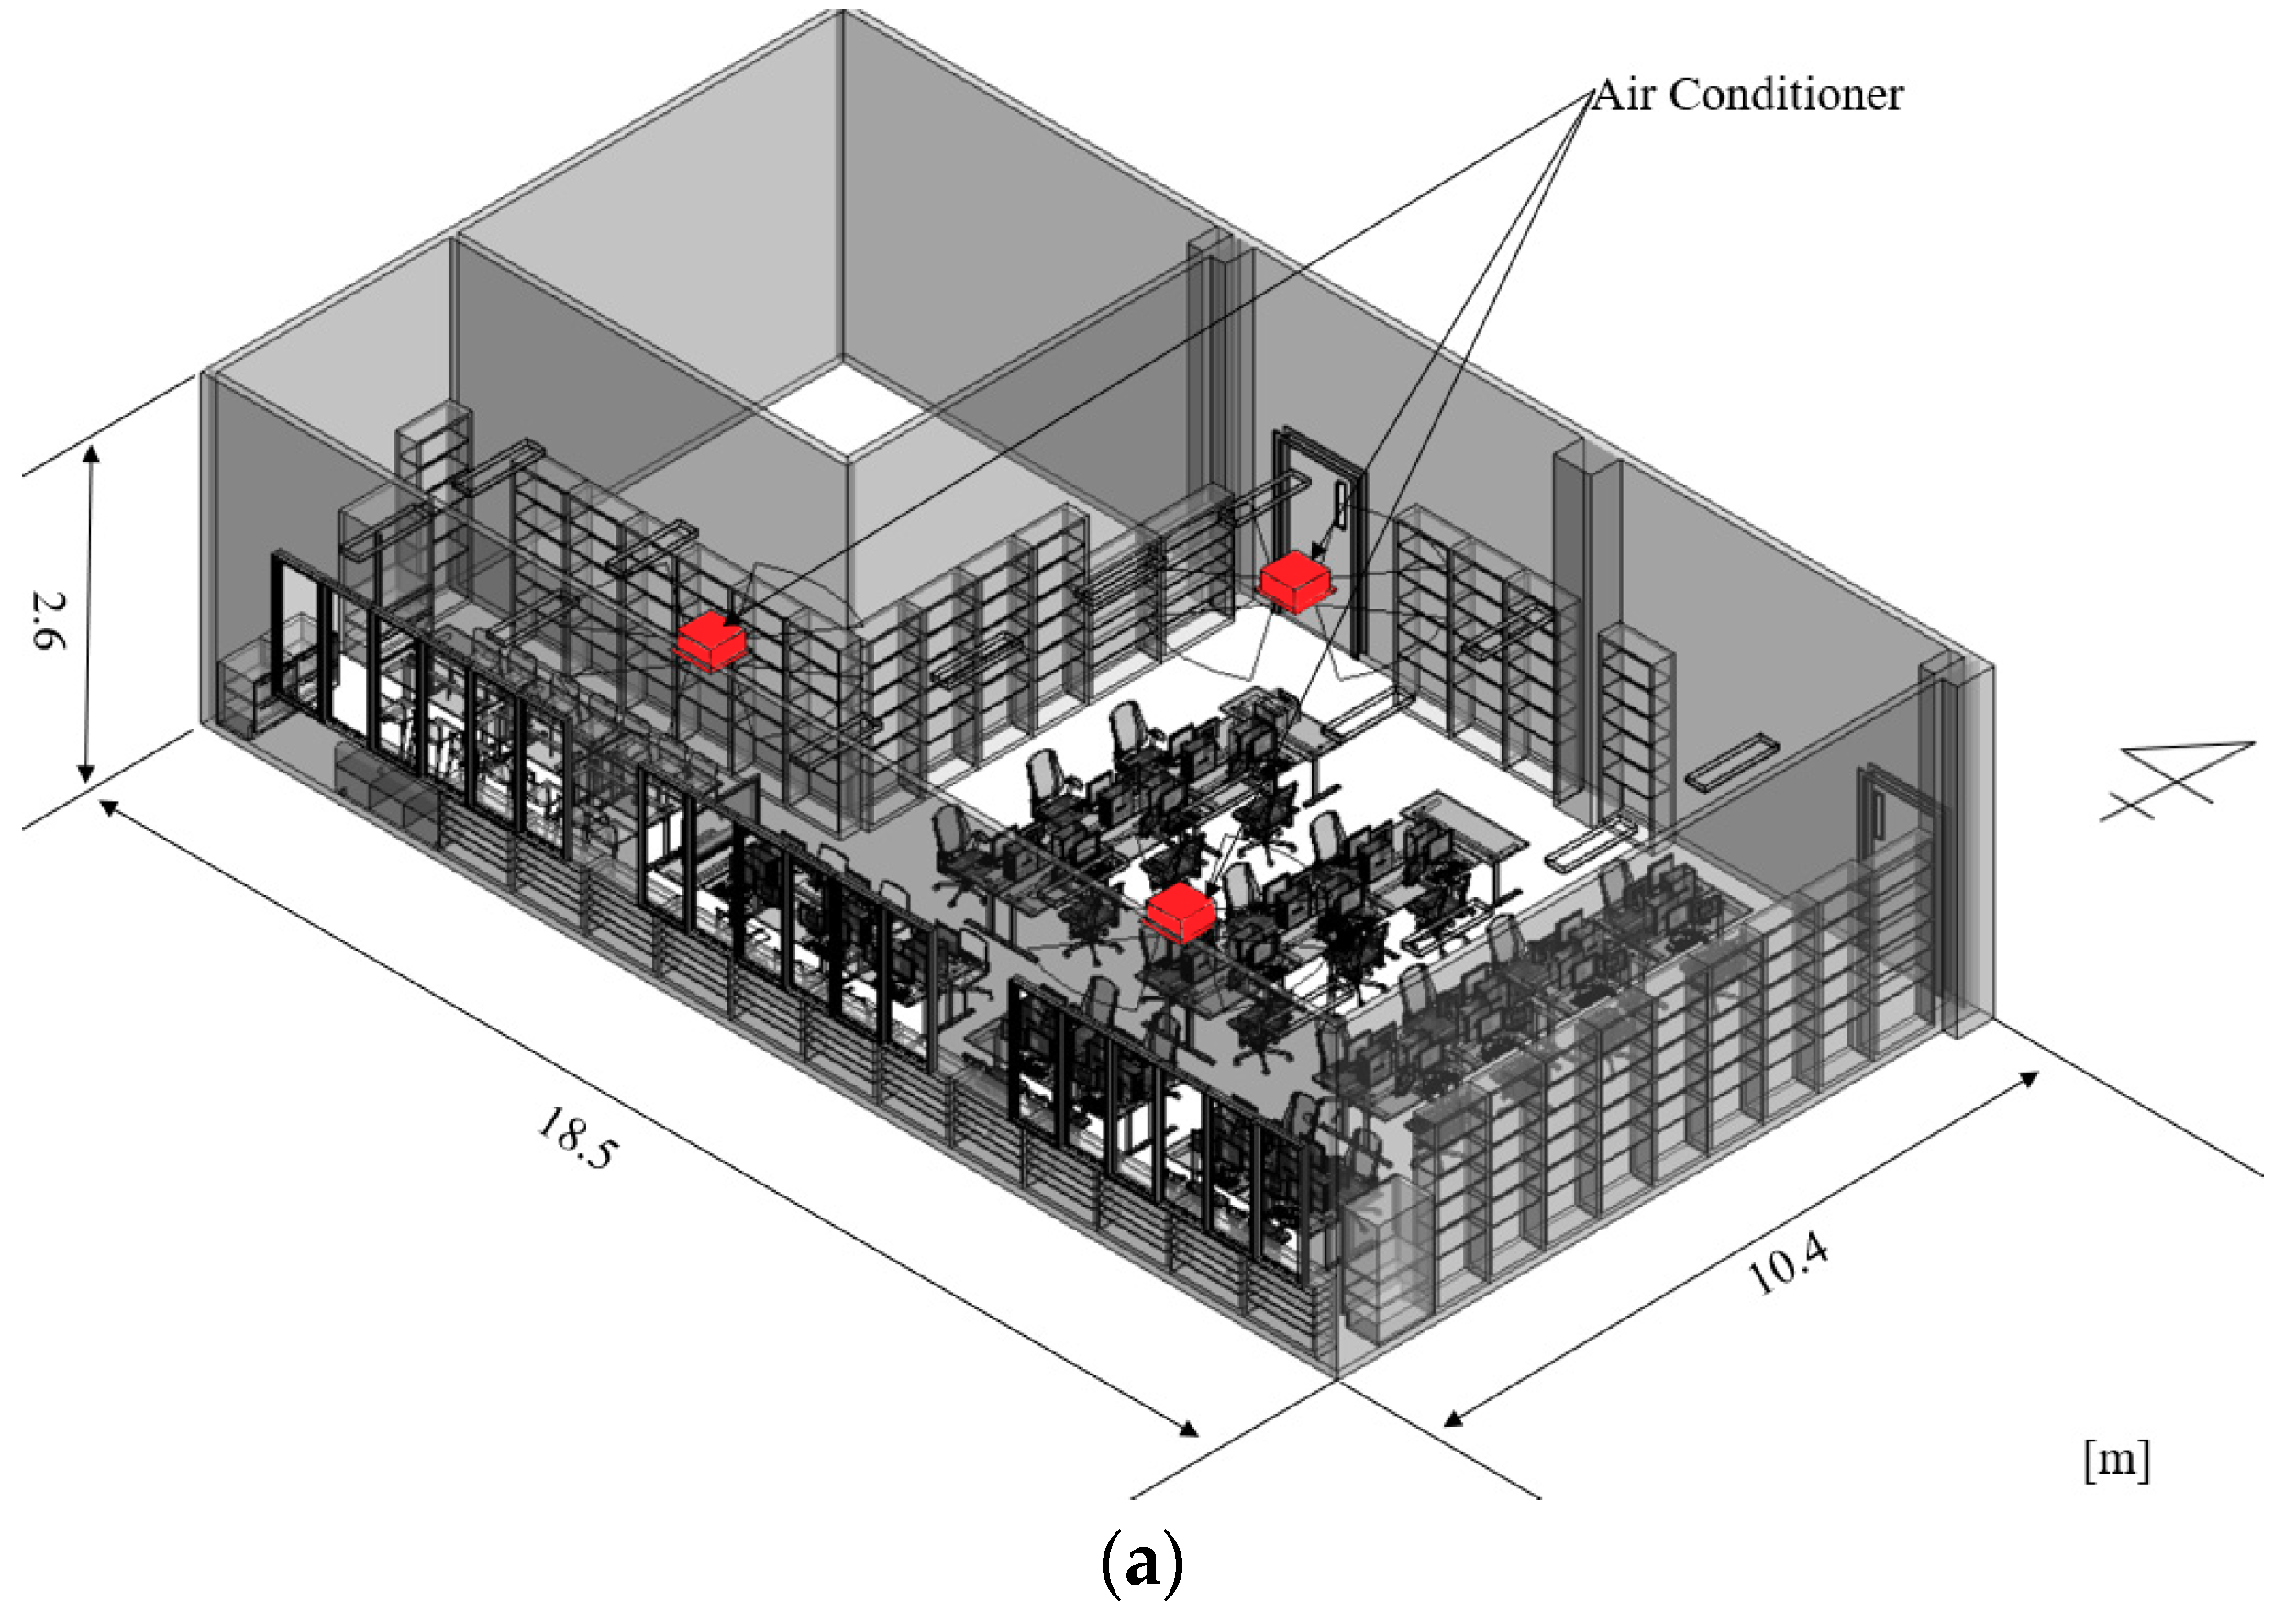
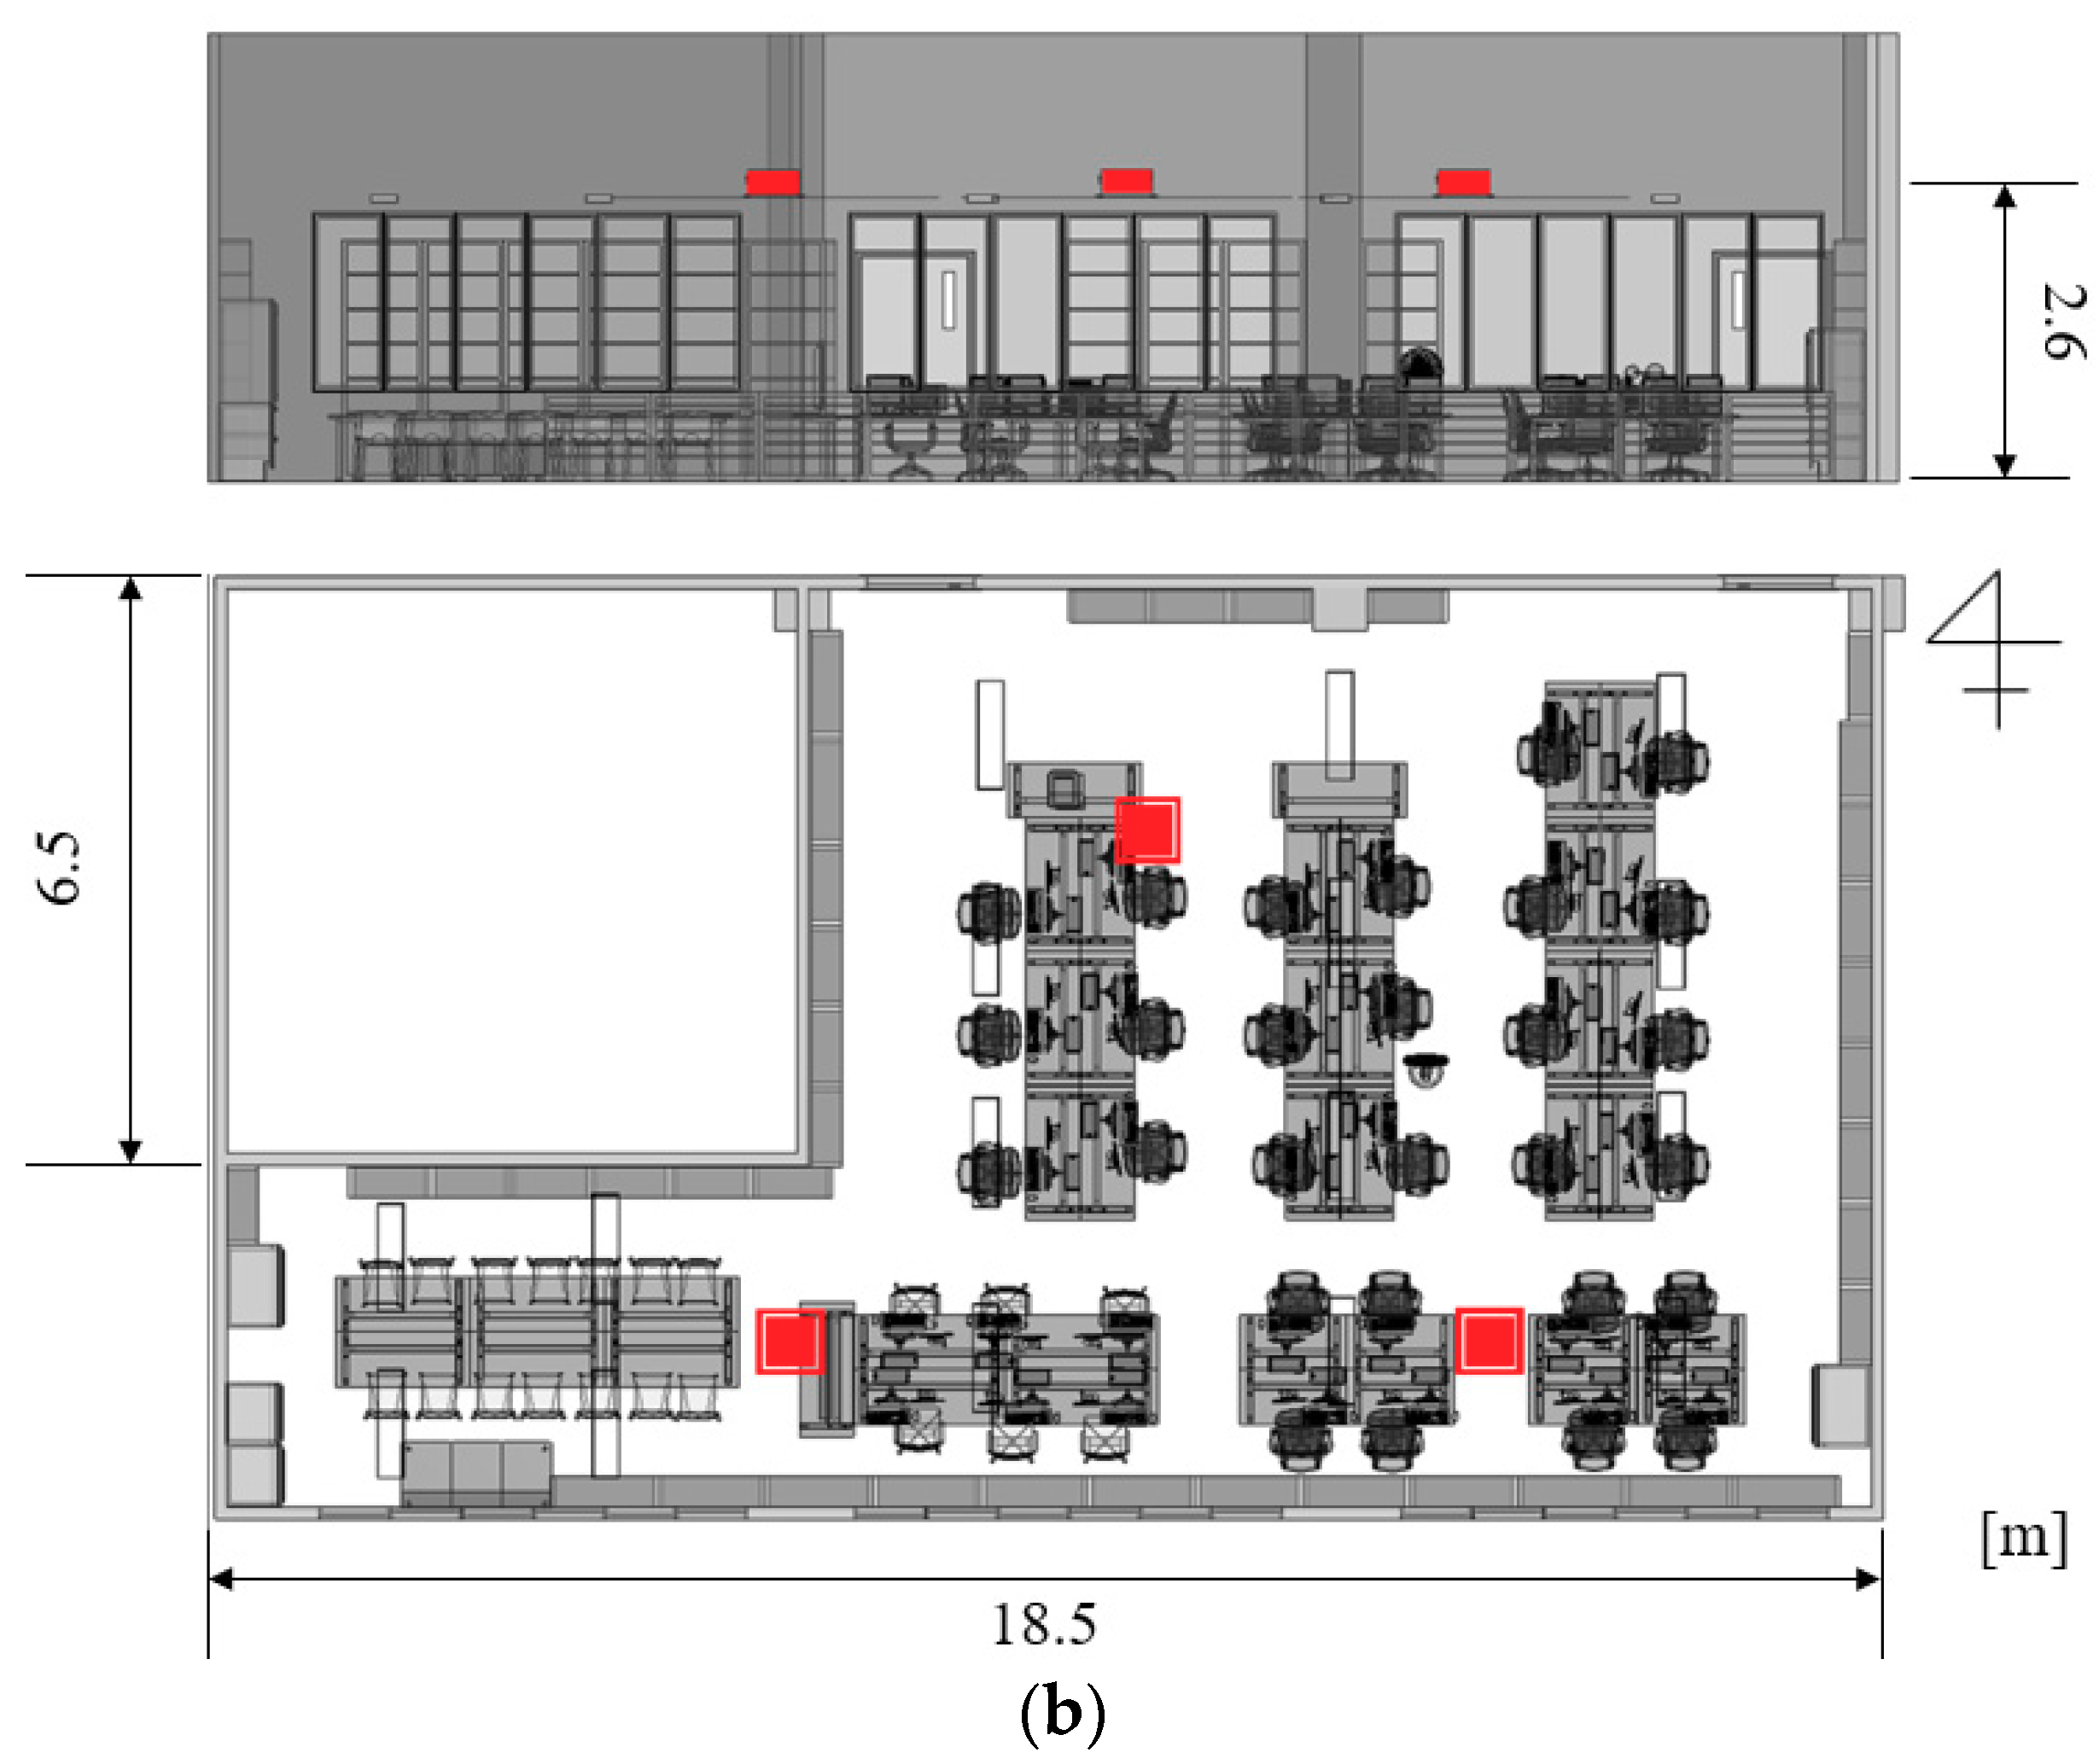
Figure 9.
Room 411 BIM model: (a) 3D view; (b) 2D View.


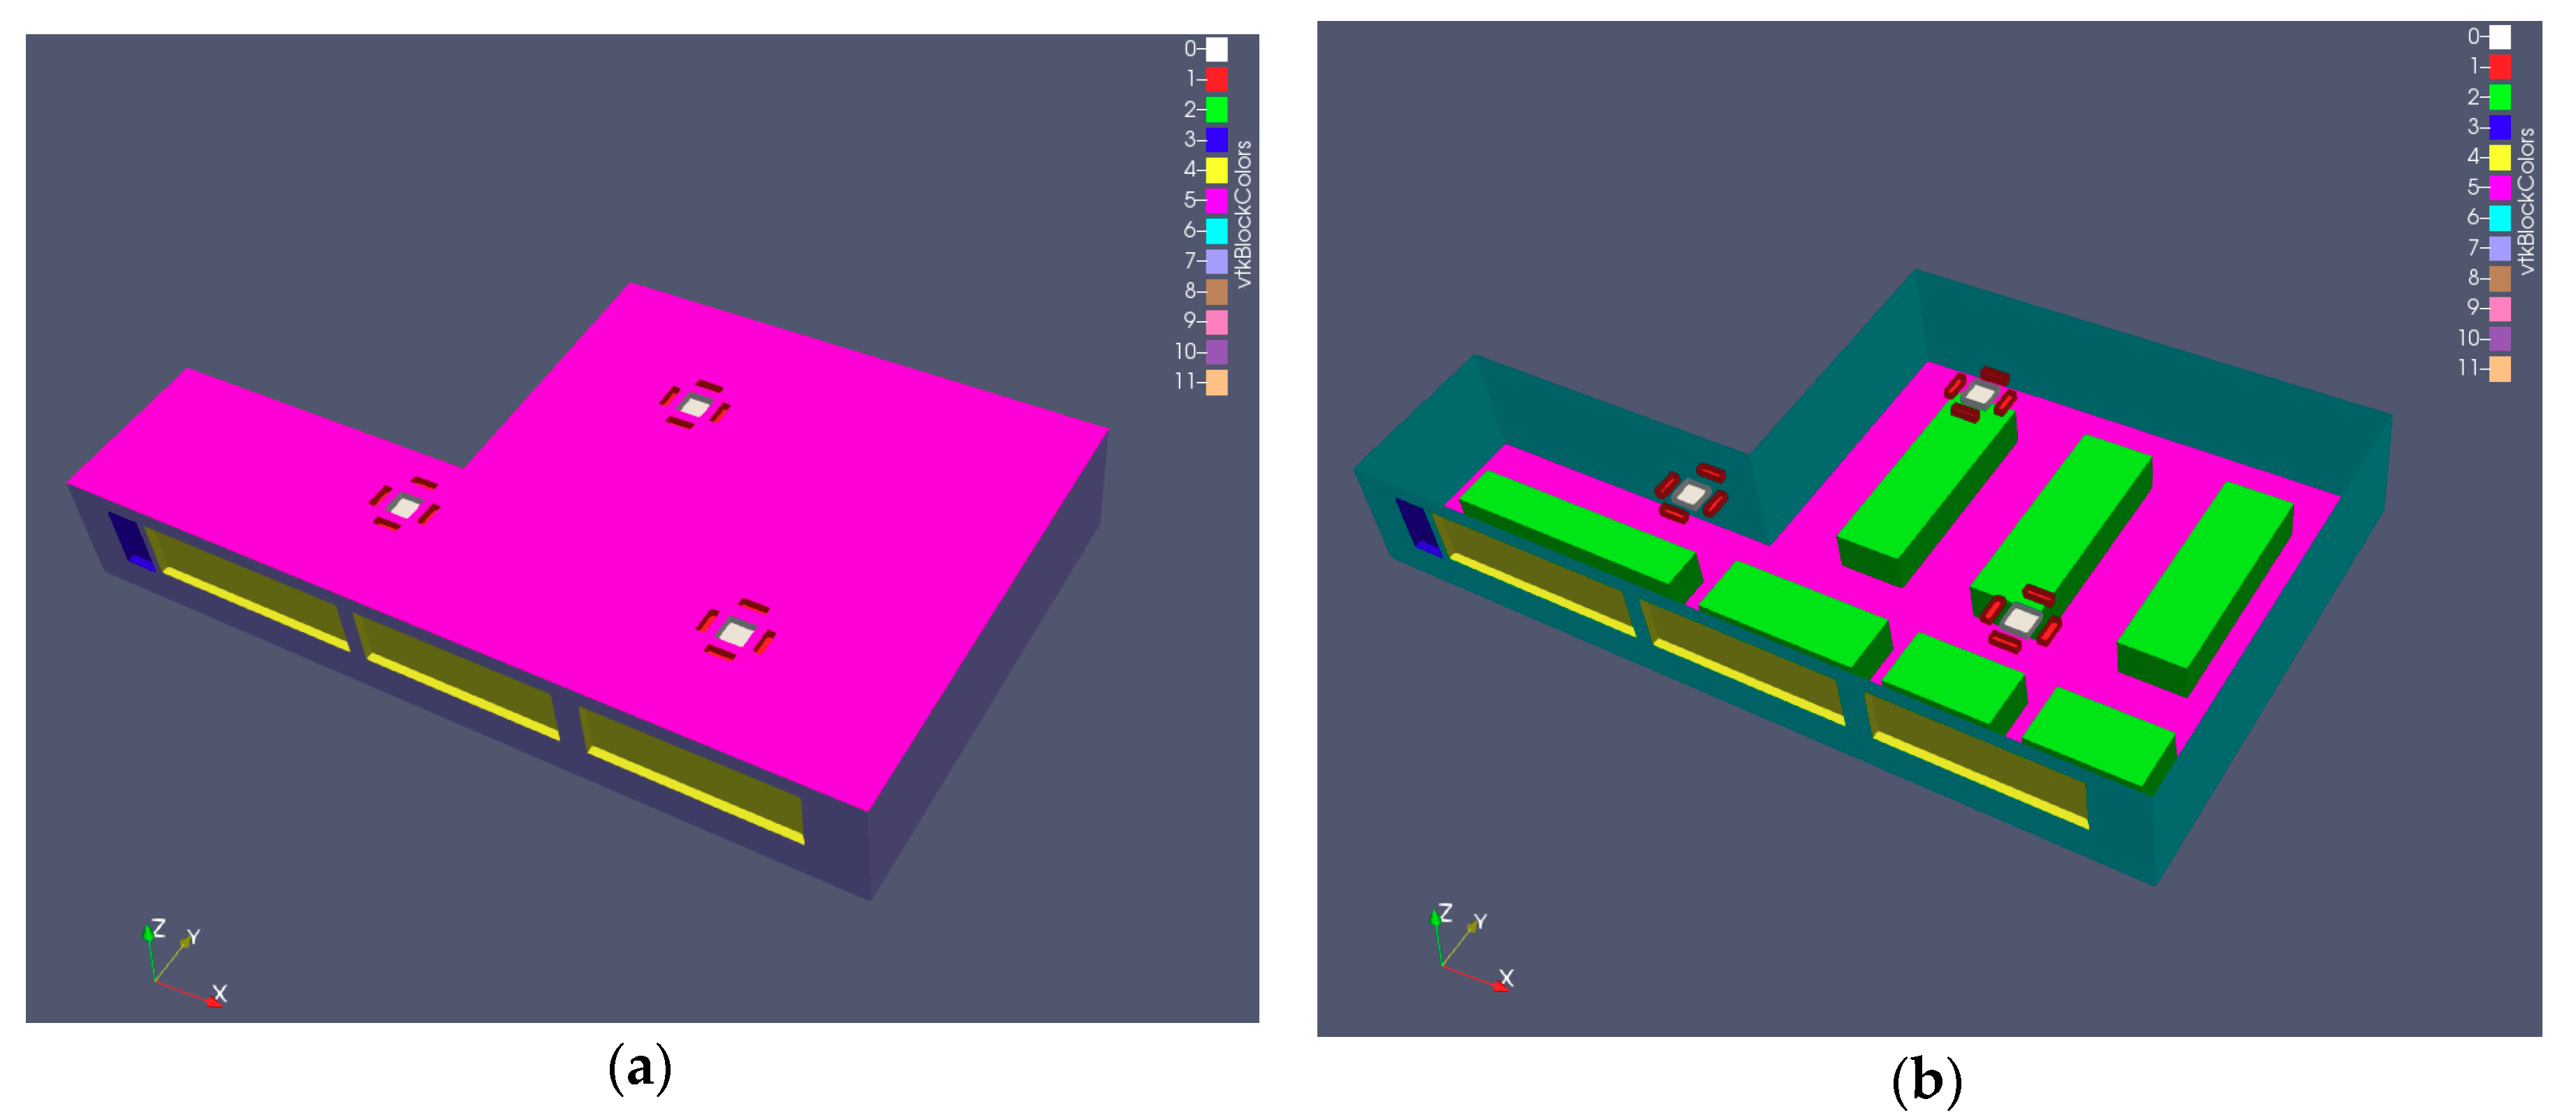
Figure 10.
Room 411 boundary setting: (a) with ceiling; (b) without ceiling.

Figure 11.
Sensor setting position.

Figure 12.
BlockMesh of three partition proposals: (a) case a; (b) case b; and (c) case c.


Figure 13.
Average temperature distribution of the CFD simulation.

Figure 14.
Animated CFD result of case a3 in the HMD.

Figure 15.
Animated CFD result of case b3 in the HMD.

Figure 16.
Animated CFD result of case c3 in the HMD.

Figure 17.
Observation position and field of view.


Table 1.
Boundary conditions of construction materials.
| Item | Wall | Ceiling | Floor | Window |
|---|---|---|---|---|
| Thermal transmittance (W/(m2·K)) | 1.38 | 1.80 | 1.70 | 5.60 |
| Initial wall temperature (°C) | 19.6 | 19.6 | 19.6 | 14.7 |
| Outdoor temperature (°C) | 14.7 | 14.7 | 14.7 | 14.7 |
| Emissivity | 0.010 | 0.010 | 0.010 | 0.113 |
| Absorptivity | 0.700 | 0.700 | 0.700 | 0.815 |
| Transmissivity | 0 | 0 | 0 | 0.815 |
Table 2.
Boundary conditions of the air conditioner.
| Item | Outlet | Inlet |
|---|---|---|
| Air volume (m3/min) | 18 | 18 |
| Area (m2) | 0.06 × 4 | 0.36 |
| Speed (m/s) | 2.5 | 1.2 |
| Temperature (°C) | 24 | - |
| Direction (°) | 60 | - |
Table 3.
Desktop PC (A) specifications.
| Item | Performance |
|---|---|
| OS | Windows 10 Enterprise 64-bit |
| CPU | Intel Core i5 7500 @ 3.40 GHz |
| RAM | 16.0 GB Dual-Channel DDR4 @ 2400 MHz |
| Motherboard | H270-PLUS |
| GPU | NVIDIA GeForce GTX 1060 6G |
Table 4.
Desktop PC (B) specifications.
| Item | Performance |
|---|---|
| OS | Ubuntu 16.04 |
| CPU | Intel Core i7 7700K @ 4.2 GHz |
| RAM | 16.0 GB Dual-Channel DDR4 @ 2400 MHz |
| Motherboard | Z270-K |
| GPU | None |
Table 5.
Sensor specifications.
| Common Standard Sensor | High-Precision Sensor | |
|---|---|---|
| Diameter (mm) | 17 | 17 |
| Thickness (mm) | 6 | 6 |
| Weight (g) | 3.3 | 3.3 |
| Measurement range | Temperature: −40 °C to + 80 °C | Temperature: −20 °C to + 70°C Humidity: 0% RH to 95% RH |
| Normal resolution | Temperature: ±0.5 °C | Temperature: ±0.5 °C Humidity: ±6% RH |
| High resolution | None | Temperature: ±0.1 °C Humidity: ±0.1% RH |
| Minimum measurement interval | 1 min | 1 s |
Table 6.
Sensor measurement results in winter.
| Item | 0 (minutes) | 2 (minutes) |
|---|---|---|
| Average indoor temperature (without daylight) (°C) | 14.0 | 16.6 |
| Outdoor temperature (without daylight) (°C) | 14.0 | 14.0 |
| Average indoor temperature (with daylight) (°C) | 14.7 | 20.1 |
| Outdoor temperature (with daylight) (°C) | 14.4 | 14.4 |
Table 7.
Winter simulation results.
| Item | 0 (minutes) | 2 (minutes) |
|---|---|---|
| Average indoor temperature (without daylight) (°C) | 14.0 | 17.15 |
| Outdoor temperature (without daylight) (°C) | 14.0 | 14.0 |
| Average indoor temperature (with daylight) (°C) | 14.0 | 20.06 |
| Outdoor temperature (with daylight) (°C) | 14.0 | 14.0 |
Table 8.
Winter simulation results.
| Window Type | Thermal Transmittance (W/m2·K) |
|---|---|
| Metal sash single glazing | 5.60 |
| Metal sash double glazing | 4.65 |
| Resin sash double glazing | 2.91 |
Table 9.
Winter simulation results.
| Item | Material and Window Type | ||
|---|---|---|---|
| Case | a1 | b1 | c1 | a2 | b2 | c2 | a3 | b3 | c3 |
| Average temperature (°C) | 16.94 | 17.63 | 17.67 | 17.76 | 18.26 | 17.75 | 18.83 | 19.61 | 19.64 |
Notes: cases a1, b1, and c1: metal sash and single-glazing windows; cases a2, b2, and c2: metal sash and double-glazing windows; cases a3, b3, and c3: resin sash and double-glazing windows.
© 2019 by the authors. Licensee MDPI, Basel, Switzerland. This article is an open access article distributed under the terms and conditions of the Creative Commons Attribution (CC BY) license (http://creativecommons.org/licenses/by/4.0/).
Share and Cite
MDPI and ACS Style
Zhu, Y.; Fukuda, T.; Yabuki, N. Integrating Animated Computational Fluid Dynamics into Mixed Reality for Building-Renovation Design. Technologies 2020, 8, 4. https://0-doi-org.brum.beds.ac.uk/10.3390/technologies8010004
AMA Style
Zhu Y, Fukuda T, Yabuki N. Integrating Animated Computational Fluid Dynamics into Mixed Reality for Building-Renovation Design. Technologies. 2020; 8(1):4. https://0-doi-org.brum.beds.ac.uk/10.3390/technologies8010004
Chicago/Turabian StyleZhu, Yuehan, Tomohiro Fukuda, and Nobuyoshi Yabuki. 2020. "Integrating Animated Computational Fluid Dynamics into Mixed Reality for Building-Renovation Design" Technologies 8, no. 1: 4. https://0-doi-org.brum.beds.ac.uk/10.3390/technologies8010004
Note that from the first issue of 2016, this journal uses article numbers instead of page numbers. See further details here.