1. Introduction
Modern technological environments are overloaded with large volumes of data, requiring simultaneously high speeds for the transfer and exchange of information, while maximizing energy savings [
1,
2,
3]. In this context comes the spreading of the Internet of Things (IoT) [
4], which is continuously invading everyday life and harmonizing with human needs and requirements. Due to the technological advances in micro-electro-mechanical systems and wireless communications, including the IoT, the development of Wireless Sensor Networks (WSNs), which monitor certain environmental parameters and intelligently organize the collected data in central locations, has become a reality [
5,
6,
7]. This class of networks usually involves a large number of such small low-powered wireless devices that require simple information dissemination algorithms in order to achieve global outreach. With regard to their spontaneous formation and wireless nature, WSNs bare many similarities to the wireless ad hoc networks.
Information dissemination aims to spread information to multiple destinations, typically through the use of broadcast techniques. It is an integral part of basic network operations, including routing, network discovery, and finding the optimum-path, and it has been studied extensively to provide the ultimate efficiency and effectiveness of systems in such environments [
8]. The goal of broadcast techniques usually involves global outreach, whereby all of the network’s nodes are covered by propagated information. However, it is often sufficient in real-world applications for the majority of the nodes, i.e., a large percentage of them, to receive the information.
Alternative dissemination methods to traditional blind flooding [
9] have been investigated to address the unnecessarily large number of transmitted messages and the storm problem [
10], one of which is probabilistic flooding. In probabilistic flooding, message transmissions take place based on a predefined forwarding probability. This forwarding probability is set by the initiator node and gets carried along with the message throughout the whole network. In this way, the overall dissemination relies on a much smaller number of messages; ergo, making it less costly. Therefore, there is a clear compromise between reducing the total number of messages and the network’s coverage with probabilistic flooding; by setting the forwarding probability considerably small, a large mount of the network’s overhead is avoided; however, many of the network’s nodes never receive the message.
Subsequently, probabilistic flooding is among the simplest examples of an epidemic algorithm. The term “epidemic” refers to algorithms that allow fast dissemination of information from an initial node (source) through purely local interactions between nodes, where the neighboring ones rebroadcast the dissemination message. Significant research work is focused on epidemic-based approaches for information dissemination in large-scale systems [
11], such as peer-to-peer systems deployed on Internet or ad hoc networks, due to the fact that they are easy to implement, robust, and error resilient. In addition, this allows for convenient adjustment of the epidemic algorithm’s parameters to achieve high reliability in dynamic network topologies [
12].
A common approach for modeling the spread of an infection in a system is achieved through the use of compartmental models, first introduced by Kermack and McKendrick [
13], in order to study the individuals of an infected population divided into groups, according to their disease-related state. A simple such model is the SIR epidemic model, which groups the individuals into three compartments: Susceptible (S), Infected (I), and Recovered (R). All nodes are initially in the susceptible state, with the exception of the initiator node, which is infected. Infected nodes infect neighbors in the susceptible state through interactions (transmissions, in this case). Infected nodes eventually recover, becoming immune, so they can no longer infect their neighbors. The transition from one state to another takes place based on the corresponding infection rate and the infection’s recovery rate.
It is noteworthy that probabilistic flooding can be considered as a special case of the SIR model, under certain conditions. In both cases, information dissemination initiates from a specific node and propagates in a probabilistic fashion through the network. Similarly, some time after receiving the disseminated information, a node may stop propagating information. Furthermore, certain parameters, which govern how capable both models are at providing sufficient information dissemination, are similar in nature, such as the initiator node [
14].
Most importantly, for the focus of this work, the mechanisms that maximize coverage with minimum resource use, i.e., epidemic thresholds, have been found to be identical in certain cases in the literature [
15,
16,
17]. For both models, these epidemic thresholds generally depend on various properties of a graph, including its average degree and its spectrum [
15]. However, the analysis needed to derive these results is heavily probabilistic, while often involving abstract notions that cannot be directly translated to real environments, such as network models or discrete time-steps. Therefore, it is worth investigating whether some of the assumptions made still hold true in practice, which can only be achieved through experimentation under realistic, yet controlled, conditions.
In this light, this paper focuses on identifying similarities between probabilistic flooding and the SIR model, especially with respect to their coverage and epidemic thresholds. These models are implemented and experimentally evaluated to compare their behavior and effectiveness at disseminating information. The experimental evaluation takes place on CaBIUs [
18], a university campus testbed, where a WSN is deployed. This relatively small-scale WSN, consisting of 25 low-cost nodes, should be adequate to reliably acquire results in a controlled environment, despite the models’ probabilistic nature. The acquired results indicate that the models perform similarly, with the performance of probabilistic flooding being in accordance with previous analytical models, while the SIR epidemic model relatively differs. The considered thresholds for probabilistic flooding successfully predict the network’s coverage, whereas the thresholds for the SIR epidemic model seem to overestimate the network’s coverage for a given set of parameters. This fact can mainly be attributed to the selected SIR implementation, whereby a transition to the recovered state may take place, prior to the transmission from an infected node to another. Therefore, despite commonalities between the thresholds for the two models, the resulting coverage differs for the considered implementations.
The remainder of this paper is structured as follows: In
Section 2, an overview of related work is provided focusing on the discussion of the algorithms’ epidemic thresholds.
Section 3 describes the relevant models and epidemic thresholds used in the paper, and in
Section 4, the system used for the experimentation in the real wireless network environment is described, along with the implementation of the two information dissemination approaches.
Section 5 thoroughly describes the conducted experiments and presents the results, while in
Section 6, conclusions are drawn and future work is outlined.
2. Past Related Work
A large number of studies has focused on the efficiency of flooding. The broadcast storm problem pointed out by Ni et al. [
10] is known to hold flooding responsible for causing a significant amount of network traffic. They proposed various alternative approaches to eliminate the problem. William et al. conducted a study [
19], comparing different broadcast algorithms in ad hoc networks, one of which was probabilistic flooding. They showed that flooding was inadequate for congested networks as the increased number of nodes in static networks leads to performance loss due to the large number of failed message re-transmissions.
Efforts have been made to optimize probabilistic flooding’s efficiency. Fixed probabilistic flooding has been mainly studied in random networks, using percolation theory and phase transition phenomenon [
20,
21,
22]. Crisóstomo et al. [
23] derived values for the threshold probability, considering various stochastic topologies. Additionally, they randomly sampled the graph’s total node set, forming an induced subgraph, based on the forwarding probability of probabilistic flooding. They proved that the event of this subgraph being a connected dominating set is probabilistically equal to the event of global outreach by probabilistic flooding. In [
24], Oikonomou et al. derived asymptotic expressions for probabilistic flooding with underlying networks that are random graphs. Later, in [
14], Koufoudakis et al. studied probabilistic flooding using algebraic graph theory elements, and an algorithm was introduced to estimate the threshold probability, whereas in [
25], a lower bound of the forwarding probability was proposed, allowing for global network outreach. It was shown that for large values of time, a forwarding probability sufficient to provide global outreach is inversely proportional to the average number of neighbors in the network.
However, results observed for random graphs are not always applicable to ad hoc networks. Consequently, it is a hard task to determine an optimum forwarding probability, as it may depend on various network parameters, such as density, distance among nodes, and speed. An alternative approach to fixed probabilistic flooding is to use adaptive probabilistic schemes [
26], where the forwarding probability is determined according to the aforementioned parameters.
Probabilistic flooding shares many of its features with epidemic-based dissemination approaches with respect to the network’s coverage [
17]. The rise of theoretical epidemiology began in the early 20th Century with the mathematical modeling of infectious diseases and has been mainly a subject of biologists and health physicians such as Kermack-McKendrick [
13], Anderson-May [
27], and Ross [
28]. Their main purpose was to predict the spreading properties of an infectious disease, and they conventionally have relied on the use of compartmental models. As early as of the 1980s, the mathematics underlying the propagation of epidemic approaches has been shown to be related to communication protocols [
29]. In the years following, epidemic models and their applications have been widely investigated in communication systems [
12,
30]. More recent approaches include epidemic information dissemination for mobile molecular communication systems [
31] and WSNs [
32], the optimal control study of information epidemics in social networks for campaigning strategies [
33] and even for evaluating the dissemination of information in urban scenarios with different crowd densities and renewal rates [
34].
Cohen’s pioneering work [
35] on the subject of computer viruses suggested that the spread of an infection follows the transitive closure of information flow in a system. He was also the first to point out that there is no algorithm that can perfectly detect all possible viruses. Later, he and Murray [
36] indicated a link between the spread of computer viruses and biological epidemiology; however, they did not develop an explicit model linking the two together. The first serious attempt at adapting mathematical epidemiology to the subject of computer virus replication within computing systems was presented by Kephart and White [
37]. They showed that the epidemic threshold is related to the average node degree of the network (average number of neighbors in a network) and stated that the absolute prevention of a computer virus is indeed impossible; yet, controlling the rate at which a a detected virus is removed from the system may be sufficient for the prevention of an epidemic.
Epidemic thresholds have been a subject of research for various network topologies. Pastor-Satorras and Vespignani [
38,
39,
40,
41] focused on the epidemic spread in scale-free networks where they proposed an analytical model for power-law graphs and respectively derived an epidemic threshold. Scale-free networks exhibit a highly skewed connectivity distribution making them virally more susceptible, as computer viruses are more likely to propagate among the nodes of such high connectivity variance networks, thus making the infection harder to extinguish. Eguiluz and Klemm [
42] proposed an even tighter epidemic threshold for real graphs and provided confirming results on several Internet graphs. Serrano and Boguñá [
43] derived the epidemic threshold for clustered networks.
Later, Boguñá et al. [
44] studied epidemic spreading in correlated complex networks, where the connectivity of a particular individual is dependent on its neighbors’ connectivity. Moreno et al. [
45] also studied the epidemic modeling in complex networks of Watts-Strogatz and Barabasi-Albert and related the epidemic threshold to the moments of the connectivity distribution. They also confirmed the absence of any finite threshold for particular types of connectivity distributions. Wang et al. [
16] designed a general epidemic spreading model suitable for any network and proposed an epidemic threshold condition, which applies to any arbitrary graph. This threshold is inversely related to the largest eigenvalue of the network’s adjacency matrix. The number of infected nodes in a network exponentially decay for values below this epidemic threshold.
In [
14,
17], Oikonoumou et al. and Koufoudakis et al. studied probabilistic flooding under the light of epidemic-based dissemination, revealing the close relation of the two approaches regarding the epidemic threshold. The network’s coverage was transformed into a coverage polynomial of which the largest root was a lower bound for the threshold probability, and it was tighter than the epidemic thresholds proposed by Kephart-White and Wang et al. [
16,
37].
3. Models’ Definition
The exploration of the models takes place in a network topology, which is modeled by an undirected graph , with N and L being the sets of nodes and links (or edges), respectively. Furthermore, A is an adjacency matrix of , with element being one, if nodes i and j are adjacent, and zero otherwise. The largest eigenvalue of matrix A is denoted by . It is also assumed that the implemented algorithms’ termination takes place for , where t is a given point in time and T is referred to as termination time.
3.1. Probabilistic Flooding
Information dissemination in probabilistic flooding begins to spread from a particular node, namely the source node of the network. The message re-transmission from a node that receives the information message for the first time takes place, based on a predefined forwarding probability q. Any messages that are received by the nodes after the first time are ignored. The fraction of the nodes covered by the propagated information under probabilistic flooding is referred to as the network’s coverage and is denoted by for the time t.
The network’s coverage in probabilistic flooding depends on the value of q. The smaller the forwarding probability, the more difficult it becomes for a message to travel across the network, thus the greater the uncertainty for the network’s global outreach. The optimum forwarding probability that allows high network coverage and at the same time minimizes the message transmission is referred to as the threshold probability .
3.2. SIR Epidemic Model
In a typical SIR epidemic model, which includes the aspect of recovering from the infected state, the spread of an infection from an infected individual takes place based on a fixed infection rate
, and the process of a node recovering from an infection takes place at an infection recovery rate
. The dynamics of an infection transmission are defined by the basic reproduction number
. Thus,
implies the average number of cases generated by a primary infection case in a susceptible population, throughout its duration [
46].
Based on the SIR epidemic model, a susceptible individual can, upon meeting an infectious individual, become infectious, and after some time, the infectious individual recovers. It is assumed that the total number of the population is given by:
where
are the sets of susceptible, infected, and recovered nodes for time
t, respectively.
In a network of nodes, each node represents an individual subject, and the edges L specify the interactions between the different individuals. The spreading of the infection starts from a source node, and the rate at which an infected node i can infect a susceptible neighbor j is defined as the infection rate . The recovery process that transfers a node from the infected state to its following state (recovered) is an internal Markovian (memory-less) process, which takes place at a constant rate . An individual becomes fully immune to a particular disease after recovering from its infected state and therefore, if reinfected, cannot re-transmit the disease to its neighbors.
An important assumption that has to be made regarding the spreading of the disease to a susceptible individual is that the infection occurs with a fixed probability
, for each link between a susceptible and an infected individual. Similarly, transitioning from the infected to the recovered state occurs based on a constant probability
per unit time. These assumptions are introduced to simplify the mathematical modeling, especially when it comes to differential equations, while also simplifying the implementation, as discussed in
Section 4.2.
The critical value of
that determines whether an infection will die out or will be able to spread through a population is referred to as the epidemic threshold and denoted by
. This means that for values of
, the infection rate is high enough, such that the recovery rate is insufficient and the disease spreads out through an entire susceptible population, whereas for values of
below this threshold, either the generated outbreak is insignificant or the disease does not occur at all. The value of this threshold helps to develop measures for an epidemic’s prevention and control [
47]. The fraction of the nodes covered by the SIR infection message is referred to as the network’s infection coverage and is denoted by
for the time
t, that is:
This formulation is selected due to the fact that information dissemination is the topic at hand in the current work.
3.3. Epidemic Thresholds
Both probabilistic flooding and the SIR epidemic model function in a relatively similar manner. Probabilistic flooding comes up if each node were to operate according to the SIR epidemic model and become recovered after infecting its neighbors exactly once. Much work has focused on identifying the epidemic thresholds for both of these models, some of which share a few similarities. In this work, due to the fact that the focus is on information dissemination, an infection is considered to be an epidemic if it has affected most of the network. The network’s average degree and the highest eigenvalue of its adjacency matrix are most prominent in epidemic thresholds.
The epidemic thresholds are values for which sufficient coverage is achieved. For probabilistic flooding, an epidemic threshold is such that is expected to be close to one for . Similarly, for the SIR epidemic model, is an epidemic threshold if is, again, expected to be close to one, when .
When it comes to probabilistic flooding, the relevant thresholds that are being focused on in the current study include
and
. It was also argued in [
25] that
and
are tighter bounds for sufficient coverage. In general, the thresholds that involve eigenvalues are regarded as more precise, as
, but they can be harder to estimate in real scenarios, due to requiring knowledge of the entire topology.
Regarding the SIR epidemic model, identifying tight epidemic thresholds is much more challenging, with multiple ones being proposed in the literature. Interestingly, few of these thresholds are identical to the ones detailed for probabilistic flooding. In particular,
and
once again come up for some networks, although they are based on somewhat “naive” expectations [
15].
Therefore, probabilistic flooding and the SIR epidemic model exhibit various similarities, both in terms of functionality and epidemic thresholds. In order to investigate how similar the capabilities of both mechanisms are at disseminating information in a real networking environment, this paper focuses on their experimental evaluation.
5. Experimental Evaluation
The contribution of the work presented in this paper was the experimental evaluation of the dynamics of both the probabilistic flooding and the SIR epidemic model. In particular, the experiments aimed to evaluate the information dissemination capabilities of both algorithms under real conditions, with respect to the presented epidemic thresholds, as well as to examine similarities between them. The experiments were conducted on CaBIUs, a university campus testbed using a 25 node WSN, as described in
Section 4. Across all experiments, a total of 10 runs were conducted for any given selection of parameter values regarding
q,
, and
, with meant and 95% confidence intervals being reported, where appropriate. It should be noted that the initiator node was located at the same position across all experiments.
Based on previous experiments on CaBIUs [
18], the value of
was expected to be approximately equal to
. Hence, the corresponding thresholds
and
were expected to be equal to
. Due to the nodes’ limited computational capabilities and the fact that the network’s links changed dynamically, eigenvalues and average degrees were not computed during runtime. A set of predefined probabilities was used instead, with the probability
q and reproduction number
being set at the start of each experiment.
Probabilistic flooding was tested for each of the forwarding probabilities . For these five experiments, the topologies that occurred resulted in averages of and . Thus, the corresponding thresholds were on average and , while and . Concerning the SIR epidemic model, a total of nine experiments were conducted, with the ranges of infection probabilities and recovery probabilities used being for and for . The range of these probabilities yielded different values for the reproduction number . The experiments conducted for the SIR epidemic model yielded and , with the corresponding thresholds being and .
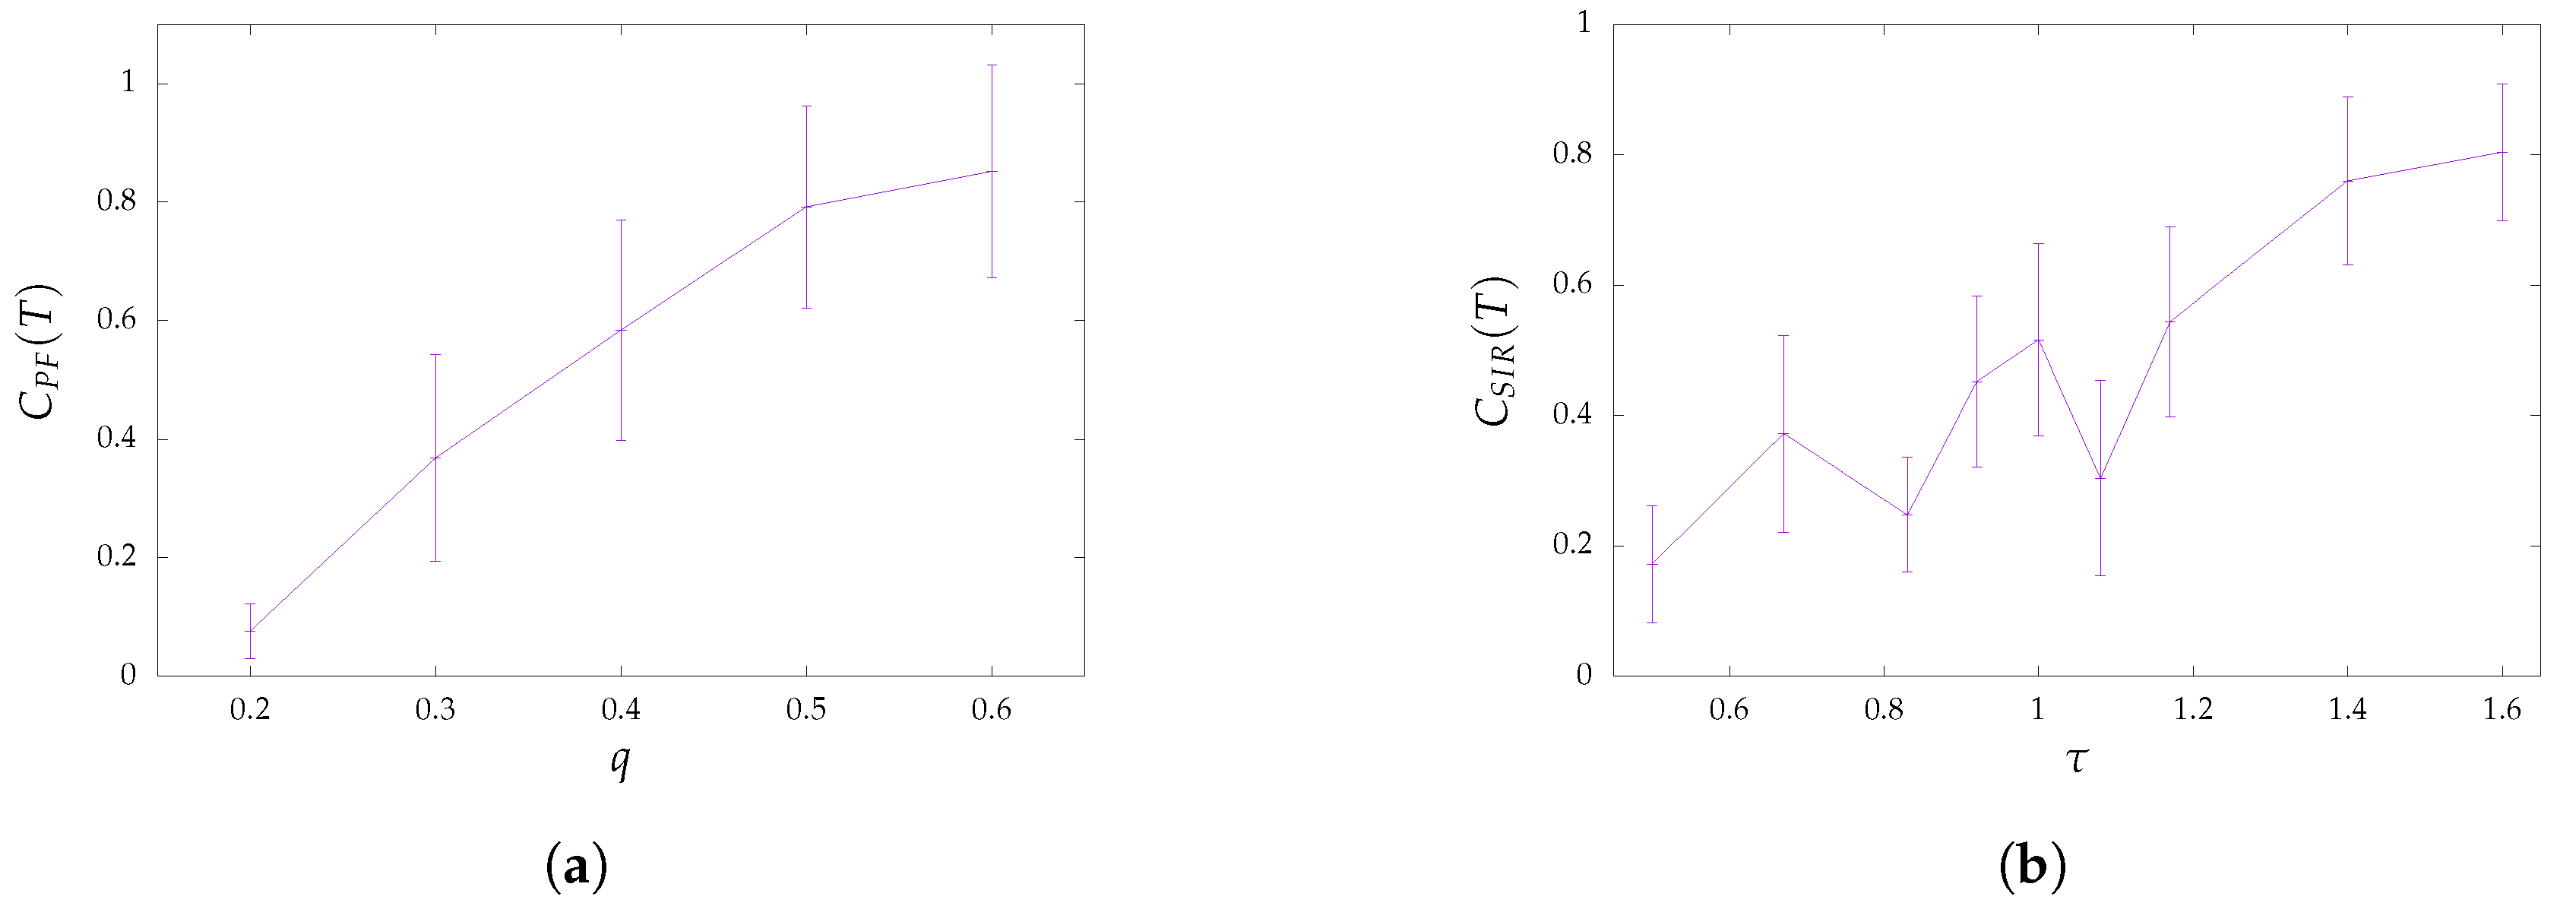
The total coverage for different values of
q is depicted for the case of probabilistic flooding in
Figure 2a. For
, the total coverage
was exceedingly low, with less than
of the network being covered by information. It was, therefore, evident that thresholds
and
severely underestimated the probability
q required to cover most of the network’s nodes. On the other hand, for
, a much larger percentage of the network was covered by the disseminated information, being
. Thus, the acquired results were more in accordance with thresholds
and
.
Similarly,
Figure 2b showcases the total coverage
for the SIR epidemic model. The lowest value of
for which experiments were conducted, which was
, was considerably higher than the one indicated by thresholds
and
. However, the network coverage even for such comparatively high values was only around
. In contrast, the highest coverage (
) was achieved for
(
). This highlighted a significant difference between the theoretical model and the implementation investigated here and might be attributed to the fact that according to the implementation, a node may recover before ever infecting any of its neighbors.
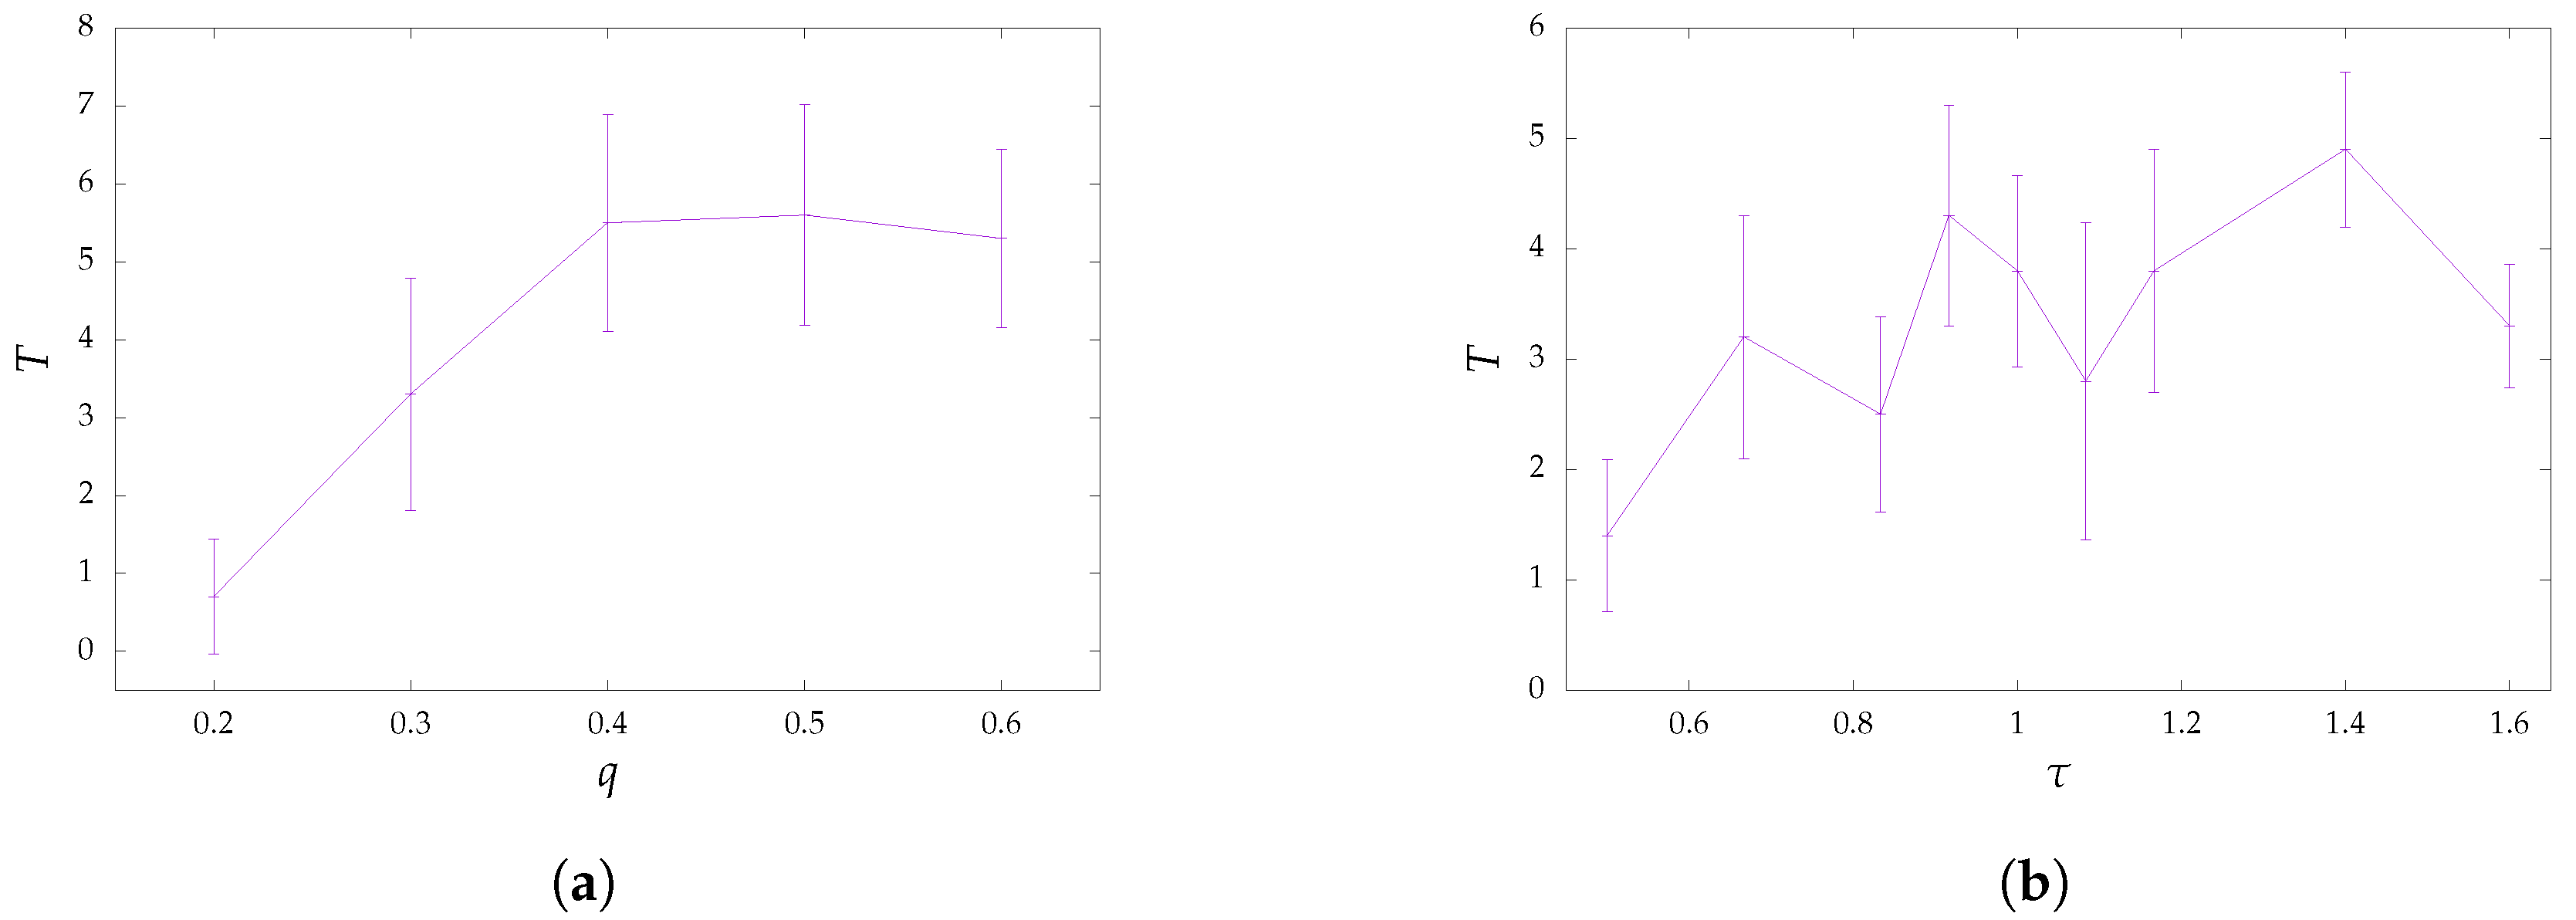
Regarding termination times in terms of hops, they are displayed in
Figure 3 with respect to probabilities
q and reproduction numbers
. In the case of probabilistic flooding, the lowest values for termination time occurred for
, as the message being disseminated did not travel very far. For high values of
q, probabilistic flooding functioned similarly to blind flooding, so the termination time should be closer to the source node’s centrality (the maximum distance between the source node and any other node of the network). For intermediate values of
q, messages did not always reach their destination through the most direct path, so the termination time could be higher. A similar, although less stable, behavior was observed for the SIR epidemic model, with termination times being lower in most cases. Due to the overall less stable behavior evident in both the coverage and termination time of the SIR epidemic model, it could be argued that probabilistic flooding was more suitable in applications that did not favor high variance in the information dissemination process.
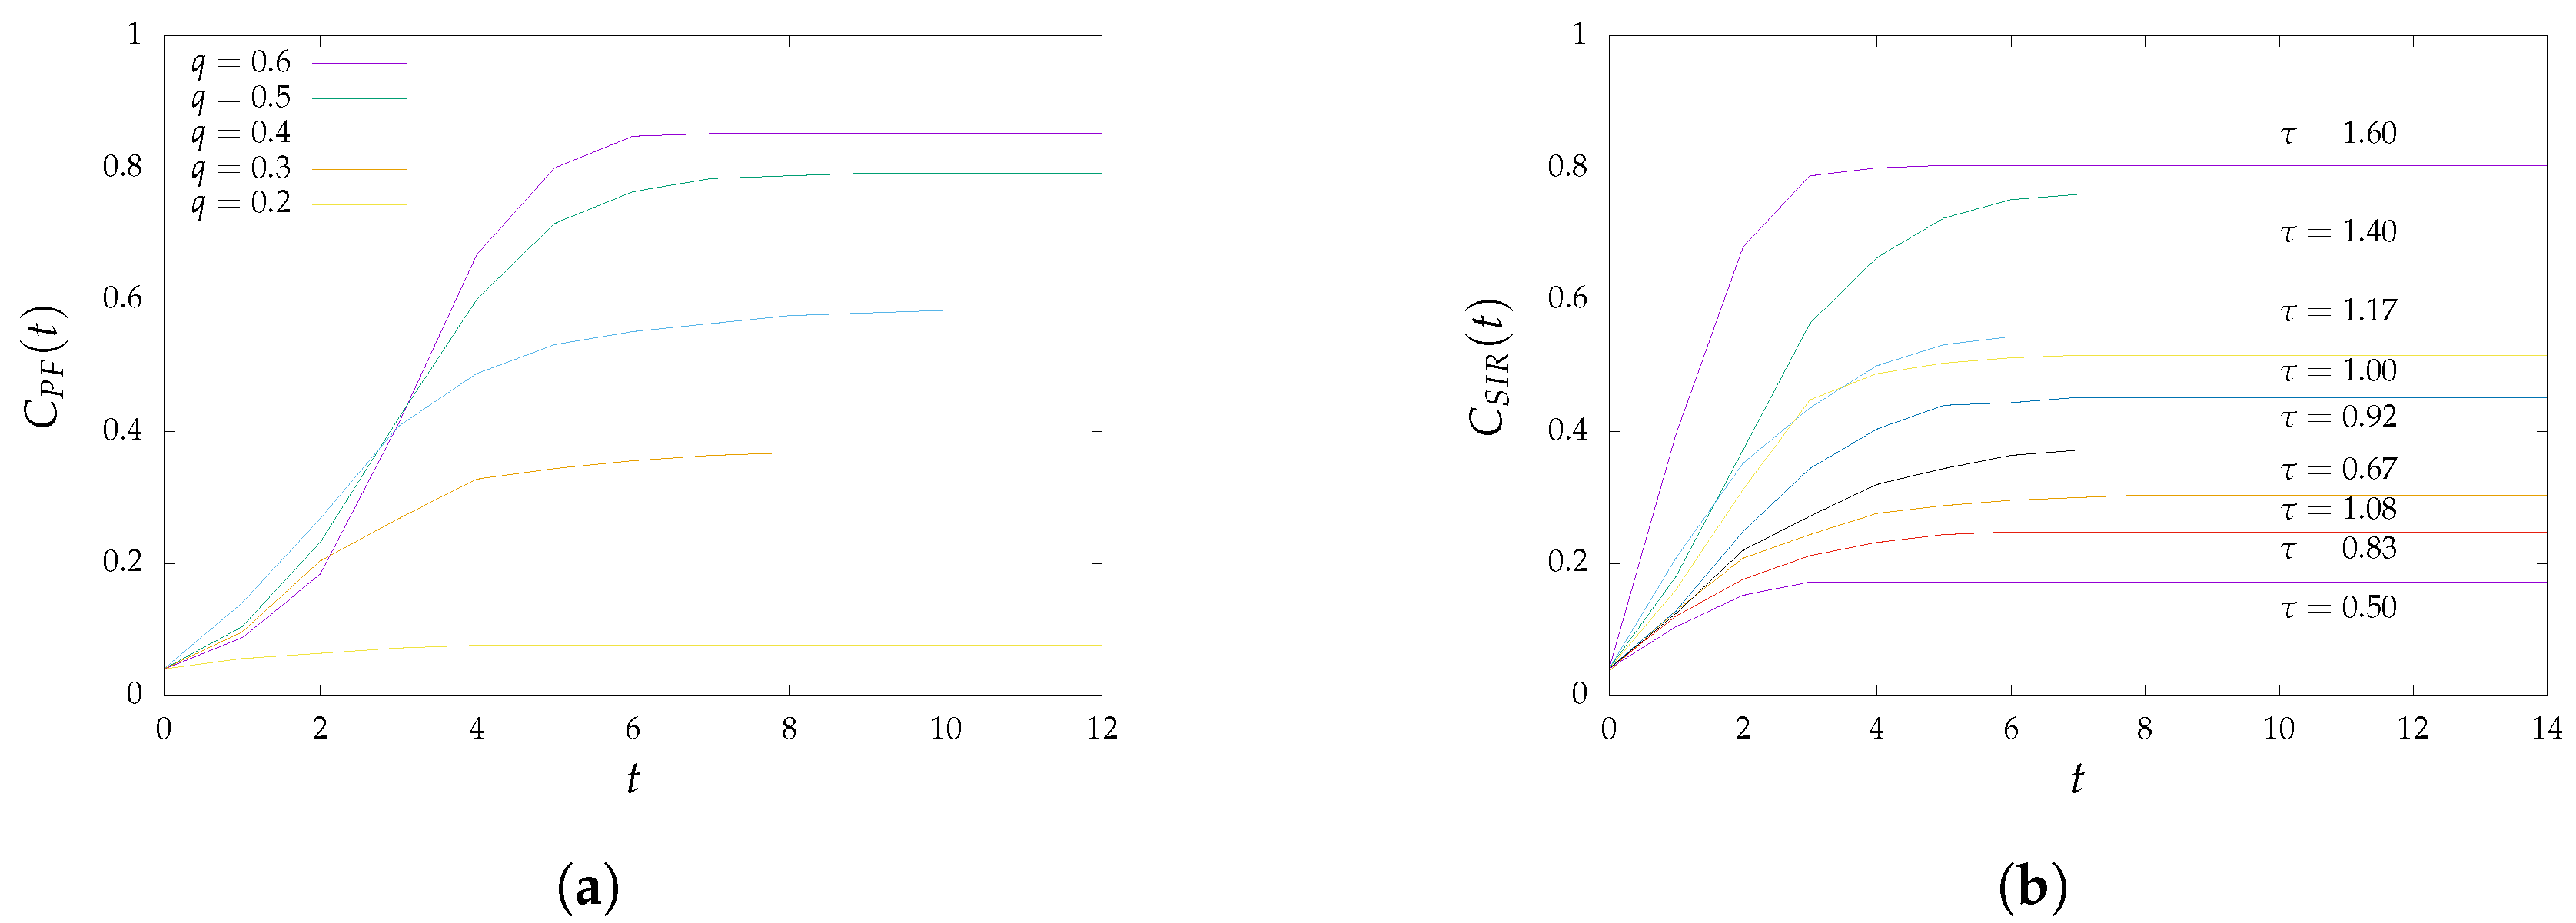
The network’s coverage with respect to time in hops is depicted in
Figure 4. For probabilistic flooding, the behavior of which is shown in
Figure 4a, a large portion of the network’s nodes were covered within a couple of time steps (e.g., in the range of
), which is often referred to as the transition phase. This range also seemed to be slightly wider the higher the value of
q was. For the SIR epidemic model, on the other hand, the transition phases did not seem to occur at the same time or last as long, for different values of
, as can be observed in
Figure 4b. It is worth noting here that in a few cases, coverage did not monotonically increase with
. This unexpected behavior could be attributed to a number of factors, such as the size of the network used for the evaluation and the difficulties encountered in networks that were operating under the conditions of a real environment (topology changes across experiments, transmission failures).
6. Conclusions and Future Work
The progress in the development of the IoT has ignited scientific interest for the last decade. The success of the IoT is defined by the effectiveness of WSNs, which IoT is based on, in order to reinforce human comfort. As a result, a primary role is played by the information dissemination across such sensors, a process that was extensively studied and discussed and that could be implemented with a variety of techniques.
In this paper, the dissemination of information was achieved via probabilistic flooding and the SIR epidemic model by implementing the corresponding distributed algorithms. The similarities between probabilistic flooding and the SIR epidemic model were pinpointed, regarding both their behavior and their epidemic thresholds. The main contribution concerned the experimental evaluation of their similarities in CaBIUs, a university campus testbed. This network consisted of low-cost wireless sensor nodes that were installed across the campus of the Ionian University.
The experimental evaluation showed that the implementation was generally in agreement with previous analytical models. Especially in the case of probabilistic flooding, some of the considered epidemic thresholds could accurately predict the sufficient coverage of the network’s nodes. For the implementation of the SIR epidemic model, the considered thresholds were shown to overestimate the network’s coverage for a given set of parameters. This might be attributed to the fact that, according to the implementation, a node may enter the recovered state before infecting any of its neighbors. Therefore, despite commonalities between the thresholds of probabilistic flooding and the SIR epidemic model, the resulting coverage differed for the implementations described in this paper.
While the acquired results were promising, future work could aid in establishing their validity. More specifically: (i) a different implementation of SIR could be examined, to investigate whether recovery checks should occur only after an infection check has taken place; (ii) more thresholds could be considered in the conduction of additional experiments; (iii) different compartmental models could be compared, such as susceptible-infected-susceptible (SIS); and (iv) a larger number of nodes may be considered for experimentation, to capture the probabilistic nature of the two algorithms more reliably.

 ,
, 


