Article

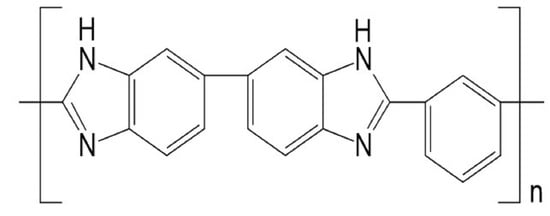
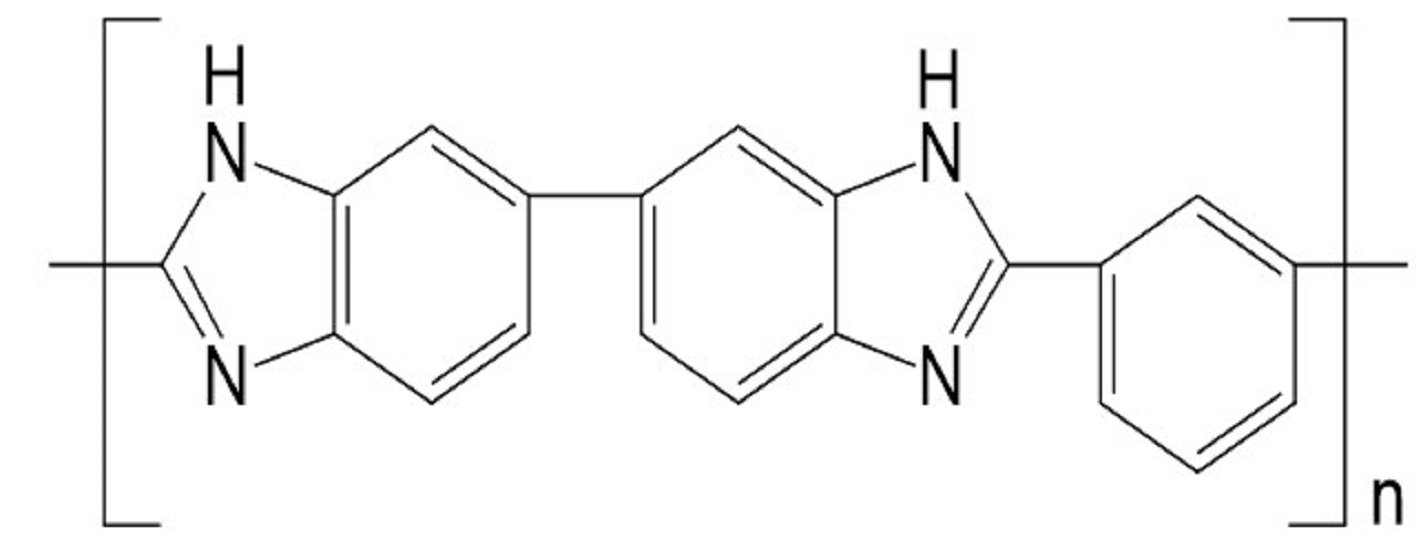
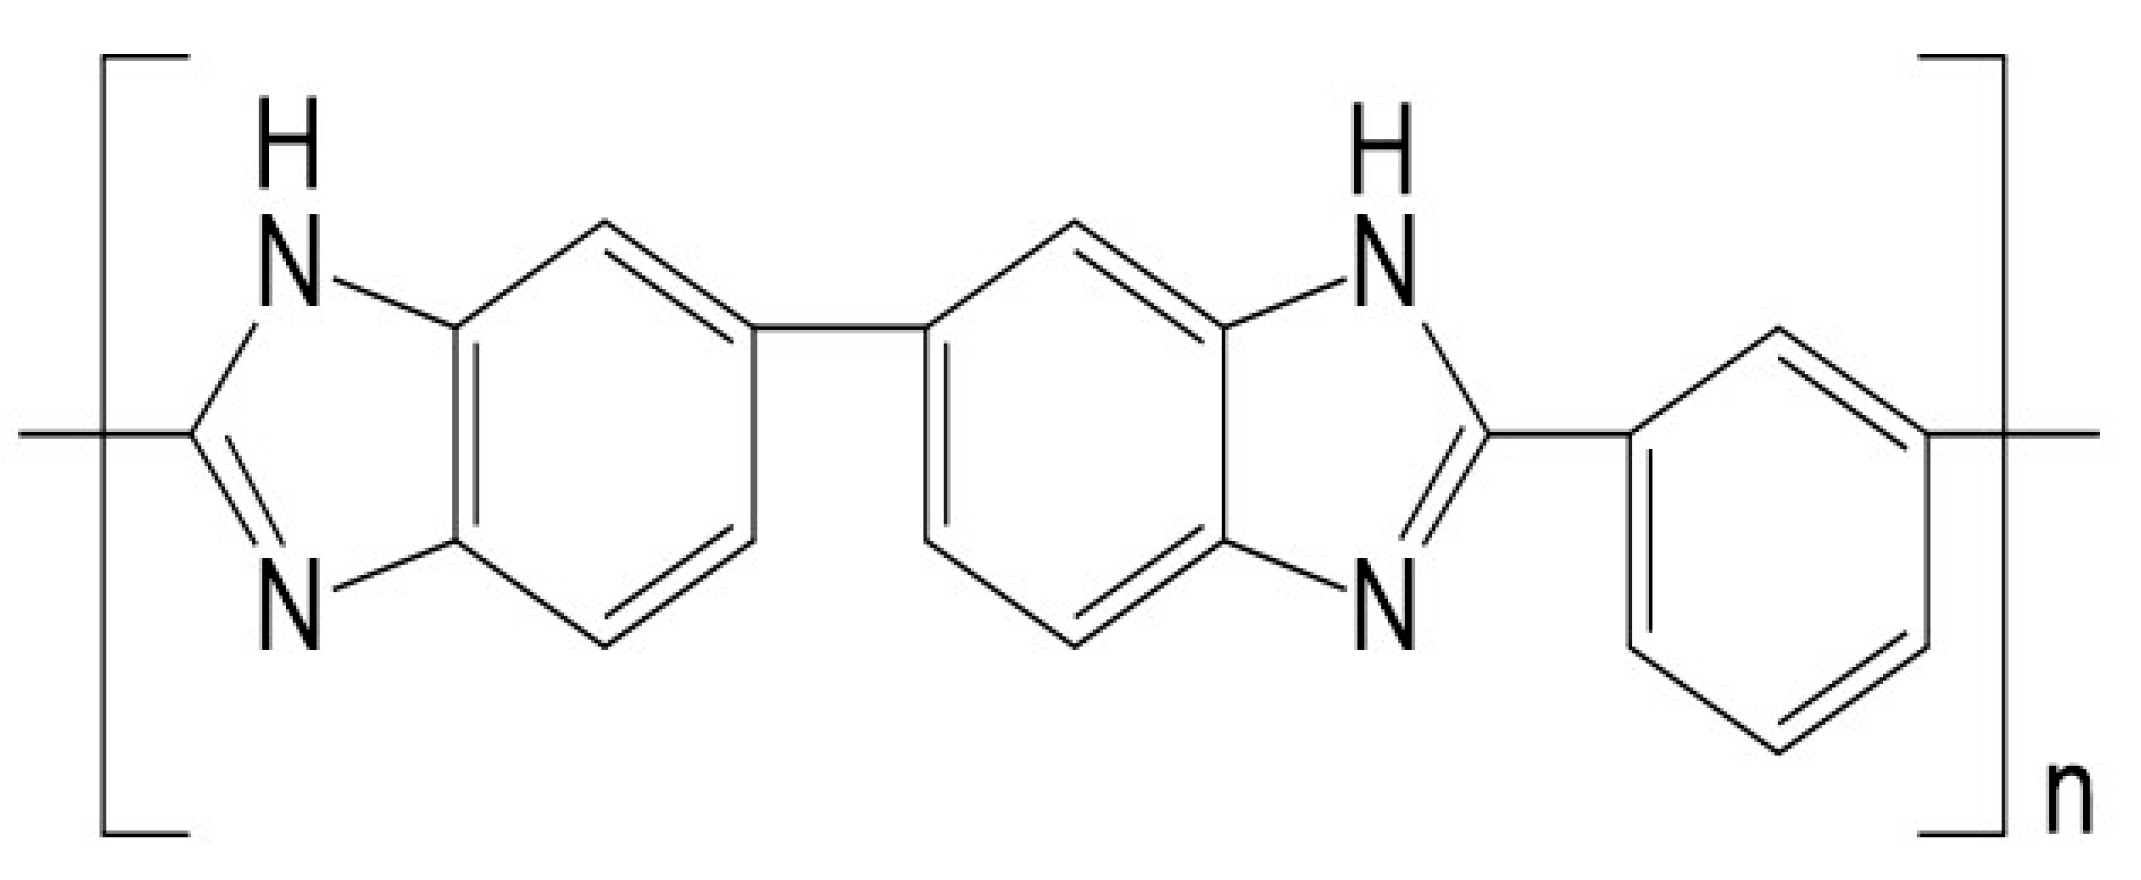
UV Photo-Oxidation of Polybenzimidazole (PBI)

1
Plasma Laboratory, School of Chemistry and Materials Science, Rochester Institute of Technology, Rochester, NY 14623, USA
2
Xerox Analytical Services, Xerox Corporation, Webster, NY 14580, USA
3
Department of Mechanical Engineering, Rochester Institute of Technology, Rochester, NY 14623, USA
*
Author to whom correspondence should be addressed.
Submission received: 1 September 2020 / Revised: 5 October 2020 / Accepted: 7 October 2020 / Published: 9 October 2020
(This article belongs to the Section Innovations in Materials Processing)

Abstract

:
Since polybenzimidazole (PBI) is often used in the aerospace industry, high-temperature fuel cells, and in redox flow batteries, this research investigated the surface modification of PBI film with 253.7 and 184.9 nm UV photo-oxidation. As observed by X-ray photoelectron spectroscopy (XPS), the oxygen concentration on the surface increased up to a saturation level of 20.2 ± 0.7 at %. With increasing treatment time, there were significant decreases in the concentrations of C-C sp2 and C=N groups and increases in the concentrations of C=O, O-C=O, O-(C=O)-O, C-N, and N-C=O containing moieties due to 253.7 nm photo-oxidation of the aromatic groups of PBI and reaction with ozone produced by 184. 9 nm photo-dissociation of oxygen. Because no significant changes in surface topography were detected by Atomic Force Microscopy (AFM) and SEM measurements, the observed decrease in the water contact angle down to ca. 44°, i.e., increase in hydrophilic, was due to the chemical changes on the surface.

Graphical Abstract

1. Introduction

Poly 2,2’-m-(phenylene)-5,5’-bibenzimidazole, better known as polybenzimidazole (PBI), or meta-PBI, is a high-performance polymer consisting of benzimidazole units, as shown in the Figure 1. PBI has high thermal stability, chemical resistivity, and mechanical strength, making it suitable for many applications [1,2,3,4], such as in high-temperature fuel cells [1,2,5,6]; redox flow batteries [7,8,9]; protective thermal coatings [3], and aerospace industries, where PBI may be exposed to ozone and UV radiation [4].
Interfacial properties are a key aspect for the optimization of fuel cell membrane electrode assemblies [10] and redox flow batteries [7,8,9] to increase the conductivity and uptake of the proton carrier; the concentration of the polar groups on the polymer backbone must be maximized [11]. Therefore, to increase the hydrophilicity of the PBI surface, this research investigated the UV photo-oxidation of PBI with low-pressure Hg lamps which emit both 253.7 and 184.9 nm photons. The 184.9 nm radiation is absorbed by oxygen and breaks the molecular bond to form ground state O (3P) atoms [12] at a threshold wavelength of 242.4 nm [13]. Using atmospheric pressure of O2, ozone is produced by reaction (1) involving a stabilizing molecule (M), which is the oxygen molecule in this study.
O(3P) + O2 + M → O3 + M
Because oxygen molecules do not absorb 253.7 nm radiation [12], the 253.7 nm photons are transmitted through the oxygen to activate the PBI film.
The resulting surface modification was monitored using X-ray photoelectron spectroscopy (XPS), water contact angle (CA), and atomic force microscopy (AFM) and scanning electron microscopy (SEM) measurements to determine changes in chemistry, hydrophilicity, and surface topography, respectively.

2. Materials and Methods

2.1. Materials

Commercially available 55 µm thick PBI film (Celazole®) was purchased from PBI Performance Products, Inc. (Charlotte, NC, USA) and cleaned with isopropyl alcohol (Avantor Performance Materials, LLC, Center Valley, PA, USA) in an ultrasonic bath for 20 min and stored in a desiccator, which contained calcium sulfate, for at least 24 h. The cleaned PBI film was then treated at a variety of treatment times.

2.2. UV-Visible Spectrophotometers

Two Shimadzu (Columbia, MD, USA) UV-Vis Spectrophotometers (2600 and 2401PC) were used to obtain the photoabsorption spectrum for PBI from 700 to 220 nm. The instruments were calibrated with barium sulfate and both gave similar results.

2.3. UV Photo-Oxidation

The PBI sample was placed in the center of a cylindrical photochemical cell (2.54 cm diameter, 17.8 cm long), constructed of Suprasil® (Heraeus Quartz America LLC, Buford, GA, USA) quartz and fitted with a Cajon removable high vacuum stainless steel fitting, and put inside a Rayonet photochemical chamber (Southern New England Ultraviolet Co., Inc., Branford, CT, USA) having 16 low-pressure Hg lamps which emitted both 184.9 and 253.7 nm photons with around a 1:6 intensity ratio. High-purity oxygen (99.99%) flowed through the photochemical cell while high-purity nitrogen, which is transparent to UV radiation, flowed through the chamber for at least 10 min at flow rates of ca. 43 and 5 × 10³ sccm, respectively, in order to displace the air prior to the ignition of the radiation source. Since ozone is linked to a broad array of health threats [14], the exiting gas was passed through a solution of saturated KI in order to react with the ozone before emission into the vacuum hood.

2.4. X-Ray Photoelectron Spectroscopy (XPS)

The samples were analyzed with a Physical Electronics Versaprobe II 5000 XPS that examined the top 2–5 nm of a sample’s surface using a take-off angle of 45° between the sample and analyzer. A rectangular region of around 1400 by 600 µm was analyzed. The monochromatic Al Kα (1486 eV) X-ray beam irradiated the sample and the electron optics of the analyzer was focused to accept only photoelectrons emitted from the samples. The quantitative analyses are precise to within 5% relative for major constituents and 10% relative for minor constituents. The samples were charge-neutralized with a dual beam charge-neutralization system that utilized both a cold cathode electron flood source (~1 eV) and a very low-energy ion source (≤10 eV).
The high-resolution C 1s and N 1s spectra were normalized to the peak intensities at the main hydrocarbon and C-N peaks, respectively, and curve fitting was performed by using the C 1s and N 1s spectra for a cleaned and untreated PBI sample as the initial model. The process subtracted the control spectrum from that of the treated sample. The remainder spectrum was curve-fitted to determine the number of peaks, their binding energies, and peak widths resulting from treatment. The peaks from curve fitting the remainder spectrum were used to curve-fit the total treated spectrum. Any missing peaks, such as weak energy loss peaks, were then added to the curve fitting of the treated sample to achieve a good chi square fit. A materials balance was calculated to test if the results of the curve fitting agreed with the concentrations as determined from the quantitative analyses.

2.5. Contact Angle (CA) Goniometry

Water contact angles on the PBI films were measured using a Ramé-Hart model 250-F1 Standard Contact Angle Goniometer. The instrument includes a fiber optic illuminator, 3-axis specimen stage with leveling, U1 Series SuperSpeed digital camera, and DROPimage Advanced software. During the contact angle measurement, the intensity of the illuminator was set at 70%. The samples were placed on double-sided tape to keep the surface flat. A micropipette was used to deposit a 10 µL deionized water droplet on the surface. As soon as the water droplet was placed on the film, a picture was captured by the U1 Series Camera. The left-side and the right-side contact angles were measured by the DROPimage contact angle (CA) program. The standard deviation of the measurements was around ± 2.5°.

2.6. Surface Topography

Surface topography was determined using Bruker (Camarillo, CA, USA) DI-3000 Atomic Force Microscopy (AFM), in the tapping mode, and a JEOL JSM-7200FLV FESEM at 5 kV accelerating voltage. For each specimen, a 15 × 15 µm AFM image was obtained with the same Olympus (Camarillo, CA, USA) OTESPA tip, while for SEM analysis, an invisible film of platinum was sputter-coated on the samples to eliminate electrostatic charging.

3. Results

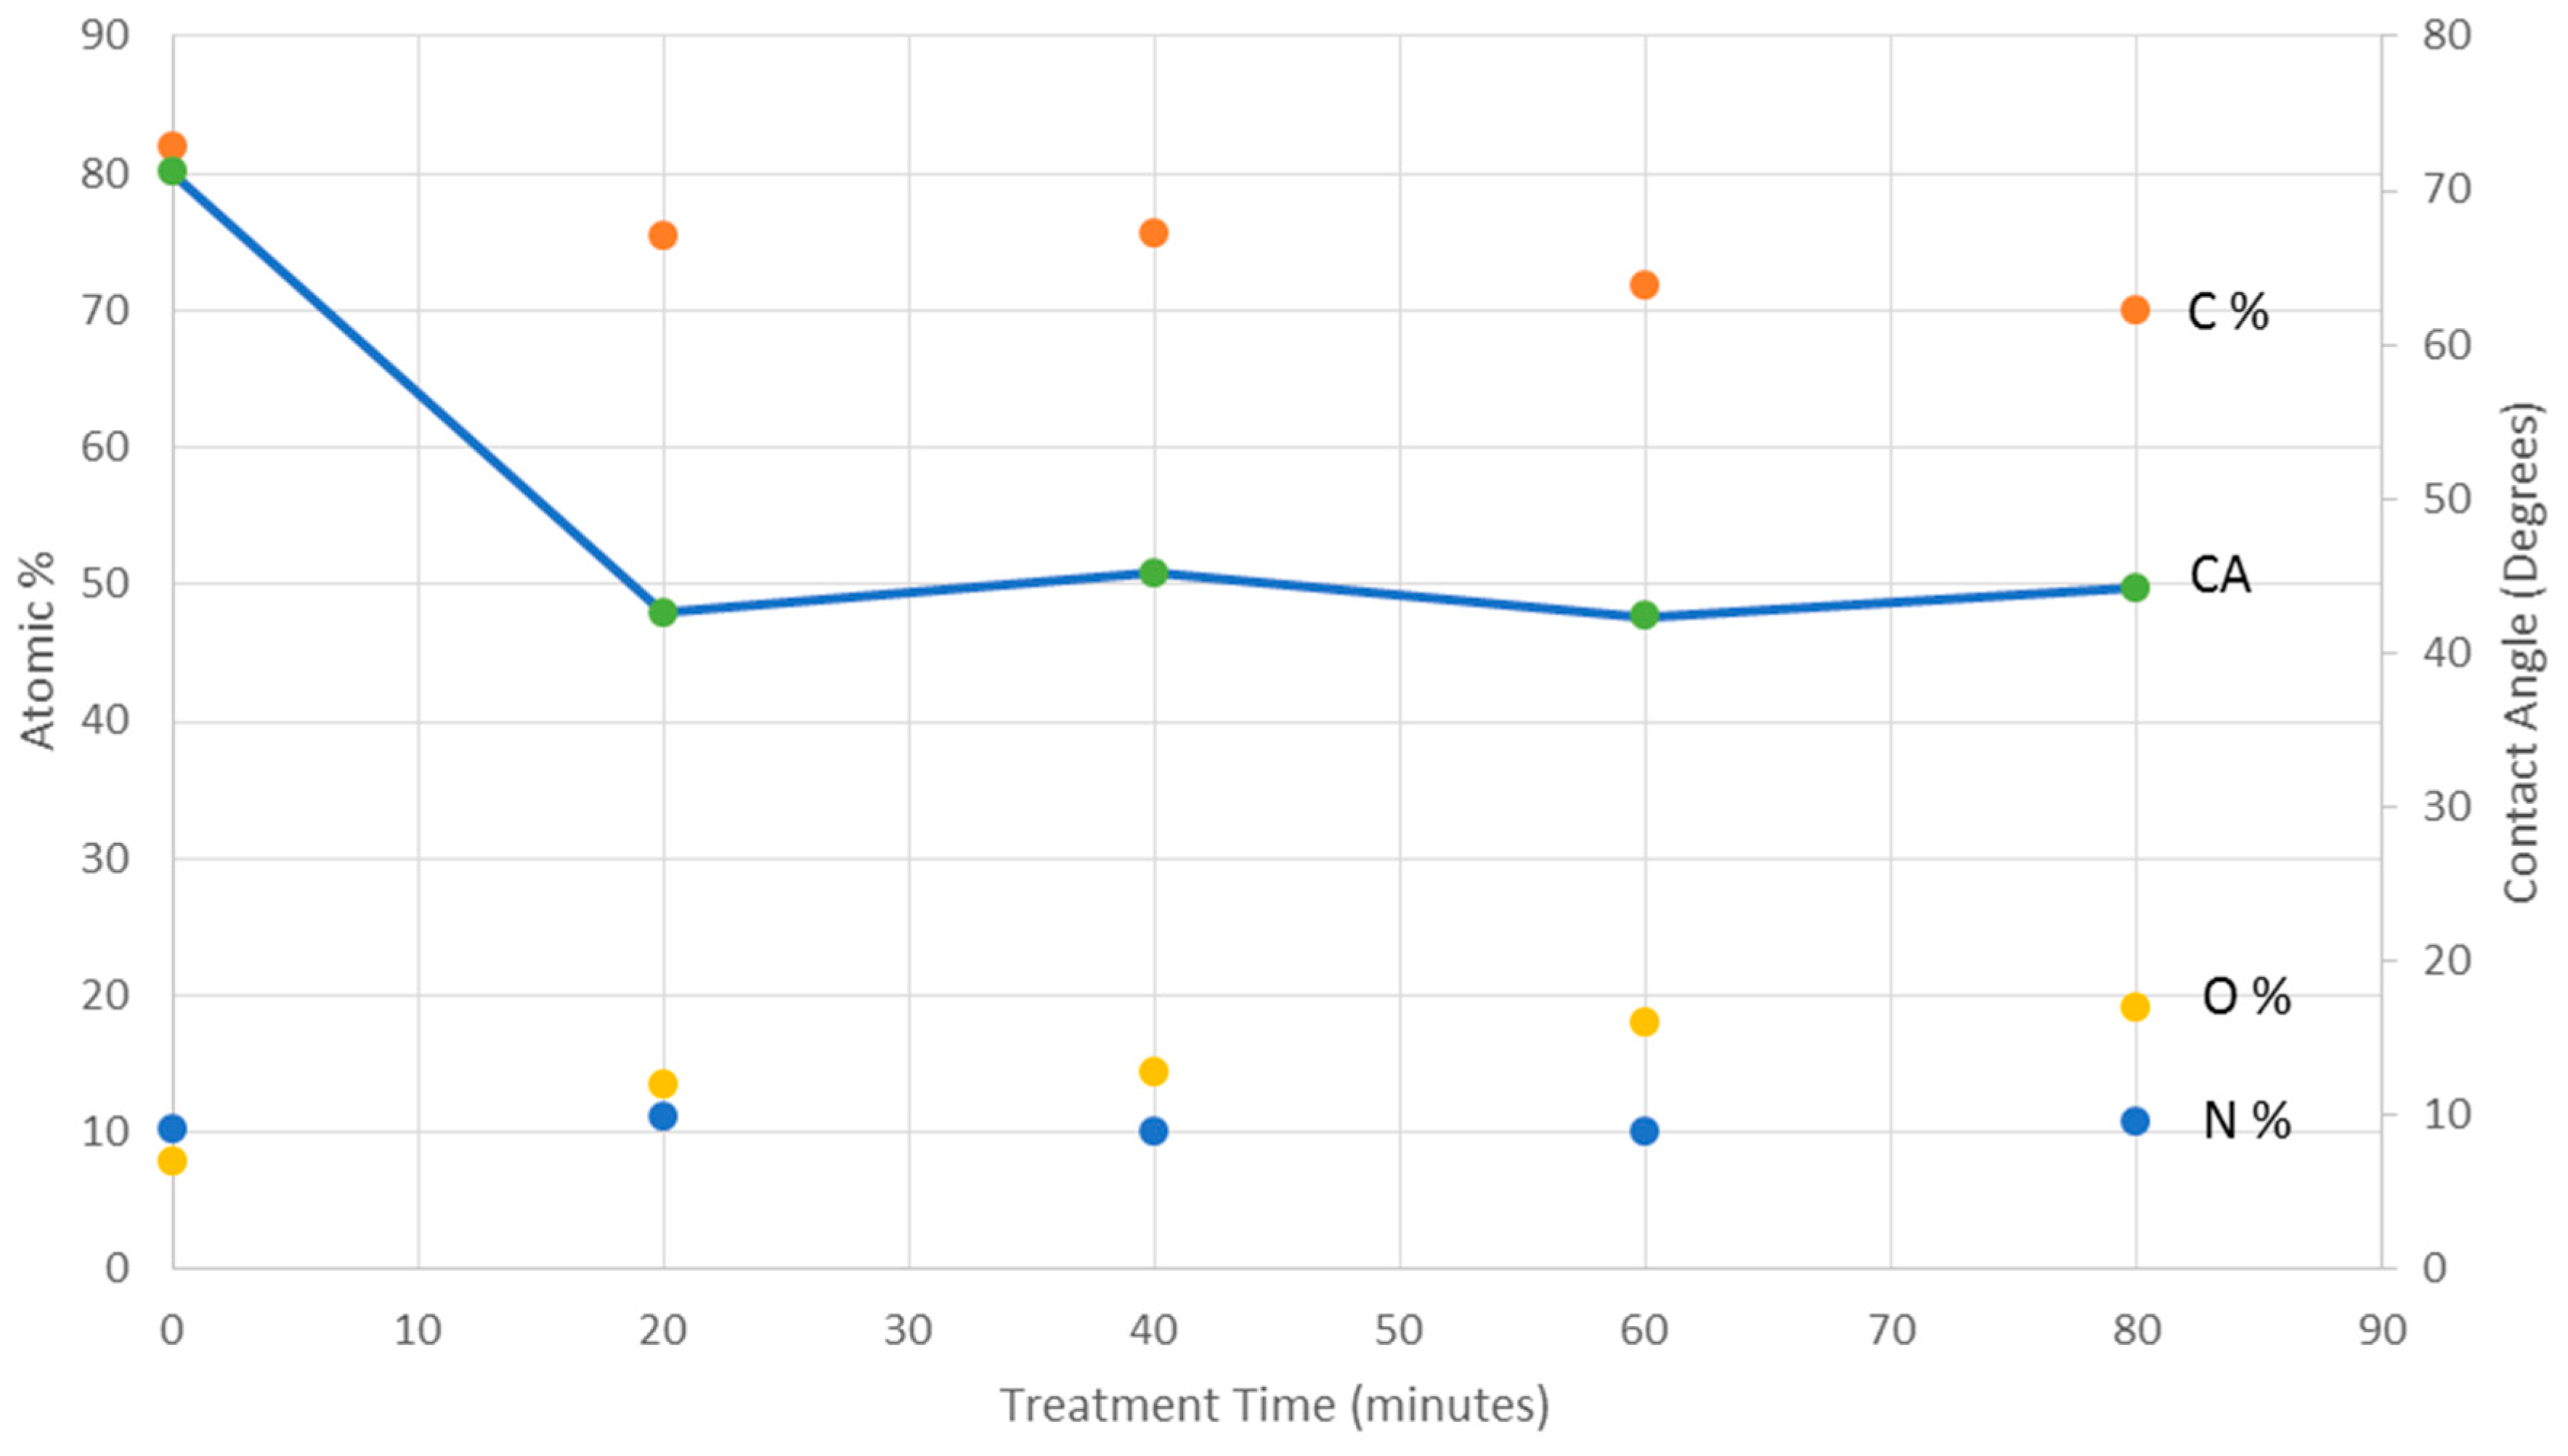
3.1. Quantitative XPS and Water Contact Angle

The elemental composition for the cleaned PBI film consisted of C, N, and O atoms. Although O is not in the PBI structure, the untreated samples contained 9.3 ± 1.3 atomic % (at %) O. For six sets of samples treated with UV photo-oxidation (Figure 2), the oxygen concentration increased up to a saturation level of 20.2 ± 0.7 at %, the carbon concentration decreased by around the same amount, and there were no significant changes in the nitrogen concentration. Figure 2 also shows that the increase in O atoms on the surface resulted in a decrease in the water contact angle down to ca. 44°, making the surface more hydrophilic with treatment. Washing the treated samples with distilled water decreased the saturation level for oxygen down to 17.7 at %.

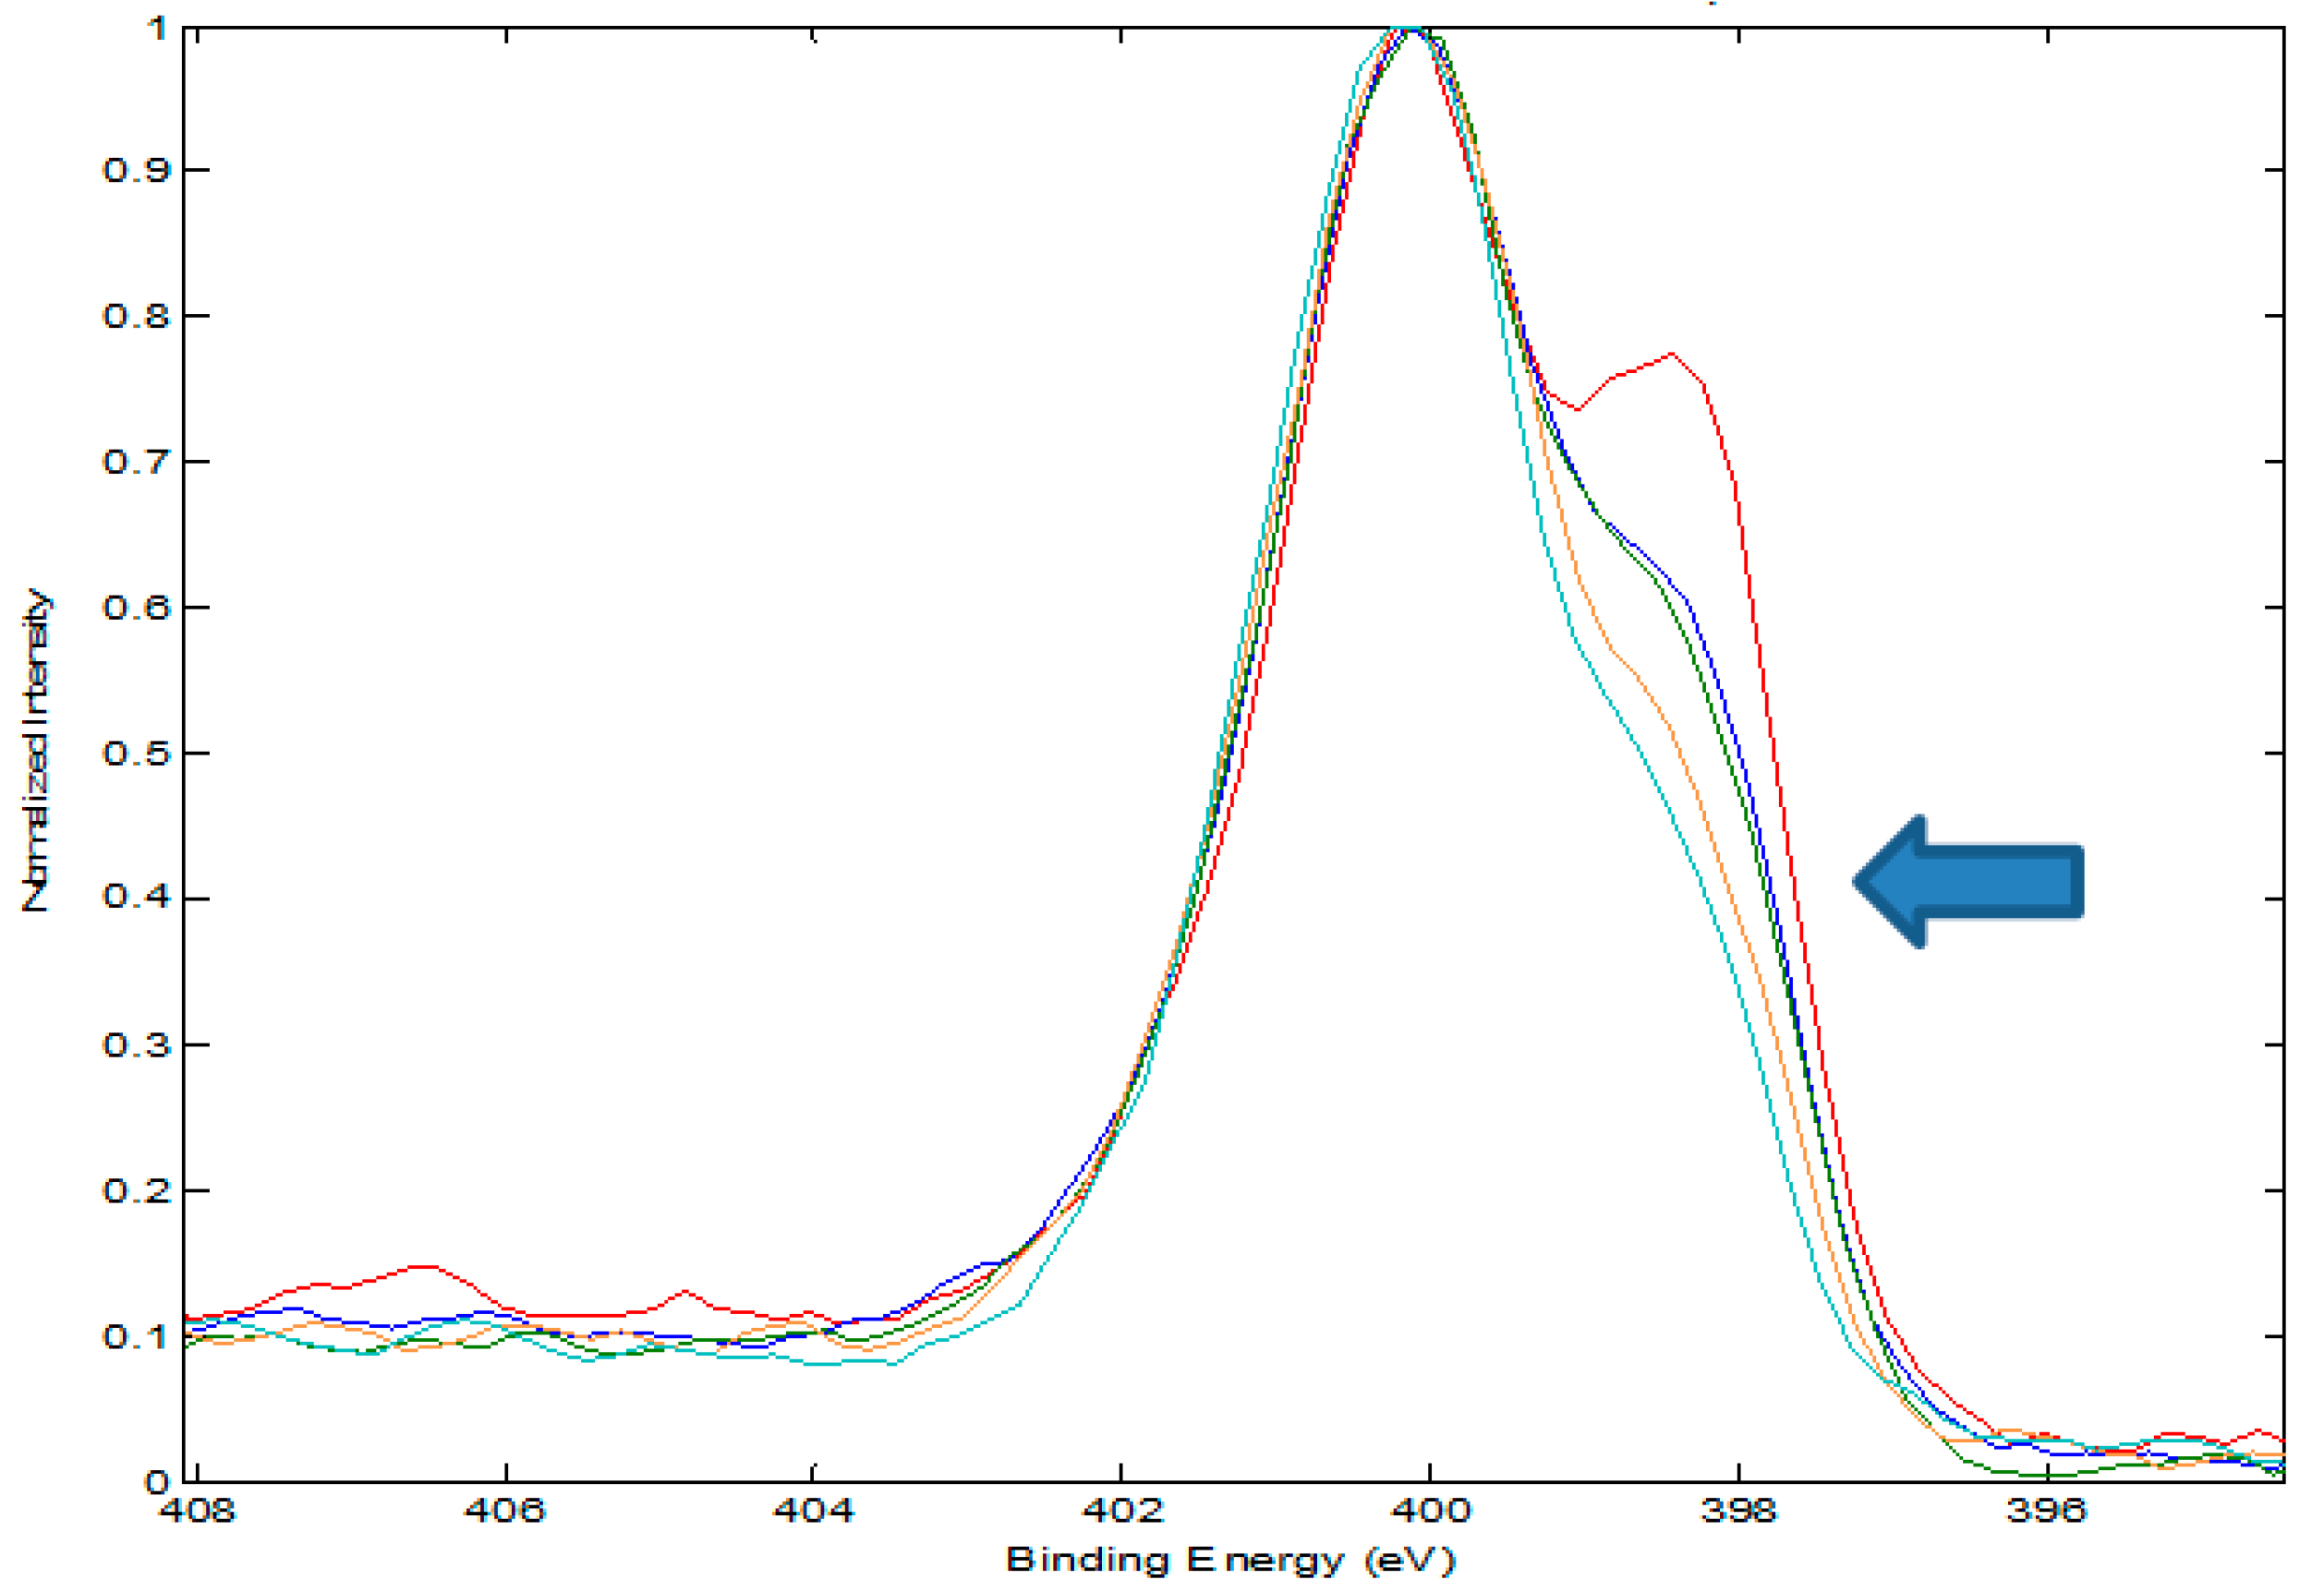
3.2. XPS Chemical State Analysis

Figure 3 and Figure 4 show the overlapped C 1s and N 1s spectra for the control and treated samples reported in Figure 2. The O 1s spectra were broad Gaussian peaks which did not provide any additional information than the C 1s and N 1s spectra.

3.3. Formatting of Mathematical Components

Curve fitting of the C 1s and N 1s spectra was accomplished using the binding energies for the chemical species given in Table 1 and Table 2. With increasing treatment time, there were significant decreases in the concentrations of C-C sp2 (Table 1) and C=N groups (Table 2) and increases in the concentrations of C=O, O-C=O, O-(C=O)-O, C-N, N-O, and N-C=O containing moieties.

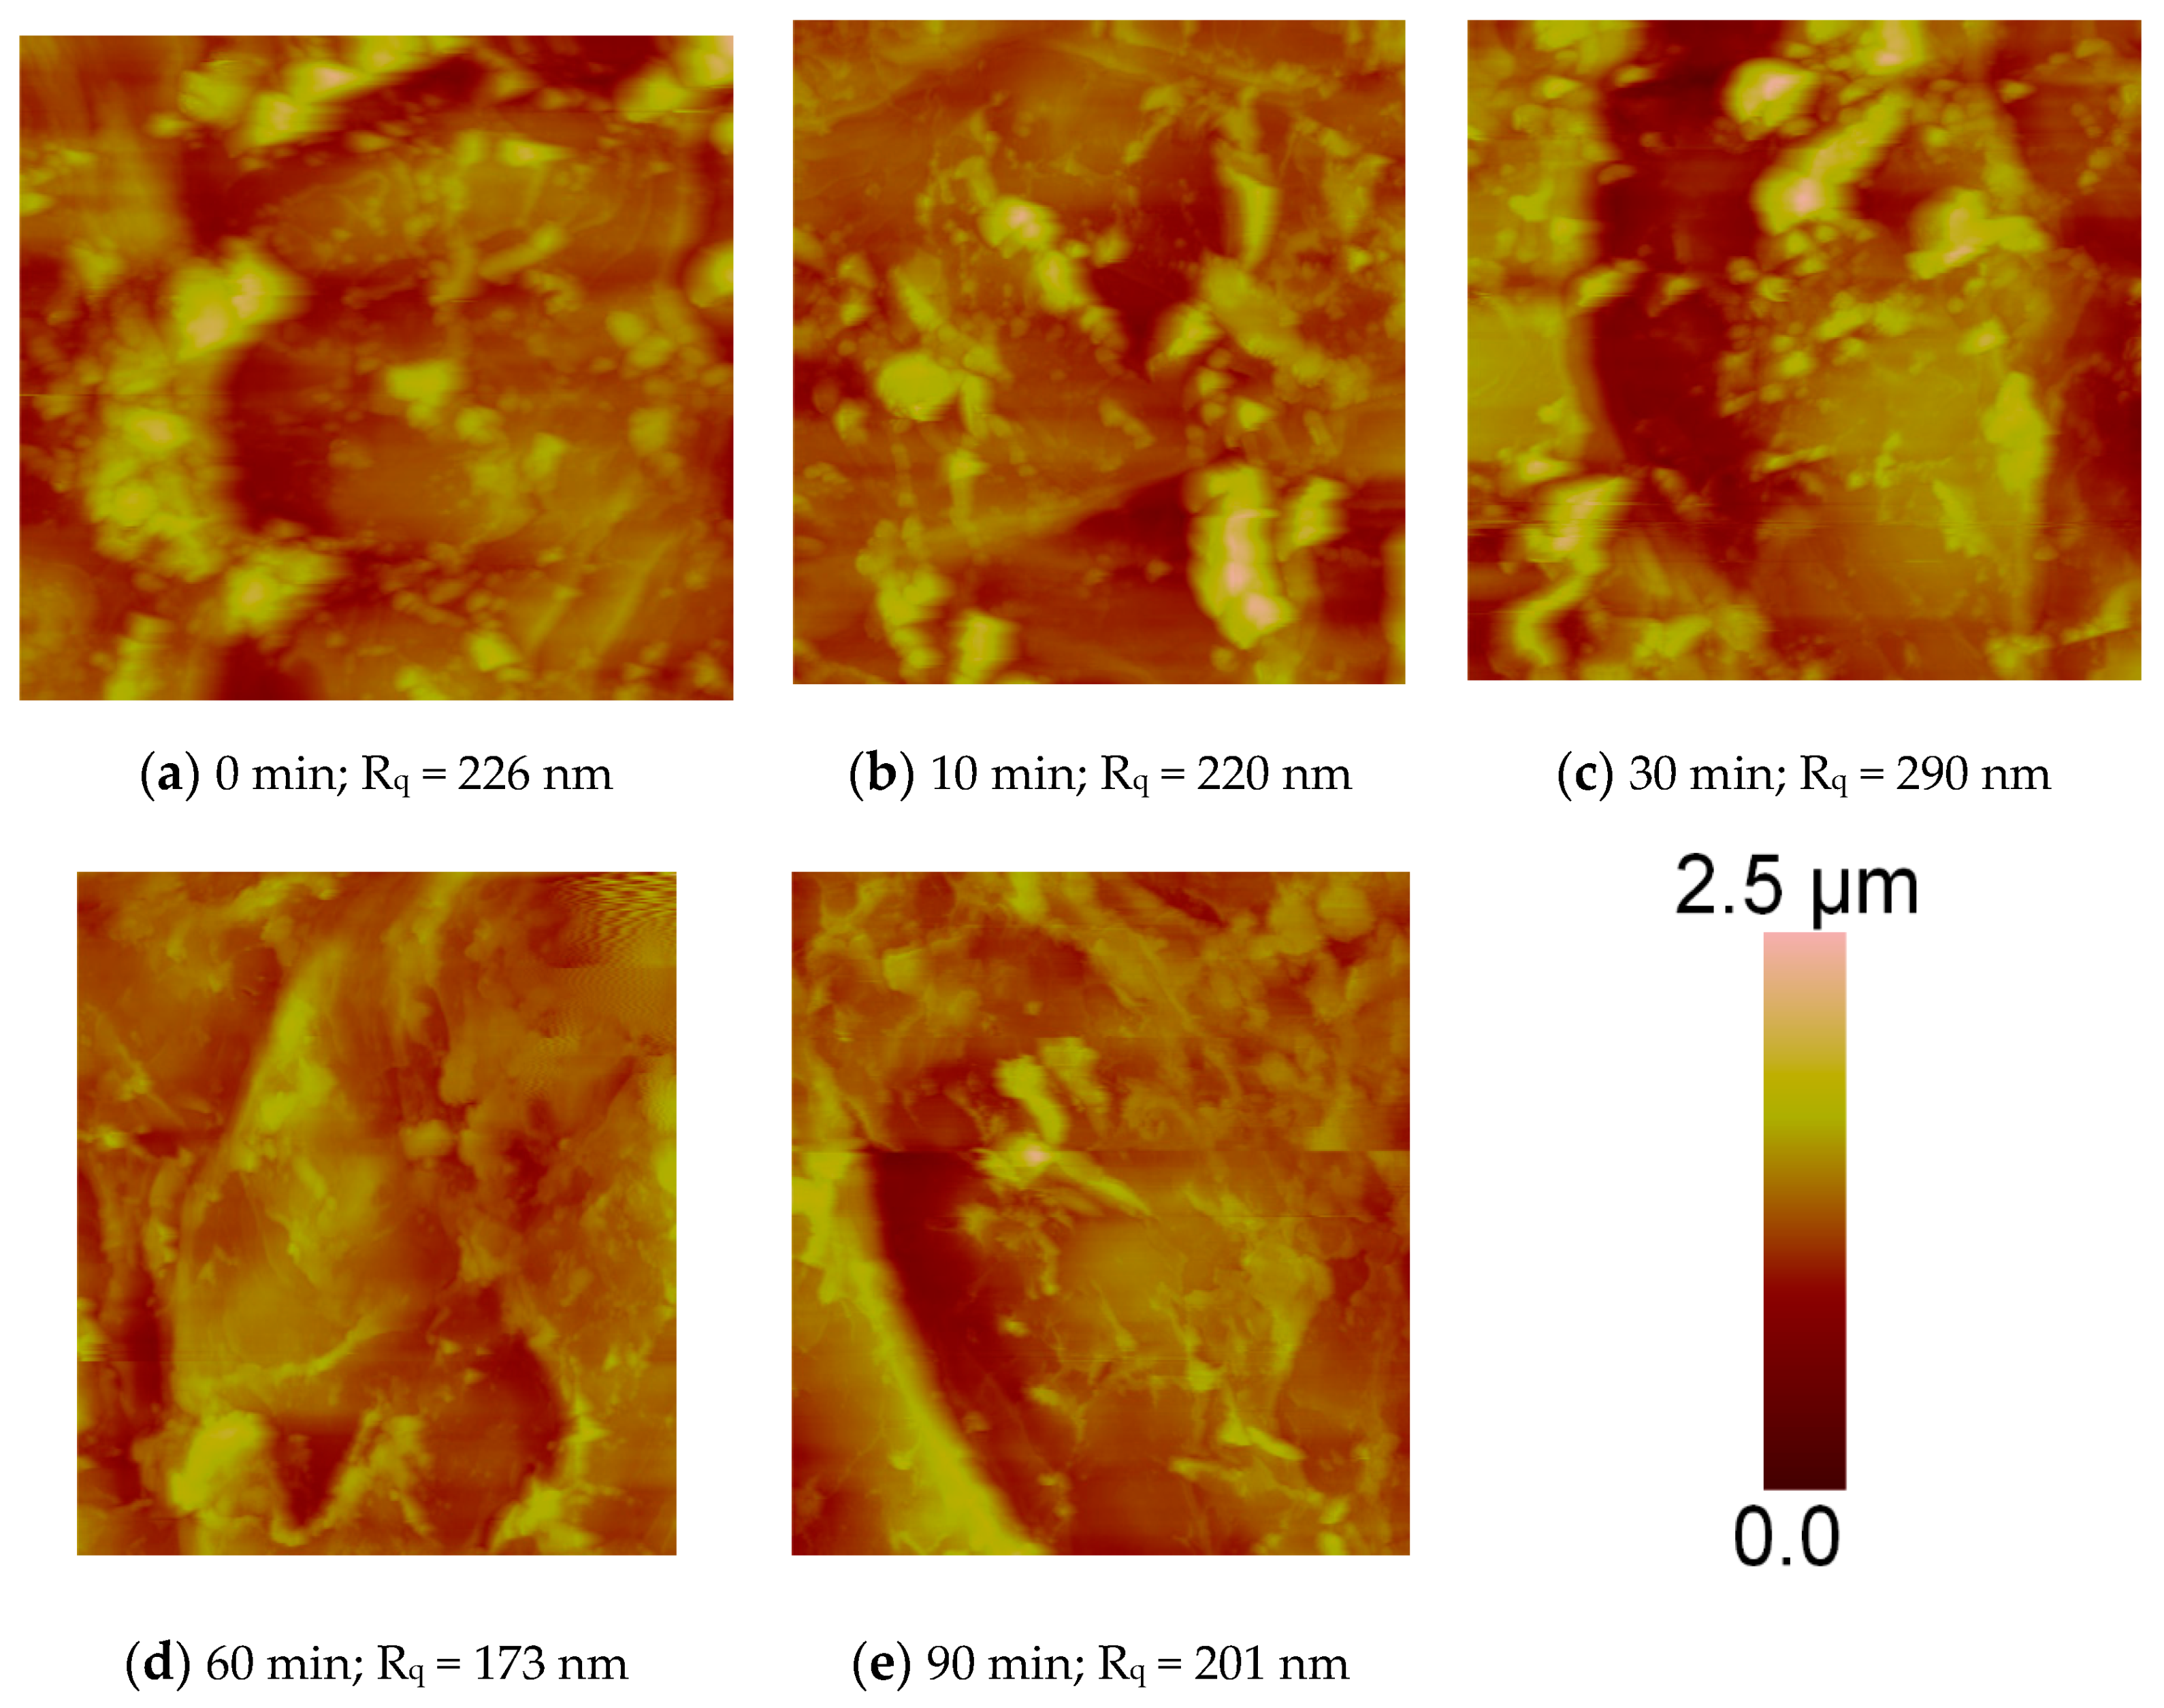
3.4. Surface Topography for PBI Treated with UV Photo-Oxidation

The AFM (Figure 5) and SEM (Figure 6) results showed no significant changes in surface topography with UV photo-oxidation treatment time.

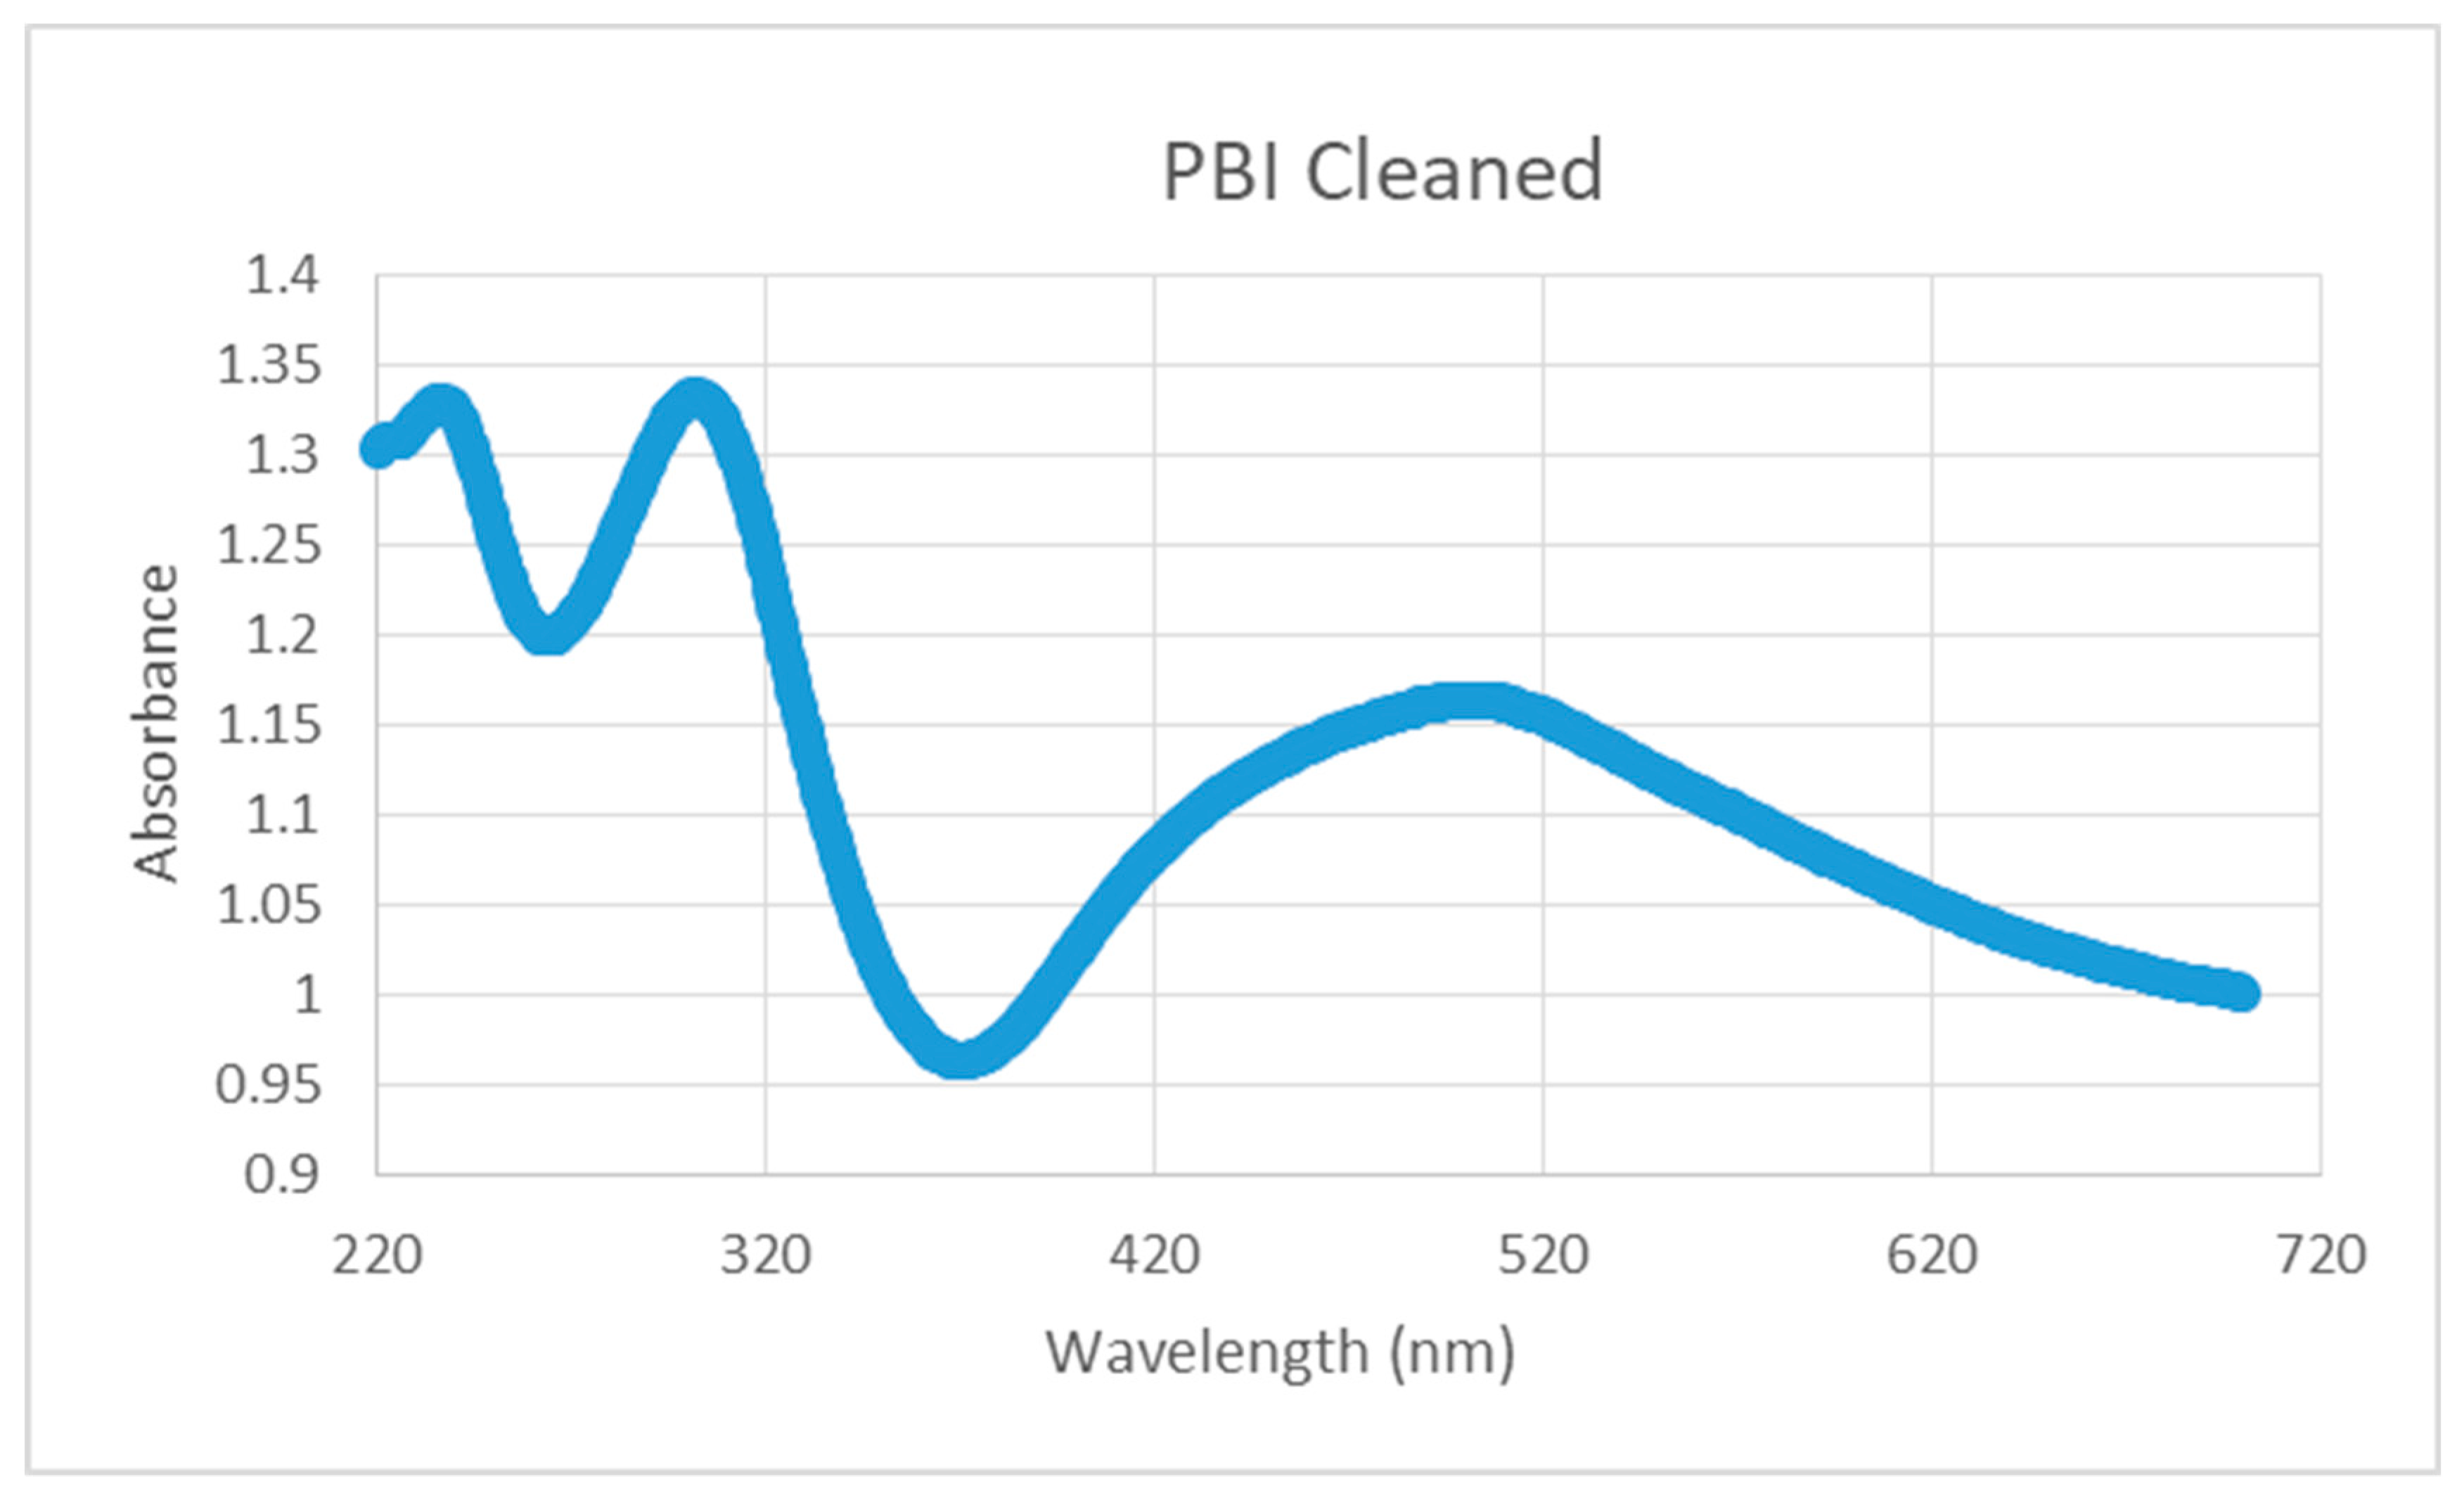
3.5. UV-Visible Photoabsorption Spectrum of PBI

Figure 7 shows the observed UV-visible photoabsorption spectrum for PBI. The 253.7 nm photons, which are transmitted through the oxygen [12], are absorbed by the PBI film, initiating photo-oxidation.

4. Discussion

The UV-Vis absorption spectrum of PBI has electronic excitations of the imino (-C=N), amine (-NH), and aromatic carbon groups. The longest wavelength UV-Vis band is due to absorption by the imino group, which has weak absorption in the near-UV and violet regions [12], that is consistent with the solid-state calculations for OH bonded to the phenylene group in PBI (OH-PBI), where the N 2s to N 2p electronic transition occurs at ca. 480 nm for the nitrogen atoms not bonded with the H atom [17]. Photo-oxidation in this region of the photoabsorption spectrum (> 300nm) for PBI containing the ethylene group (poly(2,2′-ethylene-5,5′-bibenzimidazole), instead of the phenylene group shown in the Figure 1, was studied by FTIR analysis and the results were explained using a mechanism where the benzimidazole unit acts as a photosensitizer in the oxidative degradation to form singlet molecular oxygen (1O2) responsible for eventually producing carbonyl, aldehyde, and hydroxide groups [18]. For aliphatic amines, the longest-wavelength absorption lies below 250 nm, with the first maximum near 220 nm [12], while calculated excitation energies for the N atoms in the NH group showed no contribution to the UV-Vis absorption spectrum of OH-PBI [17]. Photoabsorption by the aromatic groups in PBI is expected to have a peak similar to π→π* excitation of polystyrene (PS) and a number of ring-substituted analogues, such as –NH2, at ca. 270 nm and extending into the vacuum UV region [19,20,21].
UV photo-oxidation of PBI with 253.7 and 184.9 nm is due to the reaction of ozone, which is formed as a result of the photo-dissociation of O2 with 184.9 nm radiation (Equation (1)) and the 253.7 nm photons that are transmitted through the oxygen to initiate photo-oxidation of the PBI surface. Similar to PS studied with 253.7/184.9 nm photo-oxidation [22], the strong photoabsorption by the aromatic groups of PBI in the UV region resulted in a decrease in the C-C sp2 groups; increase in the O(1s)/C(1s) ratio to 0.30 ± 0.03 (compared to 0.53 for PS); and the formation of C=O and/or aldehyde, O-C=O and/or carboxylic acid, and O=C-O-C=O and/or O-(C=O)-O moieties with treatment time (Table 1). As with PS [23], the radiation absorbed by the aromatic groups had a total energy content in excess of that required for bond scission producing free radicals on the PBI surface by reaction (2). Reactions (3–7) illustrate the formation of carbonyl-containing compounds involving the R• free radical [23].
PBI + 253.7 nm → R• + R′•
R• + O2 → RO2
RO2• + PBI → ROOH + PBI•
RO2• + R• → 2RO•
ROOH → RO• + OH•
RO• → R″C=O + R‴•
The reaction of ozone with PBI was previously studied in the absence of radiation, where the ozone was made by an electric generator [24]. Decomposition of the primary ozonides formed by the addition of ozone to the C=C and C=N bonds, and reaction with the amine groups in PBI, decreased the C-C sp2 and C=N functional groups and increased the presence of C-N, N-C=O, and the carbonyl-containing moieties, as observed in this study (Table 1 and Table 2).
Washing the treated PBI surface with distilled water decreased the saturation level for oxygen from 20.2 ± 0.7 at % down to 17.7 at %, indicating the partial formation of a weak boundary layer due to the breakage of bonds by the UV radiation and decomposition of the primary ozonide. Ozone, produced by the electric generator, resulted in a greater decrease with washing from 27 ± 1 down to 13 at % O and larger concentrations of the anhydride group, O=C-O-C=O, which is the most oxidized form of carbon that releases CO2 [24].
Since the AFM (Figure 5) and SEM (Figure 6) results did not show any significant changes in surface topography with UV photo-oxidation treatment time, the improvement in hydrophilicity was primarily due to the oxidation of the surface (Figure 2).

5. Conclusions

The UV-Vis photoabsorption spectrum of PBI showed electronic excitation of the imino (-C=N), aromatic carbon, and amine (-NH) groups with shorter wavelengths, respectively. UV photo-oxidation of PBI film with 253.7 and 184.9 nm wavelength photons, in the presence of one atmosphere of oxygen, increased the oxygen concentration on the surface up to a saturation level of 20.2 ± 0.7 at %. With increasing treatment time, there was a significant decrease in the concentrations of C-C sp2 and C=N groups and increase in the concentrations of C=O, O-C=O, O-(C=O)-O, C-N, and N-C=O containing moieties due to photo-oxidation of the aromatic group in PBI and reaction with ozone. The observed decrease in the water contact angle down to ca. 44°, i.e., increase in hydrophilic, was due to the chemical changes on the surface because no significant changes in surface topography were detected by AFM and SEM measurements.

Author Contributions

D.S., K.M.A., I.C., S.L., T.R. and M.T. performed the experiments. J.S. helped initiate the research. M.M., S.K.G. and G.K.T. conducted the XPS, AFM, and SEM analyses, respectively. G.A.T. supervised the students, designed the experiments, and wrote the manuscript. All authors have read and agreed to the published version of the manuscript.

Funding

Six years of consecutive funding from Constellation Energy, an Excelon Co. (Chicago, IL, USA), E2: Energy to Educate program for grants supporting our projects entitled “Clean Energy Generation Using Hydrogen Fuel Cells: Training Sessions for High School Teachers and Students” encouraged the high school student Tyshawn Roundtree to participate in this research.

Acknowledgments

The authors gratefully acknowledge the help of (1) Tom Allston and Robert Winter with instrumentation and (2) Jeff Mills with preparation of figures. This research was presented at the Fall, 17–20 August 2020, National Meeting of the American Chemical Society.

Conflicts of Interest

The authors declare no conflict of interest.

References

  1. Li, Q.; Jensen, J.O.; Savinell, R.F.; Bjerrum, N.J. High temperature proton exchange membranes based on polybenzimidazoles for fuel cells. Prog. Polym. Sci. 2009, 34, 449–477. [Google Scholar] [CrossRef] [Green Version]
  2. Wainright, J.S.; Wang, J.-T.; Weng, D.; Savinell, R.; Litt, M. Acid-Doped Polybenzimidazoles: A New Polymer Electrolyte. J. Electrochem. Soc. 1995, 142, L121. [Google Scholar] [CrossRef]
  3. Davis, R.; Chin, J.; Lin, C.-C.; Petit, S. Accelerated weathering of polyaramid and polybenzimidazole firefighter protective clothing fabrics. Polym. Degrad. Stab. 2010, 95, 1642–1654. [Google Scholar] [CrossRef]
  4. Bhatnagar, N.; Pyngrope, D.; Pradhan, R.; Jha, S.; Bhowmik, S.; Poulis, H.; Bui, V.T.; Bonin, H. Electron beam modification of space durable polymeric nano-adhesive bonding of ultra-high temperature resistant polymer. J. Polym. Eng. 2011, 31, 381–386. [Google Scholar] [CrossRef]
  5. Quartarone, E.; Mustarelli, P. Polymer fuel cells based on polybenzimidazole/H3PO4. Energy Environ. Sci. 2012, 5, 6436–6444. [Google Scholar] [CrossRef]
  6. Araya, S.S.; Zhou, F.; Liso, V.; Sahlin, S.L.; Vang, J.R.; Thomas, S.; Gao, X.; Jeppesen, C.; Kær, S. A comprehensive review of PBI-based high temperature PEM fuel cells. Int. J. Hydrogen Energy 2016, 41, 21310–21344. [Google Scholar] [CrossRef]
  7. Ye, R.; Henkensmeier, D.; Yoon, S.J.; Huang, Z.; Kim, D.K.; Chang, Z.; Kim, S.; Chen, R. Redox Flow Batteries for Energy Storage: A Technology Review. J. Electrochem. Energy Convers. Storage 2017, 15, 010801. [Google Scholar] [CrossRef]
  8. Bülbül, E.; Atanasov, V.; Mehlhorn, M.; Bürger, M.; Chromik, A.; Häring, T.; Kerres, J. Highly phosphonated polypentafluorostyrene blended with polybenzimidazole: Application in vanadium redox flow battery. J. Membr. Sci. 2019, 194–203. [Google Scholar] [CrossRef]
  9. Jung, M.; Lee, W.; Noh, C.; Konovalova, A.; Yi, G.S.; Kim, S.; Kwon, Y.; Henkensmeier, D. Blending polybenzimidazole with an anion exchange polymer increases the efficiency of vanadium redox flow batteries. J. Membr. Sci. 2019, 580, 110–116. [Google Scholar] [CrossRef]
  10. Gubler, L.; Scherer, G.G. A Proton-Conducting Polymer Membrane as Solid Electrolyte—Function and Required Properties. Fuel Cells I 2008, 215, 1–14. [Google Scholar]
  11. Chandan, A.; Hattenberger, M.; El-Kharouf, A.; Du, S.; Dhir, A.; Self, V.; Pollet, B.G.; Ingram, A.; Bujalski, W. High temperature (HT) polymer electrolyte membrane fuel cells (PEMFC)—A review. J. Power Sources 2013, 231, 264–278. [Google Scholar] [CrossRef]
  12. Calvert, J.G.; Pitts, J.N. Photochemistry; John Wiley & Sons: New York, NY, USA, 1966; pp. 205–209. [Google Scholar]
  13. Okabe, H. Photochemistry of Small Molecules; John Wiley & Sons: New York, NY, USA, 1978; p. 179. [Google Scholar]
  14. Hess, G. Ozone Conflict Rages. Chem. Eng. News Arch. 2014, 92, 24–25. [Google Scholar]
  15. Beamson, G.; Briggs, D. High Resolution XPS of Organic Polymers; John Wiley & Sons: Chichester, UK, 1991. [Google Scholar]
  16. Losito, I.; Malitesta, C.; De Bari, I.; Calvano, C.D. X-ray photoelectron spectroscopy characterization of poly(2,3-diaminophenazine) films electrosynthesised on platinum. Thin Solid Films 2005, 473, 104–113. [Google Scholar] [CrossRef]
  17. Tang, Y.-H.; Tsai, M.-H.; Wu, C.; Bai, S. Electronic properties of heterocyclic aromatic hydroxyl rigid-rod polymers. Polymer 2004, 45, 459–465. [Google Scholar] [CrossRef]
  18. Kushwaha, O.S.; Avadhani, C.V.; Singh, R.P. Effect of UV Rays on Degradation and Stability of High Performance Polymer Membranes. Adv. Mater. Lett. 2014, 5, 272–279. [Google Scholar] [CrossRef]
  19. Weir, N.A. Photo and photooxidative reactions of polystyrene and of ring substituted polystyrenes. Dev. Polym. Degrad. 1982, 4, 143–188. [Google Scholar]
  20. Geuskens, G.; Baeyens-Volant, D.; Delaunois, G.; Lu-Vinh, Q.; Piret, W.; David, C. Photooxidation of polymers I. A quantitative study of the chemical reactions resulting from irradiation of polystyrene at 253.7 nm in the presence of oxygen. Euro. Polym. J. 1978, 14, 291–297. [Google Scholar] [CrossRef]
  21. Partridge, R.H. Vacuum-ultraviolet absorption spectrum of poly-styrene. J. Chem. Phys. 1967, 47, 4223–4227. [Google Scholar] [CrossRef]
  22. Khot, A.; Bailey, A.; Debies, T.; Takacs, G. XPS studies of poly(acrylic acid) grafted onto UV photo-oxidized polystyrene surfaces. J. Adhes. Sci. Technol. 2012, 26, 2627–2639. [Google Scholar] [CrossRef]
  23. Wells, R.K.; Royston, A.; Badyal, J.P.S. Direct Evidence for the Generation of Phenyl Radicals and Crosslinking during the Photolysis of a Polystyrene Film. Macromolecules 1994, 27, 7465–7468. [Google Scholar] [CrossRef]
  24. Omar, O.; Ha, B.; Vega, K.; Fleischer, A.; Moon, H.; Shertok, J.; Bailey, A.; Mehan, M.; Gupta, S.K.; Takacs, G.A. Reaction of ozone with polybenzimidazole (PBI). Ozone Sci. Eng. 2018, 40, 392–398. [Google Scholar] [CrossRef]
Figure 1. Molecular structure of polybenzimidazole (PBI).
Technologies 08 00052 g001
Figure 2. Quantitative XPS (at %) and water contact angle (CA) results for polybenzimidazole (PBI) (Celazole®) treated with UV photo-oxidation as a function of treatment time.
Technologies 08 00052 g002
Figure 3. Overlapped C 1s spectra for cleaned control and UV photo-oxidized PBI samples. The arrow indicates increasing treatment time for 0, 20, 40, 60, and 80 min.
Technologies 08 00052 g003
Figure 4. Overlapped N 1s spectra for cleaned control and UV photo-oxidized PBI samples. The arrow indicates increasing treatment time for 0, 20, 40, 60, and 80 min.
Technologies 08 00052 g004
Figure 5. AFM surface topographic images (15 × 15 µm) in tapping mode showing the root mean squared roughness in nm after 0, 10, 30, 60, and 90 min treatment with UV photo-oxidation.
Technologies 08 00052 g005
Figure 6. SEM surface topographic images at 500× and 2000× magnification after 0, 20, 40, 60, and 80 min treatment with UV photo-oxidation.
Technologies 08 00052 g006
Figure 7. UV-visible photoabsorption spectrum of polybenzimidazole (PBI) (Celazole®).
Technologies 08 00052 g007
Table 1. Assignments [15] and % areas for C 1s peaks as determined by curve fitting the spectra for PBI treated with UV photo-oxidation as a function of treatment time.
BindingSpeciesTreatment Time (min)
Energy (eV) 020406080
284.6C-C sp253.648.447.546.341.8
285.1C-C sp316.313.313.313.213.7
285.7C-N=9.06.89.48.28.1
286.0 Technologies 08 00052 i00111.711.411.211.811.4
287.0C=O, aldehyde4.36.86.26.06.0
287.9N-C=O1.04.73.84.76.4
288.6O-C=O, carboxylic acid2.55.65.97.09.8
289.8O=C-O-C=O, O-(C=O)-O1.32.12.12.33.0
292.0Energy Loss0.50.90.60.70.8
Table 2. Assignments [15,16] and % areas for N 1s peaks as determined by curve fitting the spectra for PBI treated with UV photo-oxidation as a function of treatment time.
BindingSpeciesTreatment Time (min)
Energy (eV) 020406080
398.4C=N39.732.632.327.223.9
400.2C-N53.960.060.265.168.4
402.0N-O6.47.47.47.77.7

