Article

Computer Vision Framework for Wheat Disease Identification and Classification Using Jetson GPU Infrastructure

by
Tagel Aboneh
1,†,‡,
Abebe Rorissa
1,‡,
Ramasamy Srinivasagan
2,* and
Ashenafi Gemechu
3,*
1
Big Data and HPC Center of Excellence, Department of Software Engineering, Addis Ababa Science and Technology University, P.O. Box 16417, Addis Ababa 999047, Ethiopia
2
Draper Hall, University of Albany, 135 Western Avenue, Albany, NY 12201, USA
3
Debre Zeyit Agricultural Research Institute, Debre Zeyit 999047, Ethiopia
*
Authors to whom correspondence should be addressed.
Current address: Addis Ababa, Ethiopia and Albany, ESA.
These authors contributed equally to this work.
Submission received: 26 April 2021 / Revised: 7 June 2021 / Accepted: 10 June 2021 / Published: 2 July 2021
(This article belongs to the Special Issue Multimedia Indexing and Retrieval)

Abstract

:
Diseases have adverse effects on crop production and yield loss. Various diseases such as leaf rust, stem rust, and strip rust can affect yield quality and quantity for a studied area. In addition, manual wheat disease identification and interpretation is time-consuming and cumbersome. Currently, decisions related to plants mainly rely on the level of expertise in the domain. To resolve these challenges and to identify wheat disease as early as possible, we implemented different deep learning models such as Inceptionv3, Resnet50, and VGG16/19. This research was conducted in collaboration with Bishoftu Agricultural Research Institute, Ethiopia. Our main objective was to automate plant-disease identification using advanced deep learning approaches and image data. For the experiment, RGB image data were collected from the Bishoftu area. From the experimental results, the VGG19 model classified wheat disease with 99.38% accuracy.

1. Introduction

Ethiopia is the second most populous country in Africa, next to Nigeria. According to UN reports, more than 85% of the population is primarily dependent on agriculture for their livelihood [1,2]. Agriculture is also the backbone [3] of the Ethiopian economy, and more than 85% of the National Growth Domestic Product of the country is derived from the agricultural sector [4]. The majority of the land is fragmented and has a very difficult topology due to the country’s geo-location as well as its valleys and mountains. Very recently, mechanized farming of large areas was introduced based on the direction and initiatives of the government. The country continues to struggle to feed its burgeoning population, now estimated at 110 million. The government imports millions of tons of wheat annually to meet market demands. With the existing agricultural technology, it is very difficult to achieve food security in Ethiopia for many years to come. Food self-sufficiency has been and continues to be a critical challenge for Ethiopia. Another significant challenge for the agriculture sector is in the area of managing and controlling crop diseases. In the Ethiopian agricultural system, one of the bottlenecks includes crop-disease identification and management. Currently, disease identification is performed using the human visual sensor manually via the human eye to recognize the symptoms of different diseases. Furthermore, data are collected using disease data collection sheets. Due to the limitations of human senses, crop diseases are identified at later stages of their development. The process of classifying a specific disease is labor-intensive and time-consuming. At the nation level, the agricultural automation process in Ethiopia is at its infancy. When it comes to the agricultural sector, there is a large and apparent digital divide between developed and developing countries such as Ethiopia. Developed countries employ state-of-the-art high-tech inputs in the sector to optimize production quality and quantity [5].
The identification of plant leaf diseases is critical to increase crop yield and growth. However, continuous monitoring of diseases in plant leaves is more difficult and expensive to implement in real-time [6].
Consequently, in this study, we proposed deep learning (DL) frameworks to classify and identify wheat rust in Ethiopia. Four different DL models were used to conduct the experiment. The classification performances of each model were evaluated against state-of-the-art models in a similar domain. In addition, evaluations of the computation cost and of the CPU run time were performed using a Jetson Nano Board accelerator, which is a low-power, embedded graphics processing unit (Jetson Nano) that allows for multiple neural networks to run simultaneously and for a computer vision algorithm for image classification to be applied.
According to Anteneh and colleagues [4], wheat is one of Ethiopia’s most important cereal crops in terms of the land area it covers, production volume, and the number of farmers engaged in its production. In 2016, it ranked fourth in terms of land covered, following crops such as teff, maize, and sorghum [7,8]. According to Taffesse and colleagues [9], teff, wheat, maize, sorghum, and barley are the major cereal crops that occupy almost three-quarters of the total area cultivated in Ethiopia. About 40% of the total food crops produced by an average Ethiopian farmer household was cereals. In the production season of 2011–2012, from the total grain produced in Ethiopia, cereals accounted for 188.09 million quintals according to the Central Statistics Agency in 2012. For the production year 2014–2015, the total grain production reached 270.4 million quintals, of which cereal production accounted for 235.45 million quintals. The total grain crops produced during the year 2015–2016 increased by 2.41 percent from the 2014–2015 total production according to data presented by the Central Statistics Agency. In addition, the Central Statistics Agency reported in 2018 and 2019 that the total cereal production of wheat was 267.8 million quintals and 277.7 million quintals in the 2017–2018 and 2018–2019 production seasons, respectively. Based on these reports, a 3.67% increase in production can be seen.
Dessalegn and colleague reported that, in 2020, about 4.6 million farmers produced 4.2 million tons of wheat across 1.6 million hectares of land, with an average productivity of 2.45 tons/ha according to CSA report in 2014 [10]. Wheat and wheat [11] products represent 14% of the total calorie intake in the country. That makes wheat the second most important grain crop in Ethiopia behind maize [12] (19 percent) and ahead of teff (10%), sorghum (11%), and enset (12%) FAO report in 2014 [13]. In Ethiopia, wheat ranks fourth, after teff, maize, and sorghum, in area coverage and third, after maize and teff, in total production according to the Central Statistic Agency’s report in 2012. However, the production of wheat is mainly for subsistence purposes, and it is dominated by the country’s numerous smallholder farmers that cultivate wheat more for consumption and less for the market. According Anteneh and colleagues [4], Wheat is produced by both small-scale and large-scale commercial farms. However, Kedir [14] argued that, except for some government-owned large-scale and commercial farms, wheat is produced predominantly by smallholder farmers under rain-fed conditions. It is clear that, in Ethiopia, small-scale wheat farmers outnumber large-scale commercial farms, and this has its own negative influence on production and productivity in the country, affecting the competitiveness of Ethiopian wheat on the world market in terms of price and quality.
In sub-Saharan African countries, wheat is also a strategic commodity that generates farm income and improves food security [10] status. Many African countries produce wheat for both consumption and sale, but the level of production and sale varies between countries. Overall, Ethiopia is one of the largest wheat producers in the sub-continent in terms of total wheat area cultivated and total production according to CSA report in 2012 [15]. In addition, wheat is an important stable and cash crop that improves farmers’ income, food security, employment, and contribution to the national GDP.
However, the production and productivity of wheat is threatened and curtailed by various biotic (yellow rust, stem rust, septoria, and fusarium) and abiotic (drought and heat) [16] factors [10]. Among the biotic factors, wheat rust (stem rust, yellow rust, and stripe rust) is one of the major obstacles to wheat production. Yilma Dessalegn et al. [10] argued that multifaceted biotic and abiotic factors are responsible for low yield of crops. The cultivation of unimproved low yielding varieties, insufficient and erratic rainfall, poor agronomic practices, diseases, and insect pests [16] are among the common constraints against wheat production in Ethiopia.
Similarly, its production is challenged by factors such as shortage of agricultural inputs, diseases and pests, shortage of infrastructure, shortage of institutional services, shortage of storage materials, product quality, low selling price, and price cheating. On the other hand, the opportunities including government policy, market expansion, increasing demand for wheat, and the potential of the area for wheat production encourage wheat producers and traders to engage in wheat production and marketing activities.
Generally, crop diseases are a major threat to food security [17]. However, their rapid identification remains difficult in many parts of the world due to a lack of the necessary infrastructure. A combination of increasing global smartphone penetration and recent advances in computer vision and deep learning techniques have paved the way for smartphone-assisted disease diagnosis [18]. Nevertheless, these approaches present some challenges in classification of plant disease. The challenges are the similarity between the characteristics (color, texture, and shape) of some classes (diseases). In addition, complex features such as morphological or geometrical, graph-based, or convex curved features and other feature extraction methods are more relevant for classifying diseases efficiently.
Despite improved production and productivity trends, Ethiopia faces a growing supply deficit and cannot meet the wheat demand for internal consumption. Even if it shows an increasing trend domestically, Ethiopian wheat production remains relatively small by global standards. To increase production, to create a surplus for export purposes, and to achieve a competitive advantage of wheat demand at the global level, the government should give due attention to the sector by encouraging and working with large-scale commercial investors. In this regard, one of the main challenges is the lack of adequate crop-disease management and control mechanisms used by farmers and experts in the domain. Plant disease can be defined as a deterioration of the normal state of plants that disrupts and modifies its growth. Pathogens are the main cause of such diseases. For agricultural purposes, a variety of methods have been used to detect plant diseases through the introduction of various technologies to the sector. In Ethiopia, agriculture experts and farmers use a survey method to identify diseases in wheat using their naked eyes. However, detecting plant diseases with high accuracy is still a challenging task in this sector [4]. Bottlenecks in the process of data collection [6] and interpretation also remain because they are time-consuming and highly challenging tasks that require more time and resources. Crop diseases also remain a major threat to food security. However, their swift rapid identification remains difficult in many parts of the developing world and countries such as Ethiopia due to a lack of essential infrastructure. In addition, according to [9], climate-change-induced [14] temperature increases are estimated to reduce wheat production in developing countries by 20 to 30%. Climate change is a serious threat to crop productivity in regions that are already food insecure.
A closer look and review of the related work shows a large digital divide in the application of the state-of-the-art technologies for improving the production quality and quantity of wheat crops in Ethiopia to ensure the country’s food security. We purposely selected the country on the basis of the volume of wheat production and consumption demand. In addition, the dominant application of AI-based technologies was used to automate the agricultural sector. The AI framework is mainly used to monitor wheat disease as early as possible.
In this study, the Jetson Nano infrastructure was used for computer-vision-based crop-disease classification. The deep learning framework proposed was run using the Jetson accelerator to reduce the computation complexity of image data processing. Image-based plant-disease identification helps agricultural domain experts identify diseased crops as early as possible to mitigate the challenges of yield loss.
On the other hand, current crop disease monitoring and management systems have many limitations when providing input for decision makers. In addition, a lack of timely and sufficient market information; the low price of the product at harvest time; weak market linkages among value chain actors and traders, price cheating, and less bargaining power of farmers in the market; and unfair competition from illegal traders are the major marketing constraints faced by wheat farmers and traders.

Contribution of This Study

The proposed model is obviously advantageous, and the contributions made in this paper are summarized as follows.
  • A deep learning-based classification system significantly improves the limitations of manual early wheat disease identification in Ethiopia’s agricultural sector.
  • A more general crop disease identification deep learning model, which can be applied to other crop-disease image disease datasets, is created and, at the same time, provides a reference for wheat disease researchers to prevent and and control wheat diseases.
  • Compared with deep learning models, this model achieves high accuracy in wheat disease image classification.
  • Finally, to resolve the computation complexity, the proposed model was deployed on a Jetson GPU computing machine and an optimal classification accuracy was obtained.

2. Review of Related Works

Several studies have been conducted on the use of image processing and computer vision techniques for the diagnosis of plant diseases, and these have proliferated over the years. According to [19,20,21,22,23], plant diseases are among the main challenges in food security. These challenges are even more acute in developing countries such as Ethiopia. Plant diseases are an impediment [21] to food safety, have disastrous consequences for farmers, and are a major threat to global food security. Plant diseases directly affect the quality of fruits and grains, and they lead to a decrease in agricultural productivity [22]. Due to a lack of appropriate technology, early plant-disease detection is performed by field observation using naked human eyes. This process is unreliable, inconsistent, and error prone. In addition, some of the major crops prone to different devastating diseases are wheat [23,24,25,26,27,28,29] maize, tomato [30], and potato [23].
In this study, we propose a wheat disease identification method using deep learning (DL) approaches. The research community in the domain of machine learning has made a lot of attempts to design robust models to detect plant diseases at its earliest stage. To implement our method, we applied RGB image data collected from the study area. Currently, image data play significant roles in designing robust decision support systems in the domain of agriculture. In this regard, image processing [21,31,32,33] is a complex task due to multiple factors. Some of the common problems such as high dimensionality [34], relevant feature extraction, limited training samples, and image quality highly affect the image classifiers. RGB image data are a combination of three channels that represent the visible [35] bands [36]. To address these limitations, researchers in the domain utilize hyper-spectral image (HSI) data to represent objects. HSI data contain richer spatial and spectral information than other data types. In addition, image reconstruction [37,38] has becomes a hot research area, and it is cost effective to obtain quality spectral features from the corresponding RGB image data. The current study employed RGB image data to classify the types of wheat diseases. In this section, a review of the related work on computer vision for crop image classification purposes is discussed:
In 2020, Ashok and colleagues [30,39] proposed an early detection method for tomato disease using a DL framework. Similarly, the identification or classification of pathological diseases in plant species via a mobile or web application was proposed by [40]. In that study, the author explored major diseases such as Blister Blight of Tea, Citrus Canker, Early Blight, Late Blight, and Powdery Mildew. Data augmentation: collecting and labeling adequate image data is a labor-intensive and time-consuming process. Improving the classification performance of a deep-learning framework [41] demands acquiring a large-scale dataset [42,43]. To address this challenge, data augmentation techniques have been used to conduct similar studies.
In this study, we employed an augmentation technique to increase the size of our test data. The approach improved the under fitting problem of the proposed models. Arun Pandian argued [6] that augmentation techniques yield better classification performance than the original datasets.
The main challenge in the agricultural sector is the identification of plant diseases as early as possible in order to minimize yield loss. Agricultural experts use manual recording systems to analyze disease characteristics. To handle the pitfalls, lots of attempts have been made to improve the state-of-the-art in the identification of plant disease in the agriculture domain. According to Pham, Tan Nhat, and Van [22], currently, computer vision has brought about significant contribution to improve the precision of agriculture systems.
A deep-learning model is an advanced machine learning approach that was inspired by the human neural architecture to resolve complex problems. Thus far, deep-learning frameworks have been dominantly used in the domain of image processing in general and crop-disease classification specifically, using image data. In this subsection, we discuss some of the prominent deep-learning models utilized in the domain of crop-disease identification and classification using image datasets.
Collecting a large amount of training data is a highly challenging task. To resolve this problem, the authors proposed different image augmentation techniques such as image flipping, cropping, rotation, color transformation, PCA color augmentation, noise injection, Generative Adversarial Networks (GANs), and Neural Style Transfer (NST) techniques. Similarly, Zongyong Cui et al. presented a augmentation technique using SAR GAN to address the limitations of small training samples [44]. Data augmentation with local and non-local constraints approaches was explored by Feng and colleagues [45] to resolve insufficient training samples. In addition, a GAN framework was initiated by Frid-Adar and colleague [44] to enlarge the size of data and its diversity by applying synthetic data augmentation for medical domain. Kosaku Fujita [46] proposed data augmentation using denoising techniques to transform a new dataset. Color restoration methods for RGBN cameras has also been proposed by [47] to generate new training data with high spectral response. Jakub Nalepa applied novel training-time and testing-time augmentation techniques to improve the generalization capability of the proposed deep learning model [33].
Adedoja and colleagues [17] proposed a deep learning-based approach to identify diseased plants using leaf images by transfer learning. That study used the NASNet architecture for convolutional neural networks (CNN). In 2020, the ResNet and Xception models were proposed by Srinivasan and colleagues [47,48] to identify Early Blight disease in tomatoes. The authors further utilized the YOLO framework to extract spatial features. At the expense of computational time, the Xception model performs better with improved classification accuracy than ResNet. For the purposes of object detection, the authors [39] employed YOLOv3, YOLOv3-tiny, and YOLOv3-SPP as feature extractors to detect the diseased region of tomato leaves. Azeddin and Florenting [49] also applied the DCNN mobileNet framework to recognize the top ten tomato diseases. They argued that 20% of food production losses globally are due to crop disease in global scenario. Similarly, CNN-based R-CNN for segmentation and extraction of wheat spikes was proposed by [26] to classify wheat diseases. The limitation of this proposed approach is that it is used for general crop disease classification purposes.

Conventional Crop-Disease Classification Process

The current study was conducted in collaboration with Bishoftu Agricultural Research Institute in Ethiopia. Our main objective is to assess the challenges of a conventional crop disease classification system and to handle those pitfalls in the agriculture domain area.
Parameters used to assess wheat disease: the most important parameters used to assess wheat disease are disease severity, incidence, and prevalence to quantify the infection level and distribution. Wheat disease assessments are required for many purposes, including predicting yield loss, monitoring and forecasting epidemics, judging host resistance, and studying fundamental biological host–pathogen processes [50,51]. If assessments of disease intensity are inaccurate and/or imprecise, incorrect conclusions might be drawn and incorrect actions might be taken.
Disease incidence is calculated using the number of infected plants and expressed as a percentage of the total number of plants assessed.
D i s e a s e   I n c i d e n c e = N u m b e r   o f   d i s e a s e d   p l a n t s T o t a l   n u m b e r   o f   p l a n t s   i n q u a d r a n t × 100
Disease severity is the percentage of relevant host tissues or organs covered by symptom or lesion or damaged by the disease. Severity results from the number and size of the lesions.
D i s e a s e   S e v e r i t y = A r e a   o f   p l a n t t   i s s u e   a f f e c t e d T o t a l   a r e a × 100
Disease prevalence is measured by using the number of fields affected divided by the total number of fields assessed and expressed as percentage.
D i s e a s e   P r e v a l e n c e = N u m b e r   o f   i n f e c t e d   f i e l d s T o t a l   n u m b e r   o f   f i e l d s   a s s e s s e d × 100
The correlation between wheat variability against genetic structure was evaluated in response to different diseases.
  • Wheat varieties with a narrow genetic base results in genetic vulnerability and genetic erosion. Hence, genetic variability in wheat is very important for disease resistance.
  • Genetic vulnerability is the susceptibility of most cultivated varieties of a crop species to various biotic diseases. Abiotic stresses due to similarities in their geno-types and the “gene-for-gene” theory also improves this reality for every resistance gene present in the host, and the pathogen has a gene for virulence.
  • A susceptible reaction results when the pathogens are able to match (matching interaction/compatible interaction) all of the resistance genes that are present in the host with virulence genes. If one or more of the resistance genes are unmatched (non-matching interaction/incompatible interaction), a resistance reaction could result.
  • Genetic resistance is governed by nuclear genes, cytoplasmic genes, or both. In other words, genetic resistance is an inbuilt mechanism or inherent property and it is measured in relation to susceptible wheat varieties or genotypes.
  • Breeding of resistant cultivars considers the genetic variability of both diseases and the host plant, and the resistant variety may become susceptible after a few years due to the formation of new races or evolution of the pathogen.
  • A new generation of variability in diseases may also develop through mutation, sexual reproduction, heterokaryosis, and para-sexual reproduction.
The conventional system for disease identification is limied by the following:
  • Symptoms of several non-infectious or abiotic factors are similar to those caused by several viruses, and many root pathogens could lead to the wrong conclusion.
  • Classification relies on phenotypic biochemical characteristics.
  • A high skill level is necessary for optimal results.
  • Contamination is a risk during disease identification in the laboratory.
  • The process of identifying the specific disease types is time-consuming.
The ground truth knowledge acquired from the research institute was important to develop the current study. Based on the gaps identified from existing systems, we proposed a computer-vision-based deep learning model to efficiently classify crop diseases using image datasets.
At the national level, a early wheat rust warning system has been proposed by the Ethiopian Institute of Agricultural Research (EIAR) in collaboration with Cambridge University and other stakeholders [16]. The proposed system does not utilize any machine learning approaches to generate insight from the dataset. The system disseminates a short message for the farmer to the farmer based on their request. The system is also prone to multiple interpretations. Farmers’ lack of adequate technological literacy is another bottleneck. The following Figure 1 illustrates the the overall architecture of the proposed early warning system to show the efforts made by the government of Ethiopia at the national level.
To build an early wheat rust warning system, global meteorology data are used to create an NWP model to analyze environmental suitability. Similarly, a spore dispersion model is incorporated to design an epidemiology model for wheat rust spore analysis. Wheat rust spore dispersion was highly activated by the wind and water to invade different regions with a short time. In addition, the ODK model was used to obtain labeled input data. On the other hand, the local wheat rust survey data were collected by the Ethiopian Agricultural Transformation Agency (ATA) using trained extension workers and farmers. Then, the proposed early wheat rust warning system was used as the input data to analyze and plot the model outputs. The EWS model output’s were further interpreted by a wheat rust advisory team. The final information was disseminated by the ATA through SMS to alert the agriculture extension workers and farmers. The following points are the major limitations of an early wheat rust early warning system:
  • The system lacked efficiency in generating new insights from existing data.
  • There is no mechanism to fuse data with different variabilities to generate aggregated results for interpretation purposes.
  • Data are continuously interpreted by multiple experts, which is labor-intensive and time-consuming.
These limitations of the current system inspired us to propose a computer-vision-based deep learning model to improve the process of wheat rust disease identification. In addition, this study significantly addresses the manual data-processing challenge and improves precision farming from an early disease identification perspective.

3. Materials and Methods
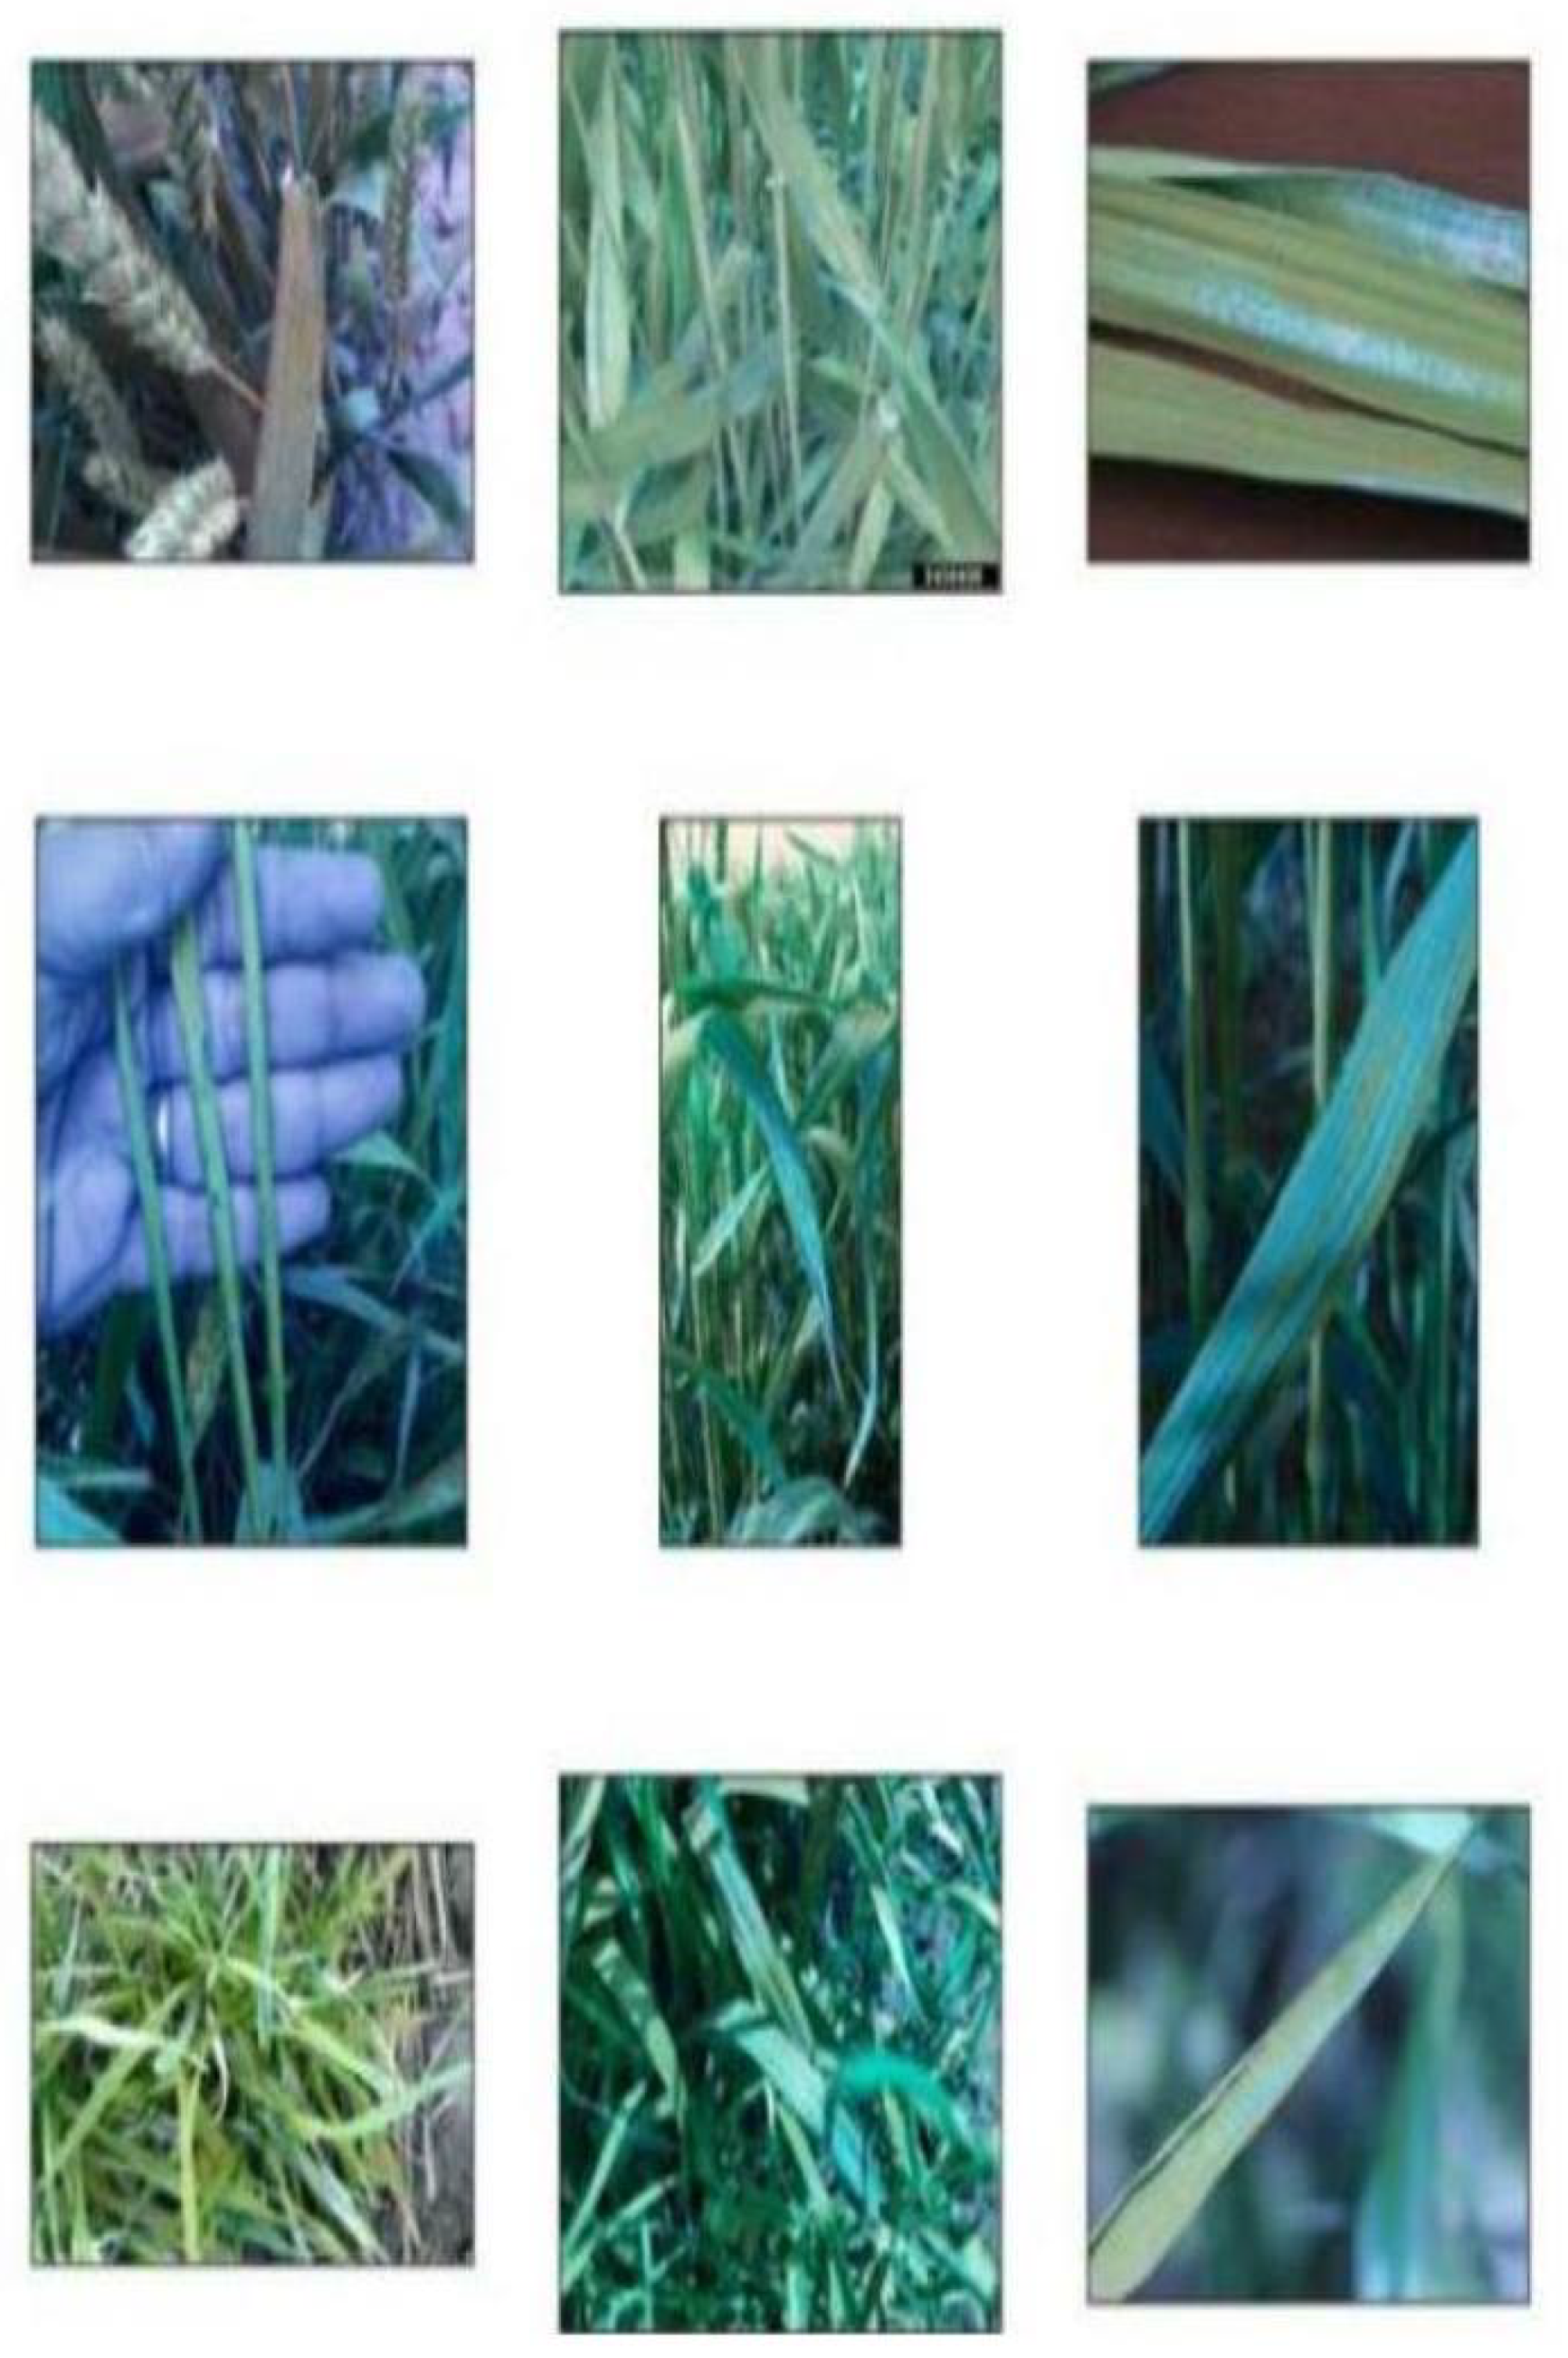
An experimental research approach was employed to implement the deep learning framework to classify wheat disease datasets. We conducted a preliminary survey on the study’s geographic area to assess the challenges of the existing manual plant disease identification system. In this subsection, we discuss the methods applied to achieve the proposed objectives [52,53,54,55,56].

3.1. Datasets

To implement the experiment using the proposed model, we collected image data from mundi.com open source repositories. The repository contains more than 1500 wheat disease image data from three classes. We collected RGB image data from the Bishoftu Agricultural Research Institute, Ethiopia. Data preprocessing, standardizing, formatting, removing, and rescaling were performed [57]. Then, we labeleld the training and test data.

3.2. Data Processing

Acquisition of the images, image preprocessing, image segmentation, relevant feature extraction, and disease classification techniques were utilized based on the leaf and stem images. During the data preprocessing stage, we performed image standardization, formatting, removal of poor-quality images, rescaling of image size, and cropping of irrelevant parts of the image. In addition, we transformed the data by rescaling and setting the dimensions of images to 224 × 224 , c h a n n e l = 3 to standardize the dataset. The following Figure 2 shows the sample training image data from the wheat-leaf disease class.
Data augmentation techniques have been employed to resolve the problem of small data size. There are different types of augmentation techniques available. For the purpose of this study, we considered cropping, flipping, and rotation techniques to increase the size of the training datasets [58]. To improve the generalization performance and to avoid model overfitting, we need to address the training dataset issue.

3.3. Computation Infrastructure

In this study, to conduct the experiment, both CPU and GPU (Nvidia Tesla T4 and Nvidia K80) computation infrastructure have been used. To train the deep learning model, high-performance computing facilities are critical. In this study, a Jetson Nano developer kit facility was used to train our models. Due to the data size and the number of epochs (iteration), the CPU took a long time to train the model and, sometimes, it jammed without generating any output. The GPU was an NVIDIA Maxwell architecture with 128 NVIDIA CUDA cores, the CPU was a Quad-core ARM Cortex-A57 MPCore processor, the memory was 2 GB 64-bit LPDDR4, the storage was a MicroSD, and the connectivity used was a gigabit ethernet.

3.4. Deep Learning Models

In this study, the Inception v3, Resnet50, and VGG16/19 pretrained deep learning frameworks were selected to implement the wheat diseases image classification tasks. All of the selected models were run using the GPU and CPU infrastructure. The selected models were customized to handle any problem that arose. The following subsection presents a discussion of the performances of each the experimental outputs and the performances of each model.

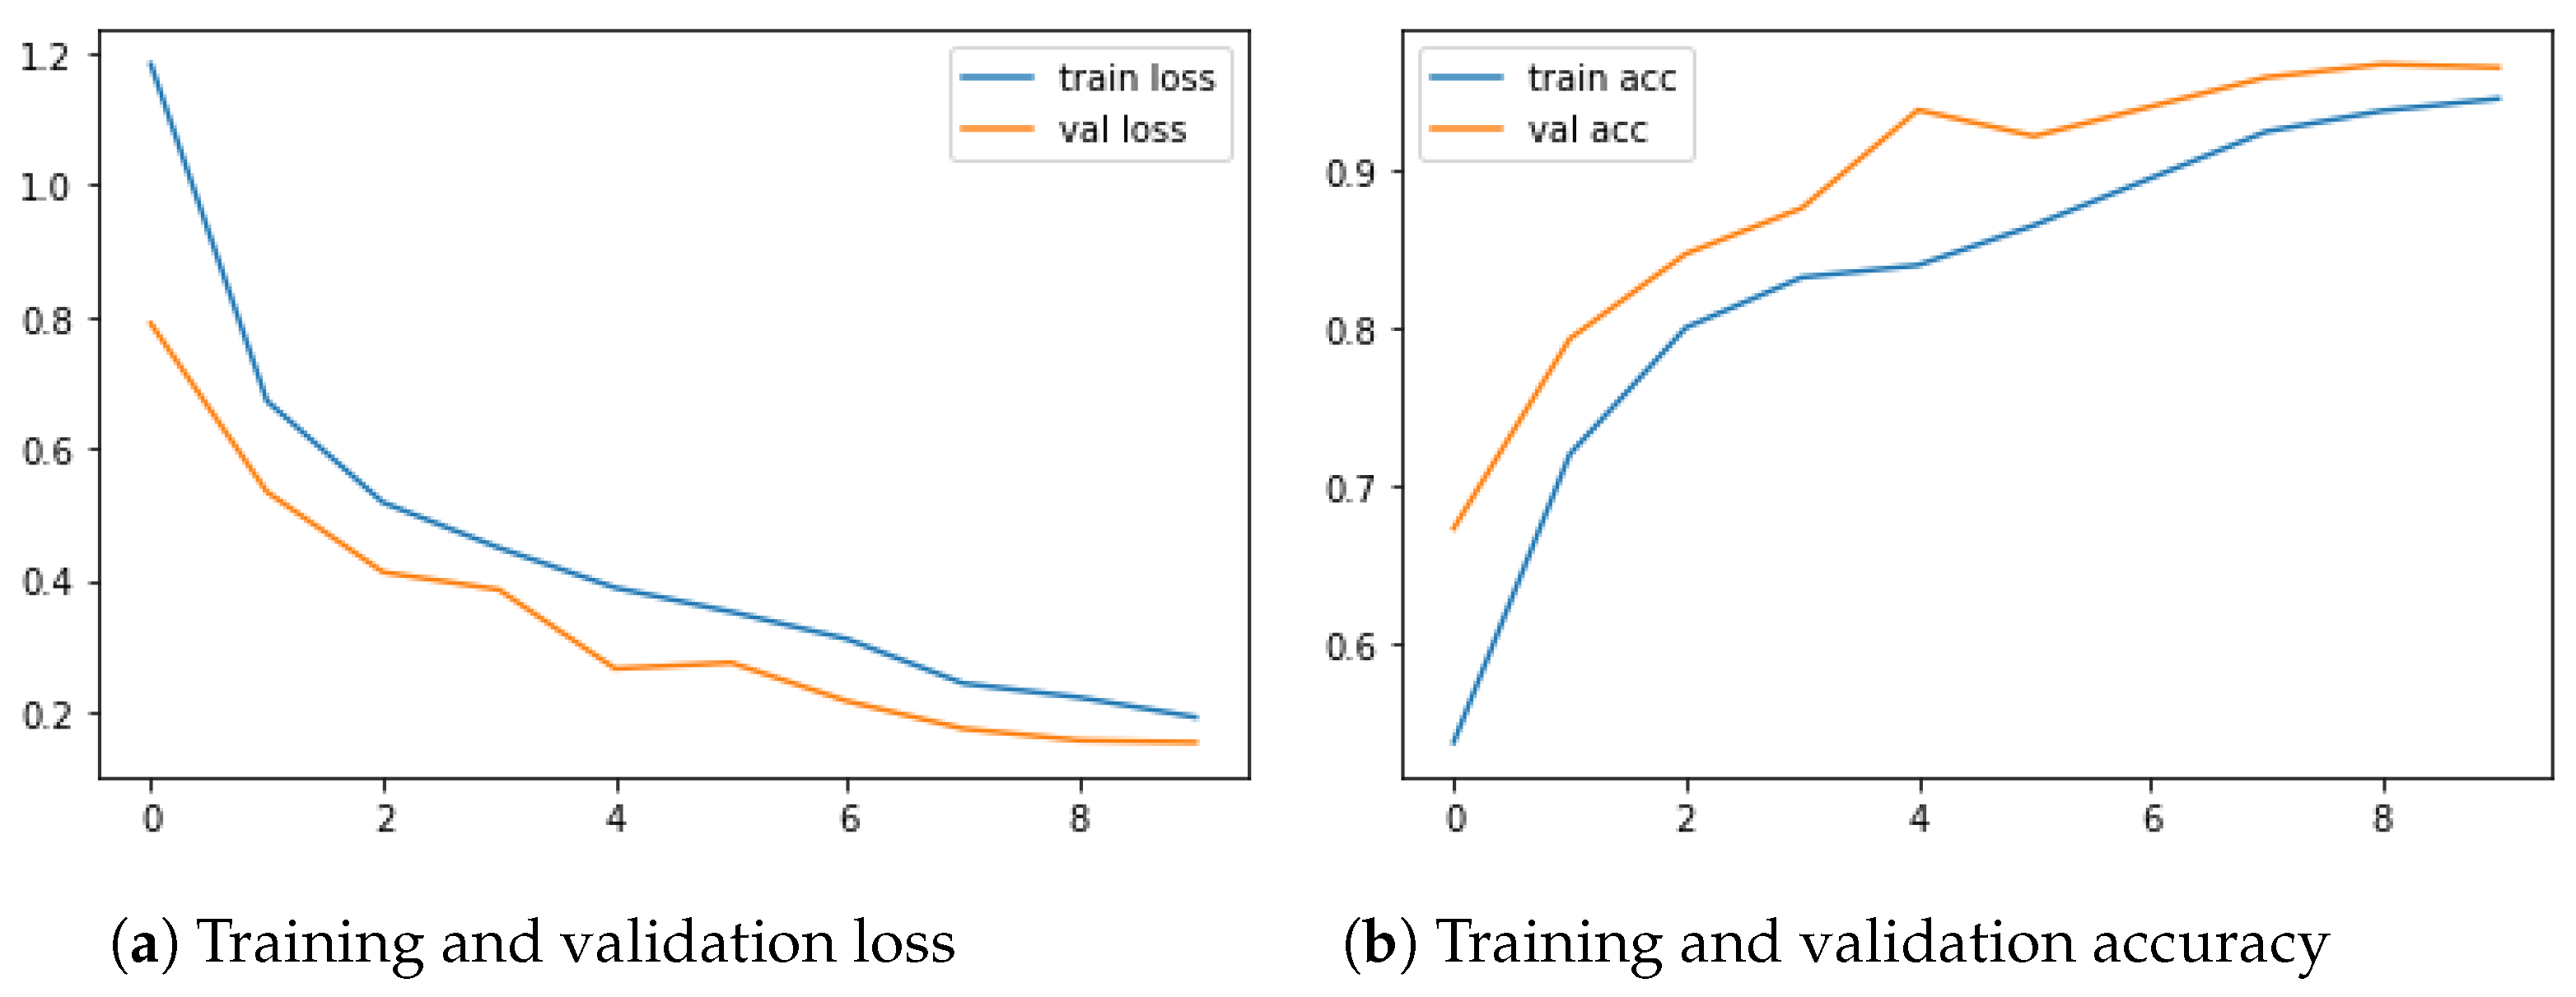
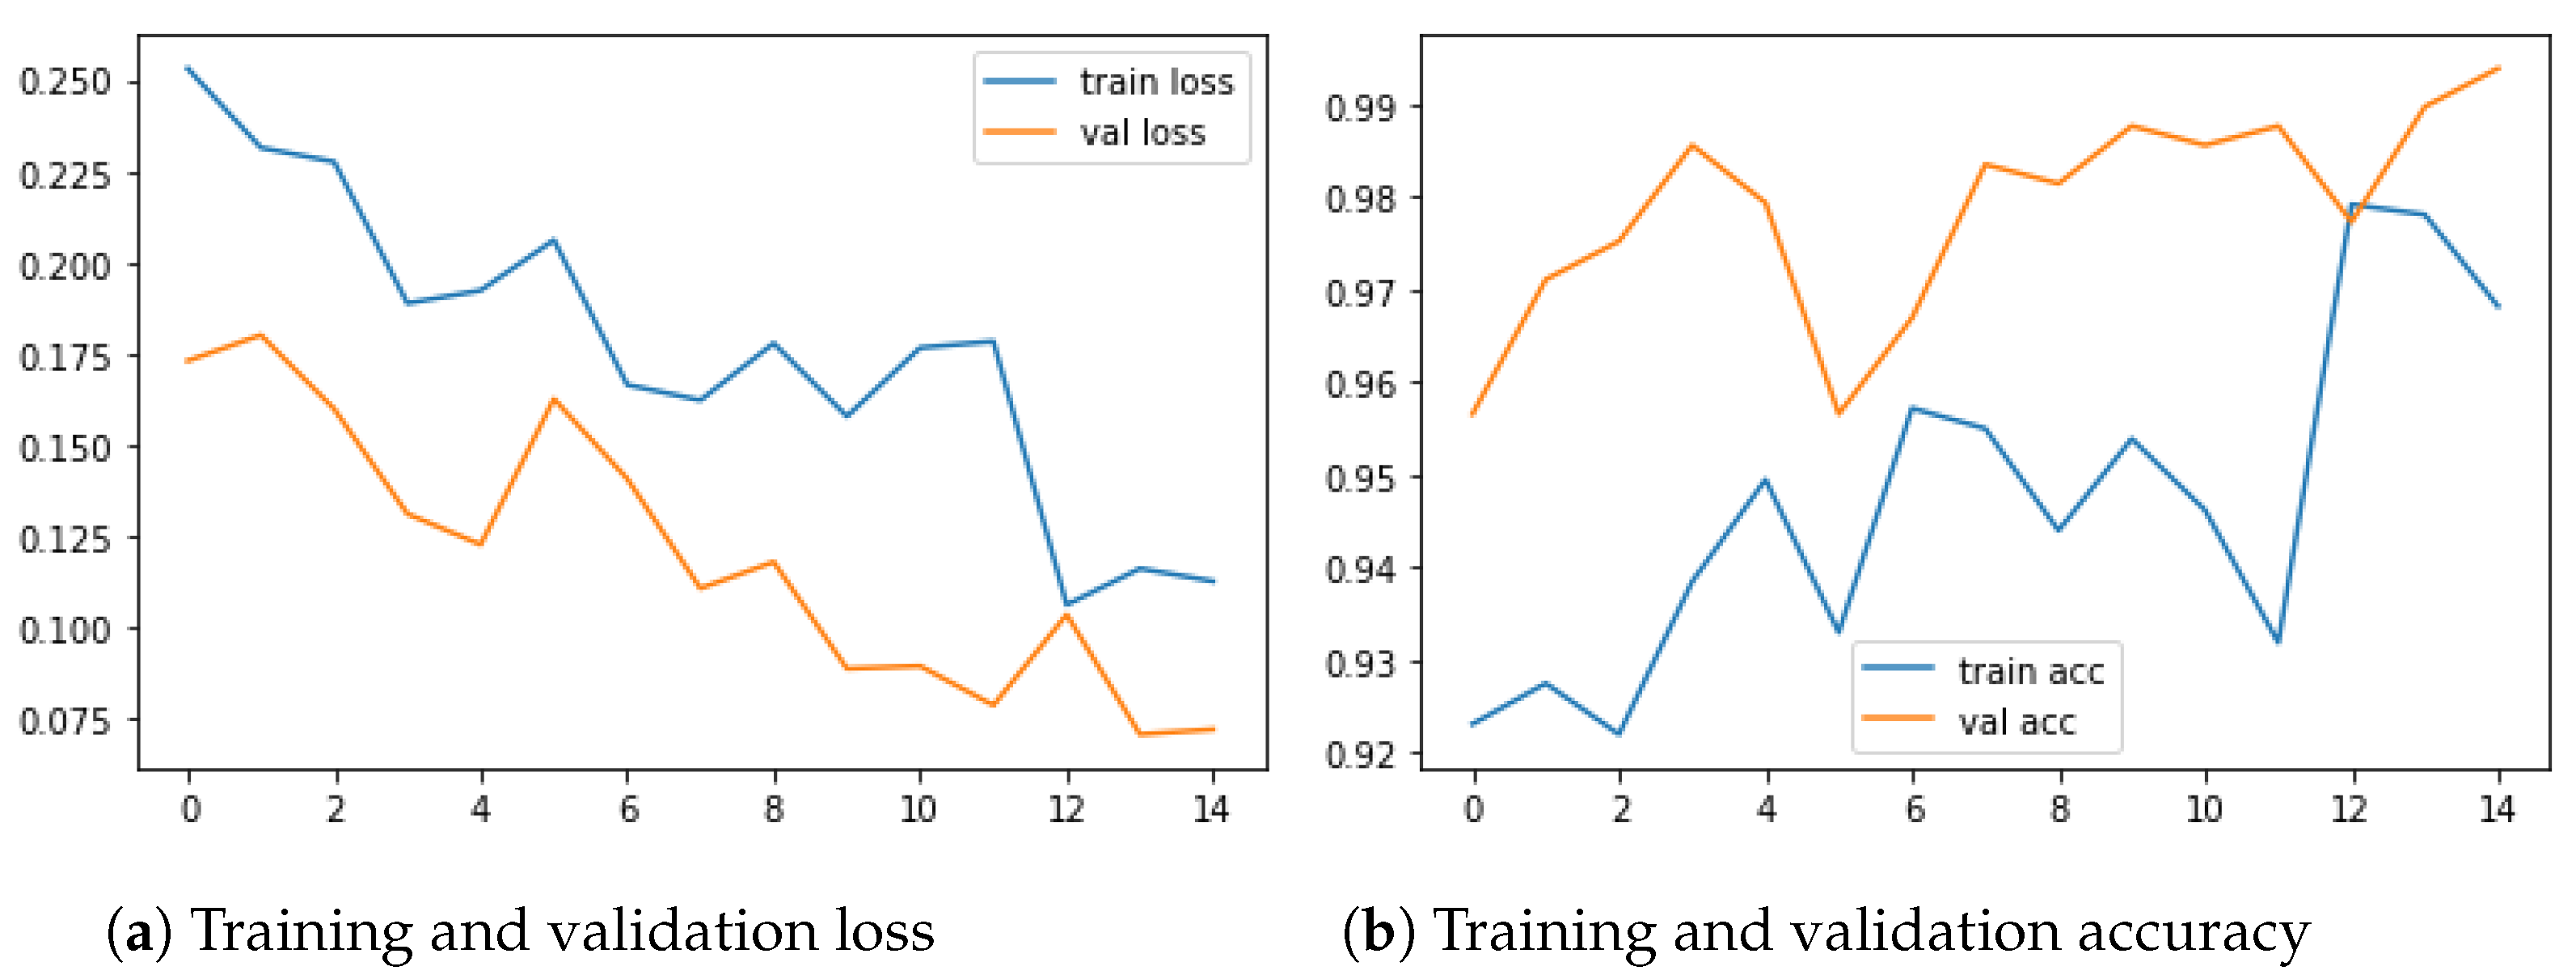
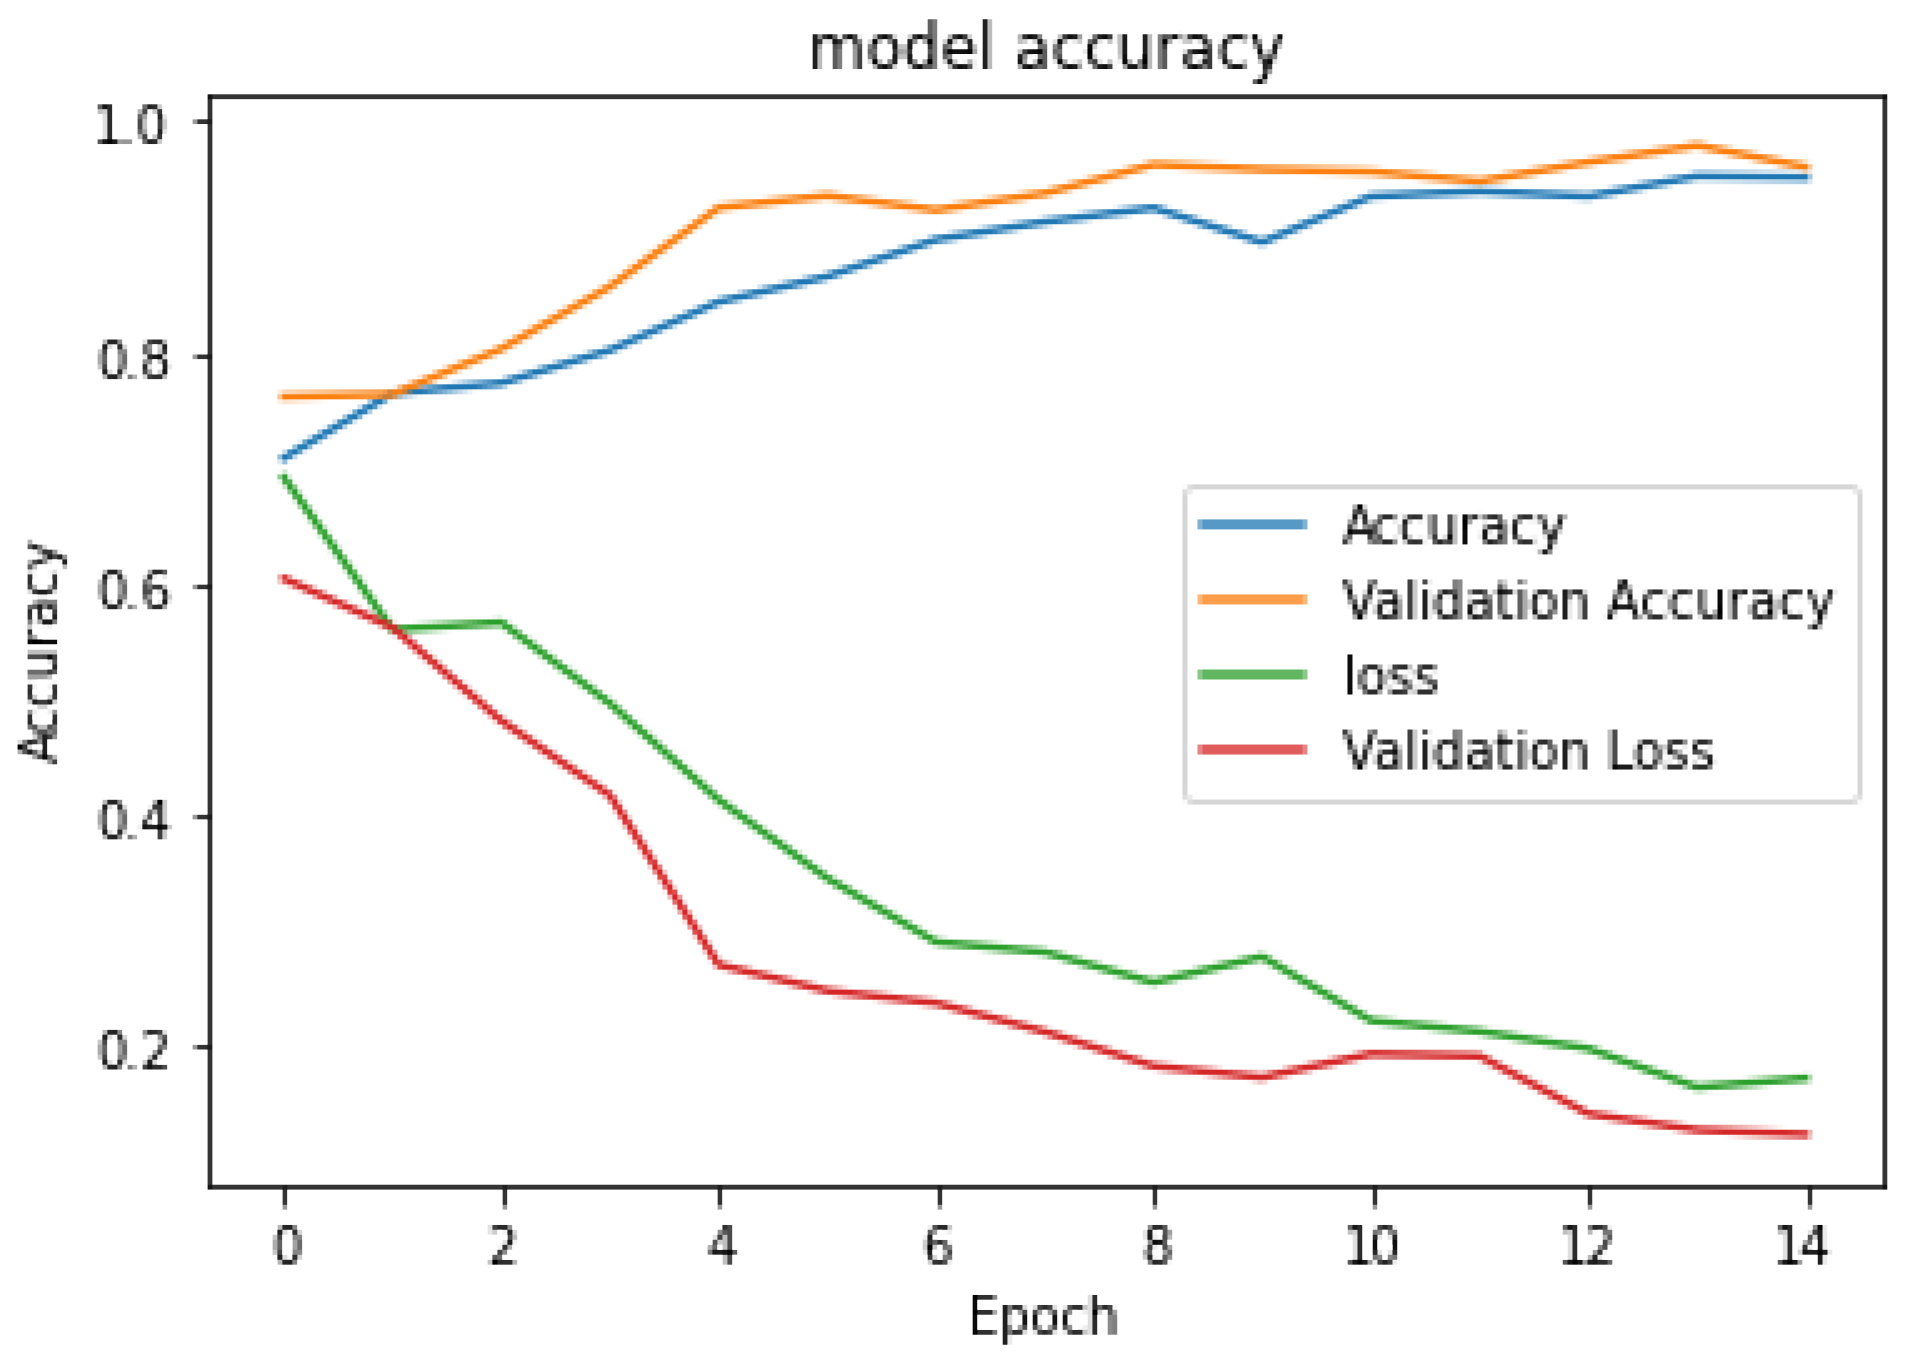
4. Experiment Results and Discussion

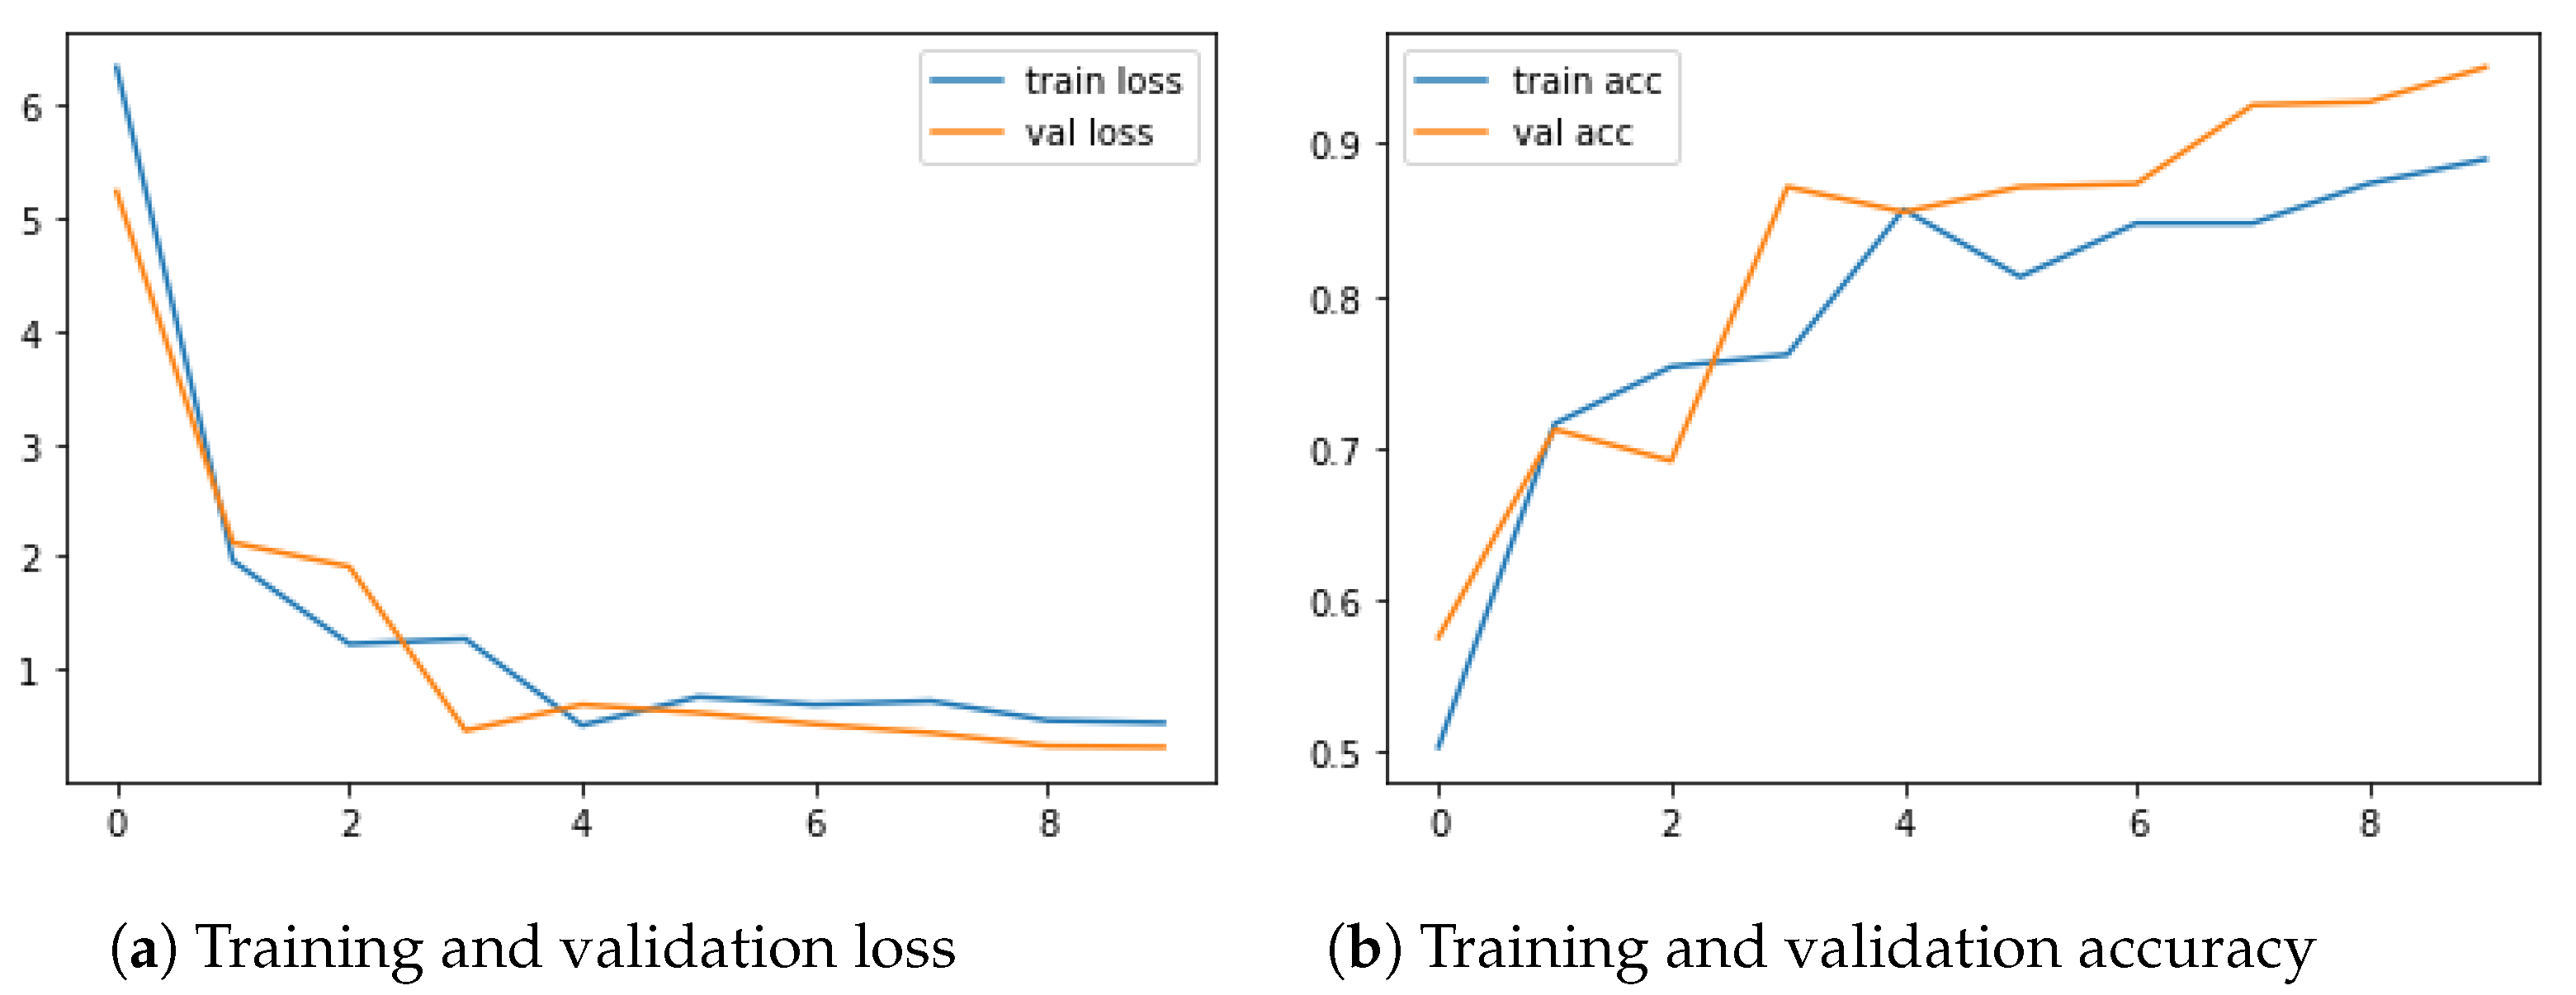
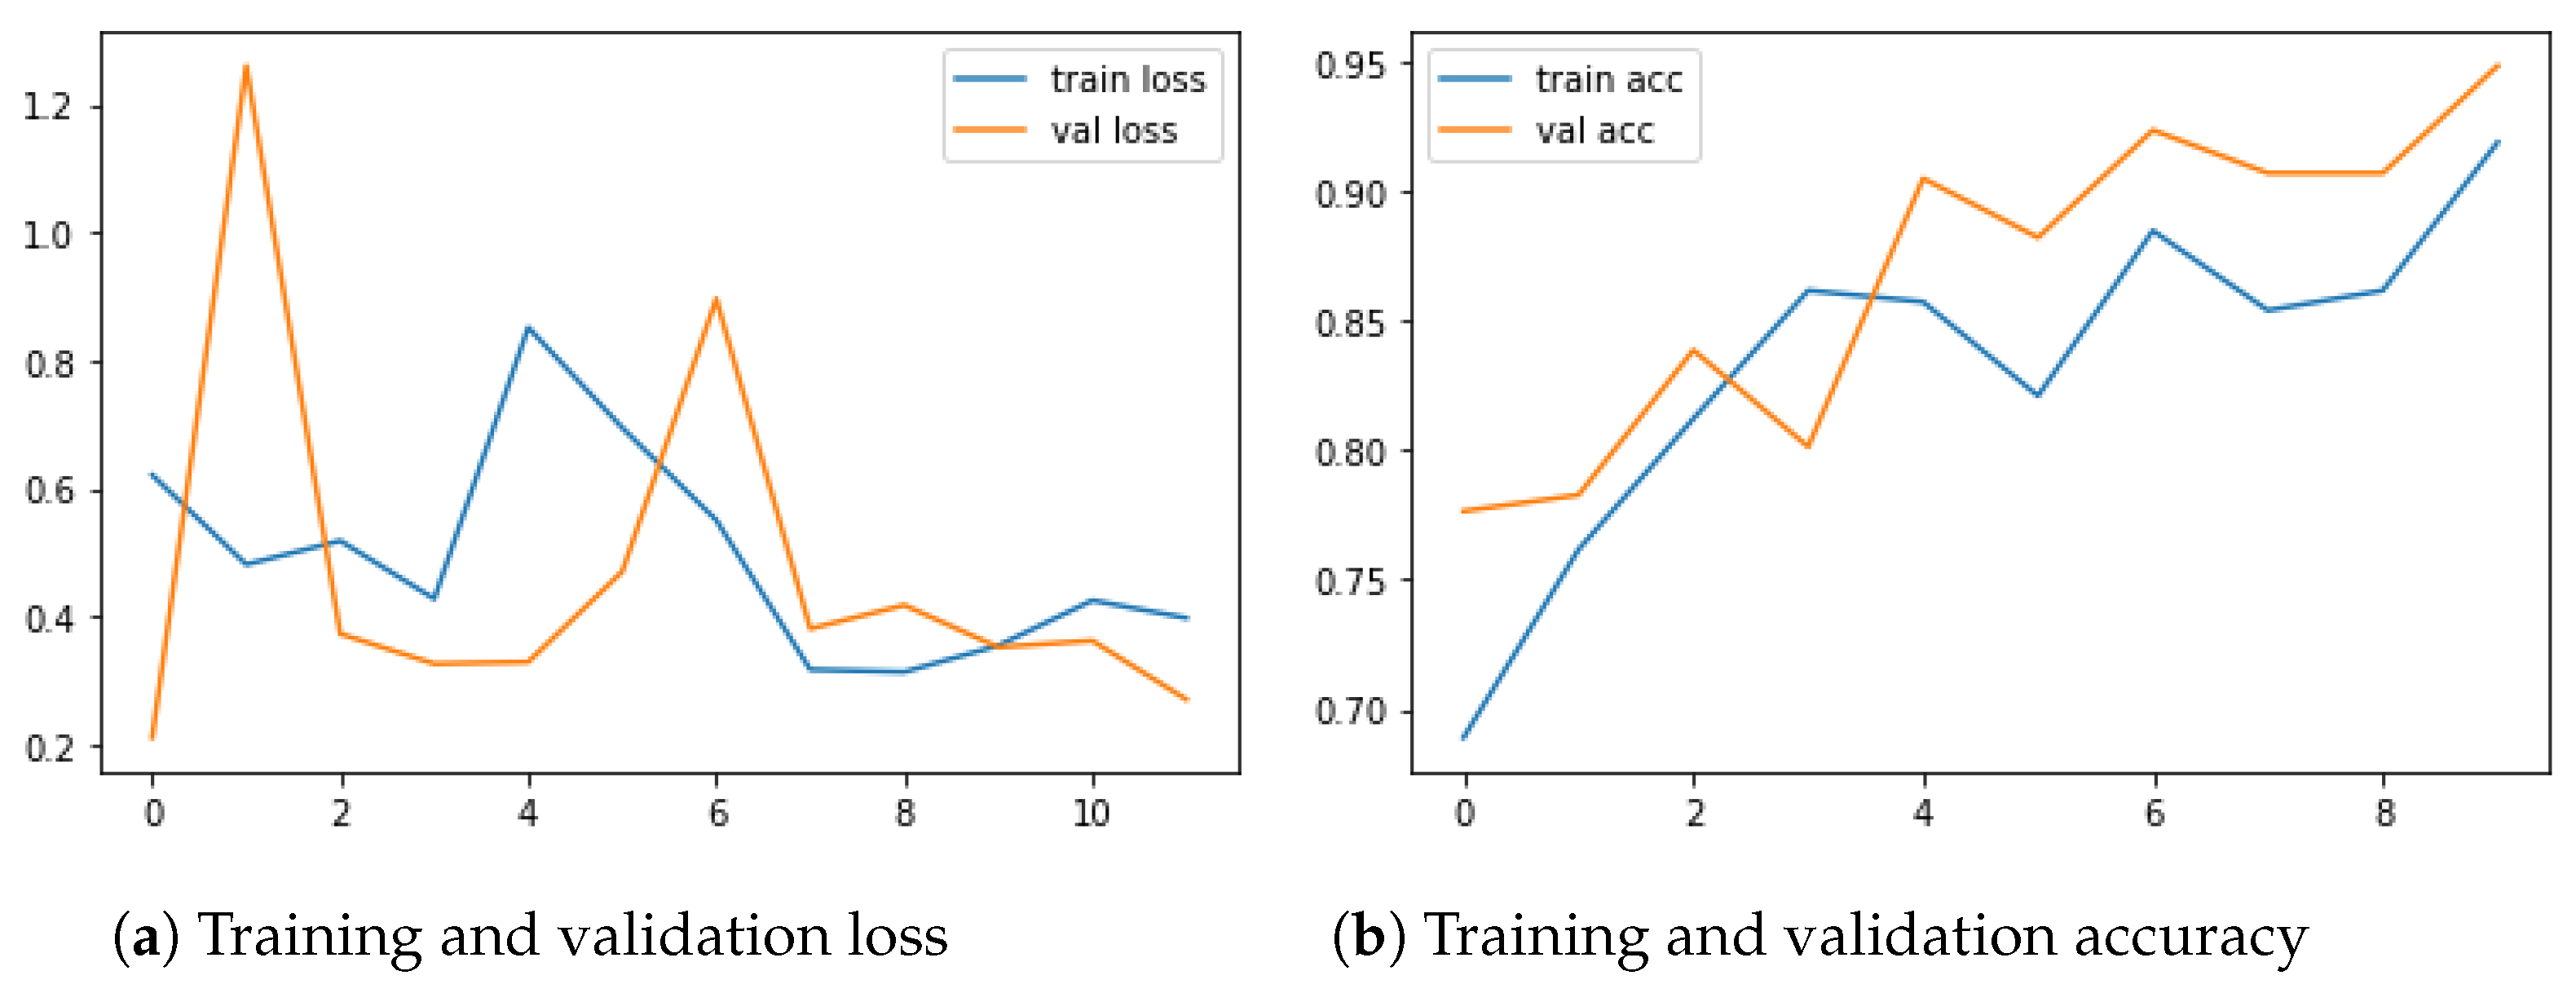
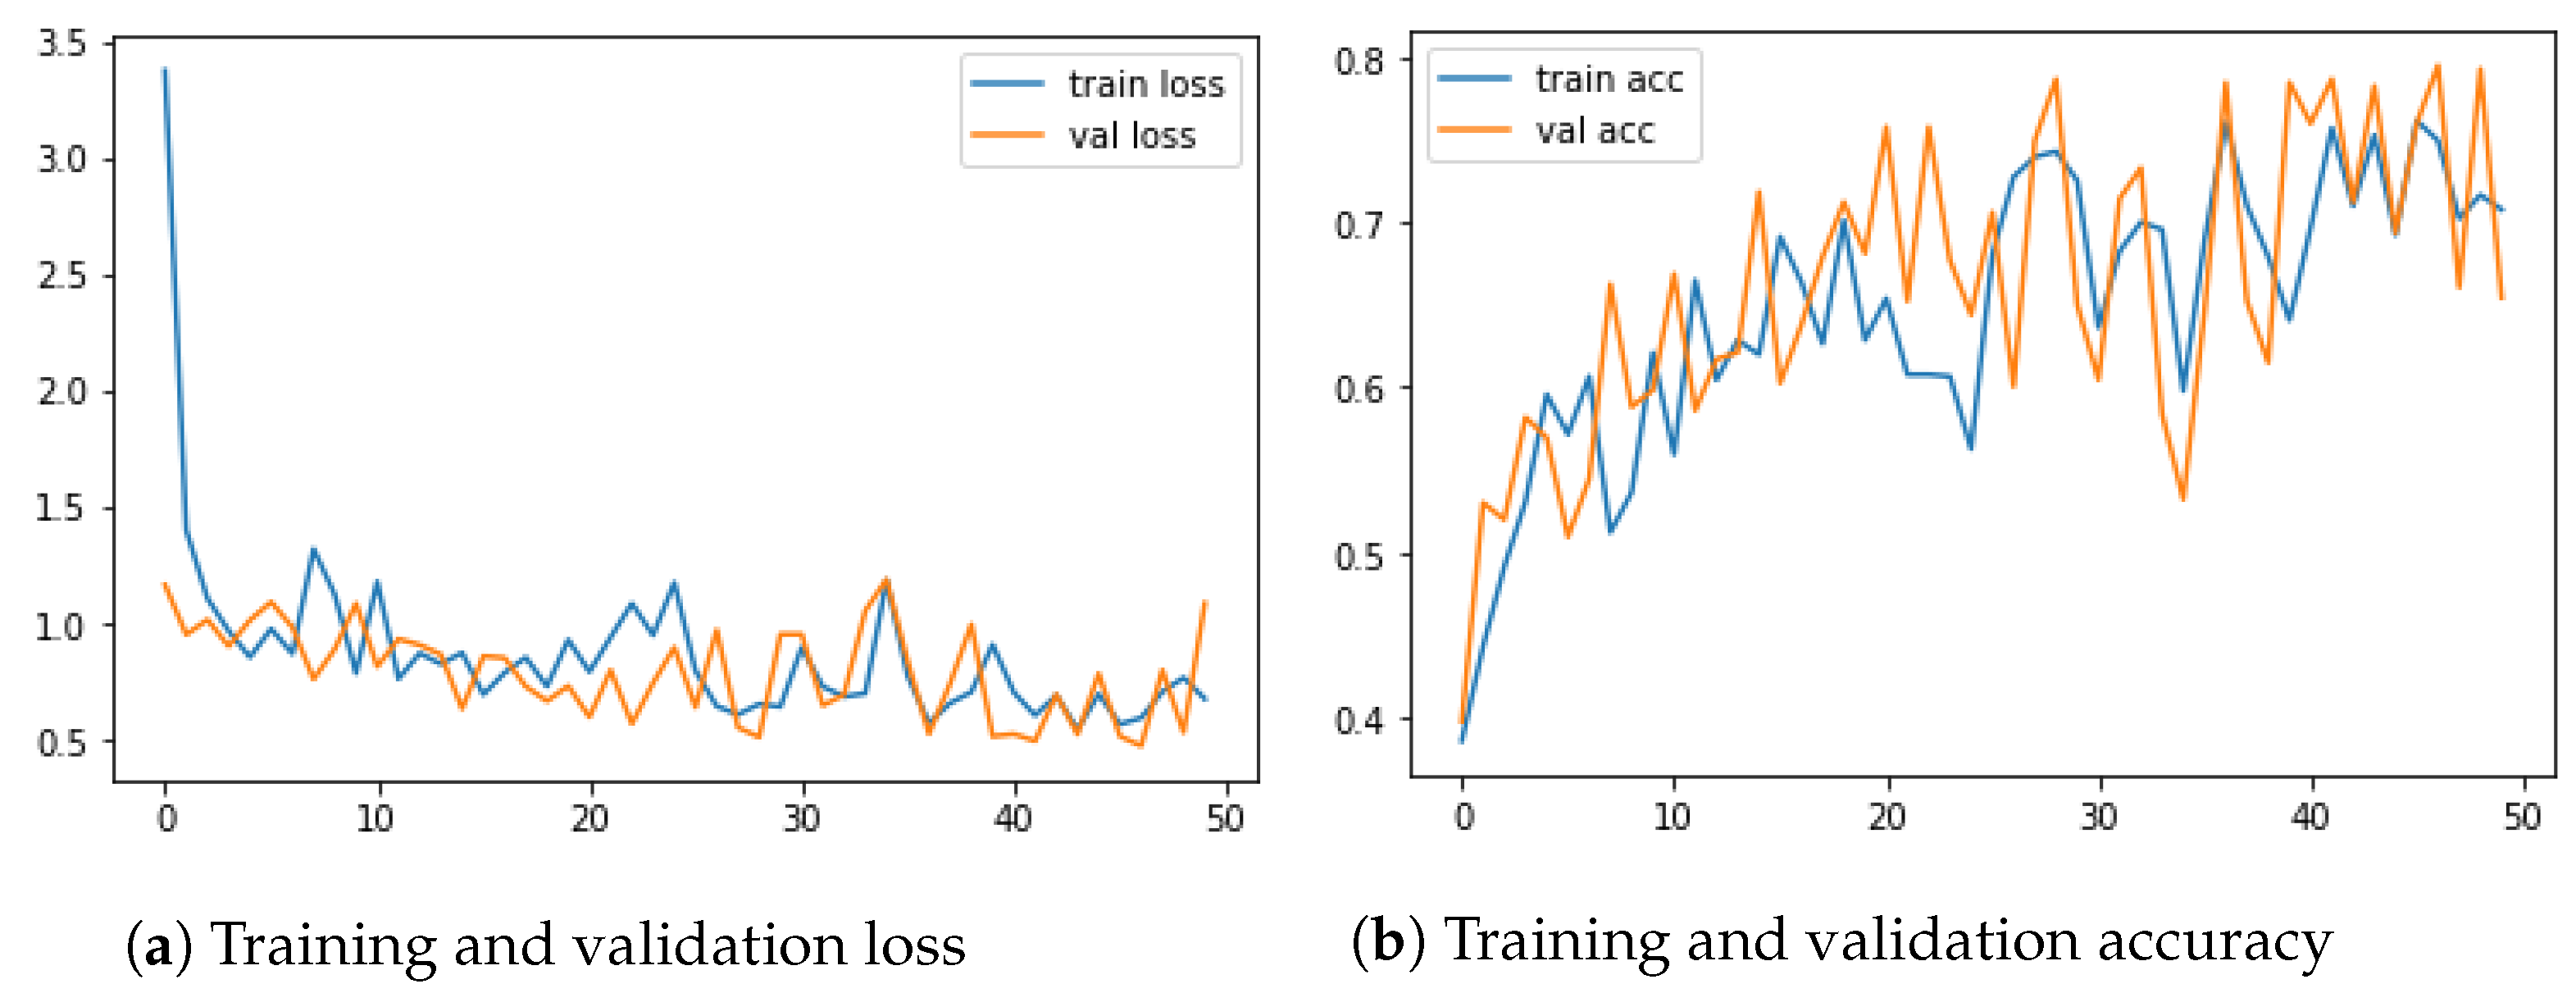
4.1. Experiment on CPU and Experiment on GPU

The first experiment was implemented using the Inception v3 model on a CPU processor. The model implemented utilized 153,603 learnable parameters to build the image classifier. Figure 2 presents the training and validation accuracy of the Inception model’s performance.
As can be seen from Figure 2, the experiment shows promising results for classifying wheat diseases into their respective classes. By tuning the parameters, the model performance can be further enhanced. Similarly, the Inception v3 model was implemented on the Nvidia Tesla GPU. The main purpose was to assess the performance of a GPU accelerator over the CPU processor on the same dataset.
The experimental results in Figure 3 reveal that the Inception v3 model performed well when classifying the training and test image data. The performance of the model can be further improved by adjusting the parameters. In addition, adding more wheat disease datasets further enhanced its performance.

4.2. Resnet50

In the current study, the Resnet50 model produced a poor performance in classifying wheat diseases into their respective classes. Generally, the ResNet model achieved excellent generalization performance on image-net localization, COCO detection, and COCO segmentation in 2015. The small-size training datasets and number of parameters utilized led the model to overfit. In addition, the Resnet50 model took a longer time to run and to fit the model. From the experiment result, Resnet50 produce the poorest classification performance on the given training and testing datasets. The training and validation accuracy of the Resnet50 are shown in Figure 4.
An optimization task was required to tune the performance of the Resnet50 architecture and to produce the results in Figure 4. In this case, the softmax activation function was used and it produced a satisfactory performance by the model.
We then went further and implemented the VGG16 and VGG19 deep learning architectures. The two models produced different experimental performances because the models’ frameworks differed. In this regard, the VGG19 deep learning model outperformed all other models in classifying wheat diseases. Figure 5 and Figure 6 show the classification and validation accuracy of both the VGG16 and VGG19 models, respectively.
The performance of the VGG16 model further improved by utilizing the VGG19 transfer learning architecture.
When we made changes to the types of GPU, from VGG16 to VGG19, and altered the number of epochs, the performance improved. Building the VGG19 model took only 36 minute. According to the experimental results, VGG19 is a promising classifier that can handle image data in the plant disease classification domain.The performance of VGG19 was presented on Figure 7 below. The only difference between the two models (VGG16 and VGG19) was the numbers of layers in each architecture. The first model has 16 layer, whereas the latter requires 19 layers to build the model.
The architecture of the VGG19 model is summarized as follows: A fixed size of ( 224 × 224 ) RGB image is given as the input to the VGG19 network, which means that the matrix is of the shape ( 224 , 224 , 3 ) . The only preprocessing that is performed is the subtraction of the mean RGB value from each pixel, computed over the whole training set. The kernels uses a (3 × 3) size with a stride size of 1 pixel; this method enables a user to cover the whole image. In addition, spatial padding is used to preserve the spatial resolution of the image. Max pooling filter is performed over a 2 × 2 pixel windows with stride 2. The softmax activation function is introduced non-linearity to make the model classify better and to improve computational time. Finally, the dense layer receives an input of 75,269 learnable parameters from all neurons of its previous layer. Then, the VGG19 model classifies the input pixel values into three classes, namely healthy wheat, leaf rust, and stem rust diseases.
In this study, we applied the softmax activation function to predict the probability distribution of a vectors in each pixels. The softmax function, unlike sigmoid functions that are used for binary classification, can be used for multi-class classification problems. The function, for every data point of all of the individual classes, returns the probability. It can be expressed as follows: Softmax function output
0 y i ( x ) 1 , n i = 1 , y i ( x ) = 1
ϕ ( z i ) = e z i j = 1 n e ( z j ) f o r   j = 1 n
where ϕ is the softmax, z i the input vector, e ( z i ) the standard exponential function for the input vector, n is the number of classes in the multi class classifier, and e ( j z ) is the standard exponential function for the output vector.
We employed the Adam optimization technique to optimize the VGG19 model. This optimizer was selected due to its computational efficiency, small memory requirements, noise handling efficiency, hyperparameter intuitive interpretation, and typical little tuning requirement. Adam is generally regarded as being fairly robust to the choice of hyperparameters. The following hyperparameters were used to train the VGG19 model: l r = 0.002 , b e t a 1 = 0.9 , b e t a 2 = 0.999 , e p s i l o n = 0.1 , d e c a y = 0.0 , and optimizer = Adam.

5. Discussion and Summary

In this study, we implemented different deep learning models for wheat disease classification purposes. Our main focus was to automate the existing manual plant disease identification and classification process.
Due to the geo-location, environment, and genetic structure of wheat varieties, the frequency of occurrences and types of disease severity differ from location to location. We used GPS-coordinated mobile cameras to collect wheat image data with the support of domain experts. The process of wheat disease characterization and manual labeling were performed by wheat disease experts at BARI. Due to the environmental factors, our research teams were more interested in organizing well-labeled wheat disease image data to support the agricultural research community in Ethiopia.
One of the big concerns in deep learning is the issue of computational cost in conducting experiments with large image datasets. Highly dimensional image datasets require high-performance computing infrastructures to perform classification or prediction tasks. To handle this challenge, Datta and colleagues [59,60,61,62] proposed parallel multiple CPU cores to implement CNN models. Deep neural network models have millions of parameters, and they require a large amount of data to achieve good performance. Additionally, adequate time and space are required to execute the parameters.
In the previous sections, we stated that wheat is the fourth most mass-produced cereal crop in Ethiopia. Quite a large number of farmers participate in farming and harvesting wheat crops to address even the local demand. However, this crop is heavily affected by different varieties of crop diseases. As a result, from 20 to 40% of wheat yield in the country is lost during each harvest. This is one of the factors threatening the food security agenda of the Ethiopian government.
In this study, our main focus was to support the agricultural sector by automating the existing wheat disease identification process. The data processing time and interpretation dependency on domain experts were the main limitations in the domain area. Thus, we implemented various deep learning approaches to assess the best fitting framework(s) for the proposed study. The majority of the utilized models were promising in terms of classifying wheat diseases into their correct respective target classes. Figure 8 below presents a sample experimental result of the classified wheat image data into its respective target classes.

Model Performance Comparison

From our various experiments of plant disease classification, a VGG19 model was found to have the best fit with minimal computation cost. On the other hand, the poorest model performance was produced by the Resnet50. The Resnet50 architecture a took longer time to build the model, and this model achieved the poorest image classification performance compare to other models. One of the possible solution for handling model overfitting was the collection of more training and testing image image datasets. In the next subsection, the performance of the VGG19 model was compared with the other state-of-the-art deep learning models.
We utilized both GPUs and CPUs to assess the computation cost of each deep learning model. In the case of the GPU, we used the NVIDIA Tesla T4 and NVIDIA Tesla K80 accelerators, whereas a Core i7 one TB hard disk was used for the CPU. Table 1 summarizes the details of the infrastructure used to implement the deep learning models.
From Table 1 above, we utilized the CPU processor only for the Inceptionv3 model. From the experiment result, a huge execution time difference between the CPU and Tesla GPU was found when running the Inception model. During the experiment, the CPU stacked and failed to compile other models. There are a number of ResNet architectures. For the current study, we implemented the Resnet50 model to train our wheat diseases image data. As seen in Table 1, this model is the most computationally expensive and achieved the lowest classification performance.
From the experimental results, Inceptionv3, Resnet50, VGG16, and VGG19 produced 95.65%, 81.57%, 96.48%, and 99.38% classification accuracies, respectively. Based on the model’s classification performance, we selected VGG19 for further discussion and comparison against state-of-the-art deep learning models.
In addition, Figure 8 presents a summary of the VGG19 model classification performance. The figure shows the model’s accuracy with the number of iterations used to build the classifier. Similarly, the model accuracy and validation loss function continuously decreased as the number of epochs increased.The performance of VGG19 model have been displayed on the Figure 9 below.
From the analysis, the efficiency of the proposed wheat disease classification model produced a high accuracy rate, 99.38%, shown in Table 1. We made a comparative analysis between our VGG19 model and other state-of-the-art deep learning models in similar domains. From the analysis, the proposed model obtained the highest classification accuracy on the training data. Similary, the model achieved the second highest accuracy on the validation data.
From Table 2 above, the research communities invest their time and efforts into handling the sever effect of crop diseases. We compared the highest classifier against the state-of-the-art deep learning models. Our proposed model is robust in correctly classifying wheat diseases into their respective classes. From the performance obtained by different authors, we can further tune the classification accuracy of the model by implementing different optimization techniques. Based on result of the experiment conducted in the study, the following limitations, with respect to the performance of the deep learning models we employed, arose:
  • The quality of the image datasets affected the performance of the models. Performing different preprocessing and postprocessing tasks enhances the features extracted from image data.
  • Data format, rotations, image size variations, dark objects on the ground, and the application of different cameras also affected the model’s performance. Data standardization and utilization of high-quality cameras improve the bottleneck.
  • As the number of epochs and the performance of the deep learning models also vary, so does the proper running of as many models as possible until the optimal performance is obtained.
  • There are a number of activation functions. Thus, assessing and evaluating the different activation functions helps to select the best fit function.
This study was conducted in collaboration with the Bishoftu Agricultural Research Institute. The institute as a center of excellence for wheat crop works hard to automate crop health status management. The recommendation from domain experts in the country is that implementing machine-learning-based systems improves the efficiency of the crop-disease identification, reduces biased decisions due to a manual system, and greatly reduces the time to process data.
In general, image-based data processing provides detailed features to discriminate one object from the other better than other data types. Implementing deep learning frameworks is promising for extracting relevant features from image data. Currently, agriculture is a hot research area that demands the application of state-of-the art technology for automating the sector. In future studies, we plan to further explore this domain. Due attention will given to creating our own local data repository for a broader research community.

Author Contributions

Conceptualization, T.A. and A.R.; methodology, T.A.; software, T.A.; validation, A.R., T.A., A.G., and R.S.; formal analysis, T.A. and A.R.; investigation, T.A.; resources, T.A., A.G.; data curation, T.A., A.G.; writing—original draft preparation, T.A., A.R.; writing—review and editing, T.A., A.R., and R.S.; visualization, T.A.; supervision, A.R. and R.S.; project administration, R.S. All authors have read and agreed to the published version of the manuscript.

Funding

There is no funding organization or institutional support for this work.

Data Availability Statement

The training and testing image data are shared on a Google Drive. The experimental output and sample code are available in a Github repository at https://github.com/tagel123 (accessed on 10 June 2021). The datasets are uploaded on Google Drive, and the link can be shared whenever required.

Acknowledgments

First, we thank Abebe Rorrisa for his enormous support and advice. Then, we thank Ramasamy for his contribution to my pursuit of PhD work. We acknowledge Tadele Workinek for his support in correcting errors in spelling, grammar, and punctuation. Finally, we thank all of the stakeholders who participated during this study. We appreciate the opportunities given by the MDPI journal editorial boards.

Conflicts of Interest

The authors declare that, there is no conflict of interest to public the manuscript. We acknowledge the data sources and cite all the references which used to prepare the manuscript. We would also like to acknowledge MDPI Editorial board support their financial support by waiving publication charge. Finally, A complete or partial parts of this study report haven’t submitted or published on any platform. “The funders had no role in the design of the study; in the collection, analyses, or interpretation of data; in the writing of the manuscript; or in the decision to publish the results.

Abbreviations

The following abbreviations are used in this manuscript:
BARIBishoftu Agricultural Research Institute
RGBRed Green Blue
TBTerra Byte
CNNConvolutional Neural Network
NWPNumerical Weather Prediction
SDMSpore Dispersion Model
PSDPhone Survey Data
ODKOpen Data Kit Survey Field Data
EWSEarly Warning System

References

  1. Basso, B.; Cammarano, D.; Carfagna, E. Review of Crop Yield Forecasting Methods and Early Warning Systems; FAO Headquarters: Rome, Italy, 2013; Volume 41. [Google Scholar]
  2. Eshetu, A.A. Forest resource management systems in Ethiopia. Int. J. Biodivers. Conserv. 2014, 6, 121–131. [Google Scholar]
  3. Madhulatha, G.; Ramadevi, O. Recognition of Plant Diseases using Convolutional Neural Network. In Proceedings of the 2020 Fourth International Conference on I-SMAC (IoT in Social, Mobile, Analytics and Cloud) (I-SMAC), Palladam, India, 7–9 October 2020; Volume 6, pp. 738–743. [Google Scholar]
  4. Anteneh, A.; Asrat, D. Wheat production and marketing in Ethiopia: Review study. Cogent Food Agric. 2020, 6, 1778893. [Google Scholar] [CrossRef]
  5. Nikhitha, M.; Sri, S.R.; Maheswari, B.U. Fruit Recognition and Grade of Disease Detection using Inception V3 Model. In Proceedings of the 2019 3rd International conference on Electronics, Communication and Aerospace Technology (ICECA), Coimbatore, India, 12–14 June 2020; pp. 1040–1043. [Google Scholar]
  6. Pandian, J.A.; Geetharamani, G.; Annette, B. Data augmentation on plant leaf disease image dataset using image manipulation and deep learning techniques. In Proceedings of the 2019 IEEE 9th International Conference on Advanced Computing (IACC), Tiruchirappalli, India, 13–14 December 2020; pp. 199–204. [Google Scholar]
  7. Mottaleb, K.A.; Rahut, D.B. Household production and consumption patterns of Teff in Ethiopia. Agribusiness 2018, 34, 668–684. [Google Scholar] [CrossRef]
  8. Wubishet, A.; Tamene, M. Verification and evaluation of fungicides efficacy against wheat trust diseases on bread wheat (Triticum aestivum L.) in the Highlands of Bale, Southeastern Ethiopia. Int. J. Res. Stud. Agric. Sci. 2016, 2, 35–40. [Google Scholar]
  9. Tadesse, W.; Bishaw, Z.; Assefa, S. Wheat production and breeding in Sub-Saharan Africa. Int. J. Clim. Chang. Strateg. Manag. 2019, 11. [Google Scholar] [CrossRef] [Green Version]
  10. Ayele, A.; Dessalegn, Y.; Tesfaye, S. Status of Wheat Rust Diseases in Hadiya Zone, Ethiopia. J. Biol. Agric. Healthc. 2019, 10. [Google Scholar]
  11. Bachewe, F.; Berhane, G.; Minten, B.; Taffesse, A. Agricultural transformation in Africa? Assessing the evidence in Ethiopia. World Dev. 2018, 105, 286–298. [Google Scholar] [CrossRef]
  12. Rashid, S.; Getnet, K.; Lemma, S. Maize value chain potential in Ethiopia: Constraints and opportunities for enhancing the system. Gates Open Res. 2019, 3, 1–64. [Google Scholar]
  13. Sara, L.; Jakob, S.; Saumya, S. The State of Food and Agriculture 2014; FAO: Rome, Italy, 2014. [Google Scholar]
  14. Kedir, U. The Effect of Climate Change on Yield and Quality of Wheat in Ethiopia: A Review. J. Environ. Earth Sci. 2017, 7, 46–52. [Google Scholar]
  15. Negassa, A.; Shiferaw, B.; Koo, J.; Sonder, K.; Smale, M.; Braun, H.J.; Gbegbelegbe, S.; Guo, Z.; Hodson, D.P.; Wood, S.; et al. The Potential for Wheat Production in Africa: Analysis of Biophysical Suitability and Economic Profitability; CIMMYT: EI Batan, Mexico, 2013. [Google Scholar]
  16. Allen-Sader, C.; Thurston, W.; Meyer, M.; Nure, E.; Bacha, N.; Alemayehu, Y.; Stutt, R.O.; Safka, D.; Craig, A.P.; Derso, E.; et al. An early warning system to predict and mitigate wheat rust diseases in Ethiopia. Environ. Res. Lett. 2019, 14, 33–37. [Google Scholar] [CrossRef]
  17. Adedoja, A.; Owolawi, P.A.; Mapayi, T. Deep learning based on nasnet for plant disease recognition using leave images. In Proceedings of the 2019 International Conference on Advances in Big Data, Computing and Data Communication Systems (icABCD), Winterton, South Africa, 5–6 August 2019; pp. 1–5. [Google Scholar]
  18. Bekana, N.B. Efficacy evaluation of different foliar fungicides for the management of wheat strip rust. J. Appl. Sci. Environ. Manag. 2019, 11, 1977–1983. [Google Scholar]
  19. Jiang, P.; Chen, Y.; Liu, B.; He, D.; Liang, C. Real-time detection of apple leaf diseases using deep learning approach based on improved convolutional neural networks. IEEE Access 2019, 7, 59069–59080. [Google Scholar] [CrossRef]
  20. Kawatra, M.; Agarwal, S.; Kapur, R. Leaf Disease Detection using Neural Network Hybrid Models. In Proceedings of the 2020 IEEE 5th International Conference on Computing Communication and Automation (ICCCA), Greater Noida, India, 30–31 October 2020; pp. 225–230. [Google Scholar]
  21. Mukti, I.Z.; Biswas, D. Transfer learning based plant diseases detection using ResNet50. In Proceedings of the 2019 4th International Conference on Electrical Information and Communication Technology (EICT), Khulna, Bangladesh, 20–22 December 2019; pp. 1–6. [Google Scholar]
  22. Pham, T.N.; Van Tran, L.; Dao, S.V. Early Disease Classification of Mango Leaves Using Feed-Forward Neural Network and Hybrid Metaheuristic Feature Selection. IEEE Access 2020, 8, 189960–189973. [Google Scholar] [CrossRef]
  23. Pirttioja, N.; Carter, T.R.; Fronzek, S.; Bindi, M.; Hoffmann, H.; Palosuo, T.; Ruiz-Ramos, M.; Tao, F.; Trnka, M.; Acutis, M. Temperature and precipitation effects on wheat yield across a European transect. Clim. Res. 2015, 8, 87–105. [Google Scholar] [CrossRef] [Green Version]
  24. Alrayyes, W.H. Nutritional and Health Benefits Enhancement of Wheat-Based Food Products Using Chickpea and Distiller’s Dried Grains; South Dakota State University: Brookings, SD, USA, 2018. [Google Scholar]
  25. Arya, S.; Singh, R. A Comparative Study of CNN and AlexNet for Detection of Disease in Potato and Mango leaf. In Proceedings of the 2019 International Conference on Issues and Challenges in Intelligent Computing Techniques (ICICT), Ghaziabad, India, 27–28 September 2019; pp. 1–6. [Google Scholar]
  26. Sall, T.A.; Chiari, T.; Legesse, W.; Seid-Ahmed, K.; Ortiz, R.; Van Ginkel, M.; Bassi, F.M. Durum wheat (Triticum durum Desf.): Origin, cultivation and potential expansion in Sub-Saharan Africa. Agronomy 2019, 9, 263. [Google Scholar] [CrossRef] [Green Version]
  27. Ennadifi, E.; Laraba, S.; Vincke, D.; Mercatoris, B.; Gosselin, B. Wheat Diseases Classification and Localization Using Convolutional Neural Networks and GradCAM Visualization. In Proceedings of the 2020 International Conference on Intelligent Systems and Computer Vision (ISCV), Fez, Morocco, 9–11 June 2020; pp. 1–5. [Google Scholar]
  28. Genaev, M.; Ekaterina, S.; Afonnikov, D. Application of neural networks to image recognition of wheat rust diseases. In Proceedings of the 2020 Cognitive Sciences, Genomics and Bioinformatics (CSGB), Novosibirsk, Russia, 6–10 July 2020; pp. 40–42. [Google Scholar]
  29. Durmuş, H.; Güneş, E.O.; Kırcı, M. Disease detection on the leaves of the tomato plants by using deep learning. In Proceedings of the 2017 6th International Conference on Agro-Geoinformatics, Fairfax, VA, USA, 7–10 August 2017; pp. 1–5. [Google Scholar]
  30. Ashok, S.; Kishore, G.; Rajesh, V.; Suchitra, S.; Sophia, S.G.; Pavithra, B. Tomato Leaf Disease Detection Using Deep Learning Techniques. Agronomy 2020, 979–983. [Google Scholar]
  31. Hasan, M.Z.; Ahamed, M.S.; Rakshit, A.; Hasan, K.Z. Recognition of Jute Diseases by Leaf Image Classification using Convolutional Neural Network. In Proceedings of the 2019 10th International Conference on Computing, Communication and Networking Technologies (ICCCNT), Kanpur, India, 6–8 July 2019; pp. 1–5. [Google Scholar]
  32. Sumalatha, G.; Rao, S.K.; Singothu, J.R. Transfer Learning-Based Plant Disease Detection; IJIEMR: Lucknow, India, 2021; Volume 10. [Google Scholar]
  33. Elhassouny, A.; Smarandache, F. Smart mobile application to recognize tomato leaf diseases using Convolutional Neural Networks. In Proceedings of the 2019 International Conference of Computer Science and Renewable Energies (ICCSRE), Agadir, Morocco, 22–24 July 2019; pp. 1–4. [Google Scholar]
  34. Dong, Y.; Du, B.; Zhang, L.; Zhang, L. Dimensionality reduction and classification of hyperspectral images using ensemble discriminative local metric learning. IEEE Trans. Geosci. Remote Sens. 2017, 55, 2509–2524. [Google Scholar] [CrossRef]
  35. Chen, F.; Zhu, F.; Wu, Q.; Hao, Y.; Cui, Y.; Wang, E. InfraRed Images Augmentation Based on Images Generation with Generative Adversarial Networks. In Proceedings of the 2019 IEEE International Conference on Unmanned Systems (ICUS), Beijing, China, 17–19 October 2019; pp. 62–66. [Google Scholar]
  36. Geng, Y.; Mei, S.; Tian, J.; Zhang, Y.; Du, Q. Spatial Constrained Hyperspectral Reconstruction from RGB Inputs Using Dictionary Representation. In Proceedings of the IGARSS 2019—2019 IEEE International Geoscience and Remote Sensing Symposium, Yokohama, Japan, 28 July–2 August 2019; pp. 3169–3172. [Google Scholar]
  37. Peng, H.; Chen, X.; Zhao, J. Residual pixel attention network for spectral reconstruction from rgb images. In Proceedings of the IEEE/CVF Conference on Computer Vision and Pattern Recognition Workshops, Seattle, WA, USA, 14–19 June 2020; pp. 1–9. [Google Scholar]
  38. Shi, Z.; Chen, C.; Xiong, Z.; Liu, D.; Wu, F. Hscnn+: Advanced cnn-based hyperspectral recovery from rgb images. In Proceedings of the IEEE Conference on Computer Vision and Pattern Recognition Workshops, Salt Lake City, UT, USA, 18–22 June 2018; pp. 939–947. [Google Scholar]
  39. Biswas, R.; Basu, A.; Nandy, A.; Deb, A.; Chowdhury, R.; Chanda, D. Identification of Pathological Disease in Plants using Deep Neural Networks. In Proceedings of the 2020 Indo—Taiwan 2nd International Conference on Computing, Analytics and Networks (Indo-Taiwan ICAN), Rajpura, India, 7–15 February 2020; pp. 45–48. [Google Scholar]
  40. Meng, F.; Liu, H.; Liang, Y.; Tu, J.; Liu, M. Sample fusion network: An end-to-end data augmentation network for skeleton-based human action recognition. IEEE Trans. Image Process. 2019, 28, 5281–5295. [Google Scholar] [CrossRef]
  41. Stivaktakis, R.; Tsagkatakis, G.; Tsakalides, P. Deep learning for multilabel land cover scene categorization using data augmentation. IEEE Geosci. Remote Sens. Lett. 2019, 16, 1031–1035. [Google Scholar] [CrossRef]
  42. Cui, Z.; Zhang, M.; Cao, Z.; Cao, C. Image data augmentation for SAR sensor via generative adversarial nets. IEEE Access 2019, 7, 42255–42268. [Google Scholar] [CrossRef]
  43. Feng, J.; Chen, J.; Liu, L.; Cao, X.; Zhang, X.; Jiao, L.; Yu, T. CNN-based multilayer spatial–spectral feature fusion and sample augmentation with local and nonlocal constraints for hyperspectral image classification. IEEE Access 2019, 12, 1299–1313. [Google Scholar] [CrossRef]
  44. Frid-Adar, M.; Klang, E.; Amitai, M.; Goldberger, J.; Greenspan, H. Synthetic data augmentation using GAN for improved liver lesion classification. In Proceedings of the 2018 IEEE 15th International Symposium on Biomedical Imaging (ISBI 2018), Washington, DC, USA, 4–7 April 2018; pp. 289–293. [Google Scholar]
  45. Fujita, K.; Kobayashi, M.; Nagao, T. Data augmentation using evolutionary image processing. In Proceedings of the 2018 Digital Image Computing: Techniques and Applications (DICTA), Canberra, ACT, Australia, 10–13 December 2018; pp. 1–6. [Google Scholar]
  46. Nalepa, J.; Myller, M.; Kawulok, M. Training-and test-time data augmentation for hyperspectral image segmentation. IEEE Geosci. Remote Sens. Lett. 2019, 17, 292–296. [Google Scholar] [CrossRef]
  47. Chakravarthy, A.S.; Raman, S. Early Blight Identification in Tomato Leaves using Deep Learning. In Proceedings of the 2020 International Conference on Contemporary Computing and Applications (IC3A), Lucknow, India, 5–7 February 2020; pp. 154–158. [Google Scholar]
  48. Belayneh, A.; Adamowski, J.; Khalil, B.; Quilty, J. Coupling machine learning methods with wavelet transforms and the bootstrap and boosting ensemble approaches for drought prediction. Atmos. Res. 2019, 172, 37–47. [Google Scholar] [CrossRef]
  49. Mengistu, A.D.; Alemayehu, D.M.; Mengistu, S.G. Ethiopian coffee plant diseases recognition based on imaging and machine learning techniques. Int. J. Database Theory Appl. 2016, 9, 79–88. [Google Scholar] [CrossRef]
  50. Zewdie, W.; Csaplovics, E. Identifying categorical land use transition and land degradation in northwestern drylands of Ethiopia. Remote Sens. 2016, 8, 408. [Google Scholar] [CrossRef] [Green Version]
  51. Kindu, M.; Schneider, T.; Teketay, D.; Knoke, T. Land use/land cover change analysis using object-based classification approach in Munessa-Shashemene landscape of the Ethiopian highlands. Remote Sens. 2013, 5, 2411–2435. [Google Scholar] [CrossRef] [Green Version]
  52. Alehegn, E. Maize Leaf Diseases Recognition and Classifiaction Based on Imaging and Machine Learning Techniques. Ph.D. Thesis, Bahir Dar University, Bahir Dar, Ethiopia, 2020. [Google Scholar]
  53. Wallelign, S.; Polceanu, M.; Buche, C. Soybean plant disease identification using convolutional neural network. In Proceedings of the Thirty-First International Flairs Conference, Melbourne, FL, USA, 21–23 May 2018. [Google Scholar]
  54. Jasim, M.A.; AL-Tuwaijari, J.M. Plant Leaf Diseases Detection and Classification Using Image Processing and Deep Learning Techniques. In Proceedings of the 2020 International Conference on Computer Science and Software Engineering (CSASE), Duhok, Iraq, 6–18 April 2020; pp. 259–265. [Google Scholar]
  55. Datta, D.; Mittal, D.; Mathew, N.P.; Sairabanu, J. Comparison of Performance of Parallel Computation of CPU Cores on CNN model. In Proceedings of the 2020 International Conference on Emerging Trends in Information Technology and Engineering (ic-ETITE), Vellore, India, 24–25 February 2020; pp. 1–8. [Google Scholar]
  56. Sheikh, M.H.; Mim, T.T.; Reza, M.S.; Rabby, A.S.; Hossain, S.A. Detection of maize and peach leaf diseases using image processing. In Proceedings of the 2019 10th International Conference on Computing, Communication and Networking Technologies (ICCCNT), Kanpur, India, 6–8 July 2019; pp. 1–7. [Google Scholar]
  57. Han, Z.; Li, L.; Jin, W.; Wang, X.; Jiao, G.; Wang, H. Convolutional Neural Network Training for RGBN Camera Color Restoration Using Generated Image Pairs. IEEE Photonics J. 2020, 12, 1–15. [Google Scholar] [CrossRef]
  58. Padmanabhan, R.; Damodaran, S.; Batra, V.N.; Gurugopinath, S. A Convolutional Neural Network Architecture for Camera Model Identification with Small Datasets. In Proceedings of the 2020 IEEE International Conference on Electronics, Computing and Communication Technologies (CONECCT), Bangalore, India, 2–4 July 2020; pp. 1–6. [Google Scholar]
  59. Tiwari, D.; Ashish, M.; Gangwar, N.; Sharma, A.; Patel, S.; Bhardwaj, S. Potato leaf diseases detection using deep learning. In Proceedings of the 2020 4th International Conference on Intelligent Computing and Control Systems (ICICCS), Madurai, India, 13–15 May 2020; pp. 461–466. [Google Scholar]
  60. Zhang, X.; Qiao, Y.; Meng, F.; Fan, C.; Zhang, M. Identification of maize leaf diseases using improved deep convolutional neural networks. IEEE Access 2018, 6, 30370–30377. [Google Scholar] [CrossRef]
  61. Singh, A.; Arora, M. CNN Based Detection of Healthy and Unhealthy Wheat Crop. In Proceedings of the 2020 International Conference on Smart Electronics and Communication (ICOSEC), Trichy, India, 10–12 September 2020; pp. 121–125. [Google Scholar]
  62. Hong, H.; Lin, J.; Huang, F. Tomato Disease Detection and Classification by Deep Learning. In Proceedings of the 2020 International Conference on Big Data, Artificial Intelligence and Internet of Things Engineering (ICBAIE), Fuzhou, China, 12–14 June 2020; pp. 25–29. [Google Scholar]
Figure 1. Early wheat rust warning system [16].
Technologies 09 00047 g001
Figure 2. Wheat-leaf training sample.
Technologies 09 00047 g002
Figure 3. Classification performance of the Inception v3 model on a CPU.
Technologies 09 00047 g003
Figure 4. Classification performance of the Inception v3 model on a GPU.
Technologies 09 00047 g004
Figure 5. Classification performance of the Resnet50 model.
Technologies 09 00047 g005
Figure 6. Classification performance of the VGG16 model.
Technologies 09 00047 g006
Figure 7. Classification performance of the VGG19 model.
Technologies 09 00047 g007
Figure 8. Experimental results on the classified diseases.
Technologies 09 00047 g008
Figure 9. Summary of the VGG19 model classification performance.
Technologies 09 00047 g009
Table 1. Classification performance of each model.
DL ModelsLearnable ParaTimeEpochon CPUon GPU
Inception V3153,6031.30 h1095.03%
Inception v3153,60326 min15-95.65%
Resnet50301,0592.10 h50-81.57%
VGG1675,26729 min10-96.48%
VGG1975,26736 min15-99.38%
Table 2. Comparison of the proposed model accuracy with other models.
AuthorCrop DiseasesModelTrainingValid
Arun Pandian J [6]Different cropsVGG1687.03%-
Helal Sheikh [59]‘Maize’ and ‘Corn’CNN98.29%99.29%
Divyansh Tiwari [60]Potato (plant village)VGG1997.8%97.8%
Xihai Zhang [61]maize leavesGoogLeNet89.6%98.9%
Anshuman Singh [12]Wheat diseaseVGG1996.6%91.3%
Ashok [40]Tomato leafCNN 98.12%
Huiqun H [15]Tomato diseaseDXception 97.10%
Mikhail G [30]Wheat rustDensenet 98%
Sholihati R [7]Potato diseaseVGG19 91.%
Ours modelWheat diseaseVGG1999.38%98.23%
Publisher’s Note: MDPI stays neutral with regard to jurisdictional claims in published maps and institutional affiliations.

