Article

Effect of Data Scaling Methods on Machine Learning Algorithms and Model Performance

by
Md Manjurul Ahsan
1,*,
M. A. Parvez Mahmud
2,
Pritom Kumar Saha
3,
Kishor Datta Gupta
4 and
Zahed Siddique
5,*
1
School of Industrial and Systems Engineering, University of Oklahoma, Norman, OK 73019, USA
2
School of Engineering, Deakin University, Waurn Ponds, VIC 3216, Australia
3
Mewbourne College of Earth and Energy, University of Oklahoma, Norman, OK 73019, USA
4
Department of Computer Science, University of Memphis, Memphis, TN 38111, USA
5
School of Aerospace and Mechanical Engineering, University of Oklahoma, Norman, OK 73019, USA
*
Authors to whom correspondence should be addressed.
Submission received: 18 May 2021 / Revised: 13 July 2021 / Accepted: 21 July 2021 / Published: 24 July 2021
(This article belongs to the Section Information and Communication Technologies)

Abstract

:
Heart disease, one of the main reasons behind the high mortality rate around the world, requires a sophisticated and expensive diagnosis process. In the recent past, much literature has demonstrated machine learning approaches as an opportunity to efficiently diagnose heart disease patients. However, challenges associated with datasets such as missing data, inconsistent data, and mixed data (containing inconsistent missing data both as numerical and categorical) are often obstacles in medical diagnosis. This inconsistency led to a higher probability of misprediction and a misled result. Data preprocessing steps like feature reduction, data conversion, and data scaling are employed to form a standard dataset—such measures play a crucial role in reducing inaccuracy in final prediction. This paper aims to evaluate eleven machine learning (ML) algorithms—Logistic Regression (LR), Linear Discriminant Analysis (LDA), K-Nearest Neighbors (KNN), Classification and Regression Trees (CART), Naive Bayes (NB), Support Vector Machine (SVM), XGBoost (XGB), Random Forest Classifier (RF), Gradient Boost (GB), AdaBoost (AB), Extra Tree Classifier (ET)—and six different data scaling methods—Normalization (NR), Standscale (SS), MinMax (MM), MaxAbs (MA), Robust Scaler (RS), and Quantile Transformer (QT) on a dataset comprising of information of patients with heart disease. The result shows that CART, along with RS or QT, outperforms all other ML algorithms with 100% accuracy, 100% precision, 99% recall, and 100% F1 score. The study outcomes demonstrate that the model’s performance varies depending on the data scaling method.

1. Introduction

Patients with heart disease symptoms often require electrocardiography and blood tests in order to evaluate the disease appropriately [1,2]. Every year, almost 12 million people die due to heart diseases [3]. Thus, the diagnosis of this disease is vital at an early stage. While medical diagnosis is an important and complicated task, the recent development of artificial intelligence (AI) provides fast and alternative options, which can provide benefits for particular areas, such as rural areas, where a doctor and expensive equipment for diagnosis is very limited. Therefore, an automated diagnosis system would be beneficial that could be operated by nonmedical people as well. Over the years, it was observed that diagnosing heart disease with additional patient information and medical history at an early stage can save time, money, and health as well [4]. Several studies have shown the possibility of developing a decision support system using that information with the help of machine learning approaches [2,5,6,7,8,9].
Artificial-intelligence-based algorithms (e.g., heuristics, metaheuristics) are a rapidly growing area of computer science that has shown promise in various applications, including online learning [10], scheduling [11], multiobjective optimization [12], and vehicle routing [13]. Recent research has demonstrated a significant potential for deep-learning-based approaches in medical diagnosis [14,15,16]. By leveraging deep learning capabilities such as image segmentation, diseases such as diabetes, cancer, and Sars-CoV-2 have been more efficiently and effectively detected and diagnosed [15]. For example, when the global pandemic SARS-CoV-2 began, numerous studies proposed using chest radiographs (X-ray) and computed tomography (CT) scan images to detect patients with COVID-19 symptoms. For instance, Ahsan et al. (2020) proposed MLP–CNN-based approaches to identify COVID-19 patients using patient attributes such as age, gender, and temperature in conjunction with X-ray images. The experiment was carried out with an office grade laptop and a small amount of data [15].
Combining data classification techniques with nature-inspired algorithms such as genetic programming [17] and the swarm algorithm [18] enables the differentiation of different bacteria from viral meningitis [19]. As a result, artificial intelligence has gained popularity in recent years as a beneficial tool for optimization and decision support systems. However, deep-learning- and neural-network-based approaches are computationally expensive when dealing with larger datasets [20]. Therefore, unless necessary, traditional machine learning approaches are frequently preferred over deep learning approaches due to their lower computational cost and memory consumption.
However, developing a data-analysis-based decision support system requires standard data, which often requires many preprocessing steps. Some of the important preprocessing steps include data cleaning, pruning, feature selection, and scaling. While most studies considered different ML algorithms along with feature selection [2,5,6,7,8], few considered the effect of the data scaling process on overall model performance [9,21]. Thus, the primary purpose of this study is to evaluate the effect of different data scaling methods on different ML algorithms while developing a prediction model for patients with heart disease symptoms. The experimental result will give some insights to the researcher and practitioner to develop a robust, data-driven decision support system.
In the present study, eleven machine learning algorithms and six data scaling methods are used together to find the best match for heart disease prediction. Within the scope of this work, Logistic Regression (LR), Linear Discriminant Analysis (LDA), K-Nearest Neighbors (KNN), Classification and Regression Trees (CART), Naïve Bayes (NB), Support Vector Machine (SVM), XGBoost Algorithm (XGB), Decision Tree Classifier (DT), Random Forest Classifier (RF), Gradient Boost (GB), AdaBoost (AB), and Extra Tree classifier (ET) machine learning algorithms, and scaling methods such as Normalization (NR), Standscale (SS), MinMax (MM), MaxAbs (MA), Robust Sclaer (RS), and Quantile Transformer (QT) are used. The effect of different data scaling techniques are observed using the UCI Heart disease dataset.
The rest of the paper is organized as follows. In Section 2, a summary of the previous study is addressed, Section 3, Section 4 and Section 5 present the methodology, results, and discussion, respectively. Finally, in Section 6, a conclusion is drawn based on the overall experiment and the possibility of future work is discussed.

2. Literature Review

There is very limited work in the fields directly related to this paper. Most of the referenced literature represented their study output in terms of accuracy of the machine learning algorithm (ML). However, the performance of ML algorithms differs in each study due to the use of different ML approaches. For example, Tu et al. (2019) achieved accuracies of 81.14% and 78.90% using the Bagging and Decision Tree (DT) algorithm, respectively [22]. Srinivas et al. (2010) used a Naive-based approach and correctly identified patients with heart disease with 84.14% accuracy [23]. Similarly, a study conducted by Shouman et al. (2012) showed 84.10% accuracy using decision tree [24]; Chaurasia et al. (2013) showed 83.49% and 82.50% accuracy using CART and DT, respectively [25]; Hari et al. (2014) used the NB approach and their computation result demonstrated 83.40% accuracy [26]; Takci et al. (2018) used SVM-linear and SVM-sigmoid and identified heart disease patients accurately with 84.81% and 84.44% accuracy roughly [9].
Even though the performance of many of the reference literature shows promising result [24,25,26] using DT algorithms, surprisingly, computational accuracy varies by almost 7–8%, even though they have used the same dataset—the UCI heart disease dataset. None of the studies mentioned whether they applied data scaling methods or not; thus, it would be difficult to evaluate the reason behind the variation of DT accuracy on the same dataset in different studies. However, the potential reason could be the use of a different number of features, or variation in the training set/test set ratio. Additionally, sometimes the accuracy is not enough to represent the overall performance. Therefore, using a classification matrix and representing the overall performance with accuracy, precision, recall, and F1 scores is more reliable and suggested by many studies [9].
Since most of the studies used feature selection and somehow ignored the effect of data preprocessing on developing prediction models, instead of feature selection, in this study, we have focused and investigated data scaling methods more closely. However, there is no denying the fact that feature selection is also an important procedure in data analysis. For example, Amin et al. (2019) showed that the performance of different models’ accuracy varied up to 4–5% considering different combinations of ML algorithms with the number of features [21]. Study results also revealed that, due to the limited number of features, accuracy often drops by up to 14%, which is significantly high in case of medical diagnosis.
There are several published literatures on heart disease prediction that used the UCI heart disease dataset in their study [2,5,6,7,8,9,21,27,28,29]. Most of the published literature uses common machine learning algorithms. For example, most of the studies used SVM for heart disease prediction [5,6,7,8,9,27,28].
Studies conducted by [9,21] used LR, KNN, and SVM to predict the heart disease. On the other hand, studies conducted by [5,21] considered Decision trees for their study. However, predicting heart disease using other robust techniques such as XGB, AB, and ET are missing from those previous studies. Note that, over the years, algorithms such as XGB and AB showed promising results with highly imbalanced data [30]. Therefore, we can infer that the performance of XGB, AB, and ET may differ compared to LR, KNN, and SVM in disease prediction as well.
While there are several data scaling techniques available, one of the main challenges associated with ML is to choose the appropriate scaling method. Many studies bolster the effect of data scaling techniques on different ML algorithms [31,32].
Shahriyari et al. (2019) showed that the performance of normalization has a significant effect on different ML approaches [32]. Their study used twelve different ML algorithms and some of the most commonly used algorithms in heart disease prediction. The study used different normalization methods and showed that the performance of ML algorithms and the selection of normalization methods are interconnected. Among all eleven supervised algorithms, SVM has the maximum accuracy with 78%. However, their study also shows that Naïve Bayes has the best performance in terms of accuracy and lowest fitting times [32].
Another study conducted by Ambarwari et al. (2020) showed that data scaling techniques such as MinMax normalization and standardization have also significant effects on data analysis [31]. The study was carried out using ML algorithms such as KNN, Naïve Bayesian, ANN, and SVM with RBF. Their study demonstrated that NB has the most stable performance without use of data scaling techniques, while KNN showed more stable performance compared to SVM and ANN. However, their computational result revealed that MinMax scaling with SVM outperformed other algorithms’ performance, which is contradictory with the study conducted by [32]. Even though their studies do not synchronize with each other, it could still be inferred that data scaling does have some effect on overall performance.
Another study conducted by Balabaeva et al. (2020) addressed the effect of different scaling methods on heart failure patient datasets [33]. Their study uses more robust ML algorithms such as XGB, LR, DT, and RF with scaling methods such as Standard Scaler, MinMax Scaler, Max Abs Scaler, Robust scaler, and Quantile Transformer. In their study, RF showed higher performance with Standard Scaler and Robust Scaler. However, the performance of DT remained unchanged with scaling.
Table 1 summarizes the referenced literature that considered UCI heart disease data for their study with some of the common machine learning algorithms.
As a means of understanding the effect of data scaling methods with different data scaling approaches, a thorough investigation is required. A summary of our technical contribution is presented below:
  • Applied eleven different ML algorithms with data scaling methods on UCI heart disease dataset;
  • Investigated the algorithms’ performance without data scaling methods;
  • Identified the best algorithm and scaling method by analyzing the study outcome.

3. Methods

Table 2 details the overall assignment of data used in this study. The dataset contains 303 instances and 75 attributes. However, only 13 attributes are widely studied by referenced literature. The overall information about the dataset can be found here: http://archive.ics.uci.edu/ml/datasets/Heart+Disease (UCI DATASET).
Table 3 summarizes the detailed attributes of the selected features of the heart disease dataset.

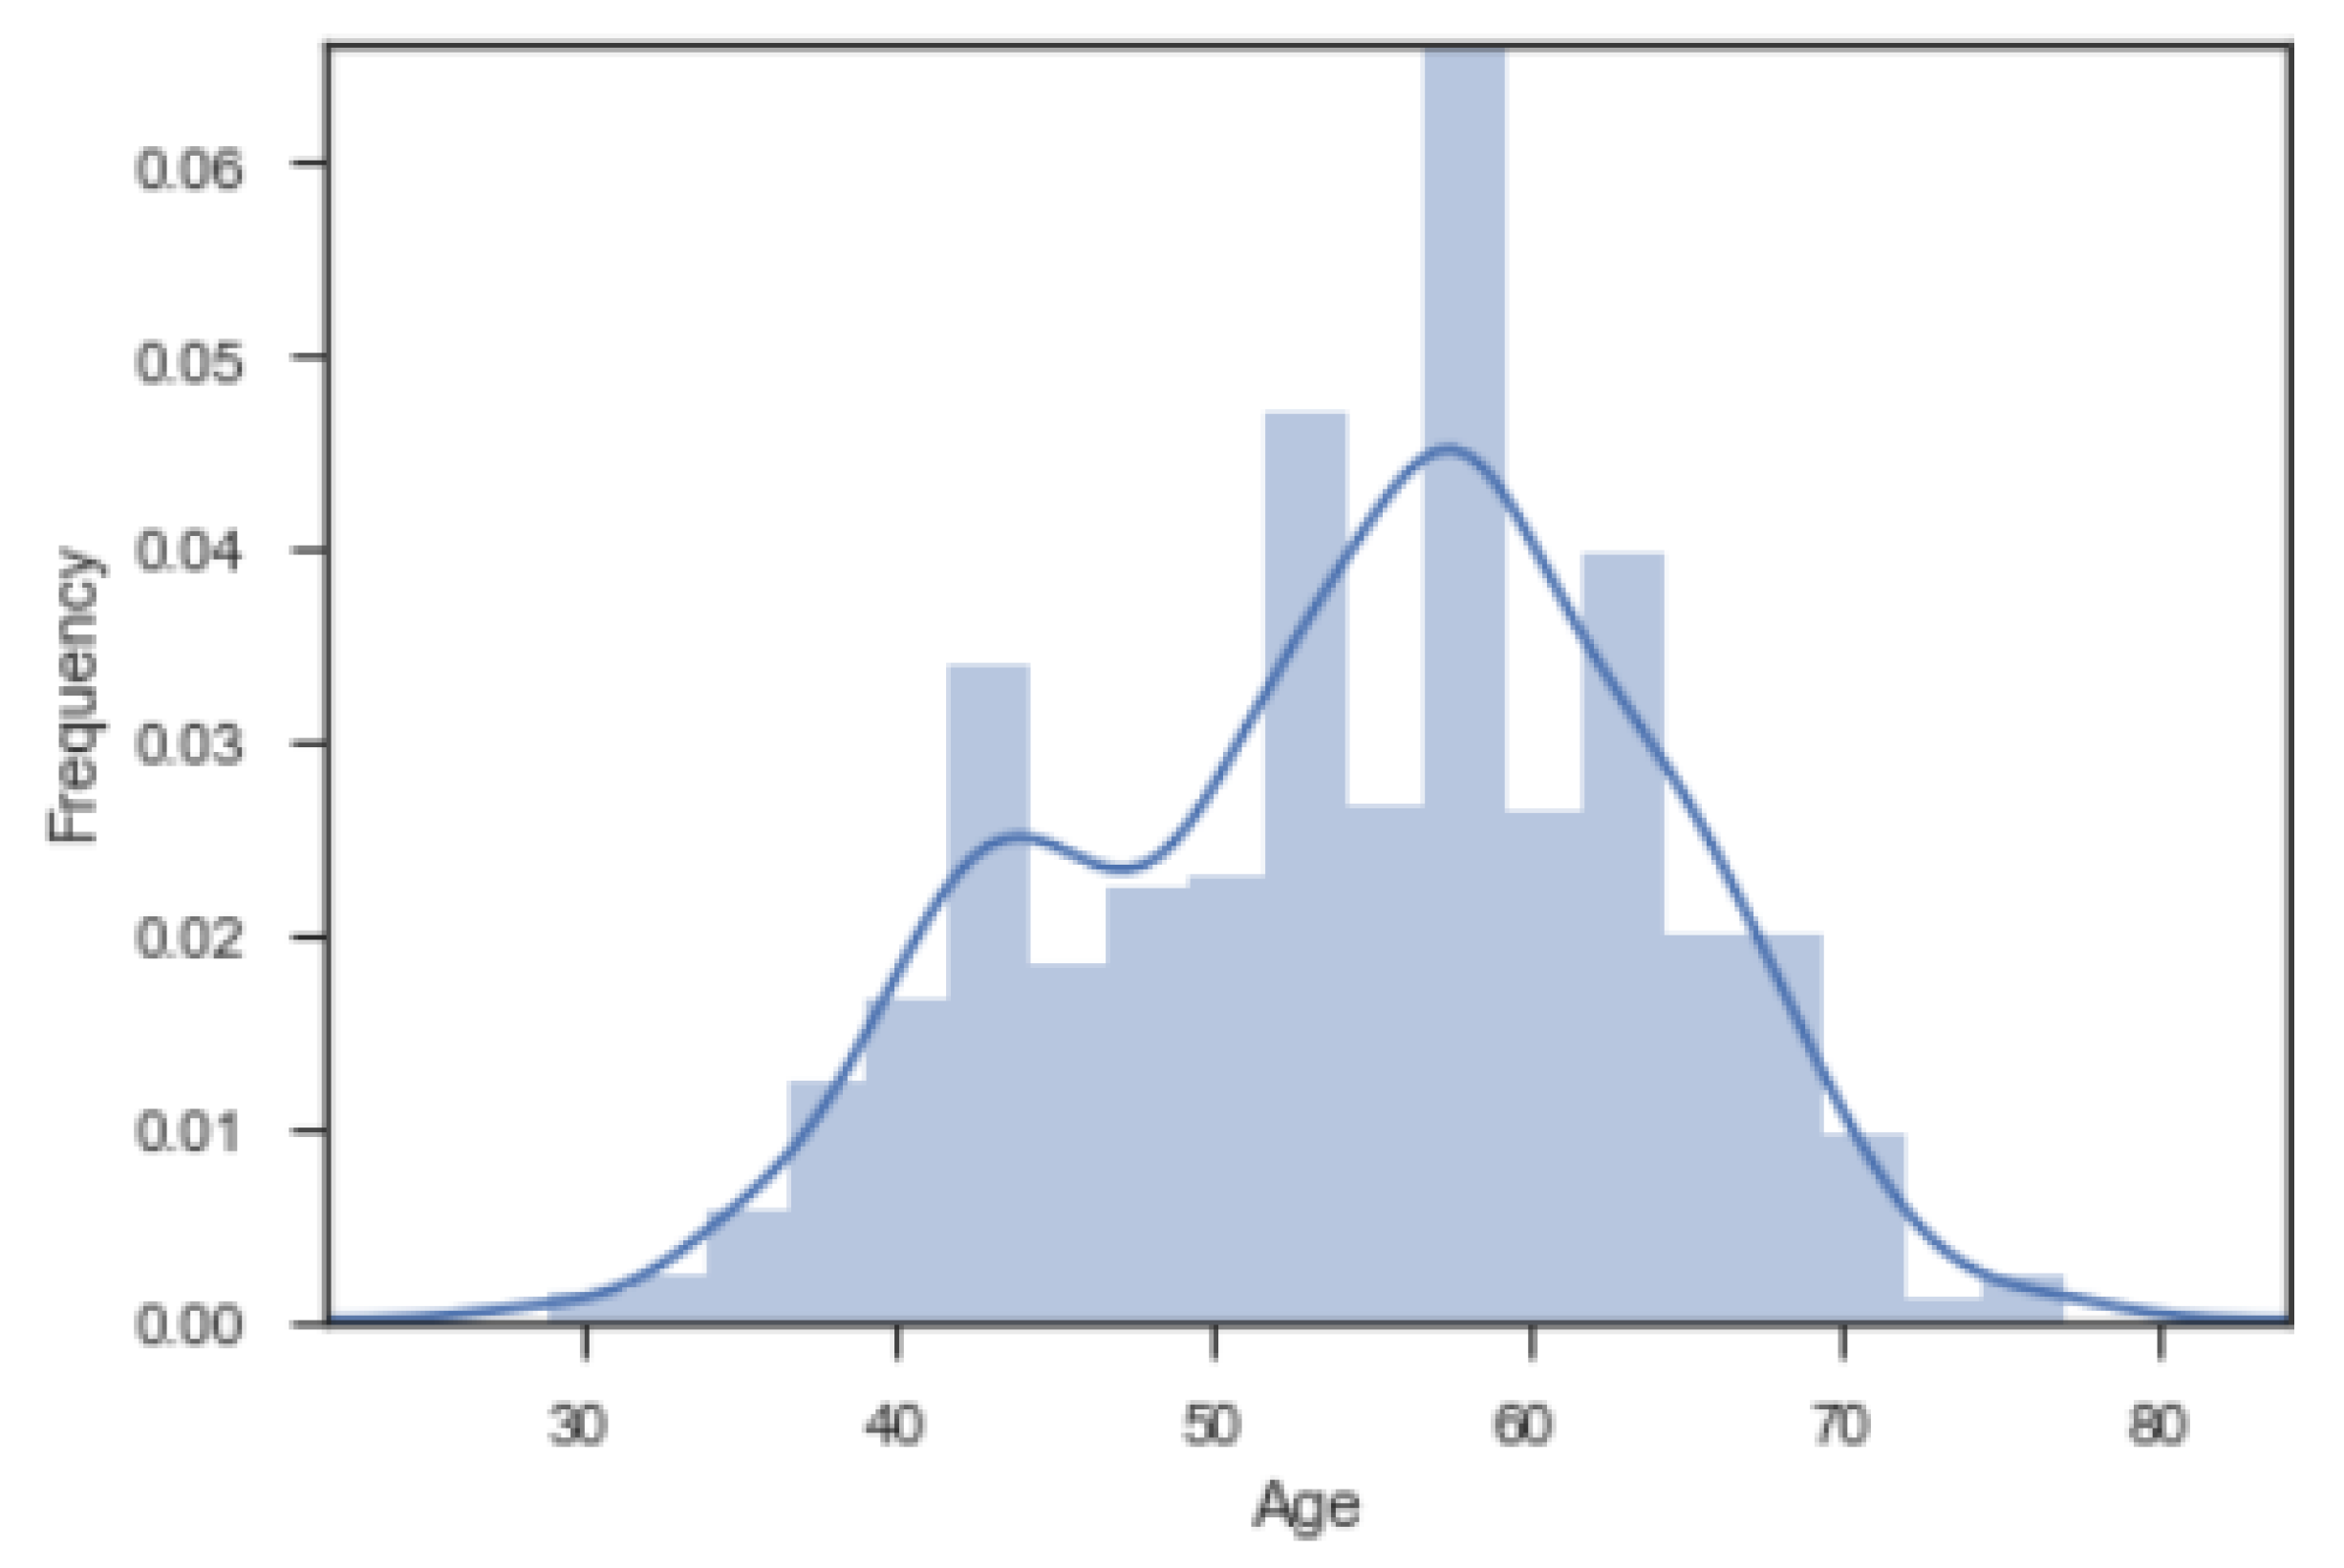
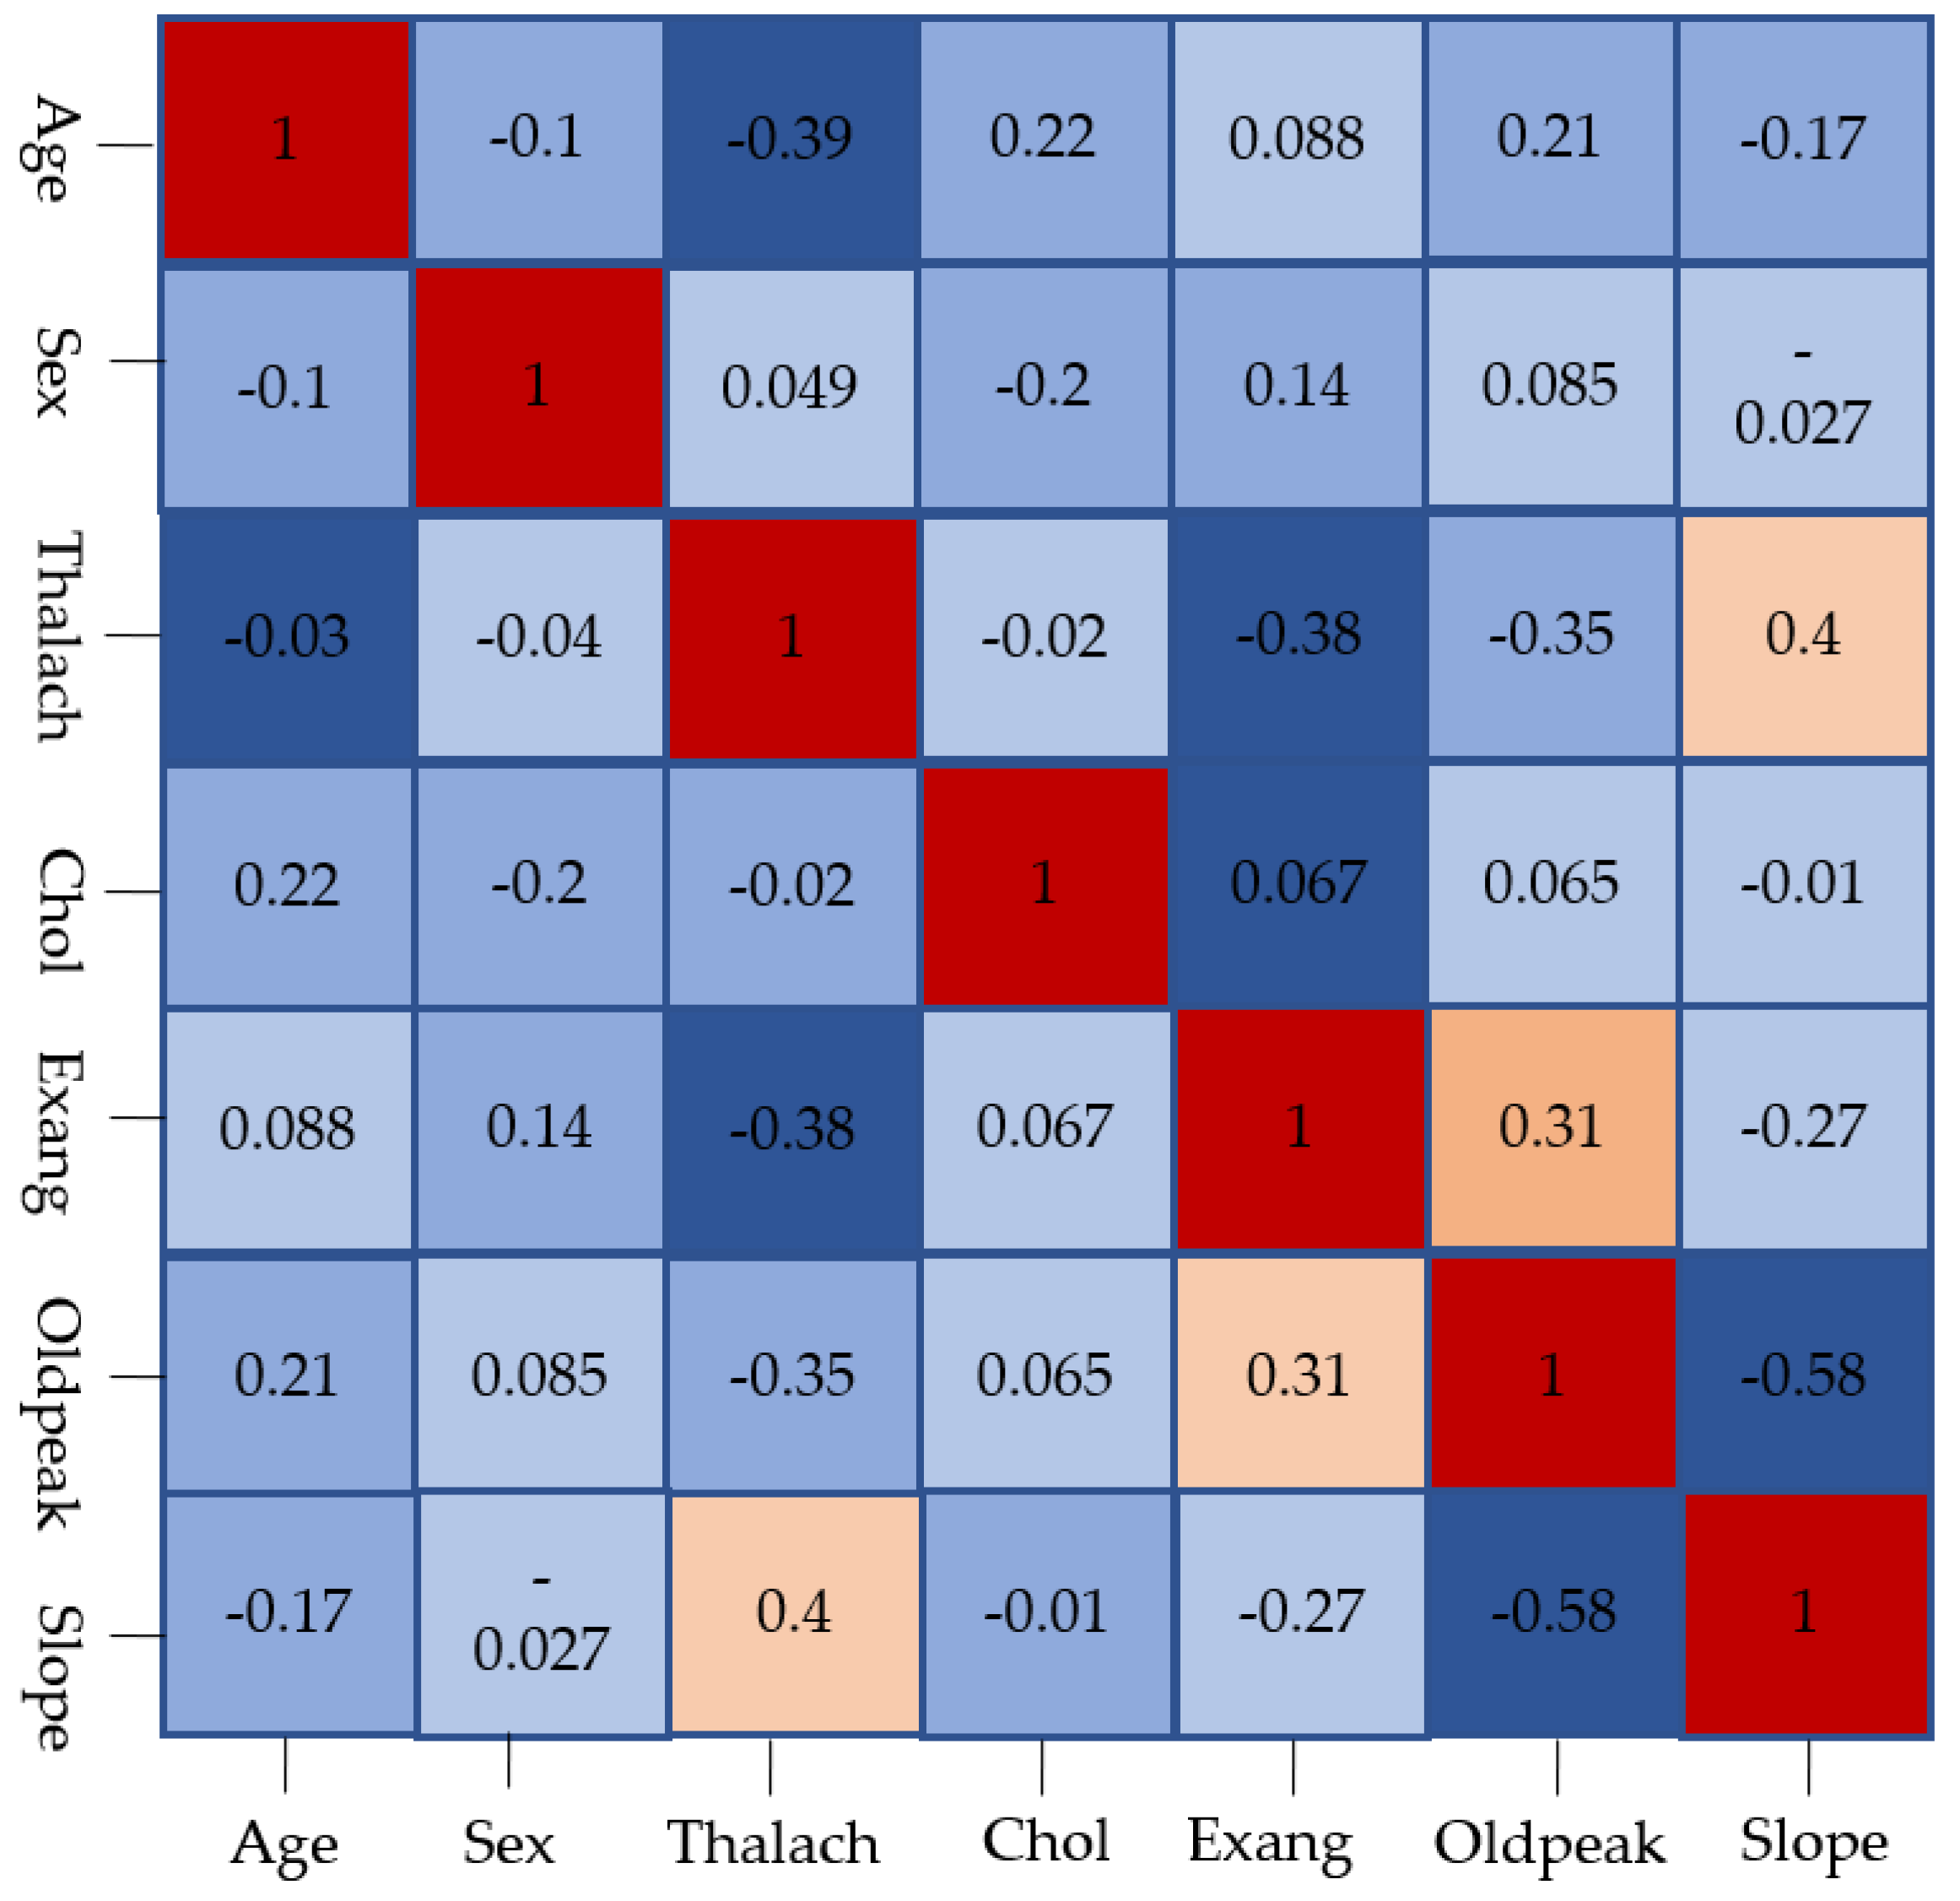
3.1. Data Visualization

Figure 1 gives some insights about the data sparsity of one of the data attributes “age”.
Figure 2 shows the pairplot of three attributes—age, sex, and thalach of heart disease dataset. On the other hand, seaborn heatmap was used to understand the importance of each feature, as shown in Figure 3. As all of the 13 attributes are highly correlated, this study uses all of those features.

3.2. Experimental Setup

To conduct this experiment, eleven machine learning algorithm were chosen: Logistic Regression (LR), Linear Discriminant Analysis (LDA), K-Nearest Neighbors (KNN), Classification and Regression Trees (CART), Naïve Bayes (NB), Support Vector Machine (SVM), XGBoost Algorithm (XGB), Random Forest Classifier (RF), Gradient Boost (GB), AdaBoost Classifier (AB), Extra Tree classifier (ET). Note that the main reason behind choosing these machine learning techniques is to compare the overall performance with those found in previous studies in terms of different preprocessing techniques. The implementation of all eleven ML algorithms and study results took place using the Anaconda modules with Python 3.7 and were run on an office-grade laptop with common specifications (Windows 10, Intel Core I7-7500U, and 16 GB of RAM). Instead of developing different preprocessing steps, this study uses built-in preprocessing libraries provided by Scikit-learn tools: Normalization, Standardization, MinMax Scale, MaxAbs scale, Robust Scaler, Quantile Transformer. Figure 4 illustrates the overall experimental approach using a flowchart.
The performance was evaluated based on accuracy, precision, recall, and F1 score, as shown in Table 4.
The matrix outcomes are as follows:
  • True Positive ( t n ) = Heart patient classified as patient;
  • False Positive ( f n ) = Healthy people classified as patient;
  • True Negative ( t n ) = Healthy people classified as healthy;
  • False Negative ( f n ) = Heart patient classified as Healthy.
The experiment was carried out by splitting the dataset into 80% and 20% for the training and testing set, respectively. The performance of the model was evaluated using 10-fold cross-validations, and the performance of the model is presented by averaging the outcomes of all 10 folds.

4. Result

Accuracy

Table 5 represents the overall accuracy for all eleven ML algorithms with different scaling techniques. The SVM and CART algorithms showed the highest accuracy (99%) compared with the other nine algorithms when applied without any scaling techniques. On the other hand, KNN showed the lowest performance with 75% accuracy. However, the overall performance improved up to 12% with the use of the MaxAbs scaling method. The study result also revealed that the overall performance is similar with or without using data scaling techniques for all algorithms except LR, KNN, SVM.
CART achieved an accuracy of 100% when implemented with Robust Scaler and Quantile Transformer methods. On the other hand, the performance of SVM reduced drastically from 99% to around 63% while using Normalization techniques. However, among all data scaling methods, with StandScale, SVM showed the higher accuracy at around 92%. To sum up, with data scaling methods, CART outperformed all other ML algorithms in the heart disease dataset.
While a previous study conducted by [22] showed that Naive Bayes outperformed all other methods, this study found that NB has the lowest accuracy when used with different scaling approaches. For different data scaling methods, the algorithms can be ranked as follows:
WS: CART/SVM>RFET>XGB/GB>AB>KR>LDA>NB>KNN
NR: CART>RF/ET/GB>XGB>AB>LDA>NB>KNN>LR>SVM
SS: CART>RF/ET>GB>XGB>SVM>AB>KNN>LR>LDA>NB
MM: CART/RF/ET>GB/XGB>AB>KNN>LR>SVM>LDA>NB
MA: CART/RF/ET>GB/XGB>AB>KNN>LR/SVM>LDA/NB
RS: CART/RF/ET>GB/XGB>AB>SVM>KNN/LR>LDA/NB
QT: CART/RF/ET>GB>XGB>AB>KNN>SVM/LDA>LR>NB
For different machine learning algorithms, data scaling methods can be ranked as follows:
LR: WS/SC/MM/MA/RS/QT>NR
LDA: QT>NR>WS/SC/MM/MA/RS
KNN: MA/QT>SC>MM>RS>NR>WS
CART: RS/QT>WS/NR/SC/MM/MA
NB: QT>WS/NR/SC/MM/MA/RS
SVM: WS>SC>RS>QT>MA>MM>NR
XGB: WS/NR>SC/MM/MA/RS/QT
RF: Same performance for all scaling
GB: NR>/WSQT>SC/MM/MA/RS
AB: NR>WS/SC/MM/MA/RS>QT
ET: Same performance for all scaling
Table 6 summarizes the overall precision result for all eleven ML algorithms in terms of different data scaling methods.
Without scaling, CART has the highest precision (100%) and KNN has the lowest precision (78%). The performance of algorithms LR, LDA, CART, SVM, and AB degrade once Normalization is applied to the dataset. From Table 6, it is clear that CART has the highest precision rate compared with any other algorithm with or without scaling. Algorithms KNN, SVM, and LDA have the lowest precision rate. Apart from CART, RF and ET showed more stability compared with other algorithms.
For different data scaling methods, the algorithms can be ranked as follows:
WS: CART>SVM/RF/ET>GB>XGB>AB>LR>NB>LDA>KNN
NR: CART/RF/GB/ET>XGB>AB>KNN/NB>LDA>LR>SVM
SS: CART/RF/ET>GB>XGB>KNN>AB>LR>NB>SVM>LDA
MM: CART>RF/ET>GB>XGB>KNN>AB>LR>NB>SVM>LDA
MA: CART/RF>ET>GB>XGB>KNN>AB>LR>NB/SVM>LDA
RS: CART>RF/ET>GB>XGB>AB>KNN>SVM>LR>NB>LDA
QT: CART>RF/ET/GB>XGB>KNN>AB>NB>SVM>LR/LDA
For different machine learning algorithms, data scaling methods can be ranked as follows:
LR: MM/MA/QT>WS/SS/RS>NR
LDA: QT>MA>WS/NR/SS/MM/RS
KNN: MA>MM/QT>SS>RS>NR>WS
CART: WS/SS/MM/MA/RS/QT>NR
NB: QT>WS/NR/SS/MM/MA/RS
SVM: WS>SS>RS/QT>MA>MM>NR
XGB: NR>WS/SS/MM/MA/RS/QT
RF: MA>WS/NR/SS/MM/RS/QT
GB: NR>QT>WS/SS/MM/MA/RS
Table 7 showed the overall recall results of all eleven ML algorithms along with different data scaling methods. Here, CART showed the highest recall rate of around 1, while KNN (0.72–0.84) and LR (0.74–0.89) showed the lowest recall rate. The overall recall performance could be ranked as follows:
WS: CART>SVM/RF/ET>XGB/GB>LDA/AB>LR>NB>KNN
NR: CART/RF>ET/XGB>GB>AB>LDA>SVM>NB>KNN>LR
SS: CART>RF/ET>XGB/GB>SVM>AB/LDA>LR>NB>KNN
MM: CART/ET>RF>XGB/GB>SVM>AB/LDA>LR>NB>KNN
MA: CART/ET/RF>XGB/GB>SVM>AB/LDA>LR>NB>KNN
RS: CART>ET/RF>XGB/GB>SVM>AB>LDA>LR>NB>KNN
QT: CART/ET>RF>XGB/GB>SVM/AB/LDA>LR>NB>KNN
Similarly, the performance of scaling methods for all eleven algorithms can be ranked as follows:
LR: WS/SC/MM/MA/RS>QT>NR
LDA: NR>WS/SC/MM/MA/RS/QT
KNN: SS/MA>QT>RS>MM>NR>WS
CART: WS/MM>NR/SC/MA/RS/QT
NB: WS/NR/SC/MM/MA/RS>QT
SVM: WS>SC/RS>MM/MA>QT>NR
XGB: NR>WS/SC/MM/MA/RS/QT
RF: NR>WS/MA>SC/MM/RS/QT
GB: NR>WS/SC/MM/MA/RS/QT
AB: NR>WS/SC/MM/MA/RS/QT
ET: WS/NR/MM/MA/QT>SC/RS
Table 8 showed the overall performance of F1 score. Among all of the ML algorithms, CART shows the highest F1 score up to 100%; CART obtained the highest while KNN, SVM, LR, and NB had the lowest scores.
The algorithms based on their F1 scores could be ranked as follows:
WS: CART/SVM>RF/ET>XGB/GB>AB/LR>LDA>NB>KNN
NR: CART>RT/RF/ET/XGB/GB>AB>LDA>NB>KNN>SVM/LR
SS: CART>RF/ET>XGB/GB>SVM>AB>KNN>LR>LDA>NB
MM: CART/RF/ET>XGB/GB>AB>KNN/LR>SVM/LDA>NB
MA: CART>RF/ET>XGB/GB>AB>KNN>LR/SVM>LDA/NB
RS: CART>RF>ET>XGB/GB>AB/SVM>LR>KNN/LDA>NB
QT: CART>ET>RF>GB>XGB>AB>SVM/KNN/LDA>LR>NB
On the other hand, scaling methods can be ranked as follows:
LR: WS/SS/MM/MA/RS/QT>NR
LDA: QT>WS/NR/SS/MM/MA/RS
KNN: MA>SS/QT>MM>RS>NR>WS
CART: RS/QT>WS/NR/SS/MM/MA
NB: QT>WS/SS/MM/MA/RS>NR
SVM: WS>SS>RS>QT>MA>MM>NR
XGB: NR>WS/SS/MM/MA/RS/QT
RF: MM/RS>WS/NR/SS/MA/QT
GB: NR>QT>WS/SS/MM/MA/RS
AB: NR>WS/SS/MM/MA/RS>QT
ET: MM/QT>WS/NR/SS/MA/RS
As a means of comparing our results with those available in literature, Table 9 compares the performance of the previous and current study. Results show that the model developed by Amin et al. (2019) illustrates the best performance compared with other reference literature with an accuracy of 85.86% [21].
A comparison between previous studies and current literature that use KNN is demonstrated in Table 10. Results show that our KNN model along with different scaling approaches achieved the maximum accuracy of 87%, while the lowest accuracy was measured for the KNN models without scaling.
A comparison of the previous studies and current study that use NB models for heart disease predictions is displayed in Table 11.
Without scaling, most of the previous studies outperformed the current study, as shown in Table 12.
The performance of RF with different scaling approaches on heart disease prediction is comparatively better than the previous study, as shown in Table 13. Additionally, no significant change was observed for different scaling approaches.
Table 14 shows the comparison between the current and a recent study that use the same ML algorithm and presents the computational results in terms of the F1 score.
Table 15 compared the precision of this experiment with the previous study conducted by Amin et al. (2019) [21].

5. Discussion

In this study, the overall performances of eleven different ML algorithms were analyzed with different data scaling approaches. Without scaling, CART and SVM showed the highest accuracy. However, once those algorithms were tested with different scaling methods, only CART showed stable performance (Table 5). The study result also showed that, using scaling methods, it is possible to achieve 100% accuracy using the CART algorithm (Table 5).
However, this study found that the experimental result for different data scaling methods may not be satisfied all the time. For example, while most of the previous studies achieved higher results with SVM, using scaling methods such as MinMax, Normalization, and StandScale, this study found that the performance of SVM was significantly degraded. Since there are no specific techniques available to decide the best scaling methods for any datasets, researchers need to find the best ones by experimenting with ML algorithms with multiple trails. Additionally, for each particular experiment, the dataset will be different; therefore, a better way to develop the best model for the specific dataset is to experiment with different ML algorithms incorporated with different scaling approaches.
Among eleven ML algorithms, CART outperformed all others in terms of accuracy, precision, recall, and F1 score. However, there was no single scaling method that outperformed other methods when using different algorithms. From the overall experiment, the study outcomes for different scaling methods can be expressed as follows: QT outperformed all other methods when used with LDA, LR, KNN, and NB. On the other hand, NR performed better when used with boosting methods such as XGB, GB, and AB.
We also discovered that standard machine learning algorithms could produce better outcomes—particularly when diagnosing heart disease patients—throughout our research. For example, Masih et al. (2020) and Jalali et al. (2019) used a multilayer-perceptron-based deep neural network to detect coronary heart disease early [35,36]. They achieved accuracies of approximately 96.5% and 92.39%, respectively, while we achieved nearly 100% accuracy using CART. While this study result may convey some light on the effect of different scaling methods in data analysis, still, our research has some limitations as well. The technical limitations can be summarized as follows:
  • Since the experiment was conducted using only one dataset, it could be difficult to conclude that the algorithm performance will remain the same if experimented with a different heart disease dataset.
  • During this study, we did not emphasize the feature selection process. Instead, we decided to choose a similar number of features as chosen and used by previous literatures for direct comparison. However, experimenting with different features, ML algorithms, and scaling approaches may produce different results.
  • Some of the recent trending ML approaches such as deep learning, CNN, and RNN were ignored, as the dataset was quite straightforward and easy to handle with standard ML algorithms.

6. Conclusions

This study evaluated eleven machine learning (ML) algorithms along with six distinct data scaling methods to detect patients with heart diseases using the UCI heart disease dataset. Our findings suggest that data scaling approaches have some effect on ML predictions. The CART algorithm achieved almost 100% accuracy and outperformed any other method proposed by previous literature for heart disease prediction. This study also evaluated the performance variation considering different data scaling approaches. Results show that algorithm performance fluctuates with different scaling methods. However, no single scaling approach is observed that can be ranked as the best one among all of the scaling methods. We believe the study result will give a direction to the researcher/practitioner who wants to develop a medical diagnosis model with a dataset containing outliers, features, and unequal data ratio. However, the limitations addressed in the discussion will be the primary concern for further study—including but not limited to experimenting with another ML algorithm with real-time heart disease data, changing the parameters of different data scaling techniques, and experimenting using deep learning with big data.

Author Contributions

Conceptualization, M.M.A. and Z.S. and K.D.G.; methodology, M.M.A. and M.A.P.M.; software, M.M.A.; validation, K.D.G. and M.A.P.M.; formal analysis, M.M.A., M.A.P.M., P.K.S. and K.D.G.; investigation, P.K.S. and Z.S.; writing—original draft preparation, M.M.A. and K.D.G.; writing—review and editing, M.M.A., M.A.P.M., P.K.S. and Z.S.; visualization, P.K.S. and Z.S.; supervision, Z.S. All authors have read and agreed to the published version of the manuscript.

Funding

This research received no external funding.

Institutional Review Board Statement

Not applicable.

Informed Consent Statement

Not applicable.

Data Availability Statement

Not applicable.

Conflicts of Interest

The authors declare no conflict of interest.

Abbreviations

The following abbreviations are used in this manuscript:
LRLogistic Regression
LDALinear Discriminant Analysis
KNNK-Nearest Neighbors
CARTClassification and Regression Trees
NBNaive Bayes
SVMSupport Vector Machine
XGBXGBoost
RFRandom Forest Classifier
GBGradient Boost
ABAdaBoost
ETExtra Tree Classifier
DTDecision Tree
NRNormalization
SSStandscale
MMMinMax
MAMaxAbs
RSRobust Scaler
QTQuantile Transformer
MLMachine Learning
MLPMultilayer Perceptron
AIArtificial Intelligence

References

  1. Tripoliti, E.E.; Papadopoulos, T.G.; Karanasiou, G.S.; Naka, K.K.; Fotiadis, D.I. Heart failure: Diagnosis, severity estimation and prediction of adverse events through machine learning techniques. Comput. Struct. Biotechnol. J. 2017, 15, 26–47. [Google Scholar] [CrossRef] [Green Version]
  2. Pawlovsky, A.P. An ensemble based on distances for a kNN method for heart disease diagnosis. In Proceedings of the 2018 International Conference on Electronics, Information, and Communication (ICEIC), Honolulu, HI, USA, 24–27 January 2018; pp. 1–4. [Google Scholar]
  3. Soni, J.; Ansari, U.; Sharma, D.; Soni, S. Predictive data mining for medical diagnosis: An overview of heart disease prediction. Int. J. Comput. Appl. 2011, 17, 43–48. [Google Scholar] [CrossRef]
  4. Lord, W.P.; Wiggins, D.C. Medical decision support systems. In Advances in Health care Technology Care Shaping the Future of Medical; Springer: Berlin/Heidelberg, Germany, 2006; pp. 403–419. [Google Scholar]
  5. Bashir, S.; Khan, Z.S.; Khan, F.H.; Anjum, A.; Bashir, K. Improving Heart Disease Prediction Using Feature Selection Approaches. In Proceedings of the 2019 16th International Bhurban Conference on Applied Sciences and Technology (IBCAST), Islamabad, Pakistan, 8–12 January 2019; pp. 619–623. [Google Scholar]
  6. Bhatia, S.; Prakash, P.; Pillai, G. SVM based decision support system for heart disease classification with integer-coded genetic algorithm to select critical features. In Proceedings of the World Congress on Engineering and Computer Science, San Francisco, CA, USA, 22–24 October 2008; pp. 34–38. [Google Scholar]
  7. Gudadhe, M.; Wankhade, K.; Dongre, S. Decision support system for heart disease based on support vector machine and artificial neural network. In Proceedings of the 2010 International Conference on Computer and Communication Technology (ICCCT), Allahabad, India, 17–19 September 2010; pp. 741–745. [Google Scholar]
  8. Ghumbre, S.; Patil, C.; Ghatol, A. Heart disease diagnosis using support vector machine. In Proceedings of the International Conference on Computer Science and Information Technology (ICCSIT’), Pattaya, Thailand, 17–18 December 2011. [Google Scholar]
  9. Takci, H. Improvement of heart attack prediction by the feature selection methods. Turk. J. Electr. Eng. Comput. Sci. 2018, 26, 1–10. [Google Scholar] [CrossRef]
  10. Zhao, H.; Zhang, C. An online-learning-based evolutionary many-objective algorithm. Inf. Sci. 2020, 509, 1–21. [Google Scholar] [CrossRef]
  11. Dulebenets, M.A. A novel memetic algorithm with a deterministic parameter control for efficient berth scheduling at marine container terminals. Marit. Bus. Rev. 2017, 2, 303–330. [Google Scholar] [CrossRef] [Green Version]
  12. Liu, Z.Z.; Wang, Y.; Huang, P.Q. AnD: A many-objective evolutionary algorithm with angle-based selection and shift-based density estimation. Inf. Sci. 2020, 509, 400–419. [Google Scholar] [CrossRef] [Green Version]
  13. Pasha, J.; Dulebenets, M.A.; Kavoosi, M.; Abioye, O.F.; Wang, H.; Guo, W. An optimization model and solution algorithms for the vehicle routing problem with a “factory-in-a-box”. IEEE Access 2020, 8, 134743–134763. [Google Scholar] [CrossRef]
  14. Ahsan, M.M.; Gupta, K.D.; Islam, M.M.; Sen, S.; Rahman, M.; Shakhawat Hossain, M. Covid-19 symptoms detection based on nasnetmobile with explainable ai using various imaging modalities. Mach. Learn. Knowl. Extr. 2020, 2, 27. [Google Scholar] [CrossRef]
  15. Ahsan, M.M.; E Alam, T.; Trafalis, T.; Huebner, P. Deep MLP-CNN model using mixed-data to distinguish between COVID-19 and Non-COVID-19 patients. Symmetry 2020, 12, 1526. [Google Scholar] [CrossRef]
  16. Ahsan, M.M.; Ahad, M.T.; Soma, F.A.; Paul, S.; Chowdhury, A.; Luna, S.A.; Yazdan, M.M.S.; Rahman, A.; Siddique, Z.; Huebner, P. Detecting SARS-CoV-2 From Chest X-Ray Using Artificial Intelligence. IEEE Access 2021, 9, 35501–35513. [Google Scholar] [CrossRef]
  17. Sen, S.; Gupta, K.D.; Poudyal, S.; Ahsan, M.M. A genetic algorithm approach to optimize dispatching for a microgrid energy system with renewable energy sources. In Proceedings of the CS & IT Conference Proceedings, Dubai, United Arab Emirates, 30 November–1 December 2019; Volume 9. [Google Scholar]
  18. Ahsan, M.M.; Gupta, K.D.; Nag, A.K.; Pouydal, S.; Kouzani, A.Z.; Mahmud, M.P. Applications and evaluations of bio-inspired approaches in cloud security: A review. IEEE Access 2020, 8, 180799–180814. [Google Scholar] [CrossRef]
  19. D’Angelo, G.; Pilla, R.; Tascini, C.; Rampone, S. A proposal for distinguishing between bacterial and viral meningitis using genetic programming and decision trees. Soft Comput. 2019, 23, 11775–11791. [Google Scholar] [CrossRef]
  20. Ahsan, M.M.; Li, Y.; Zhang, J.; Ahad, M.T.; Gupta, K.D. Evaluating the Performance of Eigenface, Fisherface, and Local Binary Pattern Histogram-Based Facial Recognition Methods under Various Weather Conditions. Technologies 2021, 9, 31. [Google Scholar] [CrossRef]
  21. Amin, M.S.; Chiam, Y.K.; Varathan, K.D. Identification of significant features and data mining techniques in predicting heart disease. Telemat. Inform. 2019, 36, 82–93. [Google Scholar] [CrossRef]
  22. Tu, M.C.; Shin, D.; Shin, D. Effective diagnosis of heart disease through bagging approach. In Proceedings of the 2009 2nd International Conference on Biomedical Engineering and Informatics, Tianjin, China, 17–19 October 2009; pp. 1–4. [Google Scholar]
  23. Srinivas, K.; Rani, B.K.; Govrdhan, A. Applications of data mining techniques in healthcare and prediction of heart attacks. Int. J. Comput. Sci. Eng. (IJCSE) 2010, 2, 250–255. [Google Scholar]
  24. Shouman, M.; Turner, T.; Stocker, R. Integrating decision tree and k-means clustering with different initial centroid selection methods in the diagnosis of heart disease patients. In Proceedings of the International Conference on Data Science (ICDATA); The Steering Committee of The World Congress in Computer Science, Computer Engineering and Applied Computing (WorldComp): Northcott Drive, Canberra, 2012; p. 1. [Google Scholar]
  25. Chaurasia, V.; Pal, S. Early prediction of heart diseases using data mining techniques. Caribb. J. Sci. Technol. 2013, 1, 208–217. [Google Scholar]
  26. Hari Ganesh, S.; Gajenthiran, M. Comparative study of data mining approaches for prediction heart diseases. IOSR J. Eng. 2014, 4, 36–39. [Google Scholar] [CrossRef]
  27. Shilaskar, S.; Ghatol, A. Feature selection for medical diagnosis: Evaluation for cardiovascular diseases. Expert Syst. Appl. 2013, 40, 4146–4153. [Google Scholar] [CrossRef]
  28. Kausar, N.; Palaniappan, S.; Samir, B.B.; Abdullah, A.; Dey, N. Systematic analysis of applied data mining based optimization algorithms in clinical attribute extraction and classification for diagnosis of cardiac patients. In Applications of Intelligent Optimization in Biology and Medicine; Springer: Berlin/Heidelberg, Germany, 2016; pp. 217–231. [Google Scholar]
  29. Khourdifi, Y.; Bahaj, M. K-Nearest Neighbour Model Optimized by Particle Swarm Optimization and Ant Colony Optimization for Heart Disease Classification. In International Conference on Big Data and Smart Digital Environment; Springer: Berlin/Heidelberg, Germany, 2018; pp. 215–224. [Google Scholar]
  30. Mishra, S. Handling imbalanced data: SMOTE vs. random undersampling. Int. Res. J. Eng. Technol. (IRJET) 2017, 4, 317–320. [Google Scholar]
  31. Ambarwari, A.; Adrian, Q.J.; Herdiyeni, Y. Analysis of the Effect of Data Scaling on the Performance of the Machine Learning Algorithm for Plant Identification. J. Resti (Rekayasa Sist. Dan Teknol. Inf.) 2020, 4, 117–122. [Google Scholar] [CrossRef]
  32. Shahriyari, L. Effect of normalization methods on the performance of supervised learning algorithms applied to HTSeq-FPKM-UQ data sets: 7SK RNA expression as a predictor of survival in patients with colon adenocarcinoma. Briefings Bioinform. 2019, 20, 985–994. [Google Scholar] [CrossRef] [PubMed]
  33. Balabaeva, K.; Kovalchuk, S. Comparison of Temporal and Non-Temporal Features Effect on Machine Learning Models Quality and Interpretability for Chronic Heart Failure Patients. Procedia Comput. Sci. 2019, 156, 87–96. [Google Scholar] [CrossRef]
  34. Khan, M.A. An IoT Framework for Heart Disease Prediction Based on MDCNN Classifier. IEEE Access 2020, 8, 34717–34727. [Google Scholar] [CrossRef]
  35. Masih, N.; Naz, H.; Ahuja, S. Multilayer perceptron based deep neural network for early detection of coronary heart disease. Health Technol. 2021, 11, 127–138. [Google Scholar] [CrossRef]
  36. Jalali, S.M.J.; Karimi, M.; Khosravi, A.; Nahavandi, S. An efficient neuroevolution approach for heart disease detection. In Proceedings of the 2019 IEEE International Conference on Systems, Man and Cybernetics (SMC), Bari, Italy, 6–9 October 2019; pp. 3771–3776. [Google Scholar]
Figure 1. Histogram of Age.
Technologies 09 00052 g001
Figure 2. Pairplot visualization of the UCI heart disease dataset’s age, sex, and thalach attributes.
Technologies 09 00052 g002
Figure 3. Various attributes of the UCI dataset are visualized using a heat map.
Technologies 09 00052 g003
Figure 4. Flow chart of overall experiment.
Technologies 09 00052 g004
Table 1. Comparison with previous studies. An asterisk indicates that such methods are involved in the literature.
AuthorsMethods
LRKNNNBSVMDTRF
Bhatia et al. (2008) *
Gudadhe et al. (2010) [7]
Ghumbre et al. (2011) [8] *
Shilaskar and Ghatol (2013) [27] *
Kausar et al. (2016) [28] *
Amin et al. (2019) [21]******
Bashir et al. (2019) [5]* ***
Pawlovsky (2018) [2] *
Takci (2018) [9]***
Khourdifi and Bahaj (2018) [29] *
Table 2. First five rows of heart disease dataset.
AgeSexcpTrestbpsCholfbsRestecgThalachExangOldpeak
52101252120116801.0
53101402031015513.1
70101451740112512.6
61101482030116100.0
62001382941110601.9
Table 3. Description of UCI Heart Disease data attributes.
AttributeDescriptionValues
ageAge in yearsContinuous
sexMale/female1 = male, 0 = female
cpChest pain type1 = typical type 1, 2 = typical type agina, 3 = nonagina pain, 4 = asymptomatic
thestbpsResting blood pressureContinuous value in mm hg
cholSerum CholesterolContinuous value in mm/dl
RestecgResting electrographic results0 = normal, 1 = having_ST_T wave abnormal, 2 = left ventricular hypertrophy
fbsFasting blood sugar 1 120 mg/dl, 0 120 mg/dl
thalachMaximum heart rate achievedContinuous value
exangExercise induced agina0 = no, 1 = yes
oldpeakST depression induced by exercise relative to restContinuous value
solpeSlope of the peak exercise ST segment1 = unsloping, 2 = flat, 3 = downsloping
caNumber of major vessels colored by floursopy0-3 value
thalDefect type3 = normal, 6 = fixed, 7 = reversible defect
Table 4. The parameter used to compute the confusion matrix [16,34].
Test ResultTruthPerformance Measure
Heart DiseaseNon-Heart-Disease
P o s i t i v e t n f n A c c u r a c y = t p + t n t p + t n + f p + f n
N e g a t i v e t n f n P r e c i s i o n = t p t p + f p
R e c a l l = t p t n + f p
F 1 = 2 × P r e c i s i o n × R e c a l l P r e c i s i o n + R e c a l l
Table 5. Overall performance of different algorithms based on accuracy.
Accuracy
AlgorithmWSNRSSMMMARSQT
LR0.840.680.840.840.840.840.84
LDA0.820.830.820.820.820.820.85
KNN0.750.790.860.850.870.840.87
CART0.990.990.990.990.991.01.0
NB0.820.820.820.820.820.820.83
SVM0.990.630.920.830.840.880.85
XGB0.970.970.960.960.960.960.96
RF0.980.980.980.980.980.980.98
GB0.970.980.960.960.960.960.97
AB0.890.930.890.890.890.890.88
ET0.980.980.980.980.980.980.98
Table 6. Overall performance of different algorithms based on precision.
Precision
AlgorithmWSNRSSMMMARSQT
LR0.810.670.810.820.820.810.82
LDA0.7890.780.780.780.790.780.82
KNN0.780.80.880.90.910.870.9
CART1.00.991.01.01.01.01.0
NB0.80.80.80.80.80.80.84
SVM0.990.60.910.790.80.860.83
XGB0.960.980.960.960.960.960.96
RF0.9900.990.990.9910.990.99
GB0.970.990.970.970.970.970.98
AB0.880.920.880.880.880.880.87
ET0.990.990.990.990.990.990.99
Table 7. Overall performance of different algorithms based on Recall.
Recall
AlgorithmWSNRSSMMMARSQT
LR0.890.740.890.890.890.890.88
LDA0.900.920.900.900.900.900.90
KNN0.720.770.840.810.840.820.83
CART1.00.990.991.00.990.990.99
NB0.850.850.850.850.850.850.84
SVM0.990.860.930.910.910.930.90
XGB0.960.980.960.960.960.960.96
RF0.980.990.970.970.980.970.97
GB0.960.970.960.960.960.960.96
AB0.900.940.900.900.900.900.90
ET0.980.980.970.980.980.970.98
Table 8. Overall performance of different algorithms based on F1 score.
F1 Score
AlgorithmWSNRSSMMMARSQT
LR0.850.700.850.850.850.850.85
LDA0.840.840.840.840.840.840.86
KNN0.750.790.860.850.870.840.86
CART0.990.990.990.990.9911
NB0.830.820.830.830.830.830.84
SVM0.990.700.920.840.850.890.86
XGB0.960.980.960.960.960.960.96
DT0.980.980.980.980.980.980.98
RF0.980.980.980.990.980.990.98
GB0.960.980.960.960.960.960.97
AB0.890.930.890.890.890.890.88
ET0.980.980.980.990.980.980.99
Table 9. Comparison with previous study—Logistic Regression.
Our Study
AuthorsAccuracyWithout ScalingWith Scaling
MaximumMinimum
Amin et al. (2019) [21]85.86%
84%84% (SC, MM, MA, ES, QT)68% (NR)
Bashir et al. (2019) [5]82.56%
Table 10. Comparison with previous study—KNN.
Our Study
AuthorsAccuracyWithout ScalingWith Scaling
MaximumMinimum
Amin et al. (2019) [21]82.49%
75%87% (MA, QT)79% (NR)
Pawlovsky (2018) [2]85%
Table 11. Comparison with previous study—NB.
Our Study
AuthorsAccuracyWithout ScalingWith Scaling
MaximumMinimum
Srinivas et al. (2010) [23]84.14
Hari Ganesh et al. (2014) [26]83.40%
82%83% (QT)82% (NR, SC, MM, MA, RS)
Amin et al. (2019) [21]85.86%
Bashir et al. (2019) [5]84.24%
Table 12. Comparison with previous study—SVM.
Our Study
AuthorsAccuracyWithout ScalingWith Scaling
MaximumMinimum
Bhatia et al. (2008) [6]90.57%
Gudadhe et al. (2010) [7]80.41%
Ghumbre et al. (2011) [8]85.05%
99%92%(SC)63%(NR)
Kausar et al. (2016) [28]81%
Amin et al. (2019) [21]86.87%
Bashir et al. (2019) [5]84.85%
Takci (2018) [9]84.88%
Table 13. Comparison with previous study—RF.
Our Study
AuthorsAccuracyWithout ScalingWith Scaling
MaximumMinimum
Bashir et al. (2019) [5]84.17%98%98% (for all scaling methods)No
minimum
Table 14. Comparison of F1 score with previous study done by Amin et al. (2019) [21].
AlgorithmPrevious StudyWSNRSSMMMARSQT
SVM0.880.990.700.920.840.850.890.86
NB0.870.830.820.830.830.830.830.84
LR0.870.850.700.850.850.850.850.85
KNN0.840.750.790.860.850.870.840.86
DT0.840.980.980.980.980.980.980.98
Table 15. Comparison of Precision with previous study conducted by Amin et al. (2019) [21].
AlgorithmPrevious StudyWSNRSSMMMARSQT
SVM0.860.990.60.910.790.80.860.83
NB0.870.80.80.80.80.80.80.84
LR0.860.810.670.810.820.820.810.82
KNN0.950.780.80.880.90.910.870.9
DT0.950.990.980.980.990 0.990.980.98
Publisher’s Note: MDPI stays neutral with regard to jurisdictional claims in published maps and institutional affiliations.

