
Whole-Body [18F]-Fluoride PET SUV Imaging to Monitor Response to Dasatinib Therapy in Castration-Resistant Prostate Cancer Bone Metastases: Secondary Results from ACRIN 6687

 ,
,
Abstract
:1. Introduction
2. Materials and Methods
2.1. Study Design
2.2. Clinical Assessments
2.3. PET Image Analysis
2.4. Quantitative Total Bone Imaging (QTBI) Analysis
2.5. Statistics
3. Results
3.1. Patients
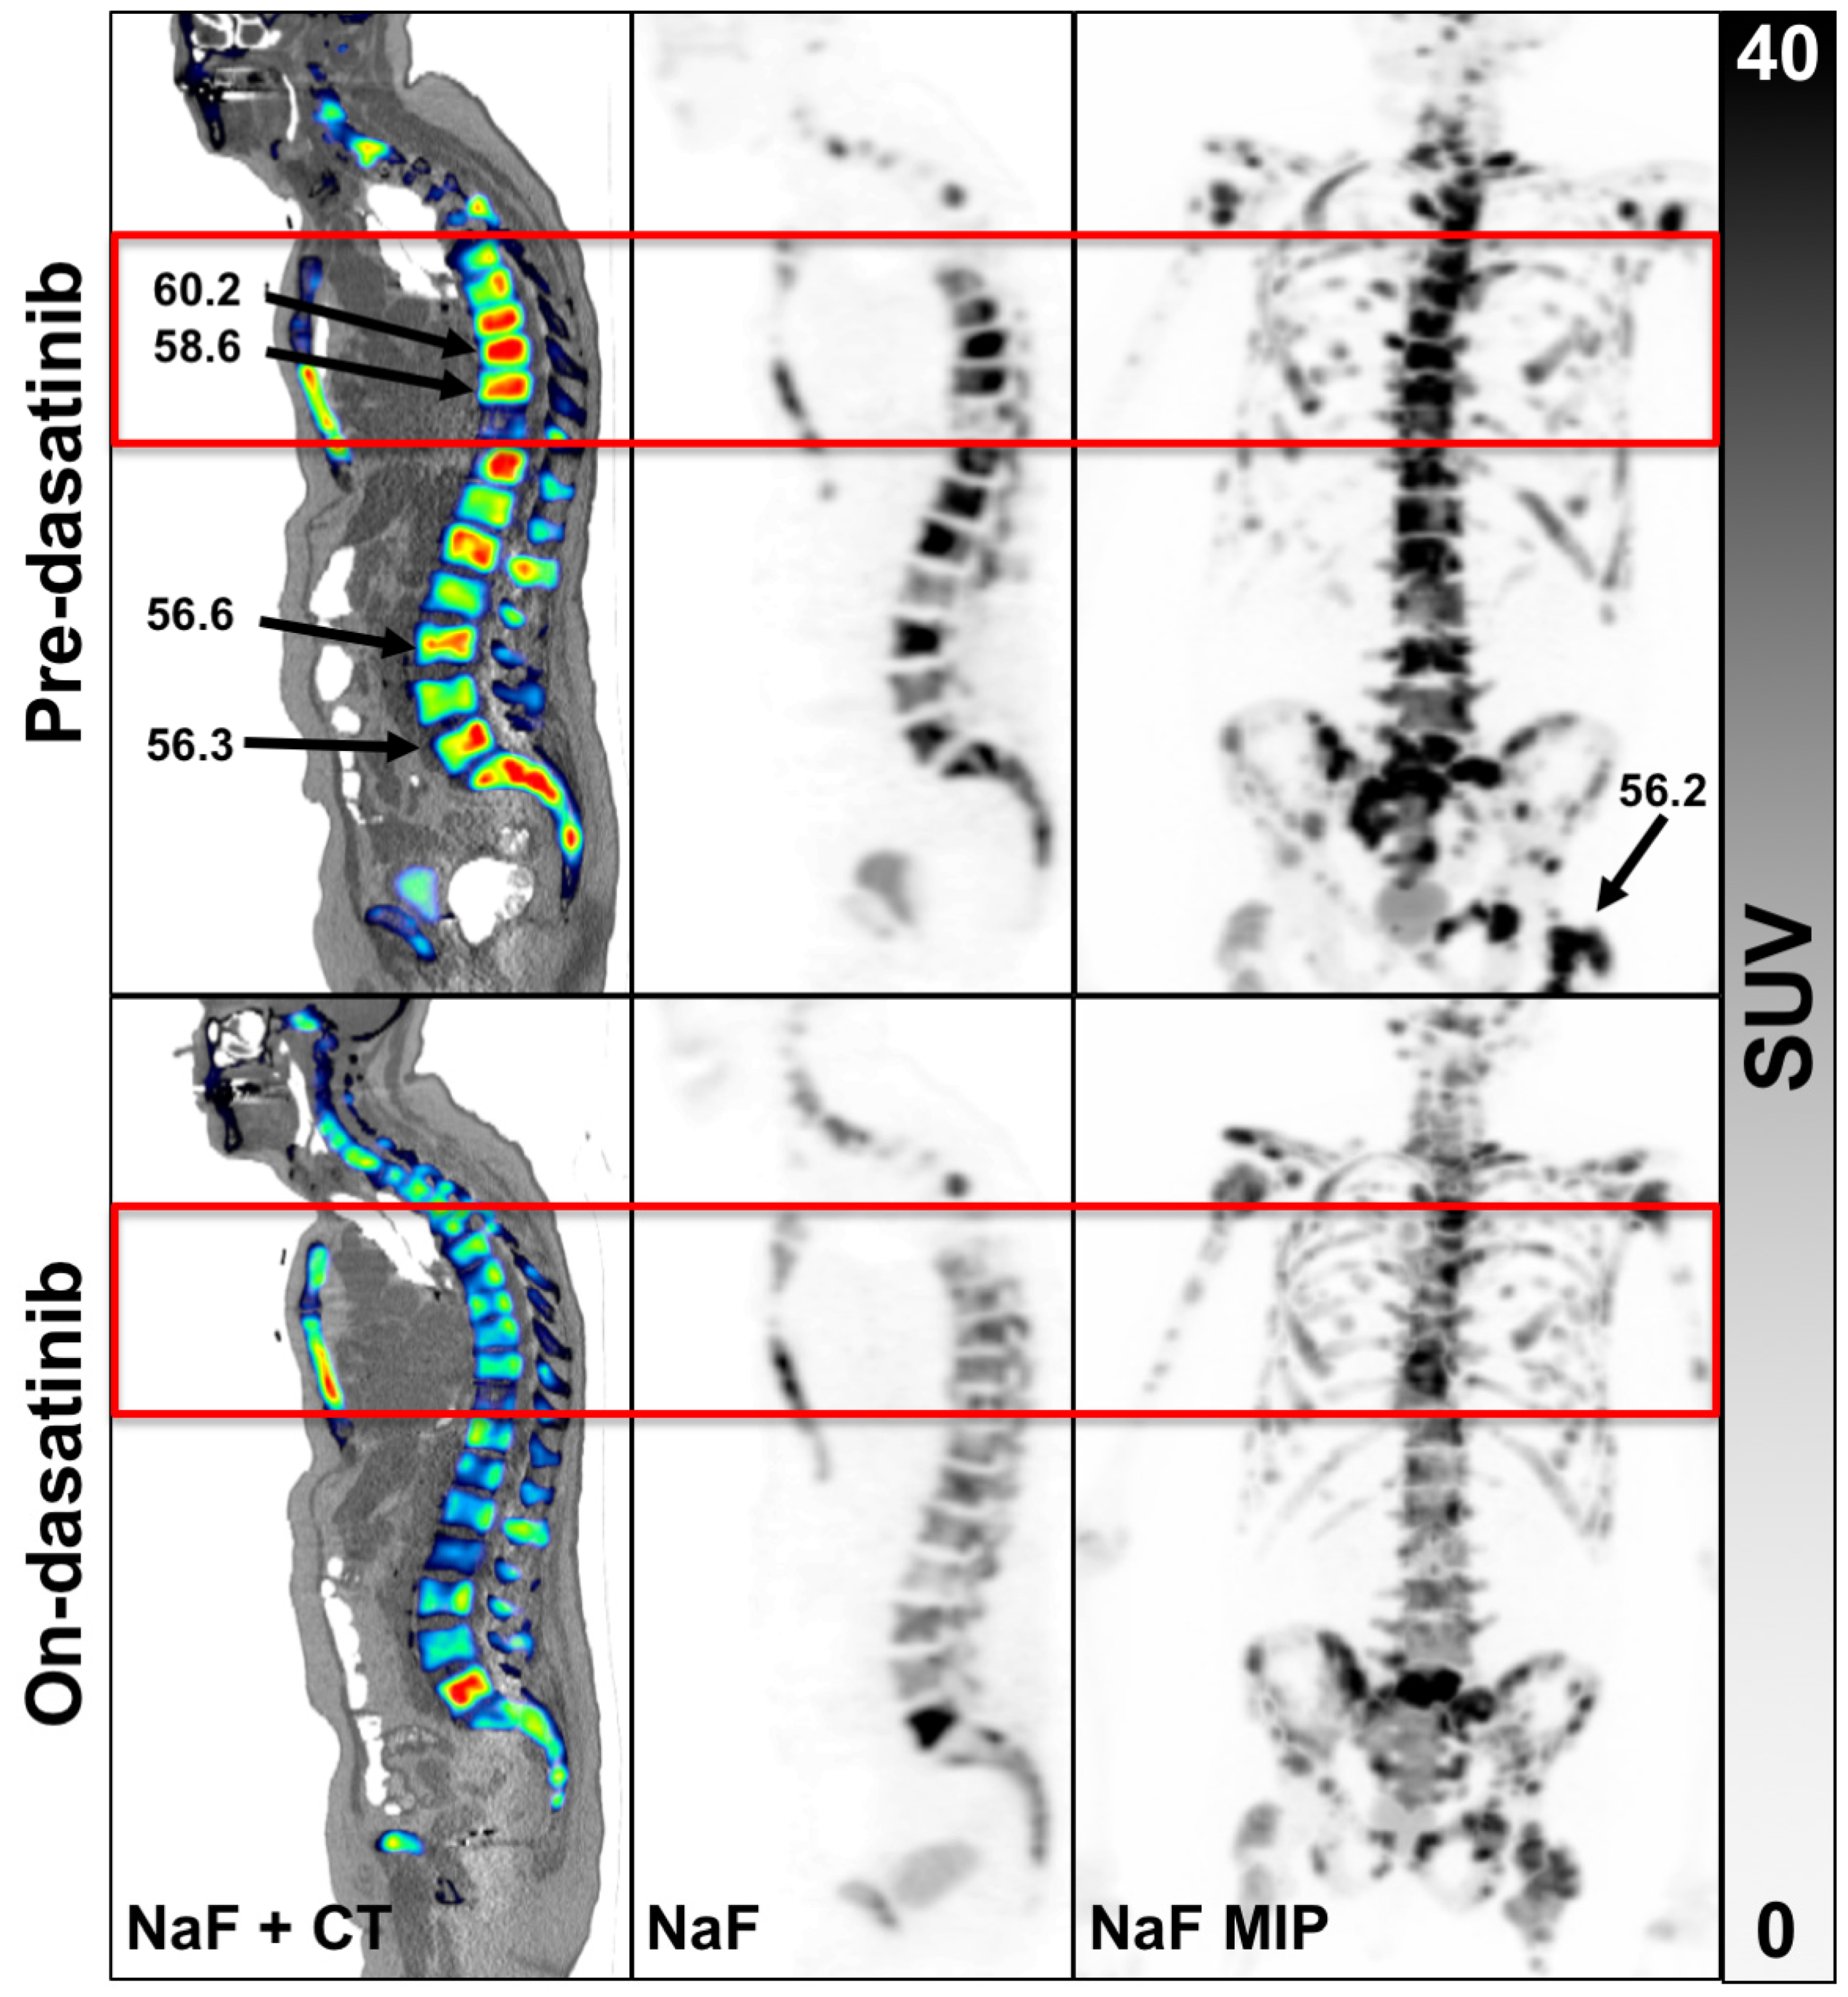
3.2. PET Findings
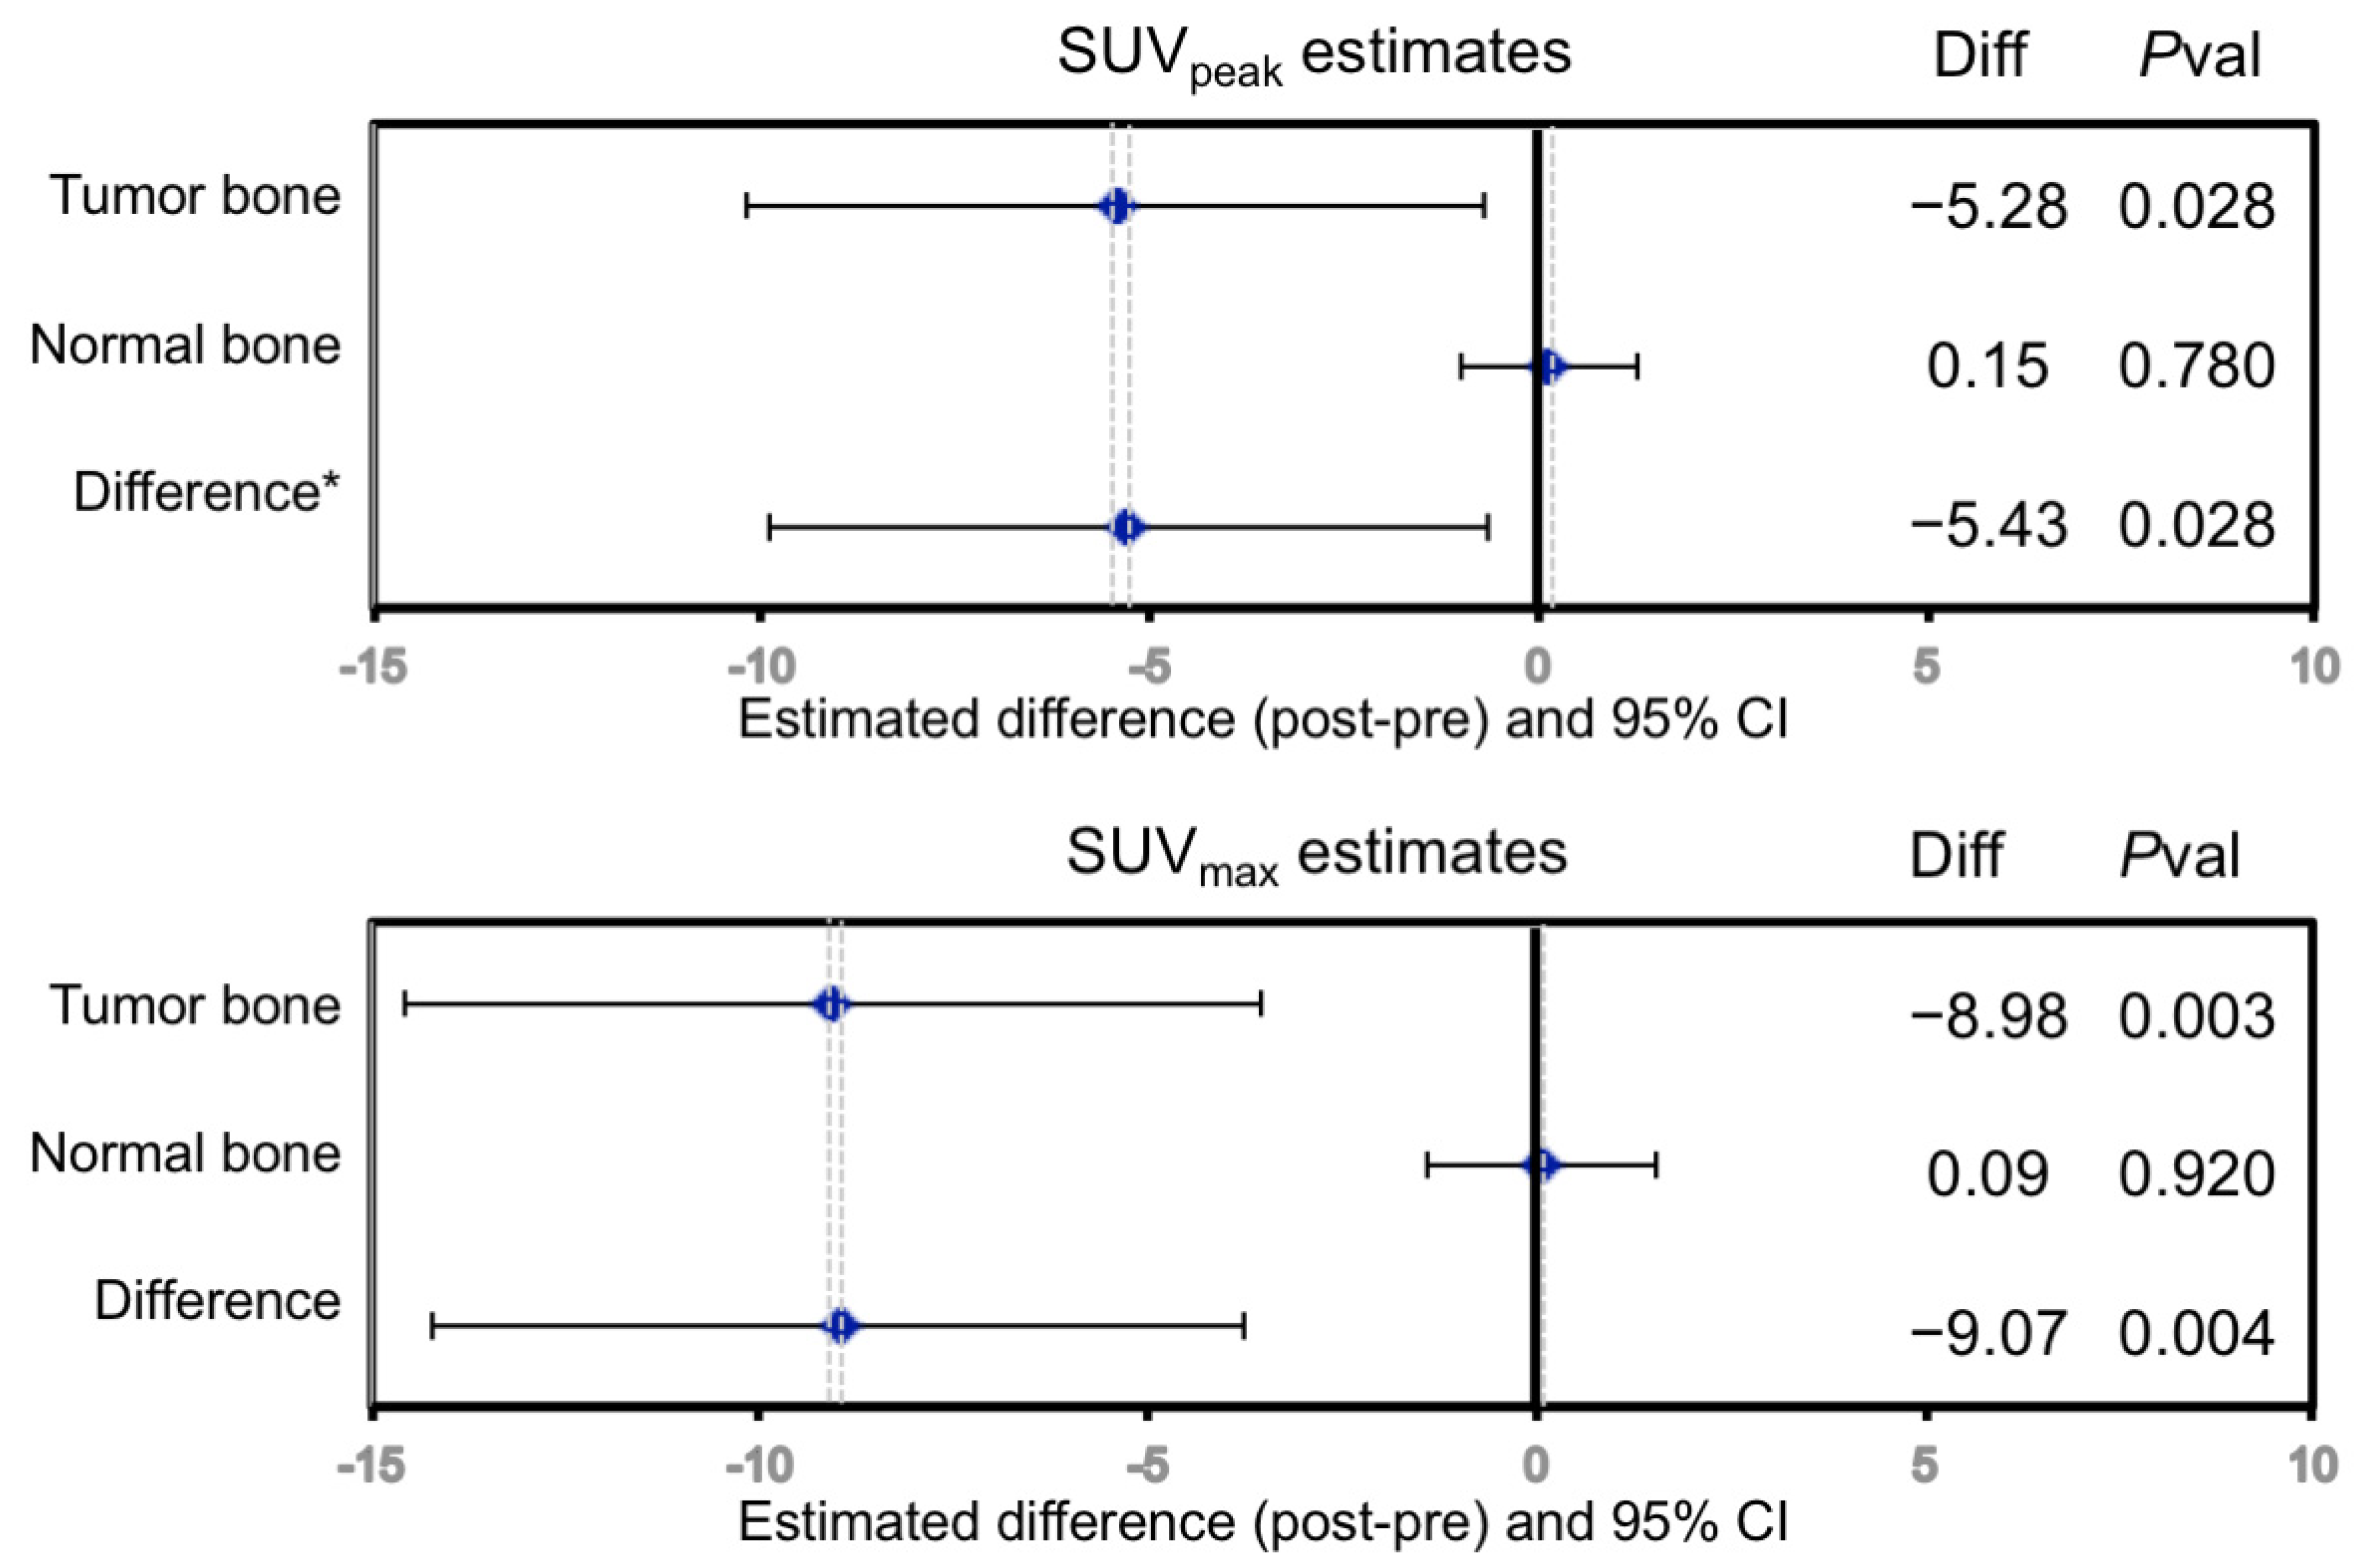
3.3. Statistical Analyses
4. Discussion
5. Conclusions
Supplementary Materials
Author Contributions
Funding
Institutional Review Board Statement
Informed Consent Statement
Data Availability Statement
Acknowledgments
Conflicts of Interest
References
- Coleman, R.E. Metastatic bone disease: Clinical features, pathophysiology and treatment strategies. Cancer Treat Rev. 2001, 27, 165–176. [Google Scholar] [CrossRef]
- Jadvar, H.; Desai, B.; Conti, P.S. Sodium 18F-fluoride PET/CT of bone, joint, and other disorders. Semin. Nucl. Med. 2015, 45, 58–65. [Google Scholar] [CrossRef] [Green Version]
- Harmon, S.A.; Mena, E.; Shih, J.H.; Adler, S.; McKinney, Y.; Bergvall, E.; Mehralivand, S.; Sowalsky, A.G.; Couvillon, A.; Madan, R.A.; et al. A comparison of prostate cancer bone metastases on (18)F-Sodium Fluoride and Prostate Specific Membrane Antigen ((18)F-PSMA) PET/CT: Discordant uptake in the same lesion. Oncotarget 2018, 9, 37676–37688. [Google Scholar] [CrossRef] [Green Version]
- Blake, G.M.; Puri, T.; Siddique, M.; Frost, M.L.; Moore, A.E.B.; Fogelman, I. Site specific measurements of bone formation using [(18)F] sodium fluoride PET/CT. Quant Imaging Med. Surg. 2018, 8, 47–59. [Google Scholar] [CrossRef] [PubMed] [Green Version]
- Even-Sapir, E.; Metser, U.; Flusser, G.; Zuriel, L.; Kollender, Y.; Lerman, H.; Lievshitz, G.; Ron, I.; Mishani, E. Assessment of malignant skeletal disease: Initial experience with 18F-fluoride PET/CT and comparison between 18F-fluoride PET and 18F-fluoride PET/CT. J. Nucl. Med. 2004, 45, 272–278. [Google Scholar] [PubMed]
- Even-Sapir, E.; Metser, U.; Mishani, E.; Lievshitz, G.; Lerman, H.; Leibovitch, I. The detection of bone metastases in patients with high-risk prostate cancer: 99mTc-MDP Planar bone scintigraphy, single- and multi-field-of-view SPECT, 18F-fluoride PET, and 18F-fluoride PET/CT. J. Nucl. Med. 2006, 47, 287–297. [Google Scholar]
- Tateishi, U.; Morita, S.; Taguri, M.; Shizukuishi, K.; Minamimoto, R.; Kawaguchi, M.; Murano, T.; Terauchi, T.; Inoue, T.; Kim, E.E. A meta-analysis of (18)F-Fluoride positron emission tomography for assessment of metastatic bone tumor. Ann. Nucl. Med. 2010, 24, 523–531. [Google Scholar] [CrossRef] [PubMed]
- Yu, E.Y.; Duan, F.; Muzi, M.; Deng, X.; Chin, B.B.; Alumkal, J.J.; Taplin, M.E.; Taub, J.M.; Herman, B.; Higano, C.S.; et al. Castration-resistant prostate cancer bone metastasis response measured by 18F-fluoride PET after treatment with dasatinib and correlation with progression-free survival: Results from American College of Radiology Imaging Network 6687. J. Nucl. Med. 2015, 56, 354–360. [Google Scholar] [CrossRef] [PubMed] [Green Version]
- Scher, H.I.; Halabi, S.; Tannock, I.; Morris, M.; Sternberg, C.N.; Carducci, M.A.; Eisenberger, M.A.; Higano, C.; Bubley, G.J.; Dreicer, R.; et al. Design and end points of clinical trials for patients with progressive prostate cancer and castrate levels of testosterone: Recommendations of the Prostate Cancer Clinical Trials Working Group. J. Clin. Oncol. 2008, 26, 1148–1159. [Google Scholar] [CrossRef]
- Harmon, S.A.; Perk, T.; Lin, C.; Eickhoff, J.; Choyke, P.L.; Dahut, W.L.; Apolo, A.B.; Humm, J.L.; Larson, S.M.; Morris, M.J.; et al. Quantitative Assessment of Early [(18)F]Sodium Fluoride Positron Emission Tomography/Computed Tomography Response to Treatment in Men With Metastatic Prostate Cancer to Bone. J. Clin. Oncol. 2017, 35, 2829–2837. [Google Scholar] [CrossRef]
- Wahl, R.L.; Jacene, H.; Kasamon, Y.; Lodge, M.A. From RECIST to PERCIST: Evolving Considerations for PET response criteria in solid tumors. J. Nucl. Med. 2009, 50 (Suppl. 1), 122s–150s. [Google Scholar] [CrossRef] [Green Version]
- Lin, C.; Bradshaw, T.; Perk, T.; Harmon, S.; Eickhoff, J.; Jallow, N.; Choyke, P.L.; Dahut, W.L.; Larson, S.; Humm, J.L.; et al. Repeatability of Quantitative 18F-NaF PET: A Multicenter Study. J. Nucl. Med. 2016, 57, 1872–1879. [Google Scholar] [CrossRef] [Green Version]
- Kurdziel, K.A.; Shih, J.H.; Apolo, A.B.; Lindenberg, L.; Mena, E.; McKinney, Y.Y.; Adler, S.S.; Turkbey, B.; Dahut, W.; Gulley, J.L.; et al. The kinetics and reproducibility of 18F-sodium fluoride for oncology using current PET camera technology. J. Nucl. Med. 2012, 53, 1175–1184. [Google Scholar] [CrossRef] [Green Version]
- Rohren, E.M.; Etchebehere, E.C.; Araujo, J.C.; Hobbs, B.P.; Swanston, N.M.; Everding, M.; Moody, T.; Macapinlac, H.A. Determination of Skeletal Tumor Burden on 18F-Fluoride PET/CT. J. Nucl. Med. 2015, 56, 1507–1512. [Google Scholar] [CrossRef] [Green Version]
- Kairemo, K.; Milton, D.R.; Etchebehere, E.; Rohren, E.M.; Macapinlac, H.A. Final Outcome of 223Ra-therapy and the Role of 18F-fluoride-PET in Response Evaluation in Metastatic Castration-resistant Prostate Cancer-A Single Institution Experience. Curr. Radiopharm. 2018, 11, 147–152. [Google Scholar] [CrossRef]
- Murray, I.; Chittenden, S.J.; Denis-Bacelar, A.M.; Hindorf, C.; Parker, C.C.; Chua, S.; Flux, G.D. The potential of (223)Ra and (18)F-fluoride imaging to predict bone lesion response to treatment with (223)Ra-dichloride in castration-resistant prostate cancer. Eur. J. Nucl. Med. Mol. Imaging 2017, 44, 1832–1844. [Google Scholar] [CrossRef] [PubMed]
- Liu, G.; Perlman, S.; Perk, T.; Harmon, S.; Simmons, K.; Staab, M.J.; Jeraj, R. Quantitative total bone imaging (QTBI) in patients with metastatic castration-resistant prostate cancer (CRPC) using NaF PET/CT. J. Clin. Oncol. 2015, 33 (Suppl. 7), 180–181. [Google Scholar] [CrossRef]
- Yip, S.; Perk, T.; Jeraj, R. Development and evaluation of an articulated registration algorithm for human skeleton registration. Phys. Med. Biol. 2014, 59, 1485–1499. [Google Scholar] [CrossRef] [PubMed]
- Perk, T.; Chen, S.; Harmon, S.; Lin, C.; Bradshaw, T.; Perlman, S.; Liu, G.; Jeraj, R. A statistically optimized regional thresholding method (SORT) for bone lesion detection in (18)F-NaF PET/CT imaging. Phys. Med. Biol. 2018, 63, 225018. [Google Scholar] [CrossRef]
- Perk, T.; Bradshaw, T.; Chen, S.; Im, H.J.; Cho, S.; Perlman, S.; Liu, G.; Jeraj, R. Automated classification of benign and malignant lesions in (18)F-NaF PET/CT images using machine learning. Phys. Med. Biol. 2018, 63, 225019. [Google Scholar] [CrossRef] [PubMed] [Green Version]
- Efron, B.; Tibshirani, R.J. An Introduction to the Bootstrap; Chapman and Hall: New York, NY, USA, 1993; Volume 57, p. 456. [Google Scholar]
- Beaulieu, S.; Kinahan, P.; Tseng, J.; Dunnwald, L.K.; Schubert, E.K.; Pham, P.; Lewellen, B.; Mankoff, D.A. SUV varies with time after injection in (18)F-FDG PET of breast cancer: Characterization and method to adjust for time differences. J. Nucl. Med. 2003, 44, 1044–1050. [Google Scholar] [PubMed]
- Kurland, B.F.; Muzi, M.; Peterson, L.M.; Doot, R.K.; Wangerin, K.A.; Mankoff, D.A.; Linden, H.M.; Kinahan, P.E. Multicenter Clinical Trials Using 18F-FDG PET to Measure Early Response to Oncologic Therapy: Effects of Injection-to-Acquisition Time Variability on Required Sample Size. J. Nucl. Med. 2016, 57, 226–230. [Google Scholar] [CrossRef] [Green Version]
- Araujo, J.C.; Trudel, G.C.; Saad, F.; Armstrong, A.J.; Yu, E.Y.; Bellmunt, J.; Wilding, G.; McCaffrey, J.; Serrano, S.V.; Matveev, V.B.; et al. Docetaxel and dasatinib or placebo in men with metastatic castration-resistant prostate cancer (READY): A randomised, double-blind phase 3 trial. Lancet Oncol. 2013, 14, 1307–1316. [Google Scholar] [CrossRef] [Green Version]
- Yu, E.Y.; Massard, C.; Gross, M.E.; Carducci, M.A.; Culine, S.; Hudes, G.; Posadas, E.M.; Sternberg, C.N.; Wilding, G.; Trudel, G.C.; et al. Once-daily dasatinib: Expansion of phase II study evaluating safety and efficacy of dasatinib in patients with metastatic castration-resistant prostate cancer. Urology 2011, 77, 1166–1171. [Google Scholar] [CrossRef] [PubMed] [Green Version]
- Wang, Y.; Zhang, H.; Shen, W.; He, P.; Zhou, Z. Effectiveness and tolerability of targeted drugs for the treatment of metastatic castration-resistant prostate cancer: A network meta-analysis of randomized controlled trials. J. Cancer Res. Clin. Oncol. 2018, 144, 1751–1768. [Google Scholar] [CrossRef] [PubMed]
- Lee, Y.C.; Huang, C.F.; Murshed, M.; Chu, K.; Araujo, J.C.; Ye, X.; deCrombrugghe, B.; Yu-Lee, L.Y.; Gallick, G.E.; Lin, S.H. Src family kinase/abl inhibitor dasatinib suppresses proliferation and enhances differentiation of osteoblasts. Oncogene 2010, 29, 3196–3207. [Google Scholar] [CrossRef] [Green Version]
- Coleman, R.E.; Whitaker, K.B.; Moss, D.W.; Mashiter, G.; Fogelman, I.; Rubens, R.D. Biochemical prediction of response of bone metastases to treatment. Br. J. Cancer 1988, 58, 205–210. [Google Scholar] [CrossRef] [Green Version]
- Som, A.; Tu, S.M.; Liu, J.; Wang, X.; Qiao, W.; Logothetis, C.; Corn, P.G. Response in bone turnover markers during therapy predicts overall survival in patients with metastatic prostate cancer: Analysis of three clinical trials. Br. J. Cancer 2012, 107, 1547–1553. [Google Scholar] [CrossRef] [PubMed]
- Yasuda, Y.; Kawamura, K.; Ichikado, K.; Yoshioka, M. Alkaline phosphatase flare phenomenon following epidermal growth factor receptor-tyrosine kinase inhibitor treatment of non-small cell lung cancer: Report of a case and case review. Respir. Med. Case Rep. 2014, 13, 51–53. [Google Scholar] [CrossRef] [Green Version]


| Acronym | Definition |
|---|---|
| Δ | The difference of a parameter between scan 2 and scan 1 |
| 99mTc-MDP | 99mTc-methylene diphosphonate |
| ACRIN | American College of Radiology Imaging Network |
| AR | Androgen receptor |
| BAP | Bone alkaline phosphatase |
| CT | Computed tomography |
| Diff | The difference of a parameter between scan 2 and scan 1 |
| FOV | Field of view, usually axial |
| HR | Hazard ratio |
| index SUVmax | The hottest baseline lesion (index lesion) SUVmax value |
| index SUVpeak | The hottest baseline lesion (index lesion) SUVpeak value |
| K1 | A model parameter estimating transport of the tracer from blood to tissue |
| Ki | Metabolic flux determined from the model parameters (K1 × k3)/(k2 + k3) |
| mCRPC | Metastatic castration resistant prostate cancer |
| MIP | Maximal image projection flattening a 3D image series to 2D |
| MRI | Magnetic resonance imaging |
| NaF | 18F-sodium fluoride |
| OS | Overall survival |
| PCWG2 | Prostate cancer working group 2 |
| PET | Positron emission tomography |
| PFS | Progression free survival |
| Pval | The p-value of a comparison between two arrays of data |
| qSUVmax | QTBI analysis of SUVmax, the maximum uptake in the tumor volume (g/mL) |
| qSUVpeak | QTBI analysis of SUVpeak (g/mL) |
| qSUVtotal | QTBI analysis of total tumor burden, the sum of voxel SUVs in the tumor volume. |
| QTBI | Quantitative total bone imaging analysis software, AIQ Solutions, Madison, WI |
| qVF | QTBI analysis of the tumor volume fraction compared to the total bone volume |
| ROI | Region of interest |
| SE | Standard Error |
| SUV | Standard uptake value |
| SUVmax | The maximum SUV voxel within a tumor (g/mL) |
| SUVmaxavg | The average of up to 5 tumor SUVmax values (g/mL) |
| SUVpeak | The average activity of a 1cc spherical VOI over maximal tumor activity (g/mL) |
| SUVpeakavg | The average of up to 5 tumor SUVpeak values (g/mL) |
| uNTX | Urinary N-telopeptide |
| VOI | Volume of interest |
| WB | Whole-body PET scan |
| Parameters | Baseline | On-Dasatinib | Change | |
|---|---|---|---|---|
| NaF PET | NaF PET | On-Dasatinib | % Change | |
| (SD) | (SD) | (SD) | (p-Value) | |
| † Lesion-level | ||||
| SUVmaxavg (g/mL) | 47.1 | 38.3 | −9.5 | −20.1% |
| (16.7) | (17.0) | (9.6) | (0.001) | |
| SUVpeakavg (g/mL) | 34.5 | 28.8 | −5.8 | −16.2% |
| (13.3) | (13.0) | (8.3) | (0.013) | |
| Index SUVmax (g/mL) | 60.0 | 52.8 | −9.8 | −14.3% |
| (27.3) | (24.9) | (14.7) | (0.025) | |
| Index SUVpeak (g/mL) | 45.8 | 40.3 | −7.1 | −12.9% |
| (21.6) | (18.8) | (11.3) | (0.049) | |
| ‡ Patient-Level | ||||
| qSUVmax (g/mL) | 61.2 | 64.5 | −2.7 | 0.3% |
| (27.4) | (26.1) | (13.9) | (0.569) | |
| qSUVpeak (g/mL) | 37.6 | 37.8 | −0.6 | 2.2% |
| (15.7) | (12.5) | (7.0) | (0.470) | |
| qSUVtotal (g/mL × cc) | 8234 | 7307 | 576 | 30.0% |
| (8914) | (6950) | (1553) | (0.176) | |
| qVF | 9.9 | 8.8 | 0.3 | 25.8% |
| (10.2) | (8.3) | (0.5) | (0.120) |
| PET Parameter | PFS | OS | HR |
|---|---|---|---|
| † Lesion-Level | |||
| SUVmaxavg1 | 0.549 | 0.547 | 1.199 |
| ΔSUVmaxavg | 0.836 | 0.253 | 0.659 |
| SUVpeakavg1 | 0.437 | 0.494 | 1.229 |
| ΔSUVpeakavg | 0.622 | 0.443 | 0.765 |
| Index SUVmax1 | 0.631 | 0.726 | 1.112 |
| Index ΔSUVmax | 0.760 | 0.407 | 0.739 |
| Index SUVpeak1 | 0.630 | 0.678 | 1.128 |
| Index ΔSUVpeak | 0.884 | 0.336 | 0.716 |
| ‡ Patient-Level | |||
| qSUVmax1 | 0.850 | 0.745 | 1.101 |
| ΔqSUVmax | 0.780 | 0.634 | 0.848 |
| qSUVpeak1 | 0.553 | 0.454 | 1.285 |
| ΔqSUVpeak | 0.781 | 0.485 | 0.787 |
| qSUVtotal1 | 0.023 | 0.061 | 1.884 |
| ΔqSUVtotal | 0.889 | 0.260 | 0.668 |
| qVF1 | 0.011 | 0.104 | 1.687 |
| ΔqVF | 0.680 | 0.704 | 0.869 |
| † PET Parameter | PFS | OS | ||||
|---|---|---|---|---|---|---|
| Days | SE | p-Value | HR | SE | p-Value | |
| Lesion-Level | ||||||
| SUVmaxavg1 | 26.5 | 13.1 | 0.043 | 1.135 | 0.856 | 0.875 |
| ΔSUVmaxavg | −2.1 | 21.5 | 0.923 | 0.800 | 1.081 | 0.853 |
| SUVpeakavg1 | 32.0 | 13.5 | 0.018 | 1.421 | 2.770 | 0.879 |
| ΔSUVpeakavg | −10.4 | 21.9 | 0.635 | 1.142 | 3.486 | 0.968 |
| Index SUVmax1 | 17.3 | 14.2 | 0.222 | 1.296 | 2.552 | 0.908 |
| Index ΔSUVmax | 0.7 | 18.3 | 0.971 | 1.196 | 4.299 | 0.964 |
| Index SUVpeak1 | 21.5 | 15.4 | 0.163 | 1.443 | 3.250 | 0.892 |
| Index ΔSUVpeak | −2.4 | 17.4 | 0.888 | 0.874 | 0.874 | 0.885 |
| Patient-Level | ||||||
| qSUVmax1 | 17.6 | 19.2 | 0.359 | 1.321 | 2.759 | 0.908 |
| ΔqSUVmax | 0.9 | 27.2 | 0.972 | 1.341 | 4.186 | 0.935 |
| qSUVpeak1 | 36.9 | 18.3 | 0.044 | 1.646 | 3.191 | 0.840 |
| ΔqSUVpeak | −15.4 | 18.8 | 0.413 | 1.003 | 1.609 | 0.999 |
| qSUVtotal1 | 0.7 | 20.9 | 0.972 | 2.911 | 6.061 | 0.753 |
| ΔqSUVtotal | 14.1 | 25.4 | 0.580 | 0.635 | 1.396 | 0.794 |
| qVF1 | −11.2 | 21.6 | 0.606 | 1.977 | 4.017 | 0.808 |
| ΔqVF | 15.7 | 21.2 | 0.458 | 0.708 | 1.063 | 0.783 |
| † PET Parameter | ΔuNTX | ΔBAP | ΔPSA |
|---|---|---|---|
| ΔSUVmaxavg | 0.31 | −0.41 | 0.08 |
| (0.142) | (0.047) | (0.747) | |
| ΔSUVpeakavg | 0.26 | −0.45 | 0.12 |
| (0.221) | (0.026) | (0.591) | |
| ΔIndex SUVmax | 0.44 | −0.21 | 0.14 |
| (0.037) | (0.331) | (0.518 | |
| ΔIndexSUVpeak | 0.23 | −0.36 | −0.01 |
| (0.270) | (0.080) | (1.00) | |
| ΔqSUVmax | 0.11 | 0.00 | 0.15 |
| (0.630) | (1.000) | (0.545) | |
| ΔqSUVpeak | 0.02 | −0.27 | 0.12 |
| (0.945) | (0.250) | (0.638) | |
| ΔqSUVtotal | −0.17 | 0.03 | 0.42 |
| (0.450) | (0.947) | (0.063) | |
| ΔqVF | 0.17 | −0.06 | 0.39 |
| (0.450) | (0.841) | (0.086) |
Publisher’s Note: MDPI stays neutral with regard to jurisdictional claims in published maps and institutional affiliations. |
© 2021 by the authors. Licensee MDPI, Basel, Switzerland. This article is an open access article distributed under the terms and conditions of the Creative Commons Attribution (CC BY) license (https://creativecommons.org/licenses/by/4.0/).
Share and Cite
Muzi, M.; O’Sullivan, F.; Perk, T.G.; Muzi, J.P.; Mankoff, D.A.; Jeraj, R.; Duan, F.; Yu, E.Y. Whole-Body [18F]-Fluoride PET SUV Imaging to Monitor Response to Dasatinib Therapy in Castration-Resistant Prostate Cancer Bone Metastases: Secondary Results from ACRIN 6687. Tomography 2021, 7, 139-153. https://0-doi-org.brum.beds.ac.uk/10.3390/tomography7020013
Muzi M, O’Sullivan F, Perk TG, Muzi JP, Mankoff DA, Jeraj R, Duan F, Yu EY. Whole-Body [18F]-Fluoride PET SUV Imaging to Monitor Response to Dasatinib Therapy in Castration-Resistant Prostate Cancer Bone Metastases: Secondary Results from ACRIN 6687. Tomography. 2021; 7(2):139-153. https://0-doi-org.brum.beds.ac.uk/10.3390/tomography7020013
Chicago/Turabian StyleMuzi, Mark, Finbarr O’Sullivan, Timothy G. Perk, John P. Muzi, David A. Mankoff, Robert Jeraj, Fenghai Duan, and Evan Y. Yu. 2021. "Whole-Body [18F]-Fluoride PET SUV Imaging to Monitor Response to Dasatinib Therapy in Castration-Resistant Prostate Cancer Bone Metastases: Secondary Results from ACRIN 6687" Tomography 7, no. 2: 139-153. https://0-doi-org.brum.beds.ac.uk/10.3390/tomography7020013