Measuring Online Destination Image, Satisfaction, and Loyalty: Evidence from Barcelona Districts


Senior Lecturer, Department of Business Management, University of Lleida, 25003 Lleida, Catalonia, Spain
Tour. Hosp. 2021, 2(1), 62-78; https://0-doi-org.brum.beds.ac.uk/10.3390/tourhosp2010004
Submission received: 7 December 2020
/
Revised: 8 January 2021
/
Accepted: 9 January 2021
/
Published: 14 January 2021
Abstract
:The relationships between destination image and tourist satisfaction and loyalty have been studied extensively through surveys. This study aims to measure these constructs through big data analytics by going one step further in a line of research undertaken 8 years ago. The data source is content generated by travelers and shared on social media regarding the 10 districts of the city of Barcelona (Catalonia): more than 750,000 online travel reviews (OTRs) hosted on the Airbnb platform. This study also explores a relationship demonstrated by numerous researchers through surveys: the impact of destination image on tourist loyalty through satisfaction. However, the results are not satisfactory due to the great weight of the lodging price variable that unbalances the relationship. For example, the first district in the ranking of cognitive image categories is also the first in the ranking of average scores and of positive feelings and moods. However, the last two districts in the ranking of cognitive categories are the first in the rankings of satisfaction, positive recommendations, and cheaper prices. Additionally, the findings show that the location of the accommodation significantly determines the theme of the OTR narrative. Moreover, the results confirm previous studies on the exaggerated positivity of peer-to-peer accommodation scores: only 0.92% of 15,625 rated properties had negative overall scores.
1. Introduction
During the 2010s, user-generated content (UGC) increased notably, as did its use as a data source for researchers [1] and an information source for prospective customers [2]. UGC is usually disseminated through electronic word-of-mouth communication (eWoM), as users and consumers share their comments and ratings on social media. In the field of travel, tourism, and hospitality, UGC evolved similarly [3,4]. Given that social media content generated by visitors coexists with content generated by destination stakeholders, the data source used in this study consists solely of traveler-generated content (TGC), understood to be narratives, opinions, and ratings shared on social media and based on visitors’ experiences in travelling, sightseeing, entertaining, shopping, lodging, and dining at tourist destinations [5]. According to Marine-Roig [6], this TGC constitutes a new and unsolicited organic image-formation agent in Gartner’s [7] model (p. 15), with penetration into the market through eWoM greater than that of the induced and autonomous sources [8].
Currently, most researchers use online travel reviews (OTRs) hosted on travel-related platforms as sources of TGC [9]. OTRs are characterized by a large diversity of languages, which requires the use of big data analytics [10] and natural language processing (NLP) techniques [5] for study. Most of these studies are dedicated to the accommodation sector; however, research on the contribution of lodging OTRs to online destination image construction is scarce, and even rarer are studies based on peer-to-peer lodging OTRs. Some researchers did not consider accommodation and gastronomy as attributes of the tourist destination [11], but it seems clear that tourists damage the destination image online, for example, when they share on social media that they found insects in their rooms or in their food, and that poor experiences with destination services could lead to an overall poor experience at that destination [12].
The objective of this study is to advance one more step in a line of research that began with a doctoral thesis [13] on destination image analytics through TGC. The most prominent milestones of the research were several publications on the following topics: methods for selecting the most suitable web sources of tourism data [14]; the roles of identity and authenticity in tourist destination image construction [15]; tourism analytics for a special issue on smart destinations [16] and on religious tourism [17,18]; methods for selecting, downloading, arranging, and debugging tourist data from websites [19]; destination attribute assessment versus top countries of residence of bloggers and reviewers [20]; affective component of the destination image [21]; methods to analyze multiscale destinations through spatial coefficients [22]; methods for extracting information from paratextual elements [23] and HTML meta-tags [24] of online travel reviews; analysis of territorial tourist brands segmented by languages and countries [25]; measurement of the gap between projected and perceived images through compositional data analysis [26]; framework approach for measuring images through online travel reviews on sightseeing, lodging, and dining experiences [6]; measurement of online gastronomic images [27]; impact of personal safety on online destination image through natural language processing segmented by language [5]; and destination image analytics for design of experiences and tourist products [28].
Specifically, the purpose of this study is threefold: the first is to build a theoretical and methodological framework to measure online destination images and visitors’ satisfaction and loyalty through TGC categories, metrics and rankings; the second, to introduce into the model, as an element of discussion, the relationships between semiotics and consumer behavior; and, finally, to explore whether the TGC big data allows us to demonstrate complex relationships between the aforementioned constructs. The case study is a common method for testing a conceptual model in the field of tourism and hospitality [29]. In this research, the model is checked by a comparison between districts of the city of Barcelona (Catalonia) through 753,366 Airbnb OTRs collected just before the outbreak of the COVID-19 pandemic [30].
2. Online Destination Image, Satisfaction, and Loyalty Relationships
Disconfirmed prior expectations regarding the performance of a product or service are the concepts that best capture the formation of consumer satisfaction [31,32]. For decades, researchers have shown that customer satisfaction impacts and drives customer loyalty: a satisfied customer is loyal [33] to a greater or lesser degree according to their personal characteristics [34]. For the same constructs online, research findings indicate that e-satisfaction impacts on e-loyalty [35,36]. Regarding online and offline environments, customer loyalty is higher when the service is chosen online than when it is chosen offline, and the relationship between overall satisfaction and loyalty is reinforced even more online [37]. However, the increase in competition on the Internet makes it easier for customers to be less loyal [38], and satisfaction acquires a greater weight in the online satisfaction-loyalty relationship.
In the field of tourism and hospitality, researchers have demonstrated relationships between destination image, satisfaction, and loyalty mostly through surveys. The most commonly used keywords in destination image definitions are ‘impression’, ‘perception’, ‘belief’, and ‘idea’ [39]. For example, Crompton [40] defines an image as ‘the sum of beliefs, ideas, and impressions that a person has of a destination’ (p. 18). Other keywords are ‘expectations’ and ‘feelings’ [41]. According to Chon [42], the (dis)satisfaction of tourists depends to a large extent on their expectations regarding the destination and/or the image perceived prior to the trip, in contrast to their experiences during the visit. The theory adds, as antecedents of satisfaction, the perceptions of price and quality, or the construct ‘value for money’ which consist of a combination of both perceptions [43] as a high price can be both a positive (product quality indicator) and a negative (economic sacrifice) sign. Generally speaking, the degree of destination loyalty is measured by the intention to visit or revisit a tourist destination and by the willingness to recommend it [44]. As used in this article, tourist loyalty is seen in line with the concept of TGC discussed above. That is, tourists’ loyalty is comprised of intention to revisit a place, to buy a tourist product again, to return to a restaurant or accommodation, to reuse a means of transportation, and/or to recommend or have a predisposition to recommend it.
In regards to the data source used in this study, Lam et al. [45] found, through surveys, a significant and positive relationship between UGC platform co-creation experiences and the cognitive and affective components of the image; and that these images impacted traveler overall satisfaction. Through meta-analyses, two teams of researchers [46,47] showed that the impact of destination images on loyalty was significant to a greater or lesser degree taking into account image dimensions and tourists’ loyalty manifestations. That is, considering designative and appraisive images, and intentions to visit or revisit an attraction or a place (behavioral loyalty) and to recommend it (attitudinal loyalty). Using integrated models, several authors [48,49] demonstrated the impact of destination images on tourist loyalty through satisfaction. Other authors [50,51] reached the same conclusion through intermediate constructs.
For the purposes of this study, research by Gim [52] is of great interest; it produced a model to compare three neighboring areas of Korea based on a survey sample of 3756 tourists who had only visited one of the three areas. Based on visitor satisfaction in relation to the destinations’ attributes, Gim calculated overall satisfaction and demonstrated its impact on the post-visit image and on the intention to revisit and recommend the site, as well as the influence of the post-visit image on tourist loyalty. He then found that overall satisfaction has a stronger direct effect on the image than on loyalty, but if its indirect effect is considered, the overall effect on loyalty outweighs that of the image. The tourist destination image model [6], proposed below from a holistic perspective, also considers that the experience lived by tourists is the central element of the hermeneutical circle of image formation and a precedent of tourist satisfaction and loyalty.
2.1. Destination Image Formation
In the 1990s, several authors [7,53,54,55,56,57,58] laid the theoretical and methodological foundations to analyze the formation and modification of tourist destination images. Recently, other authors [59,60] have proposed a holistic image formation framework, distinguishing between induced and organic images [61], between primary and secondary images [62], and between cognitive, affective, and conative images [63], but the model does not consider Gartner’s division [7] between induced, autonomous, and organic tourism image formation agents.
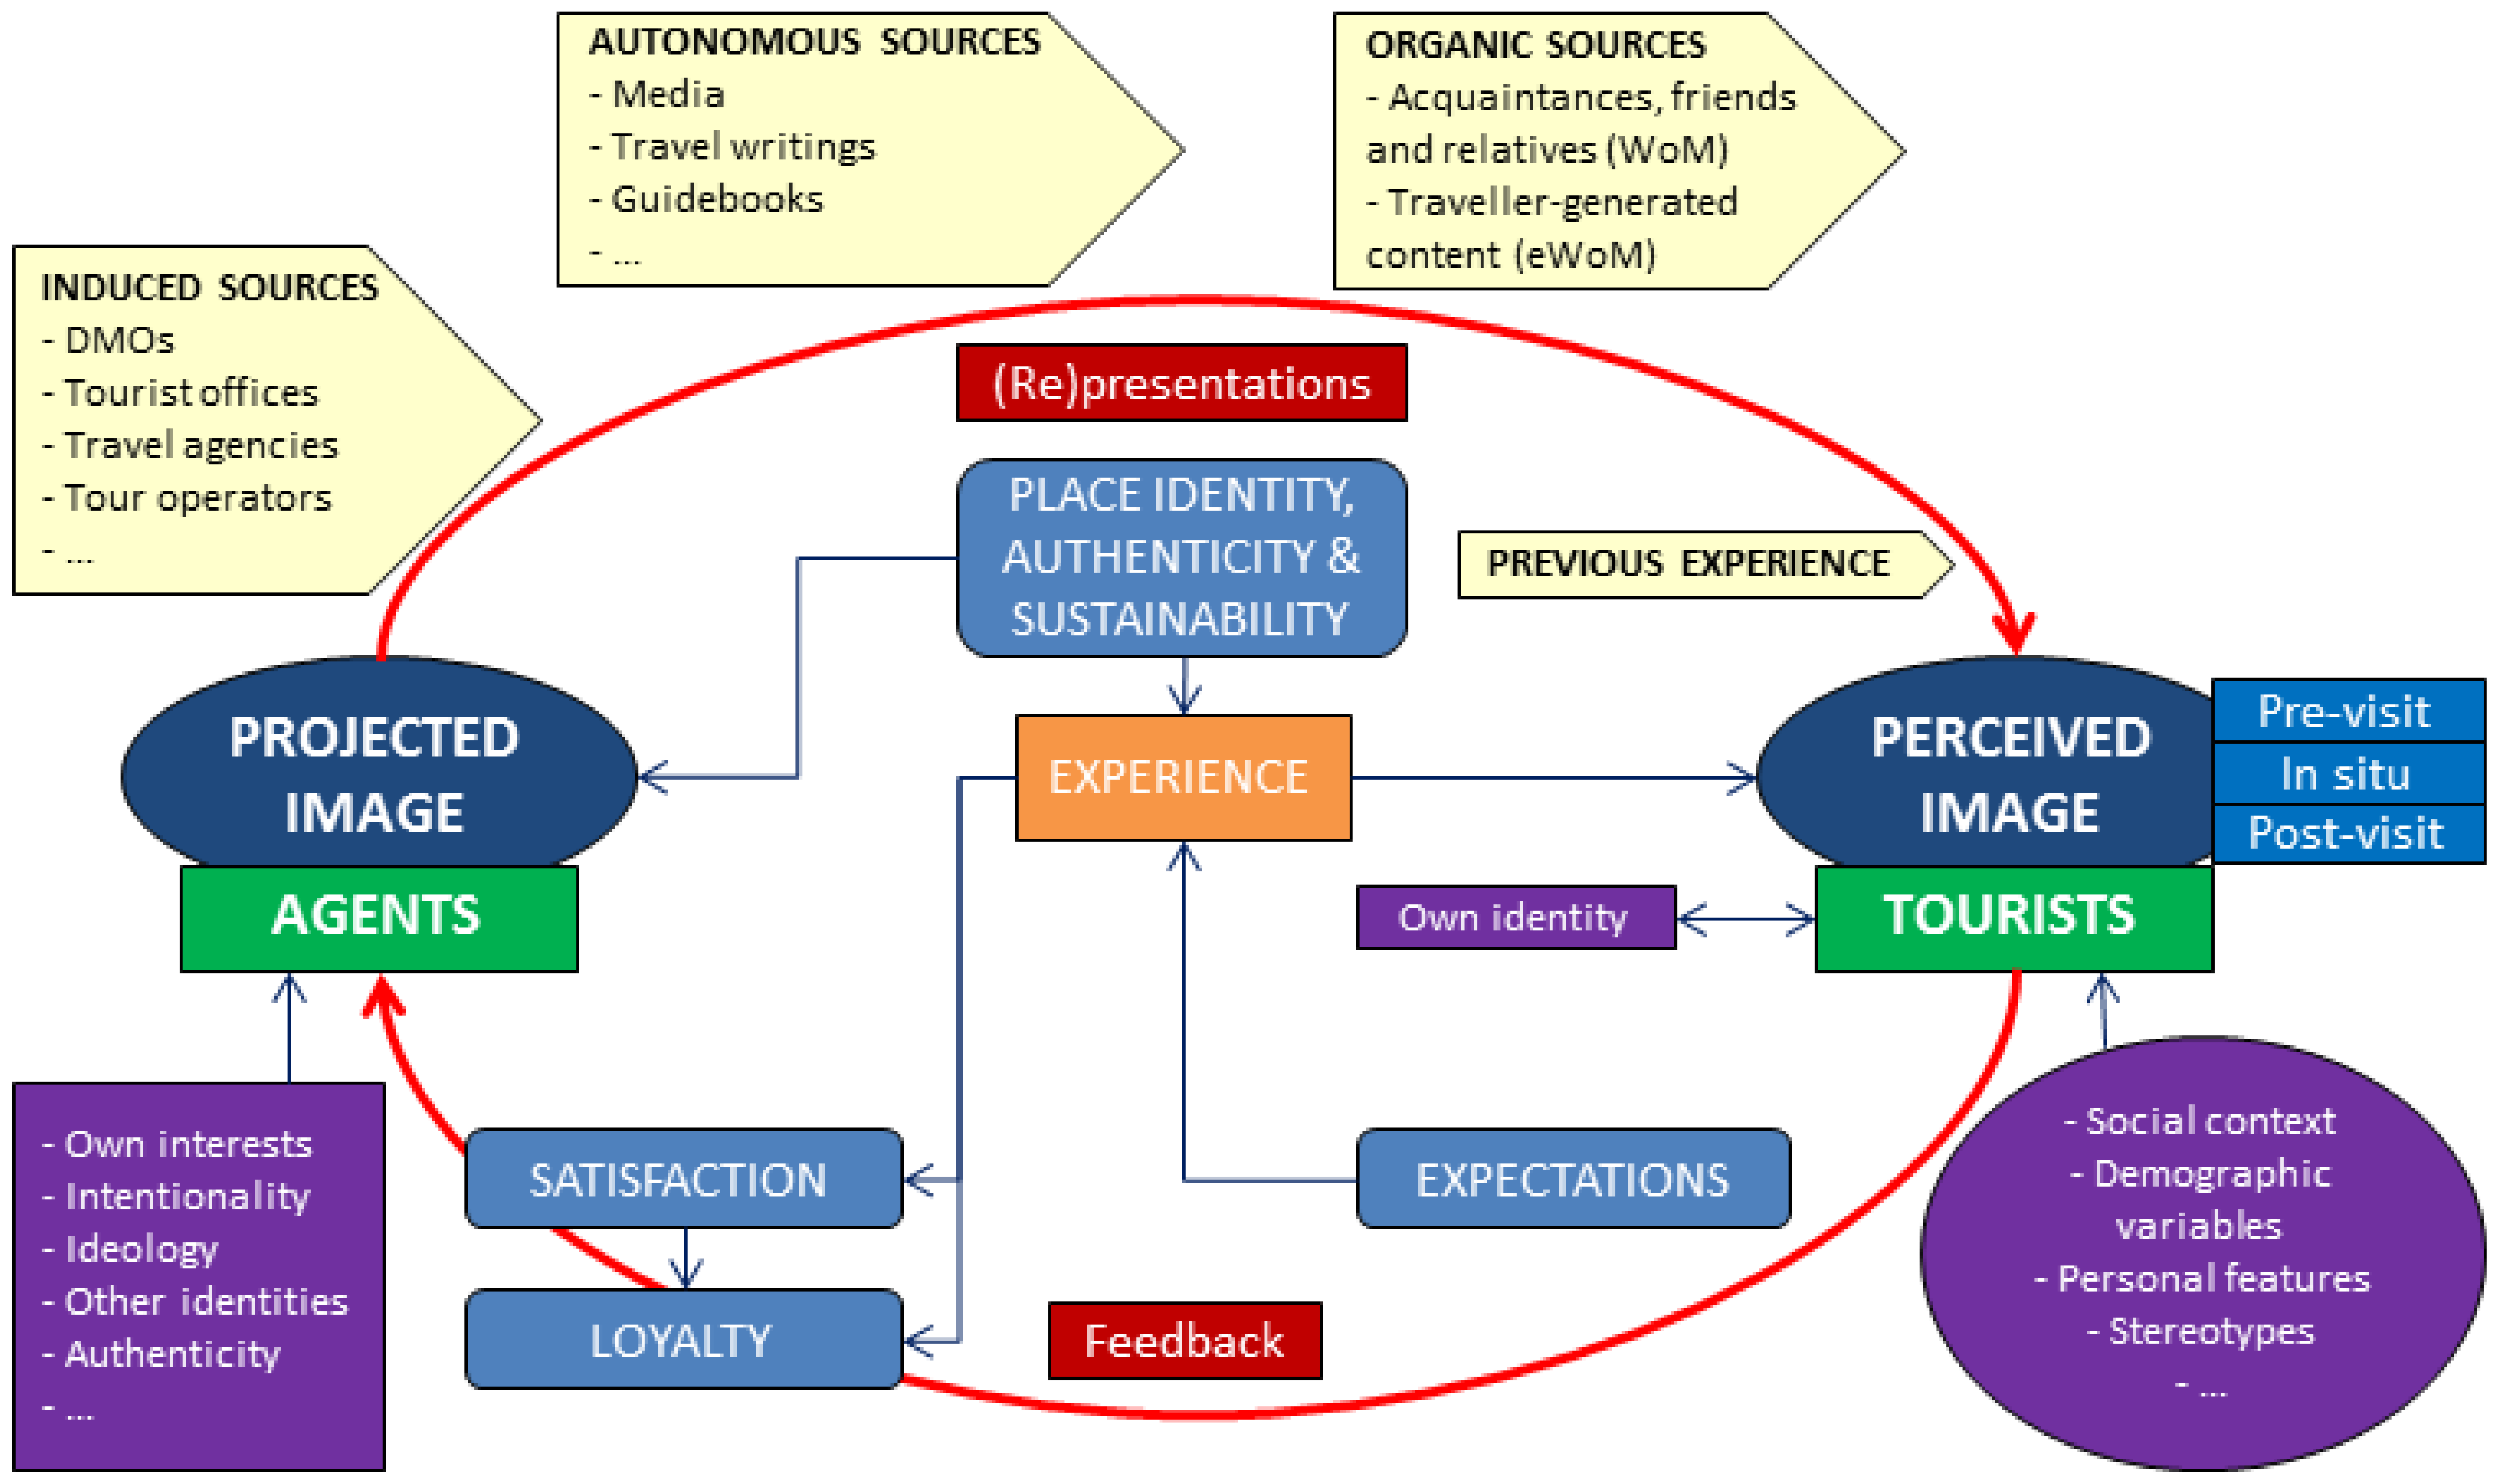
Marine-Roig [6] proposed an all-encompassing model of building tourist images represented by a hermeneutical circle (Figure 1), with the tourist experience in the center. The flow of information circulates from the images projected by the agents (representations) to the images perceived by the tourists, and these perceived images are transmitted (feedback) and become images projected through word-of-mouth communication (WoM) and eWoM. Tourists evaluate their experiences based on expectations derived from the projected (re)presentations of destinations, and there are usually discrepancies between expectations and experiences [8,26,64]. While there are images perceived by tourists before the visit, the experience itself is the essential image source. According to Gim’s study [52], visitors’ satisfaction and loyalty come from experience and are incorporated into the destination image circuit through the feedback arc (Figure 1).
Most authors [65] have used the cognitive-affective model to analyze images and, in some cases, have included a combination of both components, known as overall or global image [56,66]. Many authors, such as Rapoport [63] and Gartner [7], included the conative component of destination images in the previous model, resulting in a tripartite cognitive-affective-conative model.
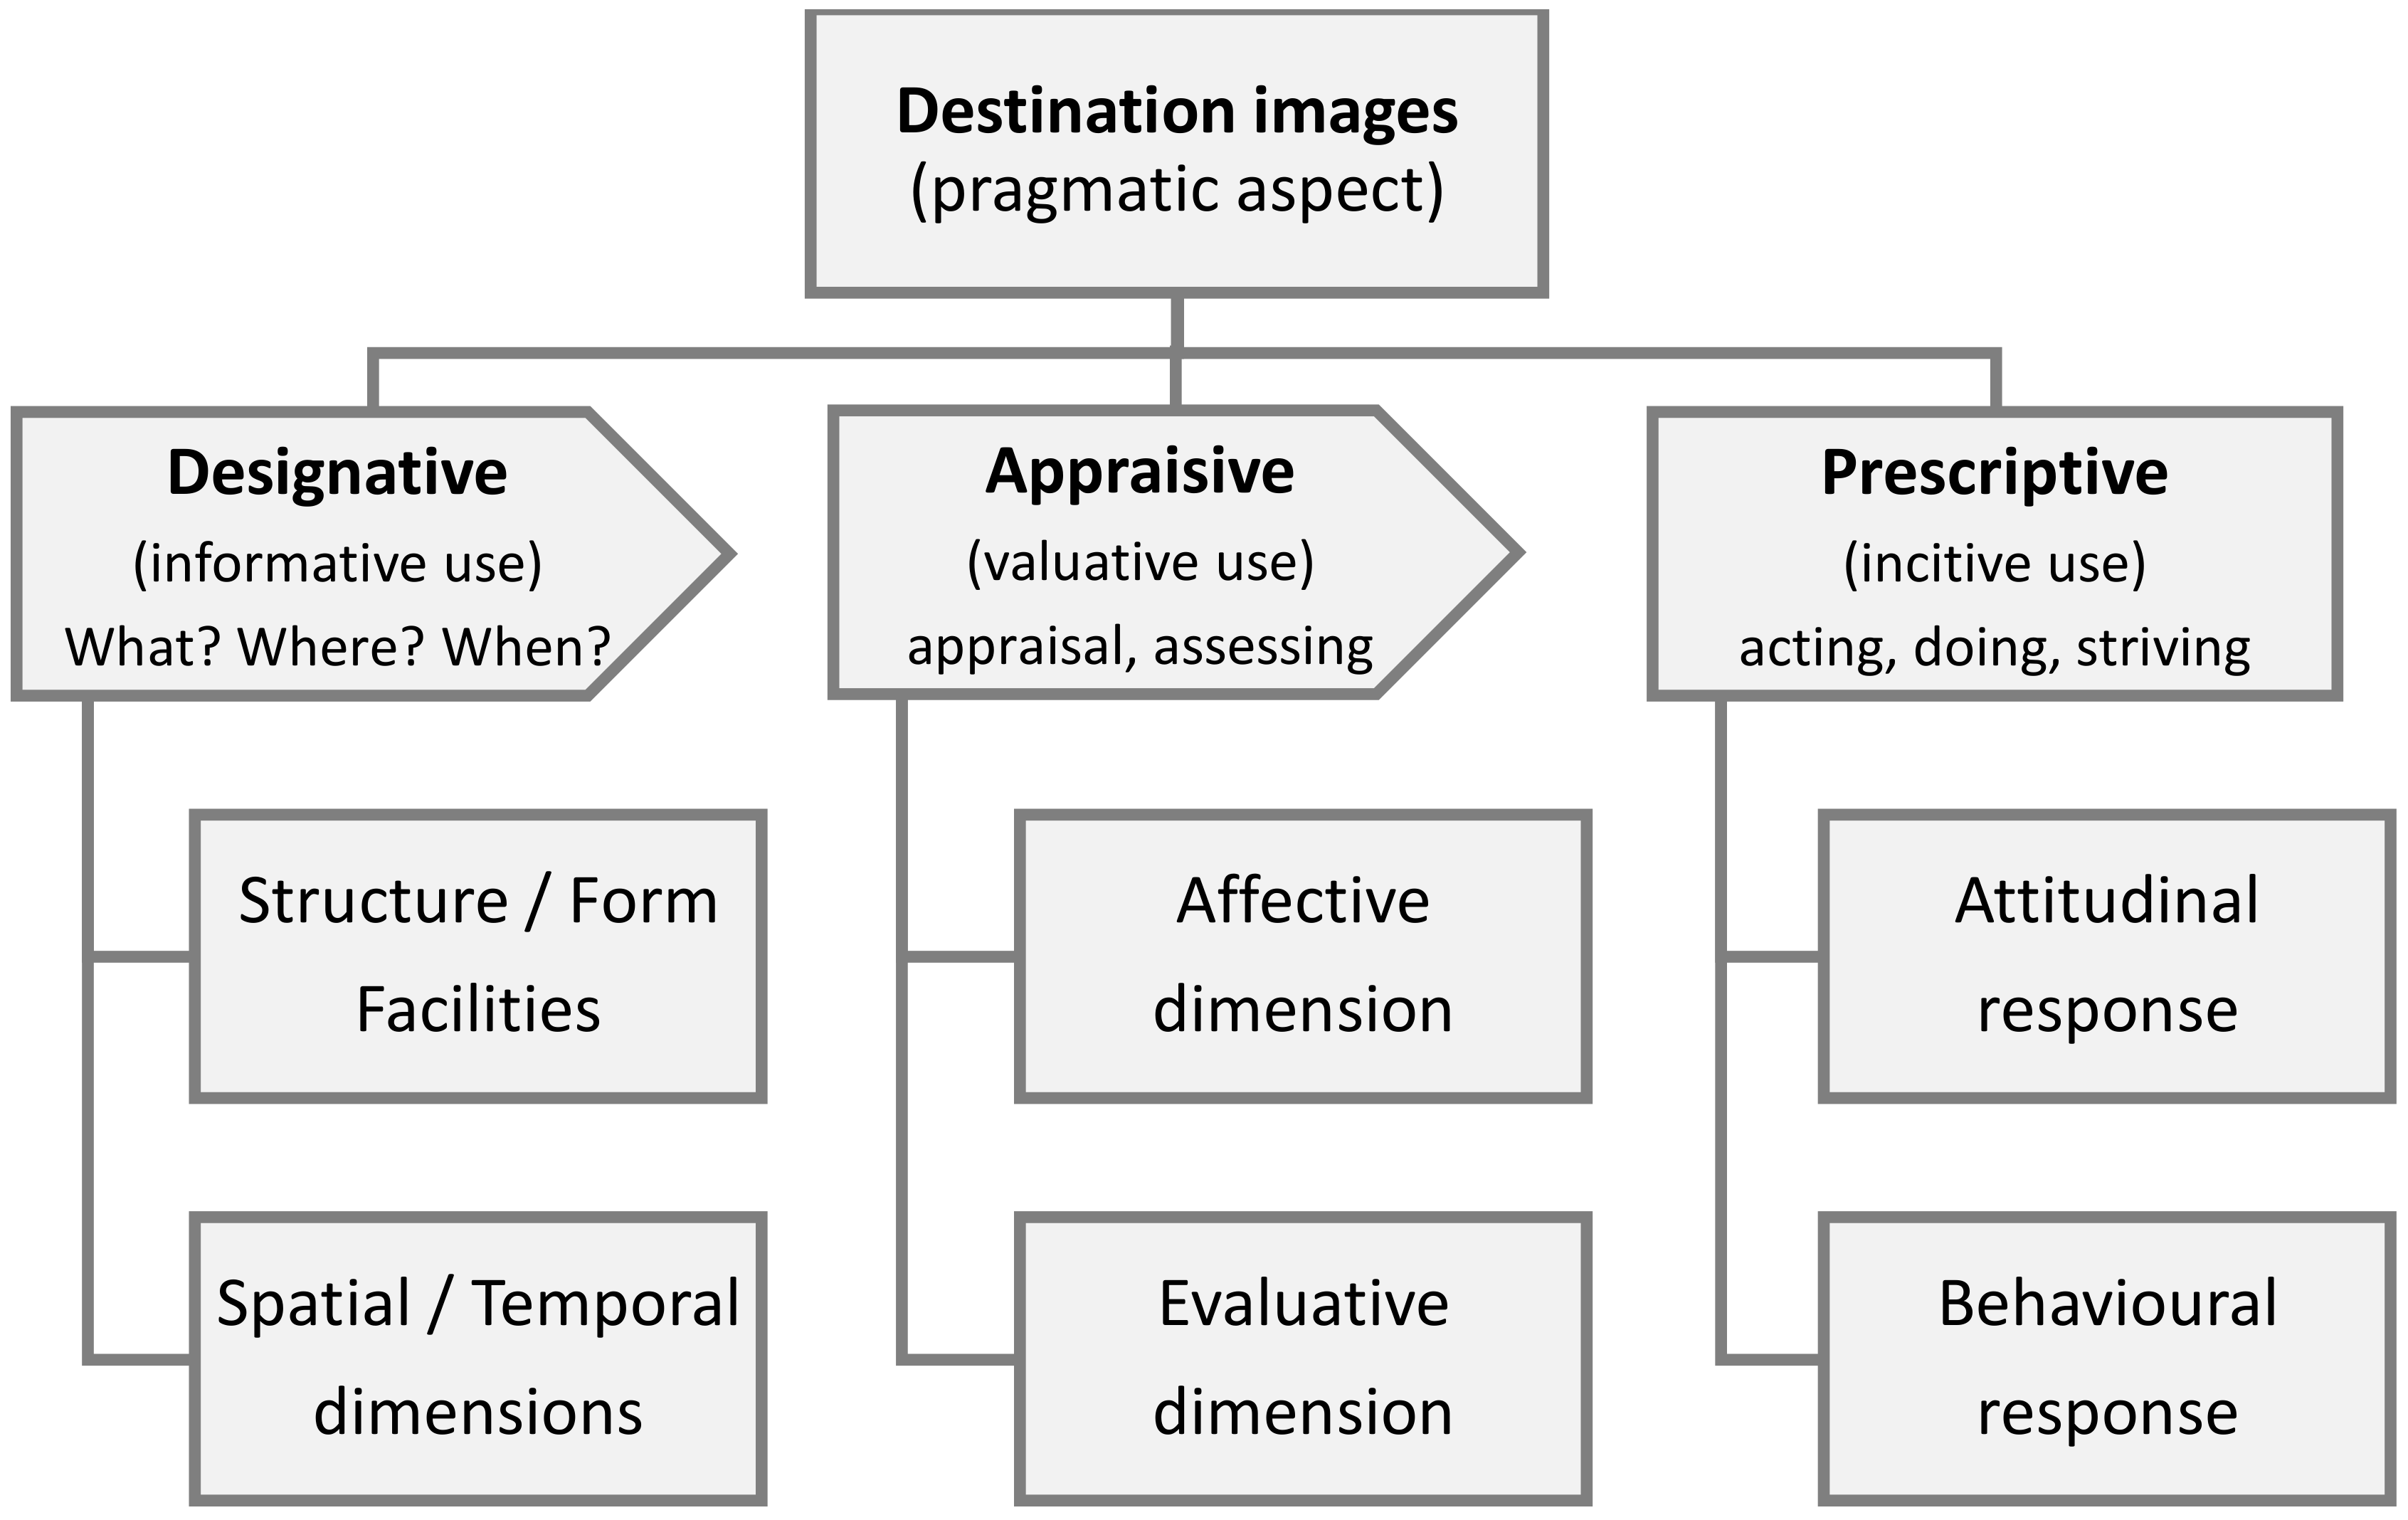
Marine-Roig [6] adapted the model of Pocock et al. [67] to analyse destination images through traveller-generated content. In short, she added ‘facilities’ within the designative dimensions to accommodate the mental pictures that Lynch [68] called relatively abstract, when a visitor identifies a structure such as a museum, hotel, restaurant or station. She also included a temporal dimension [69], and divided the prescriptive aspect (response to previous designative and appraisive stimuli) into two dimensions: attitudinal and behavioral responses. Figure 2 shows an adaptation of the model [6] that includes semiotic nomenclature.
2.2. Destination Image Semiotic Aspects
In his prolific work on signs and behavior, Morris [70,71] distinguished three main types of signs (designative, appraisive, and prescriptive) and three types of use (informative, valuative, and incitive). A fourth type of sign and use (formative-systemic) is not included in this study. Within sign science, Morris defined three subdivisions: syntactics (sign-sign relations), semantics (sign-object relations), and pragmatics (sign-interpretant relations). Each of these subdivisions of semiotics, as a whole, can represent pure semiotics (language to talk about signs), descriptive semiotics (actual signs), and applied semiotics (use of knowledge about signs to achieve various aims). The sign’s semantic dimension (designative-appraisive-prescriptive) is hierarchical [72]: ‘a kind of rudimentary hierarchy of effects in which prescriptive modes of signifying depend on appraisive modes which, in turn, draw upon designative modes’ (p. 6).
Although Mick [73] argued the implications of semiotics for research on consumer behavior, as well as the relationships between brand image, purchase willingness and consumer satisfaction [74], the applications of Morris’s trichotomies in destination image studies are rare: a book [67] and a book chapter [75] on images in urban environments, and an article on country images [76] are highlighted.
The tripartite model (Figure 2) adapted from Marine-Roig [6] represents the semantic and pragmatic aspects of Morris’s signs: designative (informative use), appraisive (valuative use), and prescriptive (incitive use). For example, a summer visitor (temporal dimension) walks along the promenade of a tourist destination (spatial dimension) and observes a building (structure) that he/she identifies as a restaurant (facilities). The visitor thinks the atmosphere is pleasant and that the restaurant has desirable features (affective dimension). He/she decides to enter and consume (behavioral response). Then, the visitor shares his/her gastronomic experience through an online travel review, in which he/she evaluates the experience (evaluative dimension), expresses his/her intention to return to the place (behavioral response), and recommends the restaurant to other visitors (attitudinal response). The model [6] in Figure 2 was recently adapted by Lojo et al. [77] to deduce incongruities between online projected and perceived destination images from textual and visual UGC.
Perussia [78] proposes a method based on semiotics to analyze peculiar types of images or representations, such as the image of a place, through a survey of individuals who have received verbal stimuli. Instead, the semiotic aspects of Figure 2 allow us to deduce a parallelism between the place or destination image and the tourist satisfaction and loyalty constructs as defined above from TGC. The image perceived before the visit derives from the destination’s attributes and attraction factors [40] contemplated in the designative aspect (informative use). The ‘pull motive(s)’ [79] for travelling are associated with those qualities and features of a tourist destination that attract tourists [20,80]. Motivation to travel leads an individual to choose a destination that can bring satisfaction [81]. That is, the image perceived in the designative phase leads to motivation to travel, and the tourist’s motivation generates expectations of satisfaction. The degree of tourist (dis)satisfaction derives from the disconfirmed pre-trip expectations regarding in-situ experiences, and it is measured through the appraisive aspect (valuative use: affective and evaluative dimensions). Finally, the prescriptive aspect (incitive use) responds to the previous stimuli and enables the measurement of the tourist’s loyalty through the attitudinal and behavioral dimensions.
2.3. Perspective of the Conceptual Model as a Whole
The hermeneutical model in Figure 1 is intended to be holistic because it includes the relationships between the main concepts and constructs that influence destination image formation. That is, no single element of the model can represent the overall image. Instead, the semiotic model in Figure 2 is intended to analyze the image using TGC as a data source, but part of the model is useful for such an analysis from induced and autonomous sources; in addition, the entire model can be implemented through surveys. Furthermore, as shown in Figure 1 and explained in the previous paragraph, the semantic and pragmatic aspects of the model in Figure 2 allow us to infer the satisfaction and loyalty of visitors.
3. Materials and Methods
Barcelona, the capital of Catalonia, is a smart city [82] and an outstanding Mediterranean destination [16]. After the Canary Islands, Catalonia is the second-most visited Spanish region by tourists [83]. It is one of the world’s leading cities for hosting international conferences and cruise ships, and the city has been the setting for numerous films [84,85]. According to official figures [86], during 2019 Barcelona hosted 10,242,713 visitors in hotels, guesthouses, and inns (21,593,378 overnight stays) and 3,480,060 visitors in homes for tourist use (11,433,427 overnight stays). The main tourist attraction of the city is the work of the Catalan architect Antoni Gaudí, declared a World Heritage Site [87]. Of the 12,875,386 visits to works of architectural interest during 2019, 10,798,386 were to Gaudí’s masterpieces, highlighting the Basilica of La Sagrada Familia with 4,717,796 visitors and Park Güell with 3,154,349 visitors [86]. As an example of the abundance of TGC available on Barcelona, the Basilica of La Sagrada Familia currently has more than 163,000 OTRs and 119,000 photos shared on TripAdvisor.
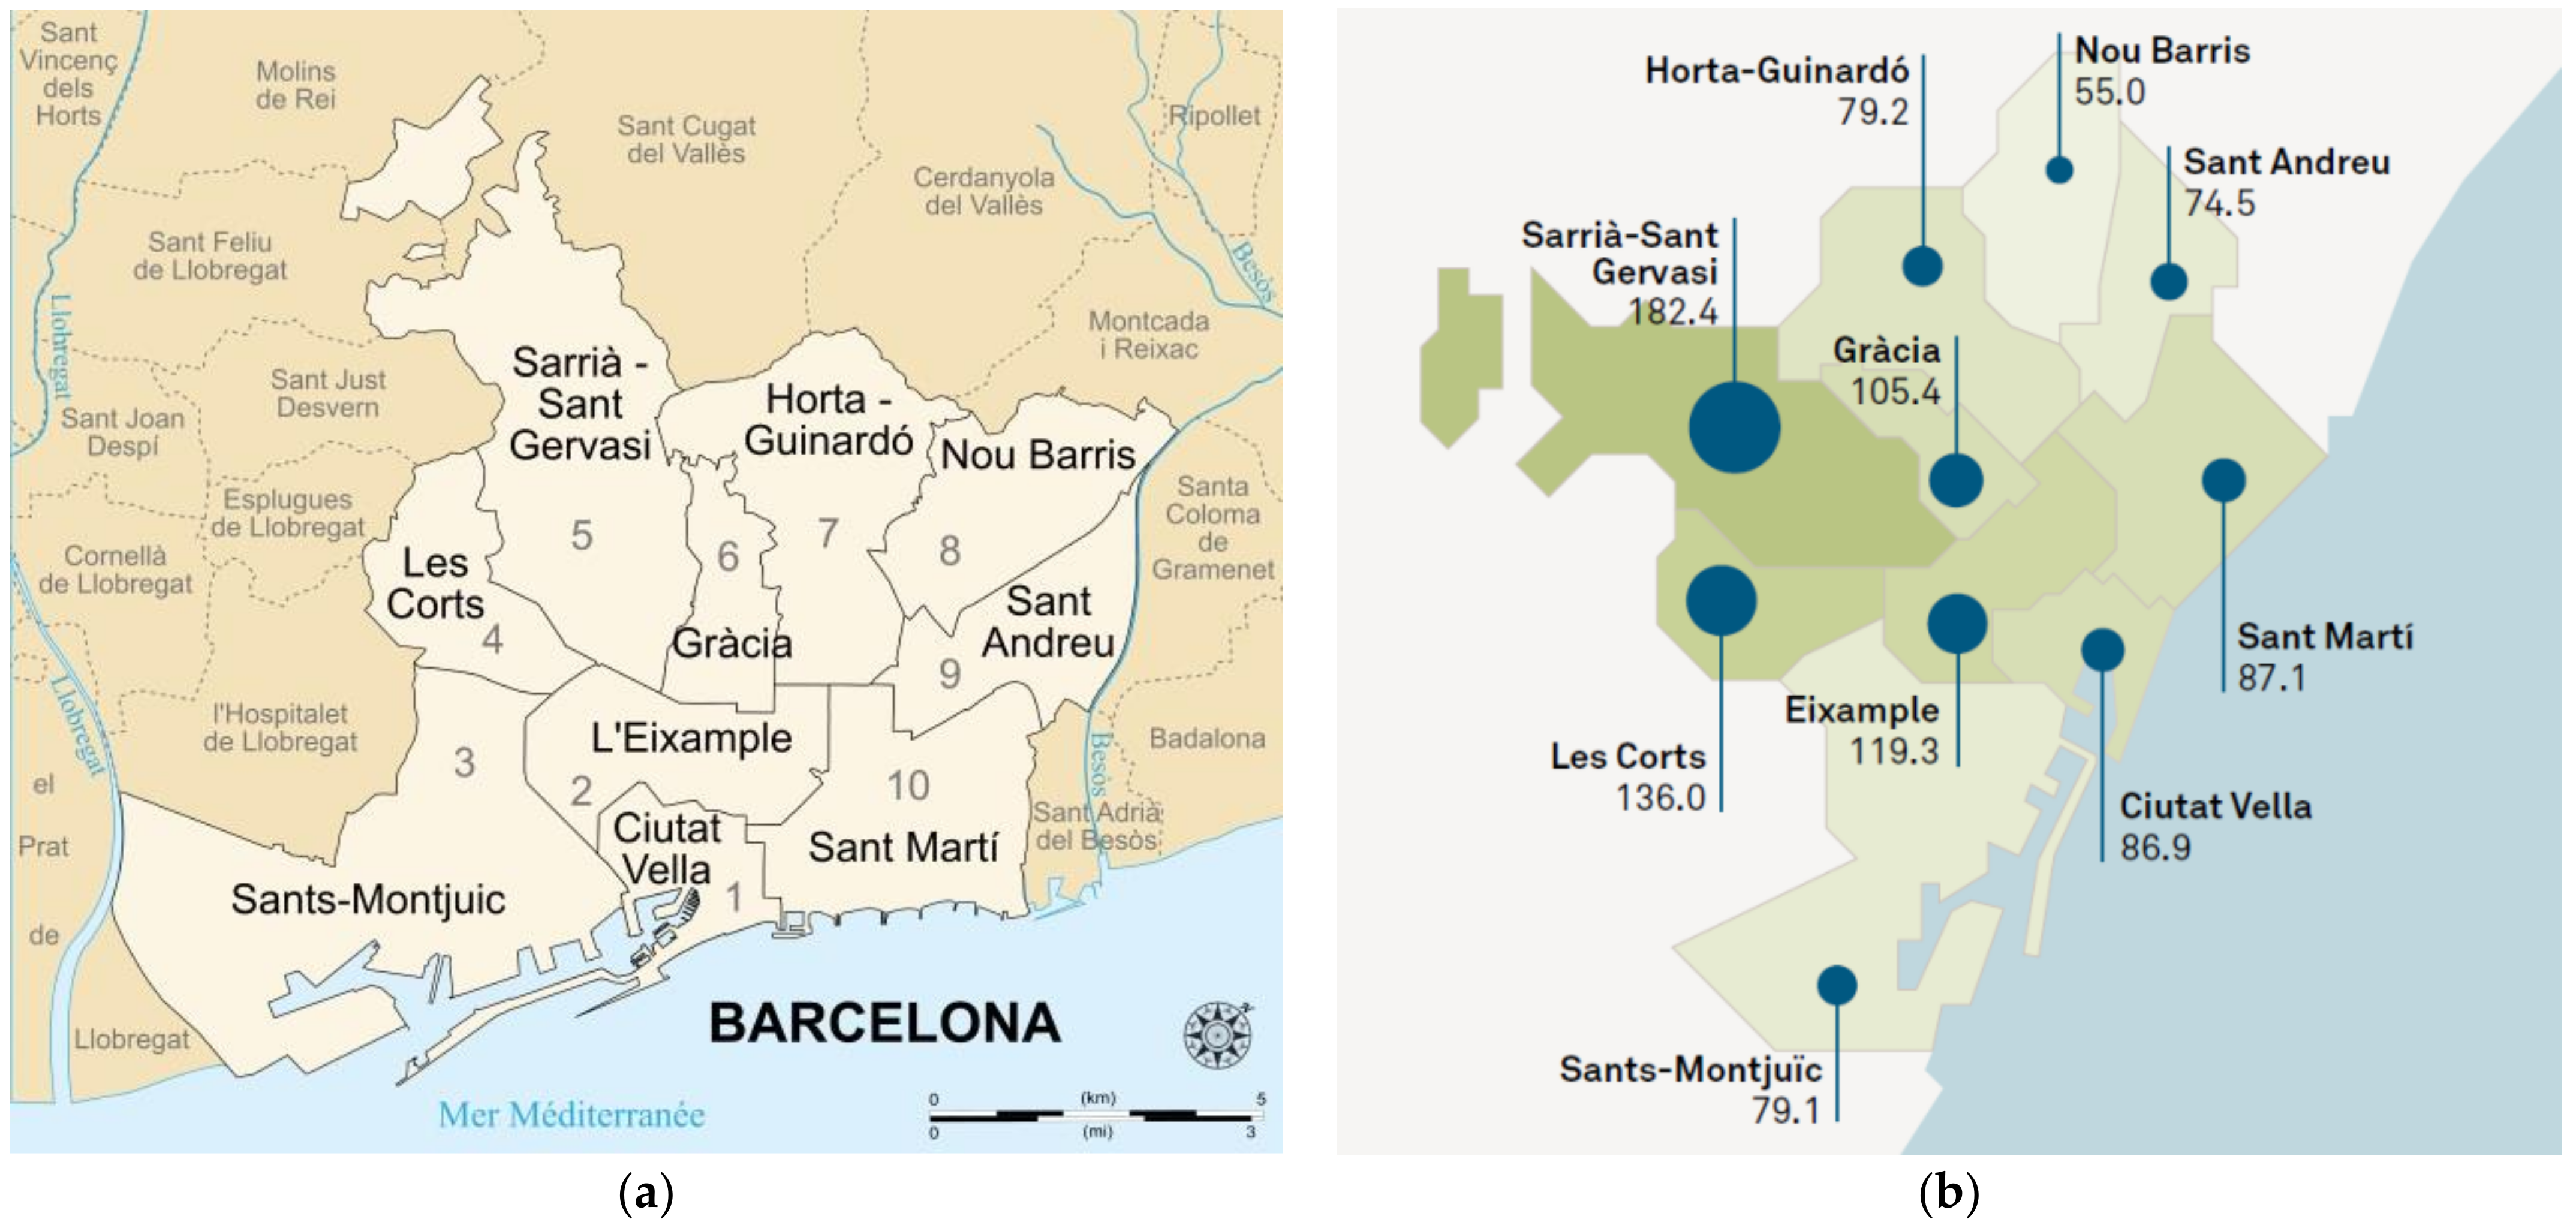
Barcelona is divided into 10 districts (Figure 3a) whose residents have disparate household incomes (Figure 3b). The names and codes of the 10 districts are Ciutat Vella (D01), Eixample (D02), Sants-Montjuïc (D03), Les Corts (D04), Sarrià-Sant Gervasi (D05), Gràcia (D06), Horta-Guinardó (D07), Nou Barris (D08), Sant Andreu (D09), and Sant Martí (D10). This administrative division of Barcelona is suitable for checking the conceptual model because its diverse districts group bordering neighborhoods with similar urban characteristics. The inner districts house Gaudí’s masterworks (D02 and D05). Three of the peripheral districts are on the coast (D01, D03 and D10) and three are bordered by a mountain range (D05, D07 and D08).
For the reasons expressed above, the peer-to-peer (P2P) lodging platform Airbnb is the most suitable TGC source for the case study. Due to its sudden growth in tourist cities [88], Airbnb caught the researchers’ attention in preference to other P2P lodging platforms [89] as its expansion was highly controversial in the press [90]. Regarding other accommodations, P2P lodging has the particularity that the close host-guest relationship influences the image perceived by visitors [91], and the lengths of stay in Barcelona are longer [86]. Much public opinion held that Airbnb contributed to the touristification and gentrification of Barcelona [92] and to inequalities between its neighborhoods [93]. Generally, the content of Airbnb OTRs focuses on assessing the relationship with the host and the accommodation features and amenities. The reviewers add narrations and assessments of other experiences at the tourist destination that they consider noteworthy. These narratives are far more persuasive than rational or logic-based communications [94].
Airbnb OTRs were downloaded from the InsideAirbnb website [95]. This non-profit portal is highly regarded among researchers [96] for the abundance, accuracy, and continuous updating of data collected from the Airbnb platform. After removing internal line breaks that made text processing difficult and segmenting by districts and years, the data set collected on 20 February 2020 is as listed in Table A2 of Appendix A (753,366 OTRs in various languages).
The language recognition method used is based on the naïve Bayes classifier, but the usual patterns (unigrams, bigrams, and trigrams) have little accuracy when it comes to detecting the language of very short sentences, which forces some OTRs to be classified semi-manually. Applying Bayes’ equations [5], the present study used n-grams from one to five extracted from Wikimedia with the help of a natural language detection library [97], significantly increasing the recognition accuracy of OTRs with very few words; even some that had only one word were correctly classified (e.g., Worth). After refining the classification, 497,752 OTRs were found in English (EN), 110,186 in Spanish (ES), 67,892 in French (FR), 28,232 in German (DE), 19,451 in Italian (IT), and 29,853 in other or unclassified languages. The English language represented two-thirds of the data set.
According to Roberts [98], ‘content analysis is a class of techniques for mapping symbolic data into a data matrix suitable for statistical analysis’ (p. 2697). Thematic text analysis produces arrays of counts of words or phrases. In this study, the quantitative content analysis is based on the count and categorization of key terms, where a term is the minimum unit of analysis formed by a keyword (e.g., ‘Barcelona’, ‘great’) or group of consecutive words with their own meaning (e.g., ‘Basilica of La Sagrada Familia’, ‘would not stay anywhere else’) [5]. The Marine-Roig algorithm [6], implemented in Java, was used to count the key terms.
3.1. Categorization
Categories are groupings of key terms with similar meaning or connotation. Categories can be constructed a priori based on some theory, or they can emerge from the most frequent words in the analyzed text [99]. To classify the terms, it is necessary to account for the context of the OTRs. For example, reviewers use ‘amazing’ mostly in a positive sense; however, although ‘mean’ may have a negative polarity, it is not a useful word because it appears in OTRs with multiple meanings.
Categorization allows the extraction of a data matrix from the unstructured text for quantitative analysis of the different aspects and dimensions of the model represented in Figure 2. The measurement of some dimensions does not require categorization because the data set already contains structured information. Thus, the number of OTRs for each Airbnb property is useful in estimating the popularity of P2P accommodations in neighborhoods and districts; the dates of the OTRs inform the temporal dimension; the location of the properties in neighborhoods and districts allows the spatial segmentation of the OTRs; and the ratings of the properties given by reviewers are useful to calculate the evaluative dimension.
3.1.1. Designative Aspect
According to Quan and Wang [100], ‘The tourist experience consists of two dimensions, namely, the dimension of the peak touristic experience and the dimension of the supporting consumer experience’ (p. 300). The ‘peak’ dimension is useful for configuring cognitive categories including ‘food and wine’, although the consumption of food is related to both dimensions [100], and the subcategory ‘Gaudi’ is extracted from ‘tangible heritage’ because the work of this Catalan architect carries considerable weight in Barcelona. The cognitive categories proposed in this study demonstrated their effectiveness by correctly classifying the territorial tourist brands of a multiscale destination using spatial coefficients (location quotient, and localization, specialization and diversification coefficients) applied to TGC from four travel-related websites: TripAdvisor.com, TravelPod.com, TravelBlog.org, and VirtualTourist.com [22]. Categories have a priori key terms and emergent key terms [99]. For example, there is ‘basilica’ in the ‘Tangible heritage’ category and ‘Basilica of La Sagrada Familia’ in the ‘Gaudi work’ subcategory. Then, the algorithm [6] gives priority to compound terms over simple ones. The categories were constructed by two researchers using the ‘intercoder reliability’ method to eliminate ‘intraobserver inconsistencies’ and ‘interobserver disagreements’ by consensus [101]. The process was facilitated by the use of the Marine-Roig algorithm [6] to treat the most frequent key terms as a priority. The a priori key terms are always the same for each language. The emerging key terms depend on each tourist destination. For example, the geographic and attraction names can be downloaded from the official websites or from TripAdvisor, which, in addition to the attractions, activities, restaurants and hotels, has encoded all towns and parishes including those that are uninhabited. Finally, there are nine cognitive categories that configure the designative aspect of the image together with the spatial dimension previously described.
Cognitive categories: sun, sea, sand; nature and landscape; Gaudi work; tangible heritage; intangible heritage; food and wine; urban environment; leisure and recreational activities; sports.
3.1.2. Appraisive Aspect
Evaluative dimension: positive scores (Score+), negative scores (Score−), and average overall score (AvgScore).
Affective dimension: positive feelings and moods (Feeling+) such as ‘great’ and ‘happy’ and negative feelings and moods (Feeling−) such as ’unfriendly’ and ‘disappointed’.
3.1.3. Prescriptive Aspect
Attitudinal response: positive recommendations (Recom+) such as ‘recommended’ and ‘unmissable’ and negative recommendations and warnings (Recom−) such as ‘avoid’ and ‘beware’.
Behavioural response: positive behaviors (Behav+) such as ‘return next time’ and ‘would not stay anywhere else’ and negative behaviors (Behav−) such as ‘not stay again’ and ‘will not be back’.
3.2. Metrics
Because data sets can contain different numbers of reviews, and these can be more or less extensive, the primary metric is the percentage of terms in the category relative to the total number of words in each data set, including stop words. In terms of scores, most portals only allow consumers to rate amenities from one to five (stars or bubbles). Therefore, the metrics are the percentage of positive (from 3 to 5) and negative (less than 3) marks and the average of the overall score of the properties (from 20 to 100).
The secondary metric is the ranking of the metrics defined in the previous paragraph. The global ranking of each aspect or dimension of the model is the aggregate of rankings based on de Borda’s [102] counting function. Assuming that they are rankings of the same length, the candidate receives points by subtracting her position from the final position in each descending ranking and subtracting one point from her position in each ascending ranking. For example, in a ranking of 10 candidates, the second in descending rank receives eight points, and the second in ascending rank receives one point. The sum of the points obtained by each candidate determines the final ranking. In the event of a tie, the function assigns the tied candidates the intermediate position. For example, if there are two candidates tied for points in the second and third positions, the function assigns position 2.5 to both.
3.2.1. Designative Aspect Ranking
Designative ranking is an indicator of the destination image perceived by visitors. It is formed by the aggregation by districts of the nine cognitive rankings.
3.2.2. Appraisive Aspect Ranking
The appraisal ranking represents an indication of visitor satisfaction. It is the result of adding the evaluative and affective rankings, that is, the overall score rankings (Score+, Score−, and AvgScore) and the polarity rankings from the experience narrative (Feeling+ and Feeling−).
3.2.3. Prescriptive Aspect Ranking
The prescriptive ranking represents an indication of visitor loyalty. It is formed by the aggregation of the four rankings seen above (Recom+, Recom−, Behav+, and Behav−).
4. Results and Discussion
Table A1 shows the frequencies of the key terms used to extract the affective dimension metrics (Feeling+ and Feeling−) and the prescriptive aspect metrics (Recom+, Recom−, Behav+, and Behav−) from across the respective categories. The most common key terms are related to accommodation (e.g., ‘apartment’, ‘stay’) and positive feelings (e.g., ‘great’, ‘nice’).
4.1. Designative Aspect
Table A2 shows the spatial and temporal dimensions. The growth in the popularity of P2P accommodation in all districts, as measured by number of OTRs, was steady from 2010 to 2019. It even grew during 2017, when serious events took place in Barcelona (terrorist attack and independence movement) [5]. The most popular districts are D02 and D01, and the least popular are D08 and D09. Residents of districts D08 and D09 have the lowest per capita household income (Figure 3b). The average price of P2P accommodation in this area is the lowest in the city (Table A3). Table A3 (primary metrics) also provides the percentage of key OTR terms in relation to total words for each of the ten districts and the nine cognitive categories.
Table A4 (secondary metrics) shows the ranking of the cognitive categories. District D06 is the first in the ranking, and districts D08 and D09 are the last. The district D01 (Old City) is the first in the ‘tangible heritage’ category. The three coastal districts (D01, D03, and D10) are first in the category ‘sun, sea and sand’ (D10 has the most beaches). The three districts that border the Sierra of Collserola (D05, D07, and D08) are the first in the category ‘nature and landscape’. The district of the Basilica of La Sagrada Familia (D02), the district of Park Güell (D06), and the district bordering both masterpieces (D07) are first in the ‘Gaudi work’ category. The district where the Barcelona Football Club stadium is located (D04) is the first in the ‘sports’ category.
4.2. Appraisive Aspect
Table A5 (primary metrics) provides, for each district, the three metrics of the evaluative dimension and the percentage of terms in relation to the total number of words in the two metrics of the affective dimension. Table 1 (secondary metrics) shows the rankings of the five metrics and the global appraisal ranking by districts. Districts D08 and D09 occupy the first positions in the global appraisal ranking, and district D01 occupies the last position. District D05 occupies the worst position in the ranking of positive and negative feelings.
4.3. Prescriptive Aspect
Table A5 (primary metrics) provides, for each district, the percentage of terms in relation to the total number of words in the two metrics of attitudinal response and in the two metrics of behavioral response. Table 2 (secondary metrics) shows the rankings of the four metrics and both responses by districts. In both rankings, the D05 district occupies the last position. District D05 also ranked worst in positive and negative scores. P2P accommodations in district D05 are the second most expensive in the city (Table A3), and residents of this district have the highest average household income (Figure 3b). Districts D08 and D09 occupy the first positions in the ranking of positive recommendations, and district D01 is the first in the ranking of negative recommendations.
5. Concluding Remarks
There has been much research published on the relationship between destination image and tourist satisfaction and loyalty based on surveys and interviews. Most researchers agree that a random sample of 400 respondents is representative of an indeterminate population, assuming a 5% error rate [103]. For instance, researchers from two previously seen studies used a sample of 345 [48] and 550 [49] respondents, respectively. Although there are drawbacks to the surveys, they have the advantage that the questions can be directed to accept or refute the hypotheses raised.
Big data analytics also have drawbacks, but they have the advantage of being able to process a large number of opinions. For example, this case study used about 750,000 OTRs in several languages for a single city, of which about 500,000 OTRs were in English. In addition, the narratives, opinions, and qualifications in the OTRs are spontaneous because they are not conditioned by the items on a questionnaire. However, some authors have shown that, in the case of P2P lodging, the close host-guest relationship can affect the image perceived by visitors [91] and the ratings they give the accommodation [104].
5.1. Theoretical Implications
Scholars have been studying the image of the tourist destination for more than 50 years [42,65], but research that uses UGC as a data source is scarce. The vast majority of studies have utilized, as a theoretical basis, variations of the cognitive-affective-conative model inherited from the field of psychology. The main contribution of this study to the body of knowledge of tourism and hospitality is to introduce an element of discussion based on semantic and pragmatic semiotic aspects of images. However, the semiotic treatment of images introduced in this article is superficial compared to the profuse amount of literature on semiotics and consumer behaviour that has been published in other fields.
5.2. Methodological Implications
This research explored whether reviews shared by guests on Airbnb are useful for analyzing complex relationships between constructs such as image, satisfaction, and loyalty. Bearing in mind that the designative aspect represents the image, that the appraisive aspect represents satisfaction, and that the prescriptive aspect represents loyalty, the results partially confirmed these relationships. For example, the first district (D06) in the ranking of cognitive attributes is the first in overall average score and in positive feelings. However, the last two districts (D08 and D09) in the cognitive ranking are the first in the appraisal ranking and first in the ranking of positive recommendations. In this case, the property price attribute [105] probably carried more weight in the relationship than the other aspects of the tourist destination since both districts are first in the ranking of the cheapest average prices (Table A3). It may also be for this reason that district D05 has the worst scores and occupies the last position in the prescriptive rankings as it occupies the second position in the most expensive average price ranking (Table A3) and the first in residents’ household income ranking (Figure 3b).
5.3. Managerial Implications
The findings of this research confirm the high confidence asserted by other authors [104] in the scores given by reviewers to the hosts and amenities of the P2P accommodations. Additionally, they show that the location of the P2P accommodation significantly conditions the subject of the narratives. This result confirms the usefulness of TGC to classify the zones of a tourist destination as, with similar cognitive categories, Marine-Roig and Anton Clavé [22] classified the territorial tourist brands of a multiscale region using spatial coefficients. The proposed cognitive and polarity categories, metrics and rankings can be useful for analyzing other aspects of tourist destinations from any TGC source. The TGC allows segmenting the data by space and time [106] and, thus, the ability to analyze the temporal evolution of tourism in any area from the demand-side perspective. It is also possible to segment according to languages and countries of origin of visitors. With the categories built and the data arranged, destination management and marketing organizations (DMOs) can acquire results almost in real time.
5.4. Limitations and Future Work
The results represent an initial approximation for studying and understanding the relationship between destination image, satisfaction and loyalty using TGC big data analytics, but more corroboration would be necessary in future studies using regression analysis or experimental designs. Furthermore, the OTRs on lodging experiences do not seem adequate for a study of this type. Surely, OTRs on sightseeing experiences would provide more consistent results.
The main limitation in this case study is the impossibility of constructing exhaustive categories out of more than 31 million words in English due to misspellings and grammatical varieties in different Anglo-speaking regions, as well as the polysemy of words and phrases aggravated by informal uses of the language, irony, sarcasm, etc. The categories must be mutually exclusive and can only contain univocal terms in the context of the TGC. Future work should refine the categories and apply the proposed framework to other tourist destinations and other TGC sources, such as OTRs hosted on TripAdvisor [107,108], to compare results and find whether it is possible to confirm the relationships between destination image and visitor satisfaction and loyalty demonstrated by other researchers through surveys.
Funding
This research was funded by Spanish Ministry of Science, Innovation and Universities, [Grant id.: ECO2017-88984-R] within the project: Tourism analysis of peer-to-peer accommodation platforms in Spanish destinations through user-generated content and other online sources (TURCOLAB).
Institutional Review Board Statement
Not applicable.
Informed Consent Statement
Not applicable.
Data Availability Statement
Data sharing not applicable.
Acknowledgments
The author gratefully acknowledges the constructive comments of the four anonymous reviewers who helped significantly improve the article.
Conflicts of Interest
The author declares no conflict of interest.
Appendix A

Table A1.
Ranking of the most frequent key terms.
| Rank | D01 | D02 | D03 | D04 | D05 | D06 | D07 | D08 | D09 | D10 |
|---|---|---|---|---|---|---|---|---|---|---|
| 1 | great | apartment | apartment | apartment | apartment | apartment | place | place | place | apartment |
| 2 | location | great | great | great | great | great | great | great | great | great |
| 3 | apartment | location | place | place | place | place | apartment | metro | nice | place |
| 4 | place | place | location | stay | stay | location | stay | nice | apartment | nice |
| 5 | stay | stay | stay | nice | nice | stay | nice | stay | metro | stay |
| 6 | barcelona | barcelona | nice | barcelona | barcelona | barcelona | clean | clean | clean | location |
| 7 | host | clean | clean | metro | location | nice | barcelona | apartment | stay | clean |
| 8 | room | nice | barcelona | clean | clean | clean | metro | host | host | barcelona |
| 9 | clean | host | host | location | host | host | host | barcelona | room | host |
| 10 | nice | good | good | host | good | good | good | room | barcelona | beach |
| 11 | good | recommend | metro | good | recommend | metro | room | good | good | metro |
| 12 | perfect | room | close | recommend | really | recommend | location | really | really | good |
| 13 | recommend | perfect | recommend | really | metro | really | really | recommend | recommend | close |
| 14 | really | really | really | close | room | close | recommend | close | location | really |
| 15 | close | metro | room | room | close | perfect | close | location | close | recommend |
| 16 | time | close | perfect | helpful | perfect | restaurants | helpful | helpful | station | room |
| 17 | helpful | comfortable | walk | station | comfortable | comfortable | time | station | friendly | walk |
| 18 | comfortable | time | time | time | time | time | city | time | helpful | perfect |
| 19 | friendly | helpful | helpful | perfect | city | room | walk | city | comfortable | helpful |
| 20 | just | easy | easy | alba | easy | neighborhood | comfortable | friendly | easy | time |
| 21 | amazing | walk | flat | easy | beautiful | walk | friendly | comfortable | time | comfortable |
| 22 | located | just | comfortable | comfortable | lovely | area | house | house | home | flat |
Source: 497,752 Barcelona Airbnb online travel reviews in English prior to the COVID-19 pandemic outbreak [30].
Table A2.
Online travel reviews per district and year.
| Code | District | 2010 | 2011 | 2012 | 2013 | 2014 | 2015 | 2016 | 2017 | 2018 | 2019 | 2020 | Total |
|---|---|---|---|---|---|---|---|---|---|---|---|---|---|
| D01 | Ciutat Vella | 4 | 131 | 551 | 1444 | 3692 | 8184 | 15,114 | 23,759 | 33,278 | 55,762 | 5817 | 147,736 |
| D02 | Eixample | 0 | 91 | 843 | 3355 | 9463 | 19,220 | 31,703 | 48,034 | 66,750 | 101,689 | 9992 | 291,140 |
| D03 | Sants-Montjuïc | 0 | 21 | 206 | 900 | 3395 | 7331 | 12,298 | 17,953 | 23,816 | 33,659 | 2666 | 102,245 |
| D04 | Les Corts | 2 | 28 | 22 | 260 | 624 | 1026 | 1668 | 2228 | 2777 | 3651 | 297 | 12,583 |
| D05 | Sarrià-Sant Gervasi | 0 | 5 | 36 | 171 | 676 | 1305 | 2224 | 3160 | 4431 | 7263 | 558 | 19,829 |
| D06 | Gràcia | 3 | 33 | 151 | 920 | 2923 | 5434 | 9199 | 12,990 | 16,106 | 22,801 | 1866 | 72,426 |
| D07 | Horta-Guinardó | 0 | 2 | 22 | 122 | 443 | 971 | 2208 | 3622 | 5073 | 7417 | 557 | 20,437 |
| D08 | Nou Barris | 0 | 0 | 0 | 15 | 122 | 260 | 544 | 1001 | 1258 | 2289 | 125 | 5614 |
| D09 | Sant Andreu | 0 | 1 | 0 | 30 | 140 | 255 | 683 | 1185 | 1748 | 3160 | 195 | 7397 |
| D10 | Sant Martí | 0 | 75 | 187 | 665 | 2200 | 4878 | 8100 | 12,105 | 17,172 | 26,503 | 2074 | 73,959 |
| BCN | Total | 9 | 387 | 2018 | 7882 | 23,678 | 48,864 | 83,741 | 126,037 | 172,409 | 264,194 | 24,147 | 753,366 |
Source: Barcelona (BCN) Airbnb online travel reviews in all languages prior to the COVID-19 pandemic outbreak [30].
Table A3.
Average price per night and property; online travel review count; word count; and percentage of terms in cognitive categories.
Table A3.
Average price per night and property; online travel review count; word count; and percentage of terms in cognitive categories.
| Code | Average Price | OTR Count | Word Count | Food Wine | Gaudi Work | Intangible Heritage | Leisure | Nature Landscape | Sports | Sun, Sea, and Sand | Tangible Heritage | Urban Environ. |
|---|---|---|---|---|---|---|---|---|---|---|---|---|
| D01 | 70.59 | 102,736 | 6,353,881 | 0.36176 | 0.01516 | 0.00497 | 0.23287 | 0.01961 | 0.01073 | 0.18929 | 0.22983 | 0.78517 |
| D02 | 117.79 | 196,937 | 12,408,142 | 0.42889 | 0.18912 | 0.00382 | 0.20283 | 0.01675 | 0.01256 | 0.07342 | 0.20406 | 0.71572 |
| D03 | 79.34 | 65,091 | 4,116,791 | 0.46274 | 0.01110 | 0.00911 | 0.25143 | 0.02468 | 0.03911 | 0.10022 | 0.18371 | 0.91314 |
| D04 | 70.22 | 7544 | 486,475 | 0.38440 | 0.01295 | 0.00576 | 0.18213 | 0.01274 | 0.27422 | 0.05283 | 0.12868 | 1.05370 |
| D05 | 107.78 | 12,218 | 831,648 | 0.42422 | 0.04172 | 0.00337 | 0.28425 | 0.07383 | 0.01491 | 0.07864 | 0.18866 | 0.89822 |
| D06 | 96.69 | 47,859 | 3,254,567 | 0.48870 | 0.16110 | 0.00596 | 0.30880 | 0.03189 | 0.01235 | 0.07660 | 0.16414 | 1.12528 |
| D07 | 62.95 | 11,338 | 727,456 | 0.27754 | 0.21376 | 0.00247 | 0.16523 | 0.06007 | 0.00907 | 0.09018 | 0.15685 | 0.89339 |
| D08 | 39.29 | 2929 | 182,724 | 0.35409 | 0.01806 | 0.00219 | 0.20742 | 0.05418 | 0.01040 | 0.06075 | 0.07005 | 1.07047 |
| D09 | 45.15 | 3721 | 220,145 | 0.30389 | 0.04951 | 0.00136 | 0.17171 | 0.01499 | 0.01226 | 0.06905 | 0.08313 | 1.00525 |
| D10 | 82.40 | 47,379 | 2,961,172 | 0.38316 | 0.07045 | 0.00290 | 0.21491 | 0.01962 | 0.02077 | 0.63272 | 0.14231 | 0.91791 |
| BCN | Total | 497,752 | 31,543,001 | 3.86939 | 0.78293 | 0.04191 | 2.22158 | 0.32836 | 0.41638 | 1.42370 | 1.55142 | 9.37825 |
Source: Barcelona (BCN) Airbnb online travel reviews in English prior to the COVID-19 pandemic outbreak [30].
Table A4.
Ranking of cognitive categories from Table A3.
Table A4.
Ranking of cognitive categories from Table A3.
| Code | District | Food Wine | Gaudi Work | Intangible Heritage | Leisure | Nature Landscape | Sports | Sun, Sea, and Sand | Tangible Heritage | Urban Environ. | Rank |
|---|---|---|---|---|---|---|---|---|---|---|---|
| D01 | Ciutat Vella | 7 | 8 | 4 | 4 | 7 | 8 | 2 | 1 | 9 | 6 |
| D02 | Eixample | 3 | 2 | 5 | 7 | 8 | 5 | 7 | 2 | 10 | 5 |
| D03 | Sants-Montjuïc | 2 | 10 | 1 | 3 | 5 | 2 | 3 | 4 | 6 | 2 |
| D04 | Les Corts | 5 | 9 | 3 | 8 | 10 | 1 | 10 | 8 | 3 | 7 |
| D05 | Sarrià-Sant Gervasi | 4 | 6 | 6 | 2 | 1 | 4 | 5 | 3 | 7 | 3 |
| D06 | Gràcia | 1 | 3 | 2 | 1 | 4 | 6 | 6 | 5 | 1 | 1 |
| D07 | Horta-Guinardó | 10 | 1 | 8 | 10 | 2 | 10 | 4 | 6 | 8 | 8 |
| D08 | Nou Barris | 8 | 7 | 9 | 6 | 3 | 9 | 9 | 10 | 2 | 9 |
| D09 | Sant Andreu | 9 | 5 | 10 | 9 | 9 | 7 | 8 | 9 | 4 | 10 |
| D10 | Sant Martí | 6 | 4 | 7 | 5 | 6 | 3 | 1 | 7 | 5 | 4 |
Table A5.
Average scores and percentage of terms in appraisal, behavioural, and attitudinal categories.
Table A5.
Average scores and percentage of terms in appraisal, behavioural, and attitudinal categories.
| Code | District | Score− | Score+ | AvgScore | Feeling− | Feeling+ | Behaviour− | Behaviour+ | Recommend− | Recommend+ |
|---|---|---|---|---|---|---|---|---|---|---|
| D01 | Ciutat Vella | 1.48741 | 98.51259 | 90.01802 | 0.32922 | 5.80039 | 0.00096 | 0.13149 | 0.04759 | 0.56707 |
| D02 | Eixample | 0.68531 | 99.31469 | 91.38933 | 0.29234 | 5.73446 | 0.00100 | 0.14061 | 0.03640 | 0.55705 |
| D03 | Sants-Montjuïc | 0.59835 | 99.40165 | 90.42759 | 0.29635 | 5.66220 | 0.00107 | 0.12274 | 0.03738 | 0.56070 |
| D04 | Les Corts | 1.36986 | 98.63014 | 90.01242 | 0.24194 | 5.59515 | 0.00021 | 0.12149 | 0.02755 | 0.59428 |
| D05 | Sarrià-Sant Gervasi | 1.55280 | 98.44720 | 90.16923 | 0.29327 | 5.78454 | 0.00108 | 0.11471 | 0.03956 | 0.53809 |
| D06 | Gràcia | 1.14286 | 98.85714 | 92.02169 | 0.29503 | 5.83171 | 0.00108 | 0.13231 | 0.03742 | 0.53230 |
| D07 | Horta-Guinardó | 0.78125 | 99.21875 | 90.72211 | 0.30380 | 5.62398 | 0.00082 | 0.09238 | 0.03423 | 0.58217 |
| D08 | Nou Barris | 0.35088 | 99.64912 | 91.56571 | 0.28020 | 5.66100 | 0.00055 | 0.07279 | 0.03886 | 0.63265 |
| D09 | Sant Andreu | 0.94787 | 99.05213 | 90.69531 | 0.26664 | 5.83070 | 0.00000 | 0.08086 | 0.02953 | 0.65729 |
| D10 | Sant Martí | 1.15385 | 98.84615 | 92.00058 | 0.27959 | 5.71139 | 0.00081 | 0.11549 | 0.03262 | 0.57312 |
Note: − = negative; + = positive. Source: Barcelona Airbnb online travel reviews in English prior to the COVID-19 pandemic outbreak [30].
References
- Naab, T.K.; Sehl, A. Studies of user-generated content: A systematic review. Journalism 2017, 18, 1256–1273. [Google Scholar] [CrossRef]
- Tunçel, N.; Yılmaz, N. How does firm- and user-generated content benefit firms and affect consumers? A literature review. In Managing Social Media Practices in the Digital Economy; Alavi, S., Ahuja, V., Eds.; IGI Global: Hershey, PA, USA, 2020; pp. 97–120. [Google Scholar]
- Ukpabi, D.C.; Karjaluoto, H. What drives travelers’ adoption of user-generated content? A literature review. Tour. Manag. Perspect. 2018, 28, 251–273. [Google Scholar] [CrossRef]
- Lu, W.; Stepchenkova, S. User-generated content as a research mode in tourism and hospitality applications: Topics, methods, and software. J. Hosp. Mark. Manag. 2015, 24, 119–154. [Google Scholar] [CrossRef]
- Marine-Roig, E.; Huertas, A. How safety affects destination image projected through online travel reviews. J. Destin. Mark. Manag. 2020, 18, 100469. [Google Scholar] [CrossRef]
- Marine-Roig, E. Destination image analytics through traveller-generated content. Sustainability 2019, 11, 3392. [Google Scholar] [CrossRef] [Green Version]
- Gartner, W.C. Image formation process. J. Travel Tour. Mark. 1993, 2, 191–215. [Google Scholar] [CrossRef]
- Ferrer-Rosell, B.; Marine-Roig, E. Projected versus perceived destination image. Tour. Anal. 2020, 25, 227–237. [Google Scholar] [CrossRef]
- Hlee, S.; Lee, H.; Koo, C. Hospitality and tourism online review research: A systematic analysis and heuristic-systematic model. Sustainability 2018, 10, 1141. [Google Scholar] [CrossRef] [Green Version]
- Volo, S. Tourism data sources: From official statistics to big data. In The SAGE Handbook of Tourism Management: Theories, Concepts and Disciplinary Approaches to Tourism; SAGE Publications: London, UK, 2018; pp. 193–201. [Google Scholar]
- Gallarza, M.G.; Gil Saura, I.; Calderón Garcı́a, H. Destination image: Towards a conceptual framework. Ann. Tour. Res. 2002, 29, 56–78. [Google Scholar] [CrossRef]
- Cutler, S.Q.; Carmichael, B.A. The dimensions of the tourist experience. In The Tourism and Leisure Experience; Morgan, M., Lugosi, P., Ritchie, J.R.B., Eds.; Multilingual Matters: Bristol, UK, 2010; pp. 3–26. [Google Scholar]
- Marine-Roig, E. From the Projected to the Transmitted Image: The 2.0 Construction of Tourist Destination Image and Identity in Catalonia. Ph.D. Thesis, Rovira i Virgili University, Vila-seca, Catalonia, Spain, 2014. [Google Scholar]
- Marine-Roig, E. A webometric analysis of travel blogs and review hosting: The case of Catalonia. J. Travel Tour. Mark. 2014, 31, 381–396. [Google Scholar] [CrossRef]
- Marine-Roig, E. Identity and authenticity in destination image construction. Anatolia Int. J. Tour. Hosp. Res. 2015, 26, 574–587. [Google Scholar] [CrossRef]
- Marine-Roig, E.; Anton Clavé, S. Tourism analytics with massive user-generated content: A case study of Barcelona. J. Destin. Mark. Manag. 2015, 4, 162–172. [Google Scholar] [CrossRef]
- Marine-Roig, E. Religious tourism versus secular pilgrimage: The basilica of La Sagrada Família. Int. J. Relig. Tour. Pilgr. 2015, 3, 25–37. [Google Scholar] [CrossRef]
- Marine-Roig, E. The impact of the consecration of “La Sagrada Familia” basilica in Barcelona by Pope Benedict XVI. Int. J. Tour. Anthropol. 2016, 5, 95–115. [Google Scholar] [CrossRef]
- Marine-Roig, E.; Anton Clavé, S. A detailed method for destination image analysis using user-generated content. Inf. Technol. Tour. 2016, 15, 341–364. [Google Scholar] [CrossRef]
- Marine-Roig, E.; Anton Clavé, S. Semi-automatic content analysis of trip diaries: Pull factors to Catalonia. In Tourist Behaviour: An International Perspective; Kozak, M., Kozak, N., Eds.; CABI: Wallingford, UK, 2016; pp. 46–55. ISBN 978-1-78064-812-5. [Google Scholar]
- Marine-Roig, E.; Anton Clavé, S. Affective component of the destination image: A computerised analysis. In Destination Marketing: An International Perspective; Kozak, M., Kozak, N., Eds.; Routledge: New York, NY, USA, 2016; pp. 49–58. ISBN 978-1-138-85589-2. [Google Scholar]
- Marine-Roig, E.; Anton Clavé, S. Perceived image specialisation in multiscalar tourism destinations. J. Destin. Mark. Manag. 2016, 5, 202–213. [Google Scholar] [CrossRef]
- Marine-Roig, E. Online travel reviews: A massive paratextual analysis. In Analytics in Smart Tourism Design: Concepts and Methods; Xiang, Z., Fesenmaier, D.R., Eds.; Springer: Heidelberg, Germany, 2017; pp. 179–202. ISBN 978-3-319-44262-4. [Google Scholar]
- Marine-Roig, E. Measuring destination image through travel reviews in search engines. Sustainability 2017, 9, 1425. [Google Scholar] [CrossRef] [Green Version]
- Marine-Roig, E.; Mariné Gallisà, E. Imatge de Catalunya percebuda per turistes angloparlants i castellanoparlants [Image of Catalonia perceived by English-speaking and Spanish-speaking tourists]. Doc. d’Anàlisi Geogràfica 2018, 64, 219–245. [Google Scholar] [CrossRef]
- Marine-Roig, E.; Ferrer-Rosell, B. Measuring the gap between projected and perceived destination images of Catalonia using compositional analysis. Tour. Manag. 2018, 68, 236–249. [Google Scholar] [CrossRef]
- Marine-Roig, E.; Ferrer-Rosell, B.; Daries, N.; Cristobal-Fransi, E. Measuring gastronomic image online. Int. J. Environ. Res. Public Health 2019, 16, 4631. [Google Scholar] [CrossRef] [Green Version]
- Lalicic, L.; Marine-Roig, E.; Ferrer-Rosell, B.; Martin-Fuentes, E. Destination image analytics for tourism design: An approach through Airbnb reviews. Ann. Tour. Res. 2021, 86, 103100. [Google Scholar] [CrossRef]
- Çakar, K.; Aykol, Ş. Case study as a research method in hospitality and tourism research: A systematic literature review (1974–2020). Cornell Hosp. Q. 2020. [Google Scholar] [CrossRef]
- WHO. WHO Announces COVID-19 Outbreak a Pandemic; World Health Organization for Europe, 2020. Available online: https://www.euro.who.int/en/health-topics/health-emergencies/coronavirus-covid-19/news/news/2020/3/who-announces-covid-19-outbreak-a-pandemic (accessed on 20 November 2020).
- Tse, D.K.; Wilton, P.C. Models of consumer satisfaction formation: An extension. J. Mark. Res. 1988, 25, 204–212. [Google Scholar] [CrossRef]
- Oliver, R.L.; Burke, R.R. Expectation processes in satisfaction formation: A field study. J. Serv. Res. 1999, 1, 196–214. [Google Scholar] [CrossRef]
- Heskett, J.L.; Jones, T.O.; Loveman, G.W.; Sasser, W.E.; Schlesinger, L.A. Putting the service-profit chain to work. Harv. Bus. Rev. 1994, 72, 164–174. [Google Scholar]
- Homburg, C.; Giering, A. Personal characteristics as moderators of the relationship between customer satisfaction and loyalty-an empirical analysis. Psychol. Mark. 2001, 18, 43–66. [Google Scholar] [CrossRef]
- Anderson, R.E.; Srinivasan, S.S. E-satisfaction and e-loyalty: A contingency framework. Psychol. Mark. 2003, 20, 123–138. [Google Scholar] [CrossRef]
- Castañeda, J.A. Relationship between customer satisfaction and loyalty on the Internet. J. Bus. Psychol. 2011, 26, 371–383. [Google Scholar] [CrossRef]
- Shankar, V.; Smith, A.K.; Rangaswamy, A. Customer satisfaction and loyalty in online and offline environments. Int. J. Res. Mark. 2003, 20, 153–175. [Google Scholar] [CrossRef]
- Kumar, V.; Pozza, I.D.; Ganesh, J. Revisiting the satisfaction–loyalty relationship: Empirical generalizations and directions for future research. J. Retail. 2013, 89, 246–262. [Google Scholar] [CrossRef]
- Lai, K.; Li, X. Tourism destination image: Conceptual problems and definitional solutions. J. Travel Res. 2016, 55, 1065–1080. [Google Scholar] [CrossRef]
- Crompton, J.L. An assessment of the image of Mexico as a vacation destination and the influence of geographical location upon that image. J. Travel Res. 1979, 17, 18–23. [Google Scholar] [CrossRef]
- Kim, H.; Richardson, S.L. Motion picture impacts on destination images. Ann. Tour. Res. 2003, 30, 216–237. [Google Scholar] [CrossRef]
- Chon, K.-S. The role of destination image in tourism: A review and discussion. Tour. Rev. 1990, 45, 2–9. [Google Scholar] [CrossRef] [Green Version]
- Murphy, P.E.; Pritchard, M. Destination price-value perceptions: An examination of origin and seasonal influences. J. Travel Res. 1997, 35, 16–22. [Google Scholar] [CrossRef]
- Oppermann, M. Tourism destination loyalty. J. Travel Res. 2000, 39, 78–84. [Google Scholar] [CrossRef]
- Lam, J.M.S.; Ismail, H.; Lee, S. From desktop to destination: User-generated content platforms, co-created online experiences, destination image and satisfaction. J. Destin. Mark. Manag. 2020, 18, 100490. [Google Scholar] [CrossRef]
- Zhang, H.; Fu, X.; Cai, L.A.; Lu, L. Destination image and tourist loyalty: A meta-analysis. Tour. Manag. 2014, 40, 213–223. [Google Scholar] [CrossRef]
- Afshardoost, M.; Eshaghi, M.S. Destination image and tourist behavioural intentions: A meta-analysis. Tour. Manag. 2020, 81, 104154. [Google Scholar] [CrossRef]
- Chi, C.G.-Q.; Qu, H. Examining the structural relationships of destination image, tourist satisfaction and destination loyalty: An integrated approach. Tour. Manag. 2008, 29, 624–636. [Google Scholar] [CrossRef]
- Wang, C.; Hsu, M.K. The relationships of destination image, satisfaction, and behavioral intentions: An integrated model. J. Travel Tour. Mark. 2010, 27, 829–843. [Google Scholar] [CrossRef]
- Hwang, J.; Asif, M.; Lee, K.-W. Relationships among country image, tour motivations, tour quality, tour satisfaction, and attitudinal loyalty: The case of Chinese travelers to Korea. Sustainability 2020, 12, 3182. [Google Scholar] [CrossRef] [Green Version]
- Dmitrović, T.; Knežević Cvelbar, L.; Kolar, T.; Makovec Brenčič, M.; Ograjenšek, I.; Žabkar, V. Conceptualizing tourist satisfaction at the destination level. Int. J. Cult. Tour. Hosp. Res. 2009, 3, 116–126. [Google Scholar] [CrossRef]
- Gim, T.-H. Tourist satisfaction, image, and loyalty from an interregional perspective: An analysis of neighboring areas with distinct characteristics. Sustainability 2018, 10, 1283. [Google Scholar] [CrossRef] [Green Version]
- Echtner, C.M.; Ritchie, J.R.B. The meaning and measurement of destination image. J. Tour. Stud. 1991, 2, 2–12. [Google Scholar]
- Echtner, C.M.; Ritchie, J.R.B. The measurement of destination image: An empirical assessment. J. Travel Res. 1993, 31, 3–13. [Google Scholar] [CrossRef]
- Dann, G.M.S. Tourists’ images of a destination-An alternative analysis. J. Travel Tour. Mark. 1996, 5, 41–55. [Google Scholar] [CrossRef]
- Baloglu, S.; McCleary, K.W. A model of destination image formation. Ann. Tour. Res. 1999, 26, 868–897. [Google Scholar] [CrossRef]
- Jenkins, O.H. Understanding and measuring tourist destination images. Int. J. Tour. Res. 1999, 1, 1–15. [Google Scholar] [CrossRef]
- Chon, K.-S. Tourism destination image modification process. Tour. Manag. 1991, 12, 68–72. [Google Scholar] [CrossRef]
- Kislali, H.; Kavaratzis, M.; Saren, M. Rethinking destination image formation. Int. J. Cult. Tour. Hosp. Res. 2016, 10, 70–80. [Google Scholar] [CrossRef] [Green Version]
- Kislali, H.; Kavaratzis, M.; Saren, M. Destination image formation: Towards a holistic approach. Int. J. Tour. Res. 2020, 22, 266–276. [Google Scholar] [CrossRef]
- Gunn, C.A. Vacationscape: Designing Tourist Regions; Bureau of Business Research; University of Texas: Austin, TX, USA, 1972; ISBN 978-0877551614. [Google Scholar]
- Phelps, A. Holiday destination image-the problem of assessment. An example developed in Menorca. Tour. Manag. 1986, 7, 168–180. [Google Scholar] [CrossRef]
- Rapoport, A. Human Aspects of Urban Form; Pergamon Press: Oxford, UK, 1977. [Google Scholar]
- Marine-Roig, E.; Anton Clavé, S. Destination image gaps between official tourism websites and user-generated content. In Information and Communication Technologies in Tourism 2016; Inversini, A., Schegg, R., Eds.; Springer: Cham, Switzerland, 2016; pp. 253–265. ISBN 978-3-319-28230-5. [Google Scholar]
- Yilmaz, Y.; Yilmaz, Y. Pre- and post-trip antecedents of destination image for non-visitors and visitors: A literature review. Int. J. Tour. Res. 2020, 22, 518–535. [Google Scholar] [CrossRef]
- Beerli, A.; Martín, J.D. Factors influencing destination image. Ann. Tour. Res. 2004, 31, 657–681. [Google Scholar] [CrossRef]
- Pocock, D.; Hudson, R. Images of the Urban Environment; Macmillan: London, UK, 1978; ISBN 9780333192115. [Google Scholar]
- Lynch, K. The Image of the City; The MIT Press: Cambridge, MA, USA, 1960; ISBN 9780262120043. [Google Scholar]
- Gartner, W.C. Temporal influences on image change. Ann. Tour. Res. 1986, 13, 635–644. [Google Scholar] [CrossRef]
- Morris, C.W. Foundations of the Theory of Signs; The University of Chicago Press: Chicago, IL, USA, 1938. [Google Scholar]
- Morris, C.W. Signs, Language and Behavior; Prentice-Hall: New York, NY, USA, 1946. [Google Scholar]
- Holbrook, M.B.; Hirschman, E.C. The Semiotics of Consumption: Interpreting Symbolic Consumer Behavior in Popular Culture and Works of Art; De Gruyer Mouton: New York, NY, USA, 1993. [Google Scholar]
- Mick, D.G. Consumer research and semiotics: Exploring the morphology of signs, symbols, and significance. J. Consum. Res. 1986, 13, 196–213. [Google Scholar] [CrossRef]
- Mick, D.G.; Burroughs, J.E.; Hetzel, P.; Brannen, M.Y. Pursuing the meaning of meaning in the commercial world: An international review of marketing and consumer research founded on semiotics. Semiotica 2004, 1–74. [Google Scholar] [CrossRef]
- Walmsley, D.J.; Lewis, G.J. Image, behaviour, and meaning. In People & Environment: Behavioural Approaches in Human Geography; Pearson Education Ltd.: London, UK, 1984; pp. 95–126. [Google Scholar]
- Brijs, K.; Bloemer, J.; Kasper, H. Country-image discourse model: Unraveling meaning, structure, and function of country images. J. Bus. Res. 2011, 64, 1259–1269. [Google Scholar] [CrossRef]
- Lojo, A.; Li, M.; Xu, H. Online tourism destination image: Components, information sources, and incongruence. J. Travel Tour. Mark. 2020, 37, 495–509. [Google Scholar] [CrossRef]
- Perussia, F. Semiotic Frame: A method for the experimental analysis of “images”. Psychol. Rep. 1988, 63, 524–526. [Google Scholar] [CrossRef]
- Dann, G.M.S. Why, oh why, oh why, do people travel abroad? In Creating Experience Value in Tourism; CABI: Wallingford, UK, 2014; pp. 48–62. [Google Scholar]
- Daries, N.; Marine-Roig, E.; Ferrer-Rosell, B.; Cristobal-Fransi, E. Do high-quality restaurants act as pull factors to a tourist destination? Tour. Anal. 2021. [Google Scholar] [CrossRef]
- Moutinho, L. Trends in Tourism. In Strategic Management in Tourism; Moutinho, L., Ed.; CABi: New York, NY, USA, 2000; pp. 3–16. [Google Scholar]
- Calzada, I. (Smart) citizens from data providers to decision-makers? The case study of Barcelona. Sustainability 2018, 10, 3252. [Google Scholar] [CrossRef] [Green Version]
- Eurostat Tourism. Eurostat Regional Yearbook; Kotzeva, M., Ed.; Publications Office of the European Union: Luxembourg, 2020; pp. 143–153. ISBN 978-92-79-49273-0. [Google Scholar]
- Martin-Fuentes, E.; Nieto Ferrando, J.; Marine-Roig, E.; Ferrer-Rosell, B. From blockbuster to neighbourhood buster: The effect of films on Barcelona. Sustainability 2020, 12, 2290. [Google Scholar] [CrossRef] [Green Version]
- Staszak, J.-F.; Marine-Roig (translator), E. Representacions del turisme al cinema: Introducció al dossier [Cinematic depictions of tourism]. Tour. Rev. 2018, 14, 2922. [Google Scholar] [CrossRef]
- OTB. Barcelona 2019: Tourism Activity Report; OTB: Barcelona, Catalonia, Spain, 2020. [Google Scholar]
- UNESCO Works of Antoni Gaudi. Available online: http://whc.unesco.org/en/list/320 (accessed on 1 June 2019).
- Gutiérrez, J.; García-Palomares, J.C.; Romanillos, G.; Salas-Olmedo, M.H. The eruption of Airbnb in tourist cities: Comparing spatial patterns of hotels and peer-to-peer accommodation in Barcelona. Tour. Manag. 2017, 62, 278–291. [Google Scholar] [CrossRef] [Green Version]
- Medina-Hernandez, V.C.; Marine-Roig, E.; Ferrer-Rosell, B. Accommodation sharing: A look beyond Airbnb’s literature. Int. J. Cult. Tour. Hosp. Res. 2020, 14, 21–33. [Google Scholar] [CrossRef]
- Huertas, A.; Ferrer-Rosell, B.; Marine-Roig, E.; Cristobal-Fransi, E. Treatment of the Airbnb controversy by the press. Int. J. Hosp. Manag. 2020, 102762. [Google Scholar] [CrossRef]
- Shi, S.; Gursoy, D.; Chen, L. Conceptualizing home-sharing lodging experience and its impact on destination image perception: A mixed method approach. Tour. Manag. 2019, 75, 245–256. [Google Scholar] [CrossRef]
- Garay Tamajón, L.; Morales-Pérez, S.; Wilson, J. Tweeting the right to the city: Digital protest and resistance surrounding the Airbnb effect. Scand. J. Hosp. Tour. 2020, 20, 246–267. [Google Scholar] [CrossRef]
- Morales-Pérez, S.; Garay Tamajón, L.; Wilson, J. Airbnb’s contribution to socio-spatial inequalities and geographies of resistance in Barcelona. Tour. Geogr. 2020, 1–24. [Google Scholar] [CrossRef]
- Fisher, W.R. Technical logic, rhetorical logic, and narrative rationality. Argumentation 1987, 1, 3–21. [Google Scholar] [CrossRef]
- Murray, C. Get the Data. Available online: http://insideairbnb.com (accessed on 20 February 2020).
- Gurran, N.; Zhang, Y.; Shrestha, P. ‘Pop-up’ tourism or ‘invasion’? Airbnb in coastal Australia. Ann. Tour. Res. 2020, 81, 102845. [Google Scholar] [CrossRef]
- Stahl, P.M. Lingua: Natural Language Detection Library. Available online: https://github.com/pemistahl/lingua (accessed on 20 November 2020).
- Roberts, C.W. Content analysis. Int. Encycl. Soc. Behav. Sci. 2001, 2697–2702. [Google Scholar]
- Stemler, S. An overview of content analysis. Pract. Assess. Res. Eval. 2001, 7, 17. [Google Scholar] [CrossRef]
- Quan, S.; Wang, N. Towards a structural model of the tourist experience: An illustration from food experiences in tourism. Tour. Manag. 2004, 25, 297–305. [Google Scholar] [CrossRef]
- Krippendorf, K. Content Analysis: An Introduction to Its Methodology; SAGE Publications: London, UK, 2004. [Google Scholar]
- De Borda, J.C. Mémoire sur les élections au scrutin. In Mémoire de l’Académie Royale; Histoire de l’Académie des Sciences: Paris, France, 1781; pp. 657–665. [Google Scholar]
- Weisberg, H.F. An Introduction to Survey Research and Data Analysis; W. H. Freeman: New York, NY, USA, 1977. [Google Scholar]
- Zervas, G.; Proserpio, D.; Byers, J.W. A first look at online reputation on Airbnb, where every stay is above average. Mark. Lett. 2020. [Google Scholar] [CrossRef]
- Martin-Fuentes, E.; Fernandez, C.; Mateu, C.; Marine-Roig, E. Modelling a grading scheme for peer-to-peer accommodation: Stars for Airbnb. Int. J. Hosp. Manag. 2018, 69, 75–83. [Google Scholar] [CrossRef]
- Hernández, J.M.; Kirilenko, A.P.; Stepchenkova, S. Network approach to tourist segmentation via user generated content. Ann. Tour. Res. 2018, 73, 35–47. [Google Scholar] [CrossRef]
- Nowacki, M.; Niezgoda, A. Identifying unique features of the image of selected cities based on reviews by TripAdvisor portal users. Scand. J. Hosp. Tour. 2020. [Google Scholar] [CrossRef]
- Mandić, A.; Pivčević, S.; Petrić, L. Restaurant online reputation and destination competitiveness: Insight into TripAdvisor data. In Gastronomy for Tourism Development; Peštek, A., Kukanja, M., Renko, S., Eds.; Emerald Publishing Limited: Bingley, UK, 2020; pp. 155–184. [Google Scholar]
Figure 1.
Circle of destination image construction from a holistic perspective [6].
Figure 1.
Circle of destination image construction from a holistic perspective [6].

Figure 2.
Semantic and pragmatic semiotic aspects of destination images derived from [6].
Figure 2.
Semantic and pragmatic semiotic aspects of destination images derived from [6].

Figure 3.
Districts in Barcelona: (a) map; (b) disposable household income per capita, 2016 (index 100.0 = average for Barcelona). Source: from Barcelona City Council (© Sémhur/Wikimedia Commons/CC-BY-SA-3.0).
Figure 3.
Districts in Barcelona: (a) map; (b) disposable household income per capita, 2016 (index 100.0 = average for Barcelona). Source: from Barcelona City Council (© Sémhur/Wikimedia Commons/CC-BY-SA-3.0).

Table 1.
Ranking of appraisive metrics from Table A5.
Table 1.
Ranking of appraisive metrics from Table A5.
| Code | District | Score− | Score+ | AvgScore | Feel− | Feel+ | Rank |
|---|---|---|---|---|---|---|---|
| D01 | Ciutat Vella | 2 | 9 | 9 | 1 | 3 | 10.0 |
| D02 | Eixample | 8 | 3 | 4 | 5 | 5 | 3.5 |
| D03 | Sants-Montjuïc | 9 | 2 | 7 | 3 | 7 | 6.0 |
| D04 | Les Corts | 3 | 8 | 10 | 10 | 10 | 8.5 |
| D05 | Sarrià-Sant Gervasi | 1 | 10 | 8 | 6 | 4 | 8.5 |
| D06 | Gràcia | 5 | 6 | 1 | 4 | 1 | 3.5 |
| D07 | Horta-Guinardó | 7 | 4 | 5 | 2 | 9 | 7.0 |
| D08 | Nou Barris | 10 | 1 | 3 | 7 | 8 | 1.0 |
| D09 | Sant Andreu | 6 | 5 | 6 | 9 | 2 | 2.0 |
| D10 | Sant Martí | 4 | 7 | 2 | 8 | 6 | 5.0 |
Table 2.
Ranking of prescriptive metrics from Table A5.
Table 2.
Ranking of prescriptive metrics from Table A5.
| Code | District | Recom− | Recom+ | Rank A | Behav− | Behav+ | Rank B |
|---|---|---|---|---|---|---|---|
| D01 | Ciutat Vella | 1 | 6 | 8.0 | 5.0 | 3 | 3.0 |
| D02 | Eixample | 6 | 8 | 6.5 | 4.0 | 1 | 2.0 |
| D03 | Sants-Montjuïc | 5 | 7 | 6.5 | 3.0 | 4 | 7.0 |
| D04 | Les Corts | 10 | 3 | 2.0 | 9.0 | 5 | 1.0 |
| D05 | Sarrià-Sant Gervasi | 2 | 9 | 10.0 | 1.5 | 7 | 10.0 |
| D06 | Gràcia | 4 | 10 | 9.0 | 1.5 | 2 | 6.0 |
| D07 | Horta-Guinardó | 7 | 4 | 3.5 | 6.0 | 8 | 8.5 |
| D08 | Nou Barris | 3 | 2 | 5.0 | 8.0 | 10 | 8.5 |
| D09 | Sant Andreu | 9 | 1 | 1.0 | 10.0 | 9 | 4.5 |
| D10 | Sant Martí | 8 | 5 | 3.5 | 7.0 | 6 | 4.5 |
Note: A = Attitudinal response; B = Behavioral response.
Publisher’s Note: MDPI stays neutral with regard to jurisdictional claims in published maps and institutional affiliations. |
© 2021 by the author. Licensee MDPI, Basel, Switzerland. This article is an open access article distributed under the terms and conditions of the Creative Commons Attribution (CC BY) license (http://creativecommons.org/licenses/by/4.0/).
Share and Cite
MDPI and ACS Style
Marine-Roig, E. Measuring Online Destination Image, Satisfaction, and Loyalty: Evidence from Barcelona Districts. Tour. Hosp. 2021, 2, 62-78. https://0-doi-org.brum.beds.ac.uk/10.3390/tourhosp2010004
AMA Style
Marine-Roig E. Measuring Online Destination Image, Satisfaction, and Loyalty: Evidence from Barcelona Districts. Tourism and Hospitality. 2021; 2(1):62-78. https://0-doi-org.brum.beds.ac.uk/10.3390/tourhosp2010004
Chicago/Turabian StyleMarine-Roig, Estela. 2021. "Measuring Online Destination Image, Satisfaction, and Loyalty: Evidence from Barcelona Districts" Tourism and Hospitality 2, no. 1: 62-78. https://0-doi-org.brum.beds.ac.uk/10.3390/tourhosp2010004