A Novel Sensitive Cell-Based Immunoenzymatic Assay for Palytoxin Quantitation in Mussels
by
 , , ,
, , ,
Marco Pelin
1 ,
,
Silvio Sosa
1,
Valentina Brovedani
1,
Laura Fusco
1,
Mark Poli
2 and
Aurelia Tubaro
1,* 1
Department of Life Sciences, University of Trieste, 34127 Trieste, Italy
2
U.S. Army Medical Research Institute of Infectious Diseases, Ft. Detrick, MD 21701-5011, USA
*
Author to whom correspondence should be addressed.
Toxins 2018, 10(8), 329; https://0-doi-org.brum.beds.ac.uk/10.3390/toxins10080329
Submission received: 26 July 2018
/
Revised: 8 August 2018
/
Accepted: 10 August 2018
/
Published: 14 August 2018
(This article belongs to the Section Marine and Freshwater Toxins)
Abstract
:The marine algal toxin palytoxin (PLTX) and its analogues are some of the most toxic marine compounds. Their accumulation in edible marine organisms and entrance into the food chain represent their main concerns for human health. Indeed, several fatal human poisonings attributed to these compounds have been recorded in tropical and subtropical areas. Due to the increasing occurrence of PLTX in temperate areas such as the Mediterranean Sea, the European Food Safety Authority (EFSA) has suggested a maximum limit of 30 µg PLTX/kg in shellfish meat, and has recommended the development of rapid, specific, and sensitive methods for detection and quantitation of PLTX in seafood. Thus, a novel, sensitive cell-based ELISA was developed and characterized for PLTX quantitation in mussels. The estimated limits of detection (LOD) and quantitation (LOQ) were 1.2 × 10⁻¹¹ M (32.2 pg/mL) and 2.8 × 10⁻¹¹ M (75.0 pg/mL), respectively, with good accuracy (bias = 2.5%) and repeatability (15% and 9% interday and intraday relative standard deviation of repeatability (RSDr), respectively). Minimal interference of 80% aqueous methanol extract allows PLTX quantitation in mussels at concentrations lower than the maximum limit suggested by EFSA, with an LOQ of 9.1 µg PLTX equivalent/kg mussel meat. Given its high sensitivity and specificity, the cell-based ELISA should be considered a suitable method for PLTX quantitation.
Key Contribution: A novel cell-based immunoenzymatic assay (cell-based ELISA) for palytoxin (PLTX) quantitation was set up and characterized for its sensitivity, accuracy, reproducibility, and specificity to quantify PLTX in mussels.
1. Introduction
Palytoxin (PLTX), a complex marine poly-ol toxin, is one of the most toxic natural compounds. The discovery of PLTX dates back to the 1960s, when, in a tide pool of Hana Bay (Maui Island, Hawaii), Prof. Paul Helfrich collected samples of a toxic soft coral, subsequently identified as Palythoa toxica. Ten years later, the chemical structure of PLTX isolated from this coral was reported [1]. Later, PLTX and a series of its analogues were also identified in other Zoantharia belonging to the genera Palythoa [2,3,4,5,6,7] and Zoanthus [8], in benthic dinoflagellates of the genus Ostreopsis [9,10,11,12,13,14,15], and in cyanobacteria of the genus Trichodesmium [16]. Only a few of these analogues have been studied from a biological and chemical point of view, including (i) 42-hydroxy-PLTX (42S-OH-50S-PLTX), isolated from P. toxica [2,17], and its stereoisomer (42S-OH-50R-PLTX), isolated from P. tuberculosa [3]; (ii) ostreocin-D (OST-D) and its analogues, produced by Ostreopsis siamensis [11,18,19,20]; and (iii) ovatoxin-a (OVTX-a), the most abundant PLTX analogue, produced by Ostreopsis cf. ovata in the Mediterranean Sea [21,22,23].
The main public health concern associated with these toxins is their presence in marine organisms and potential entrance into the human food chain. Indeed, PLTXs have been detected in porifera and polychaete worms as well as in other edible species, including crustaceans, mollusks (gastropods, bivalves, and cephalopods), and echinoderms (sea urchins, starfishes) [8,24,25]. Moreover, consumption of PLTX-contaminated fish or crabs has been associated with cases of fatal human poisoning in tropical and subtropical areas [26,27,28,29]. On the other hand, adverse effects in humans attributed to PLTX along the Mediterranean and Atlantic coasts of Portugal have been associated with inhalation and/or cutaneous exposure to marine aerosol and/or direct exposure to seawater during Ostreopsis blooms [30,31]. In particular, signs and symptoms in the respiratory tract, including dyspnea associated with fever >38 °C, as well as conjunctivitis and dermatitis have been reported [13,14,24,27,30,32,33]. In these areas, Ostreopsis has been recorded since the early 1970s [34], and in the last decade PLTXs have been detected both in microalgae and in edible marine organisms, but no foodborne poisonings attributed to these toxins have yet been documented.
Despite their high toxicity, PLTXs are not regulated as seafood or environmental contaminants. However, the European Food Safety Authority (EFSA) has suggested a maximum limit of 30 µg PLTX/kg of shellfish meat [35]. Moreover, given the significant concerns for public health due to the expanding distribution of PLTXs, EFSA has recommended the development of suitable methods to detect these toxins in seafood. In addition to liquid chromatography–mass spectrometry (LC-MS) based chemical methods [36,37], both structural and functional assays are currently available for PLTX. Among these are the hemolytic assay [38,39,40,41,42], the lactate dehydrogenase-based hemolytic biosensor [43], and methods based on PLTX binding to Na+/K+ ATPase [44,45]. However, these methods suffer from insufficient sensitivity, significant matrix effects, low toxin recovery, and/or other limitations for routine use. Among the structural assays, sensitive, inexpensive, and easy-to-use immunoassays have been set up [46,47,48,49]. Recently, antibody-based biosensors have also been developed as innovative and highly sensitive analytical methods to detect and quantify PLTXs. In particular, a surface plasmon resonance (SPR) biosensor using a murine monoclonal anti-PLTX antibody was set up by Yakes et al. [50], while Zamolo et al. developed a sensitive electrochemiluminescence-based sensor combining the specificity provided by anti-PLTX antibodies and the electric conductivity of carbon nanotubes [51]. Recently, Fraga et al. set up a cytometry immunoassay based on the competitive binding of a monoclonal anti-PLTX antibody between PLTX immobilized on microspheres and PLTX in solution [52]. Another recently developed biosensor for PLTX detection is an immunoenzymatic assay based on biolayer interferometry coupled with a competitive binding assay through an enzyme-linked aptamer [53].
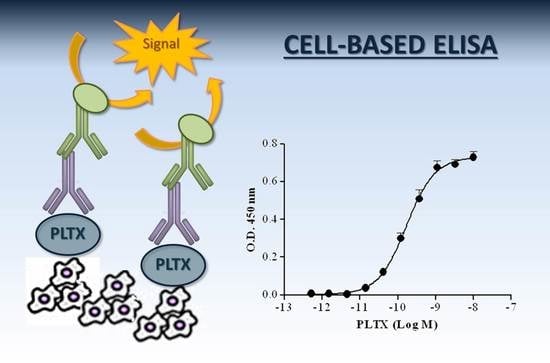
Recently, we demonstrated the ability of specific anti-PLTX antibodies to measure and characterize the binding of PLTX to cultured cells [54]. Using ouabain as a well-known antagonist of PLTX effects in vitro, this binding seems to occur on Na+/K+ ATPase expressed on the cell surface. Given the high-affinity binding of PLTX to cells and the ability of a monoclonal anti-PLTX antibody to efficiently and simply quantify bound PLTX, a novel cell-based immunoenzymatic assay (cell-based ELISA) for PLTX quantitation was set up and characterized for its sensitivity, accuracy, reproducibility, and specificity. This novel method was further characterized for its suitability to quantify the toxin in mussels.
2. Results
2.1. Development and Optimization of the Cell-Based ELISA
The cell-based ELISA was developed starting from the protocol for the characterization of PLTX binding to cultured cells reported by Pelin et al. [54]. The assay was then optimized through the following steps: (i) choosing the most sensitive cell line for PLTX binding, (ii) choosing the fixative solutions and temperature of cell incubation with the antibodies, (iii) choosing the sequence of cell fixation and exposure to PLTX, (iv) choosing the blocking agent, and (v) choosing the primary antibody dilution.
2.1.1. PLTX Binding on Different Cultured Cells
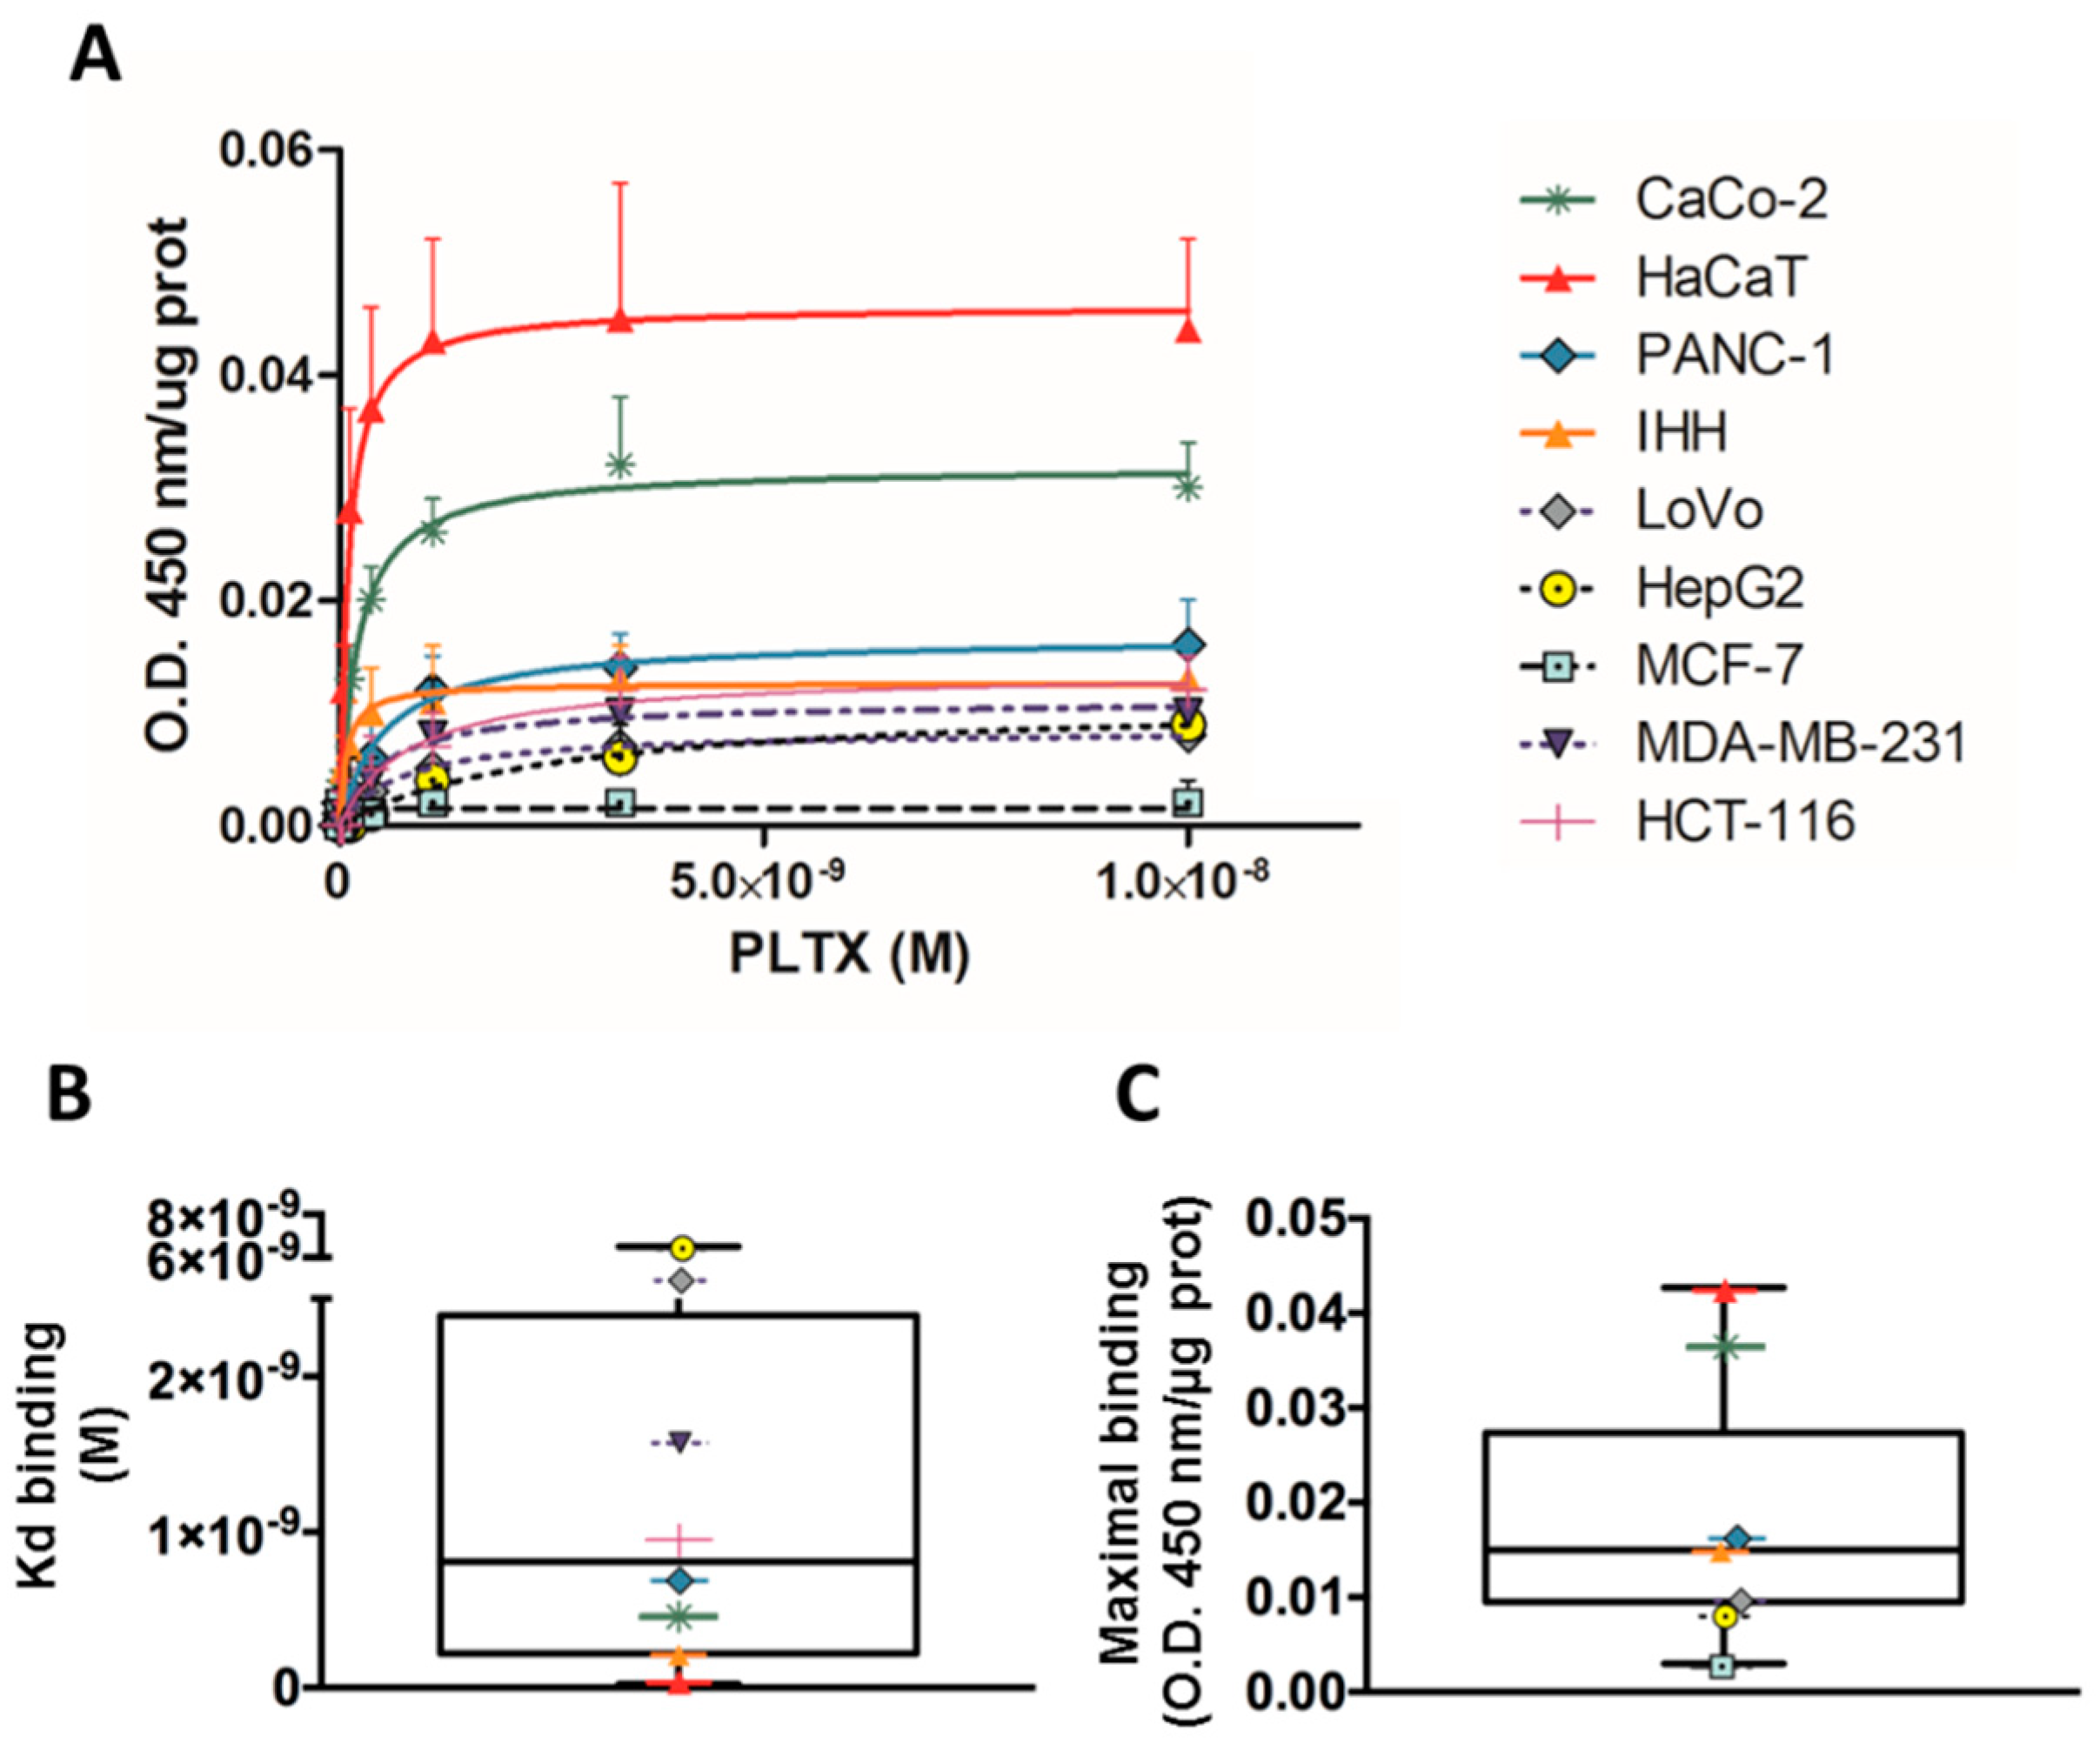
PLTX binding on cultured cells was evaluated using a panel of different cell lines. Cells were exposed to PLTX for 10 min at 37 °C and the toxin binding was subsequently evaluated as described in the Materials and Methods section. The obtained results for each cell model were normalized on the protein content of each sample. Figure 1 shows the saturation curves of PLTX binding for each cell model (panel A). From these curves, Kd values and maximal binding were calculated, and their distribution was analyzed in the box plot of Figure 1 (panels B and C). A median Kd of 8.1 × 10⁻¹⁰ M (interquartile range = 2.2 × 10⁻¹⁰ to 2.4 × 10⁻⁹ M) and a median maximal binding of 0.015 (interquartile range = 0.0095 to 0.02738) were calculated. Binding parameters varied between the different cell lines, and HaCaT cells were the most sensitive cell line, as confirmed by the Kd values and maximal binding (1.4 × 10⁻¹⁰ M and 0.043, respectively). On the contrary, the less sensitive cell models for PLTX binding were HepG2 cells (Kd = 6.5 × 10⁻⁹ M; maximal binding = 0.009) and MCF-7 cells (Kd = not detectable; maximal binding = 0.003). For these reasons, the HaCaT cell line was chosen as the most sensitive model to set up the cell-based ELISA.
2.1.2. Incubation Temperature and Fixing Agents
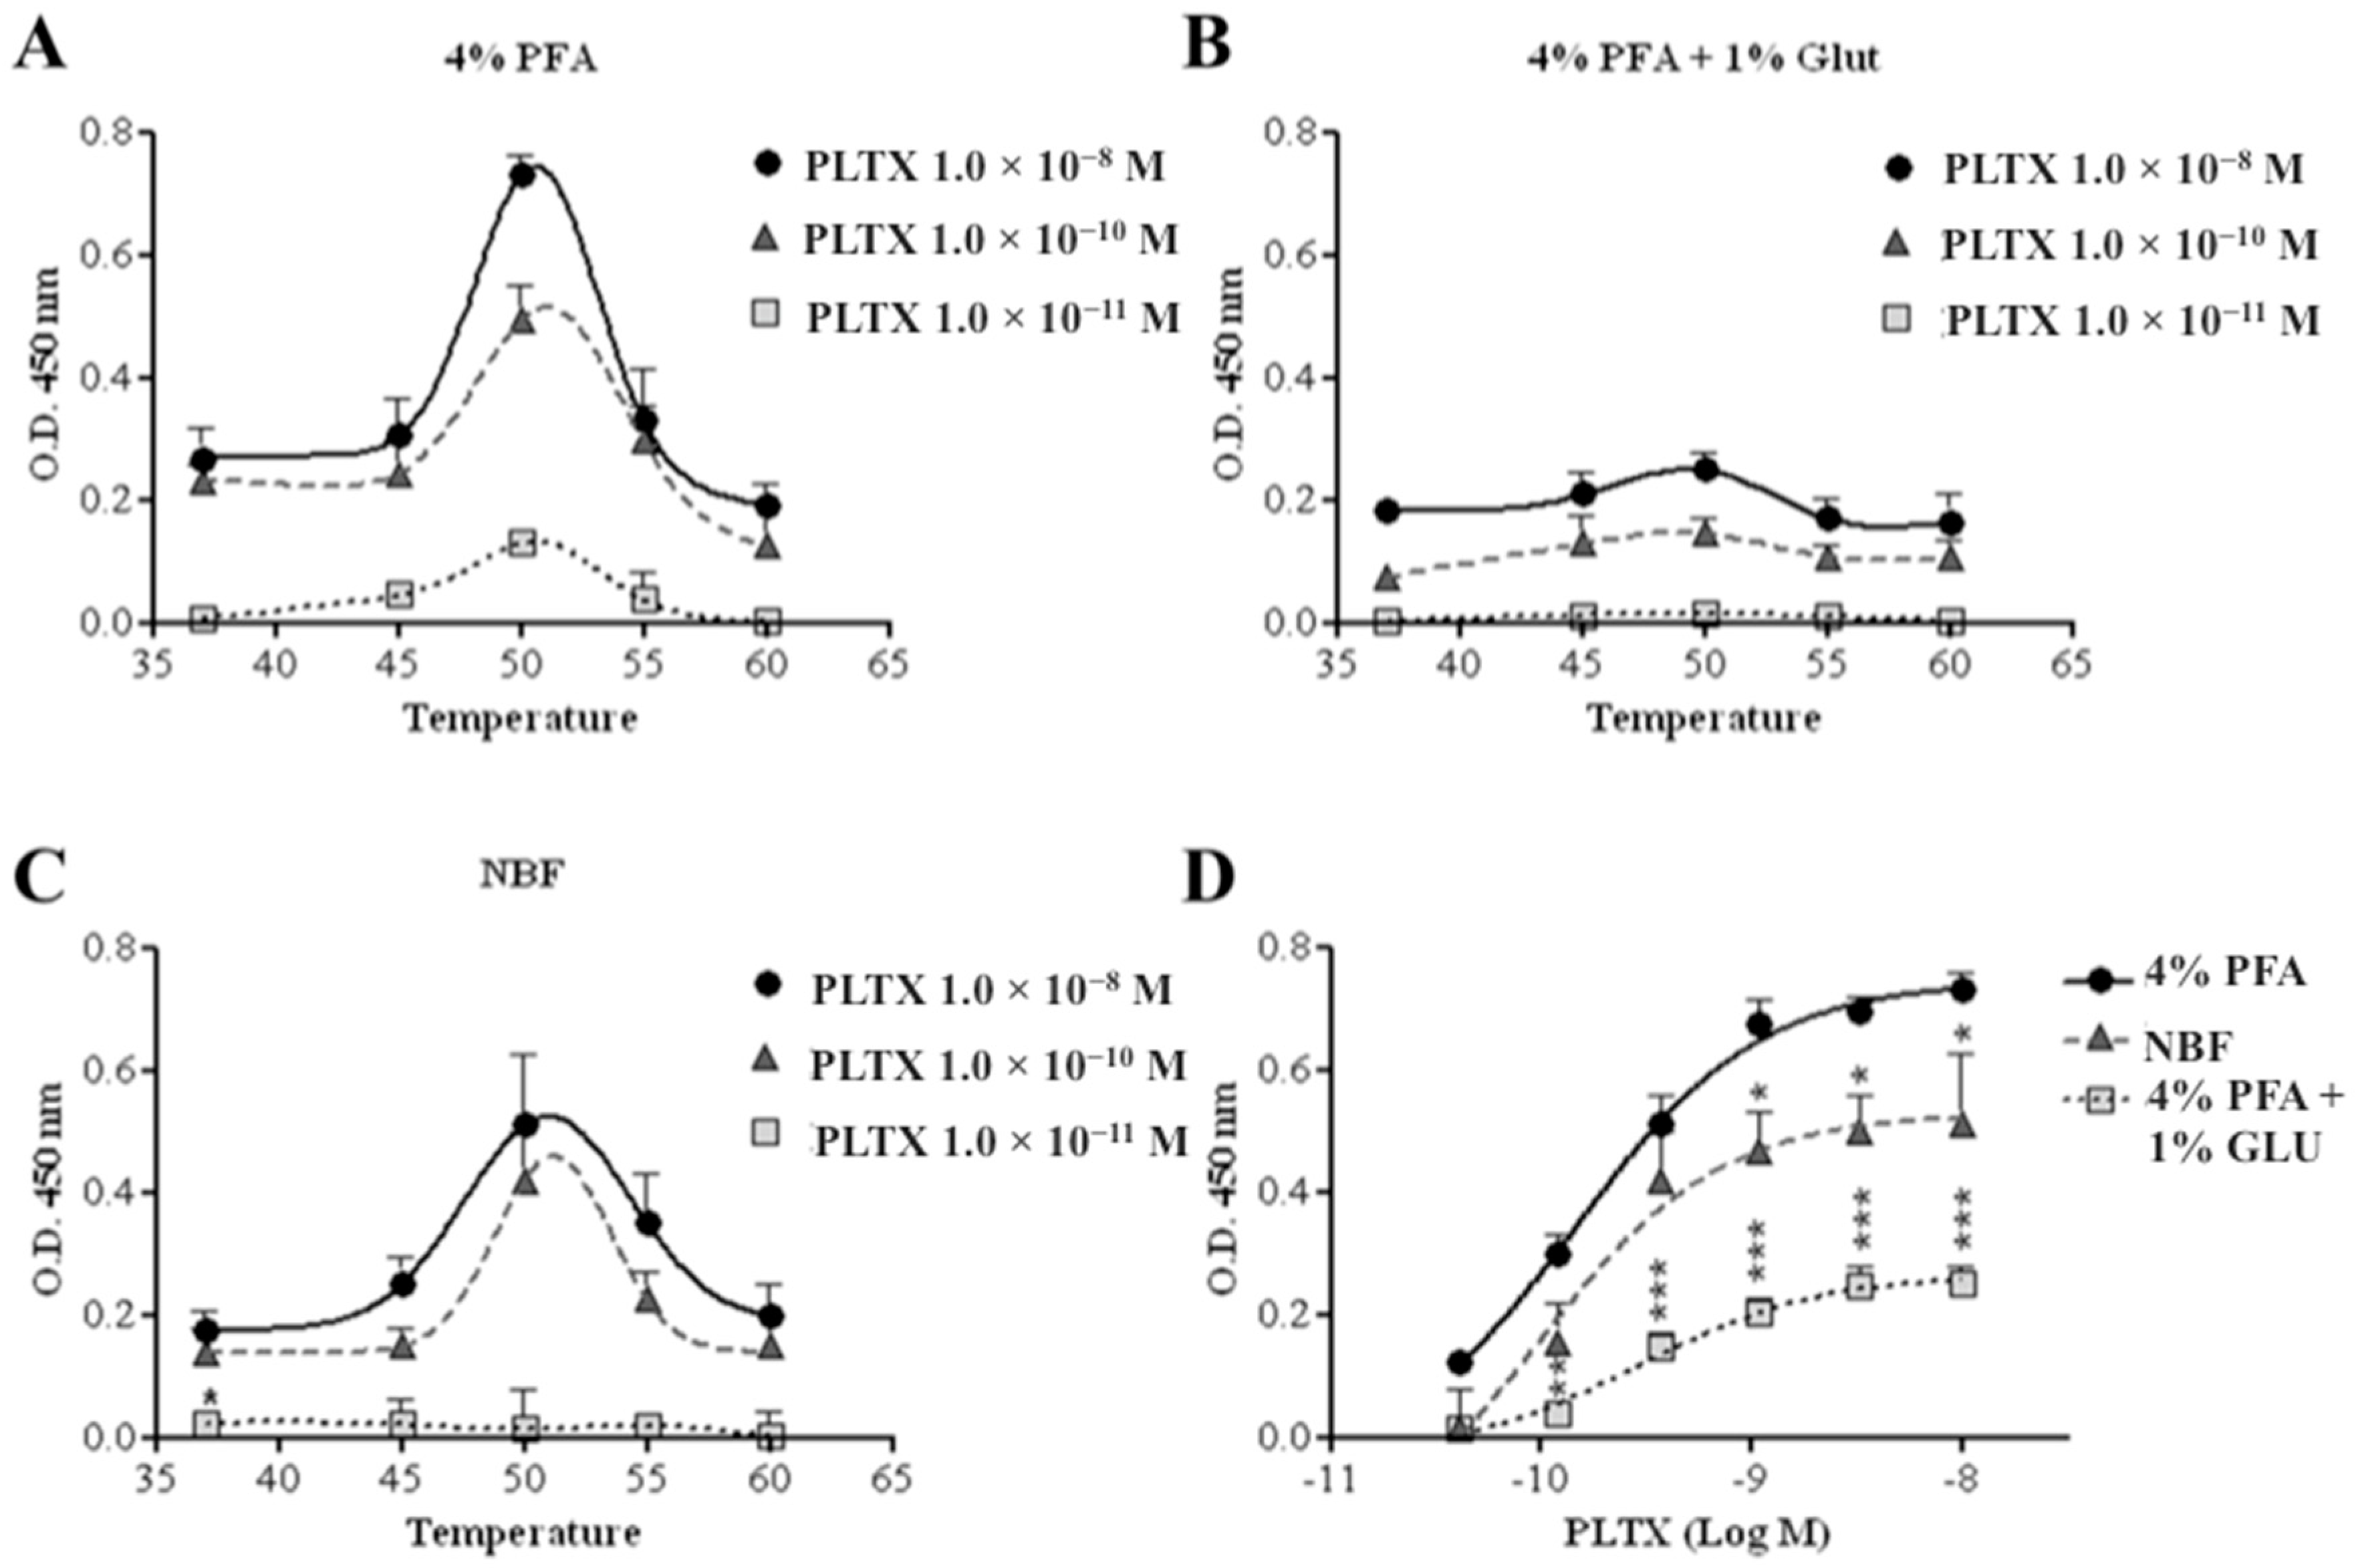
To improve sensitivity, the assay was carried out exposing HaCaT cells to PLTX, varying the fixing agents and incubation temperature (37–60 °C) with the primary and secondary antibodies. An increased signal (optical density, OD) was observed with increased incubation temperature up to 50 °C, which subsequently decreased at higher temperatures (Figure 2). This trend was recorded also varying the following cell fixing agents: 4% paraformaldehyde (PFA), 4% PFA and 1% glutaraldehyde, neutral-buffered formalin (NBF) (Figure 2).
At the optimal temperature of 50 °C, the highest colorimetric reaction signal was recorded using 4% PFA as fixing agent, followed by NBF (significant differences starting from 1.1 × 10⁻⁹ M PLTX as compared to the data recorded using 4% PFA, p < 0.05) and 4% PFA + 1% glutaraldehyde (significant differences starting from 1.2 × 10⁻¹⁰ M PLTX as compared to the data recorded using 4% PFA, p < 0.01) (Figure 2D). Thus, 4% PFA and 50 °C were chosen as the optimal fixing agent and incubation temperature with antibodies.
2.1.3. Sequence of Cell Fixation and Exposure to PLTX
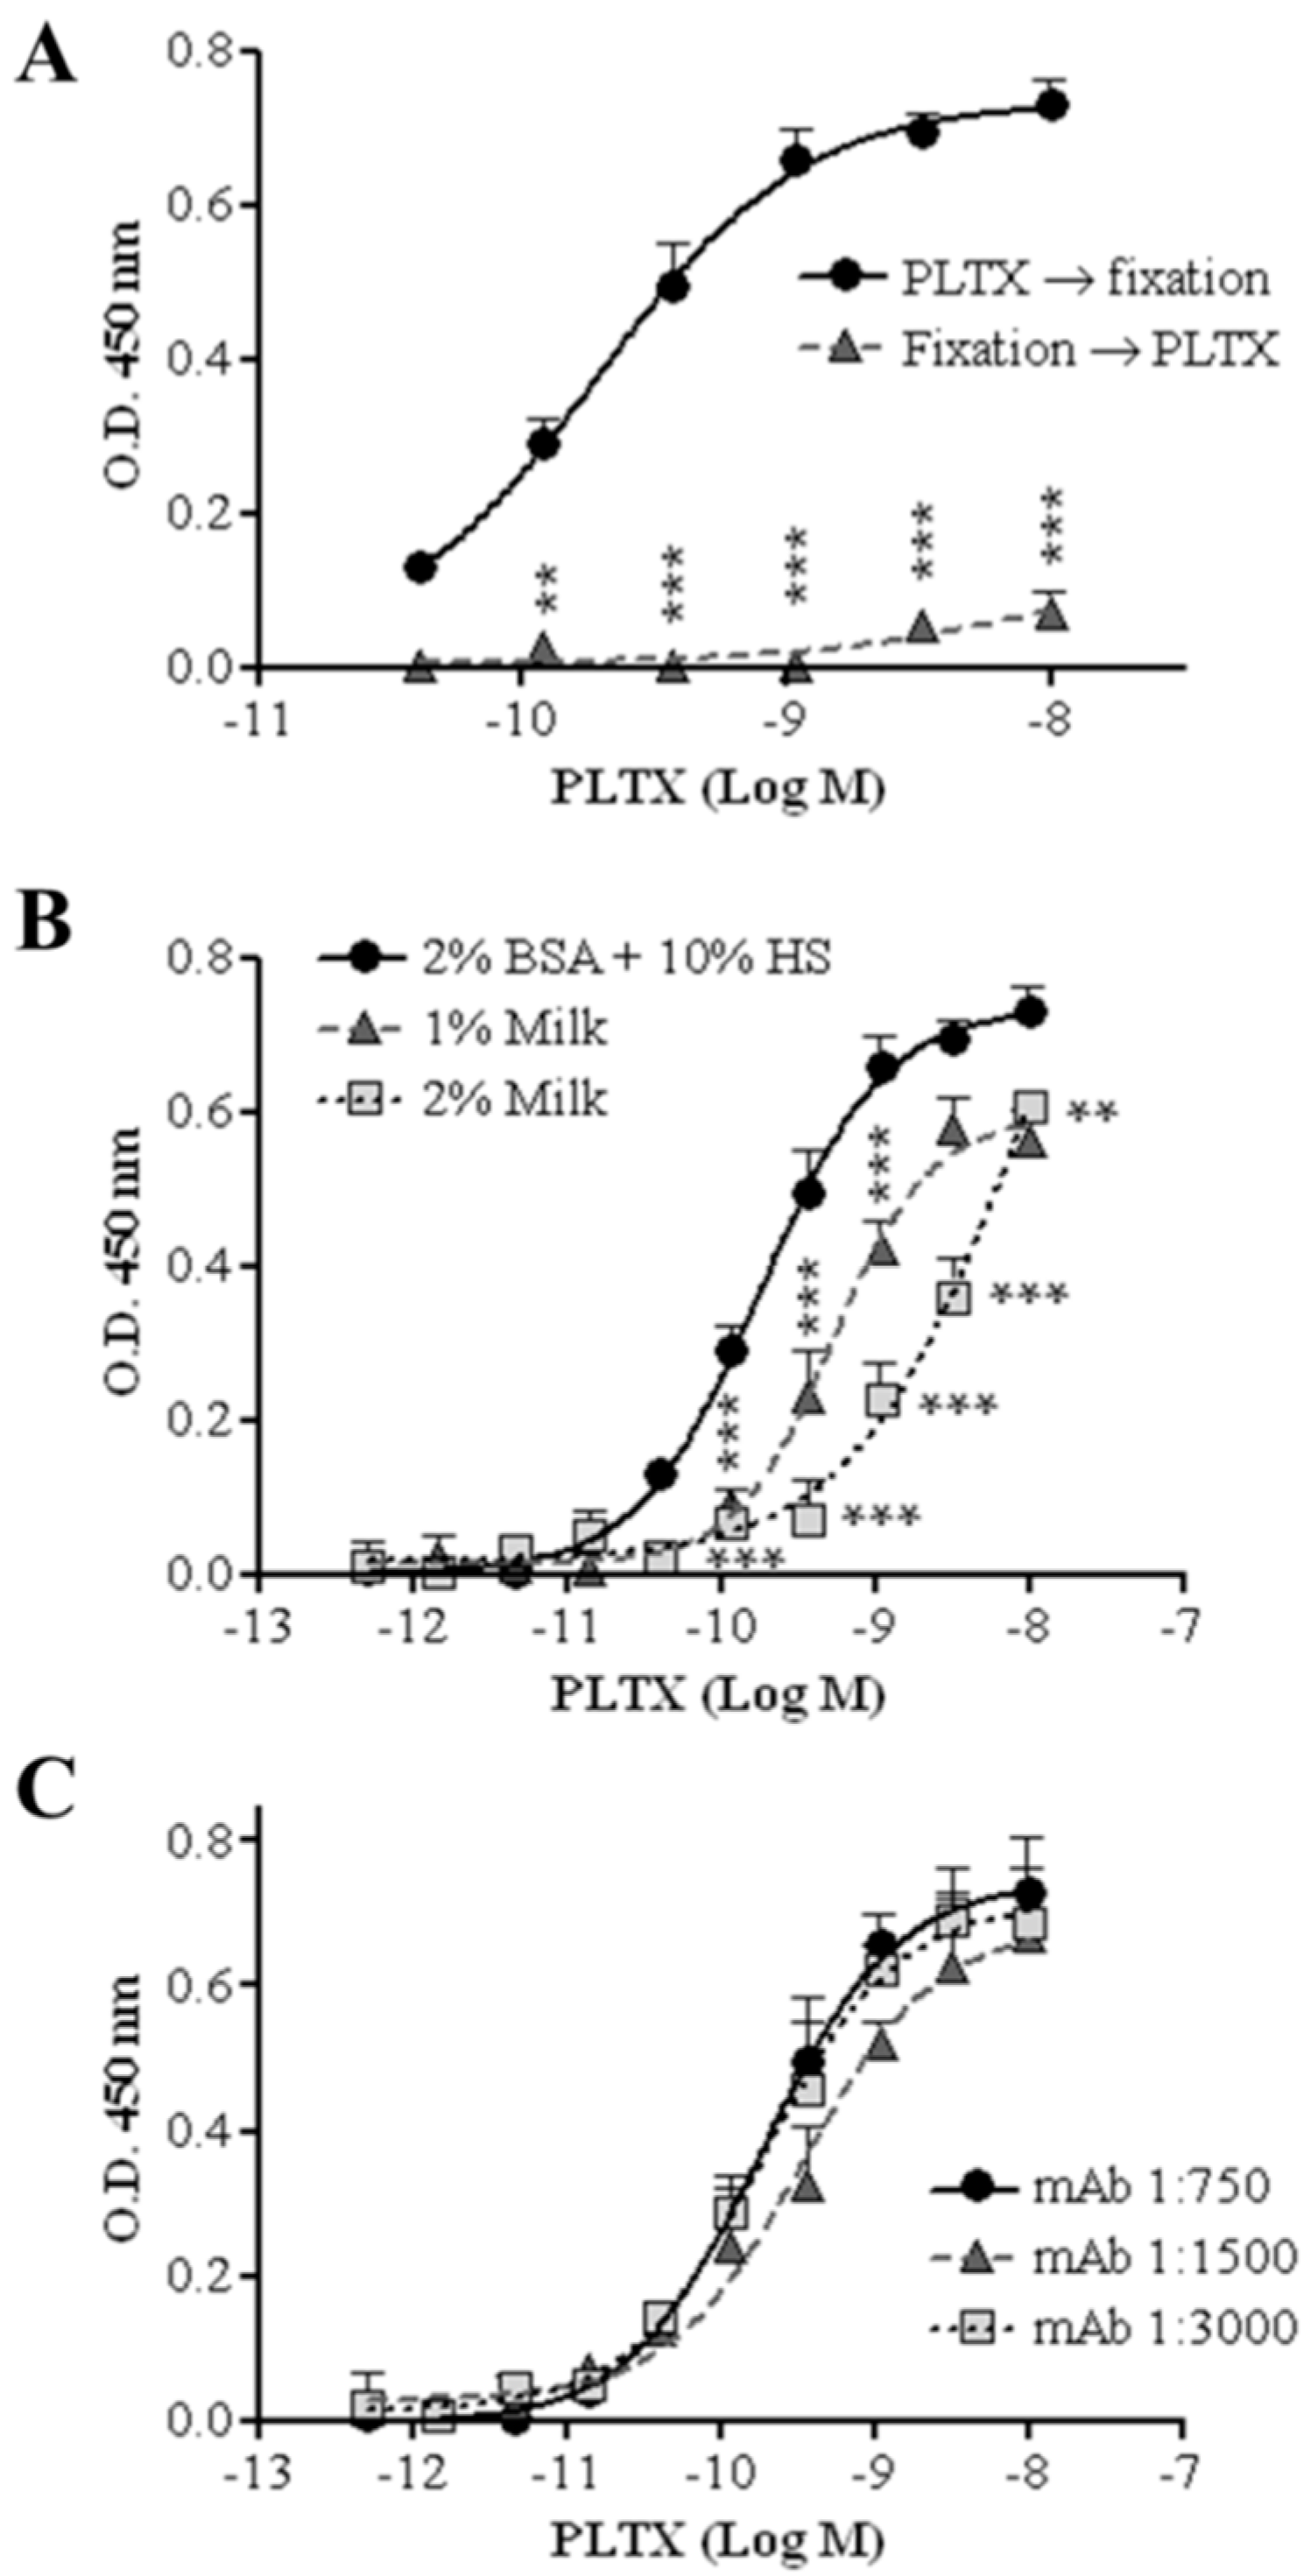
The possibility of changing the sequence of cell fixation and exposure to PLTX was also evaluated: the cell-based ELISA was carried out fixing HaCaT cells with 4% PFA for 30 min before exposure to PLTX or exposing the cells to the toxin before fixation, as described in the Materials and Methods section. Figure 3A shows the concentration-dependent curve for PLTX detection recorded in the two conditions; the optimal condition consists in cell exposure to PLTX before fixation, since the inverted sequence dramatically decreased the OD values, as expected.
2.1.4. Blocking Agent
The influence of different blocking agents on the assay signal was also evaluated. Figure 3B shows a PLTX calibration curve obtained using three blocking agents. The highest signal was recorded using a Tris-borate buffer (TBB) solution containing 10% horse serum (HS) as a blocking agent. A significant decrease in signal was recorded starting from 1.2 × 10⁻¹⁰ M PLTX using a Tris-buffer saline (TBS) solution containing 0.2% Tween 20 and 1% or 2% dried milk powder.
2.1.5. Primary Antibody Dilution
To further increase the signal/background ratio, the influence of different dilutions of the primary antibody on the assay signal was evaluated. As shown in Figure 3C, no significant differences were observed among three primary antibody dilutions tested (1:750, 1:1500, and 1:3000). Thus, the cell-based ELISA was subsequently carried out using the highest dilution (1:3000; 0.5 µg/mL final concentration) of the primary antibody.
2.1.6. Optimized Cell-Based ELISA
The optimized protocol of the cell-based ELISA consisted of: (i) exposing HaCaT cells (1.5 × 10⁴ cells/well) to PLTX (5.1 × 10⁻¹³–1.0 × 10⁻⁸ M) for 10 min at 37 °C, followed by two washes with PBS; (ii) fixation with 4% PFA (50 µL/well) for 30 min, followed by washing with PBS; (iii) blocking with TBB buffer containing 10% HS (200 µL/well) for 30 min, followed by two washes with PBS; (iv) cell incubation with 0.5 µg/mL mouse anti-PLTX monoclonal antibody (mAb) (primary antibody; 100 µL/well) for 1 h at 50 °C under gentle agitation; (v) after three washes with PBS containing 0.1% Tween 20 followed by three washes with PBS, cell incubation with 1:6000 HRP-conjugated anti-mouse IgG (secondary antibody; 100 µL/well) for 1 h at 50 °C under gentle agitation; (vi) after three washes with PBS containing 0.1% Tween 20 and three washes with PBS, cell incubation with tetramethylbenzidine (TMB; 60 µL/well) for 20 min at room temperature; (vii) stopping the colorimetric reaction by 1 M H2SO4 (30 µL/well); and (viii) measuring the optical density at 450 nm.
2.2. Characterization of the Cell-Based ELISA
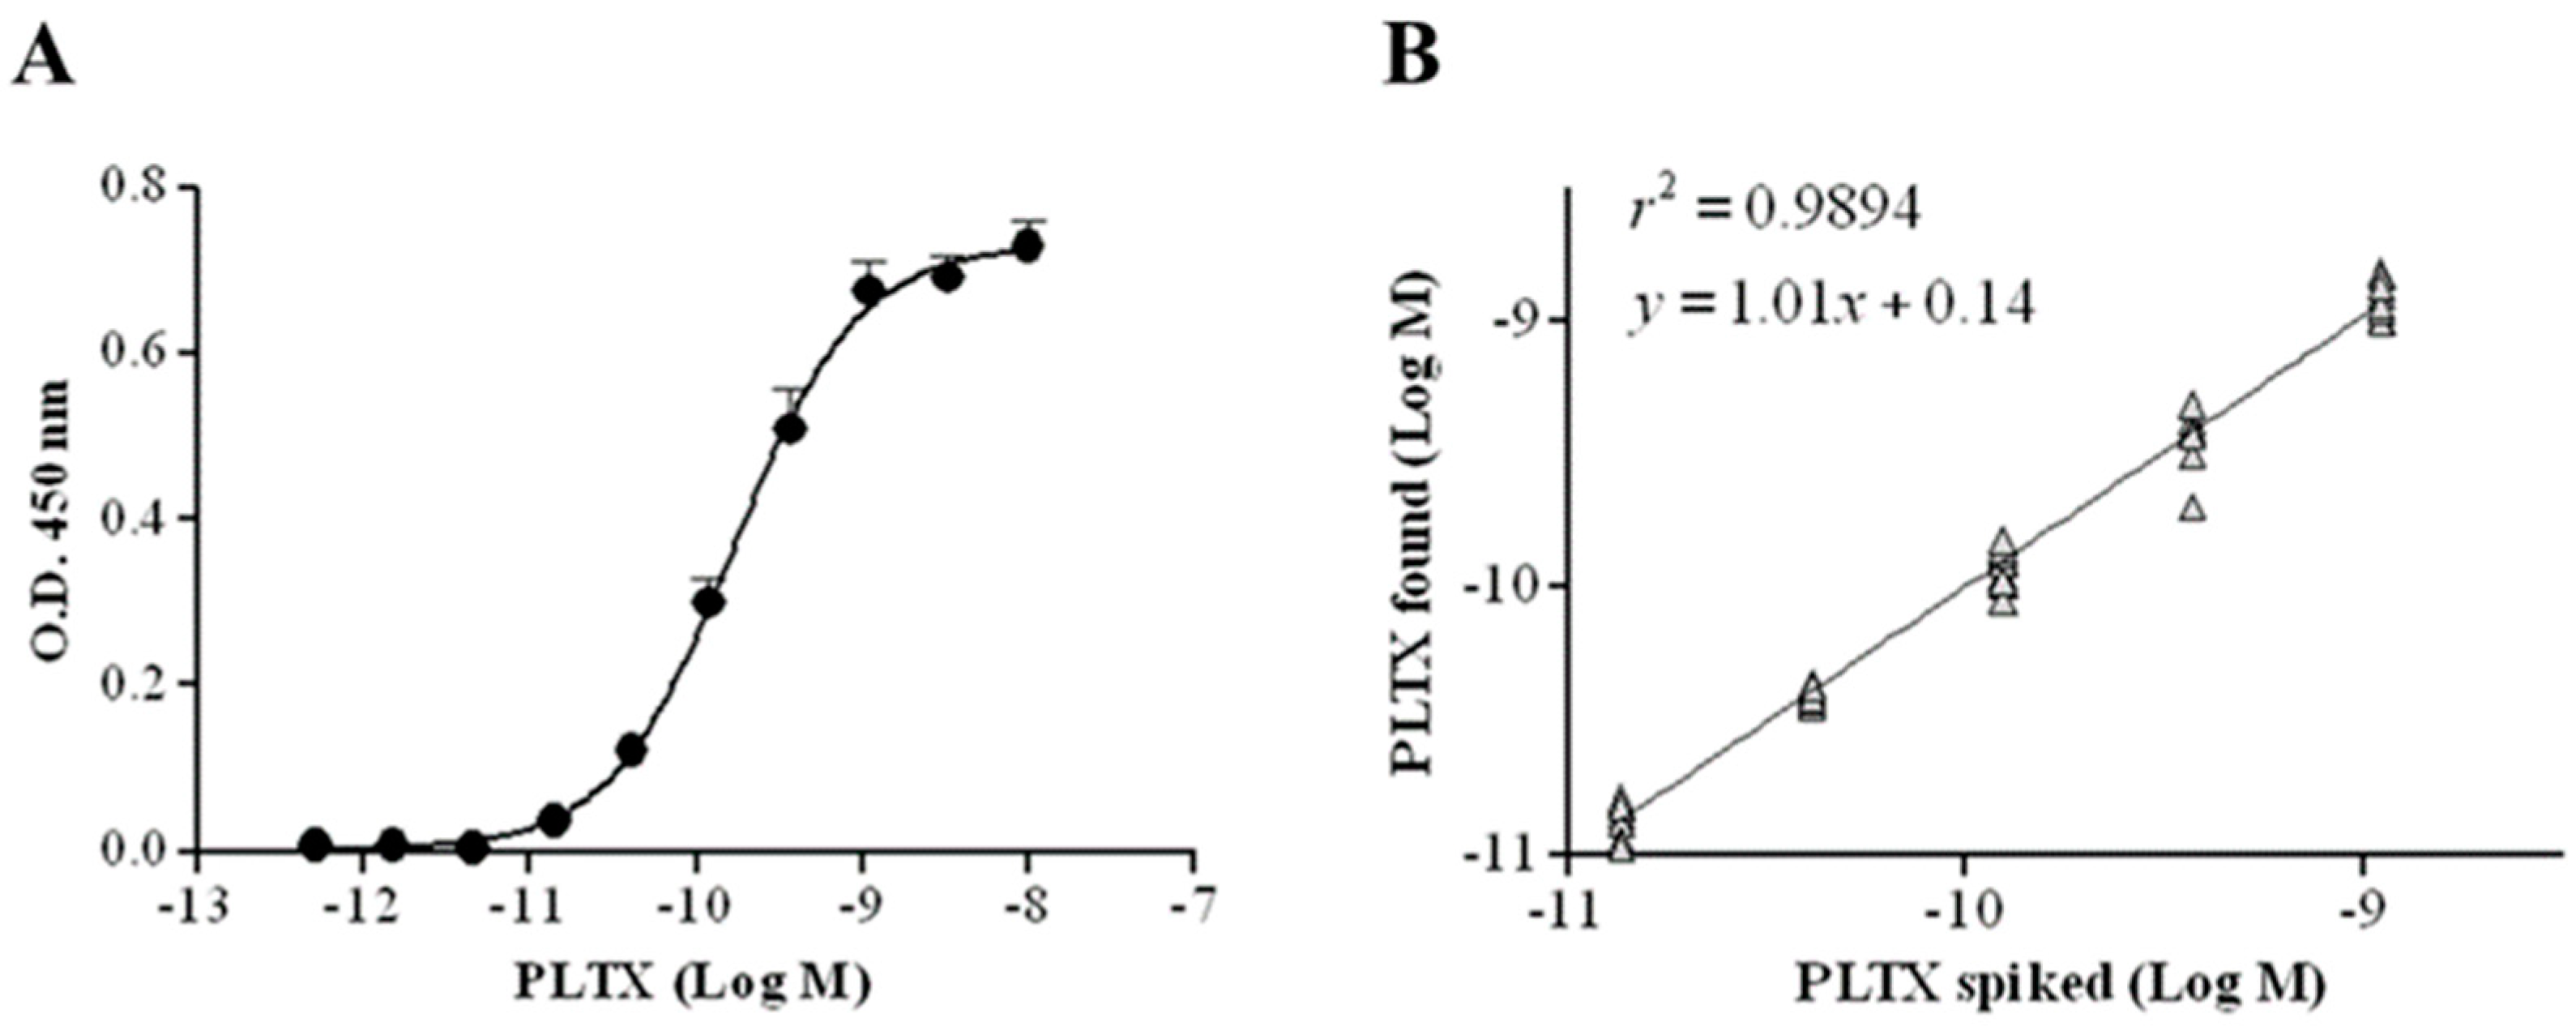
The cell-based ELISA was subsequently characterized by evaluating the limit of detection (LOD) and quantitation (LOQ) of PLTX, as well as the accuracy, repeatability, and specificity of the assay. The calibration curve of PLTX is shown in Figure 4A: the working range is 1.4 × 10⁻¹¹ to 1.1 × 10⁻⁹ M, whereas the estimated LOD and LOQ of PLTX were 1.2 × 10⁻¹¹ M (32.2 pg/mL) and 2.8 × 10⁻¹¹ M (75.0 pg/mL), respectively. The working range was analyzed by linear regression, plotting the theoretical PLTX concentrations used in the assay against the measured toxin concentrations, and the obtained results revealed a good correlation coefficient (r2 = 0.9894; n = 10) (Figure 4B). A mean bias value of 2.5% (range: −5.1 to 9.8%) was obtained (Table 1).
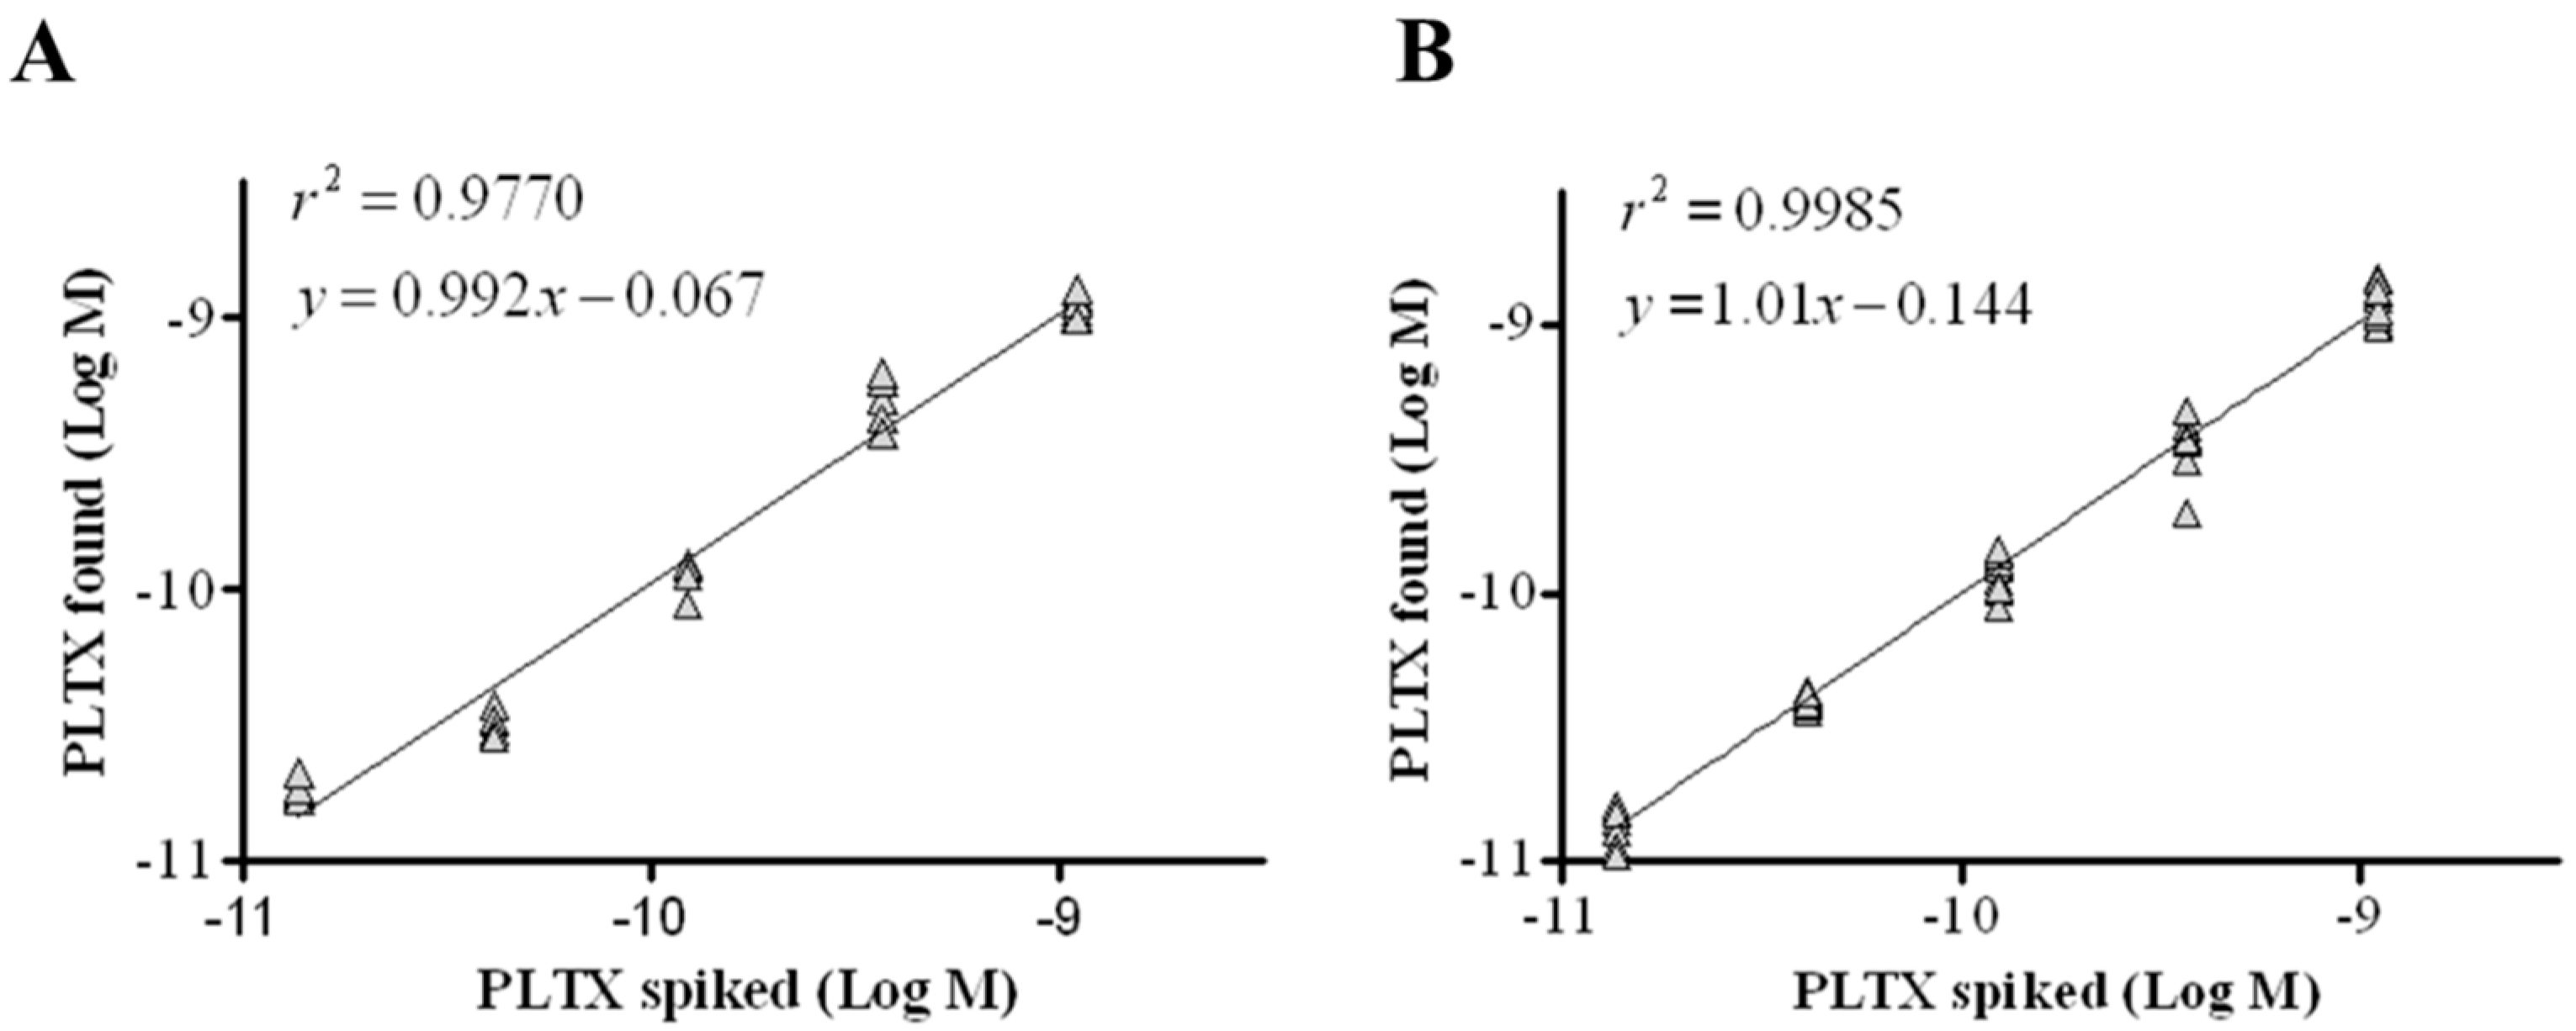
The intraassay repeatability was estimated over six replicates carried out in one day, while the interassay repeatability was evaluated over 10 replicates carried out over a six-month period. Good correlation coefficients were calculated, with r2 = 0.9770 for intraassay and r2 = 0.9985 for interassay (Figure 5). Moreover, the intraday and interday repeatability coefficients (relative standard deviation of repeatability, RSDr) were 12% and 15%, respectively (Table 1).
2.3. Cross-Reactivity with Other Marine Toxins
Cross-reactivity was evaluated by analyzing other marine algal toxins structurally unrelated to PLTX that can contaminate seafood: yessotoxin, okadaic acid, domoic acid, brevetoxin-3, saxitoxin, azaspiracid-1, and maitotoxin. These toxins were analyzed by the cell-based ELISA at concentrations ranging from 1 × 10⁻¹² M to 1 × 10⁻⁶ M, and no cross-reactivity was observed (Supplementary Figure S1).
2.4. Inhibition of PLTX Binding by Ouabain
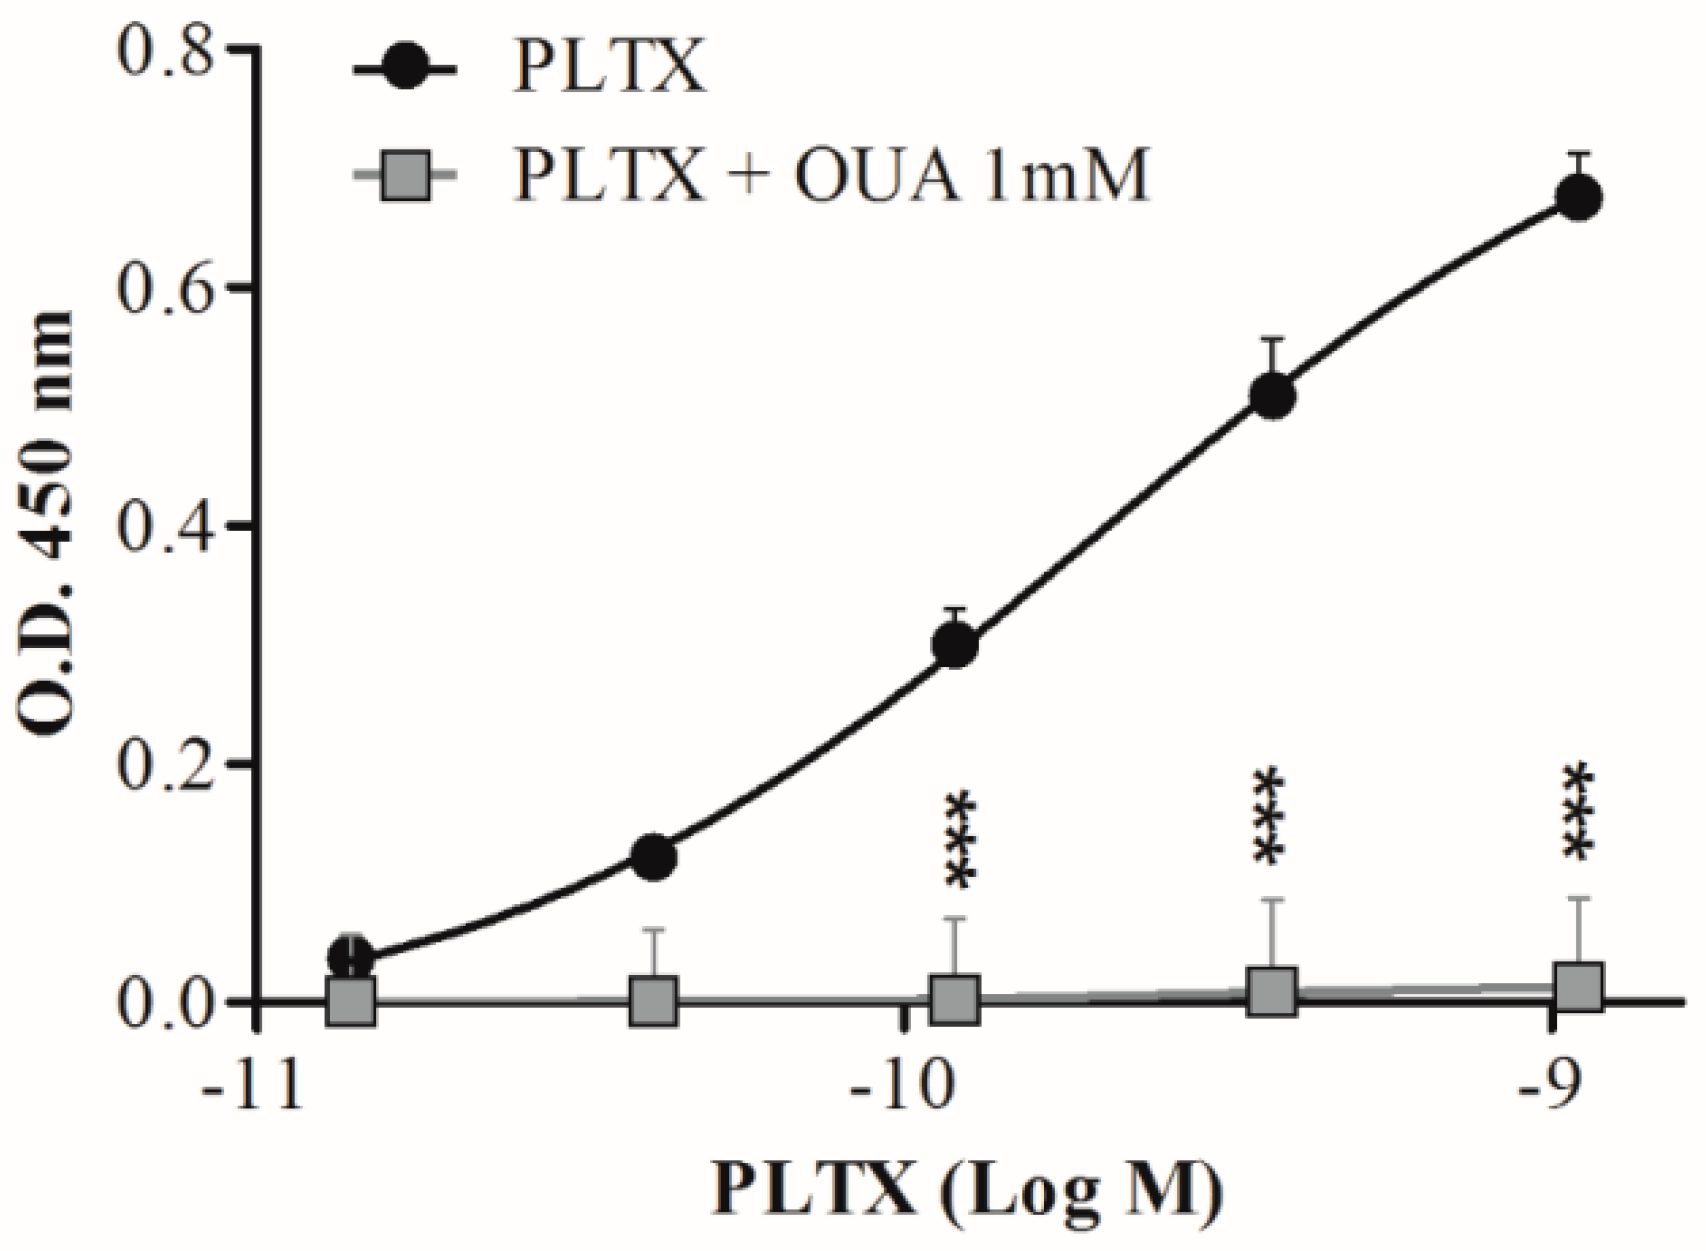
Ouabain (OUA) is a known inhibitor of PLTX in vitro effects due to its binding to the common molecular target, Na+/K+ ATPase [54,55,56]. Thus, to confirm the specific detection of PLTX by the cell-based ELISA, the assay was performed also exposing the cells to 1 mM OUA for 10 min before their exposure to PLTX (1.4 × 10⁻¹¹ to 1.1 × 10⁻⁹ M). As can be seen in Figure 6, a significant reduction of the assay signal was recorded when cells were pre-exposed to 1 mM OUA.
2.5. Mussel Matrix Effect
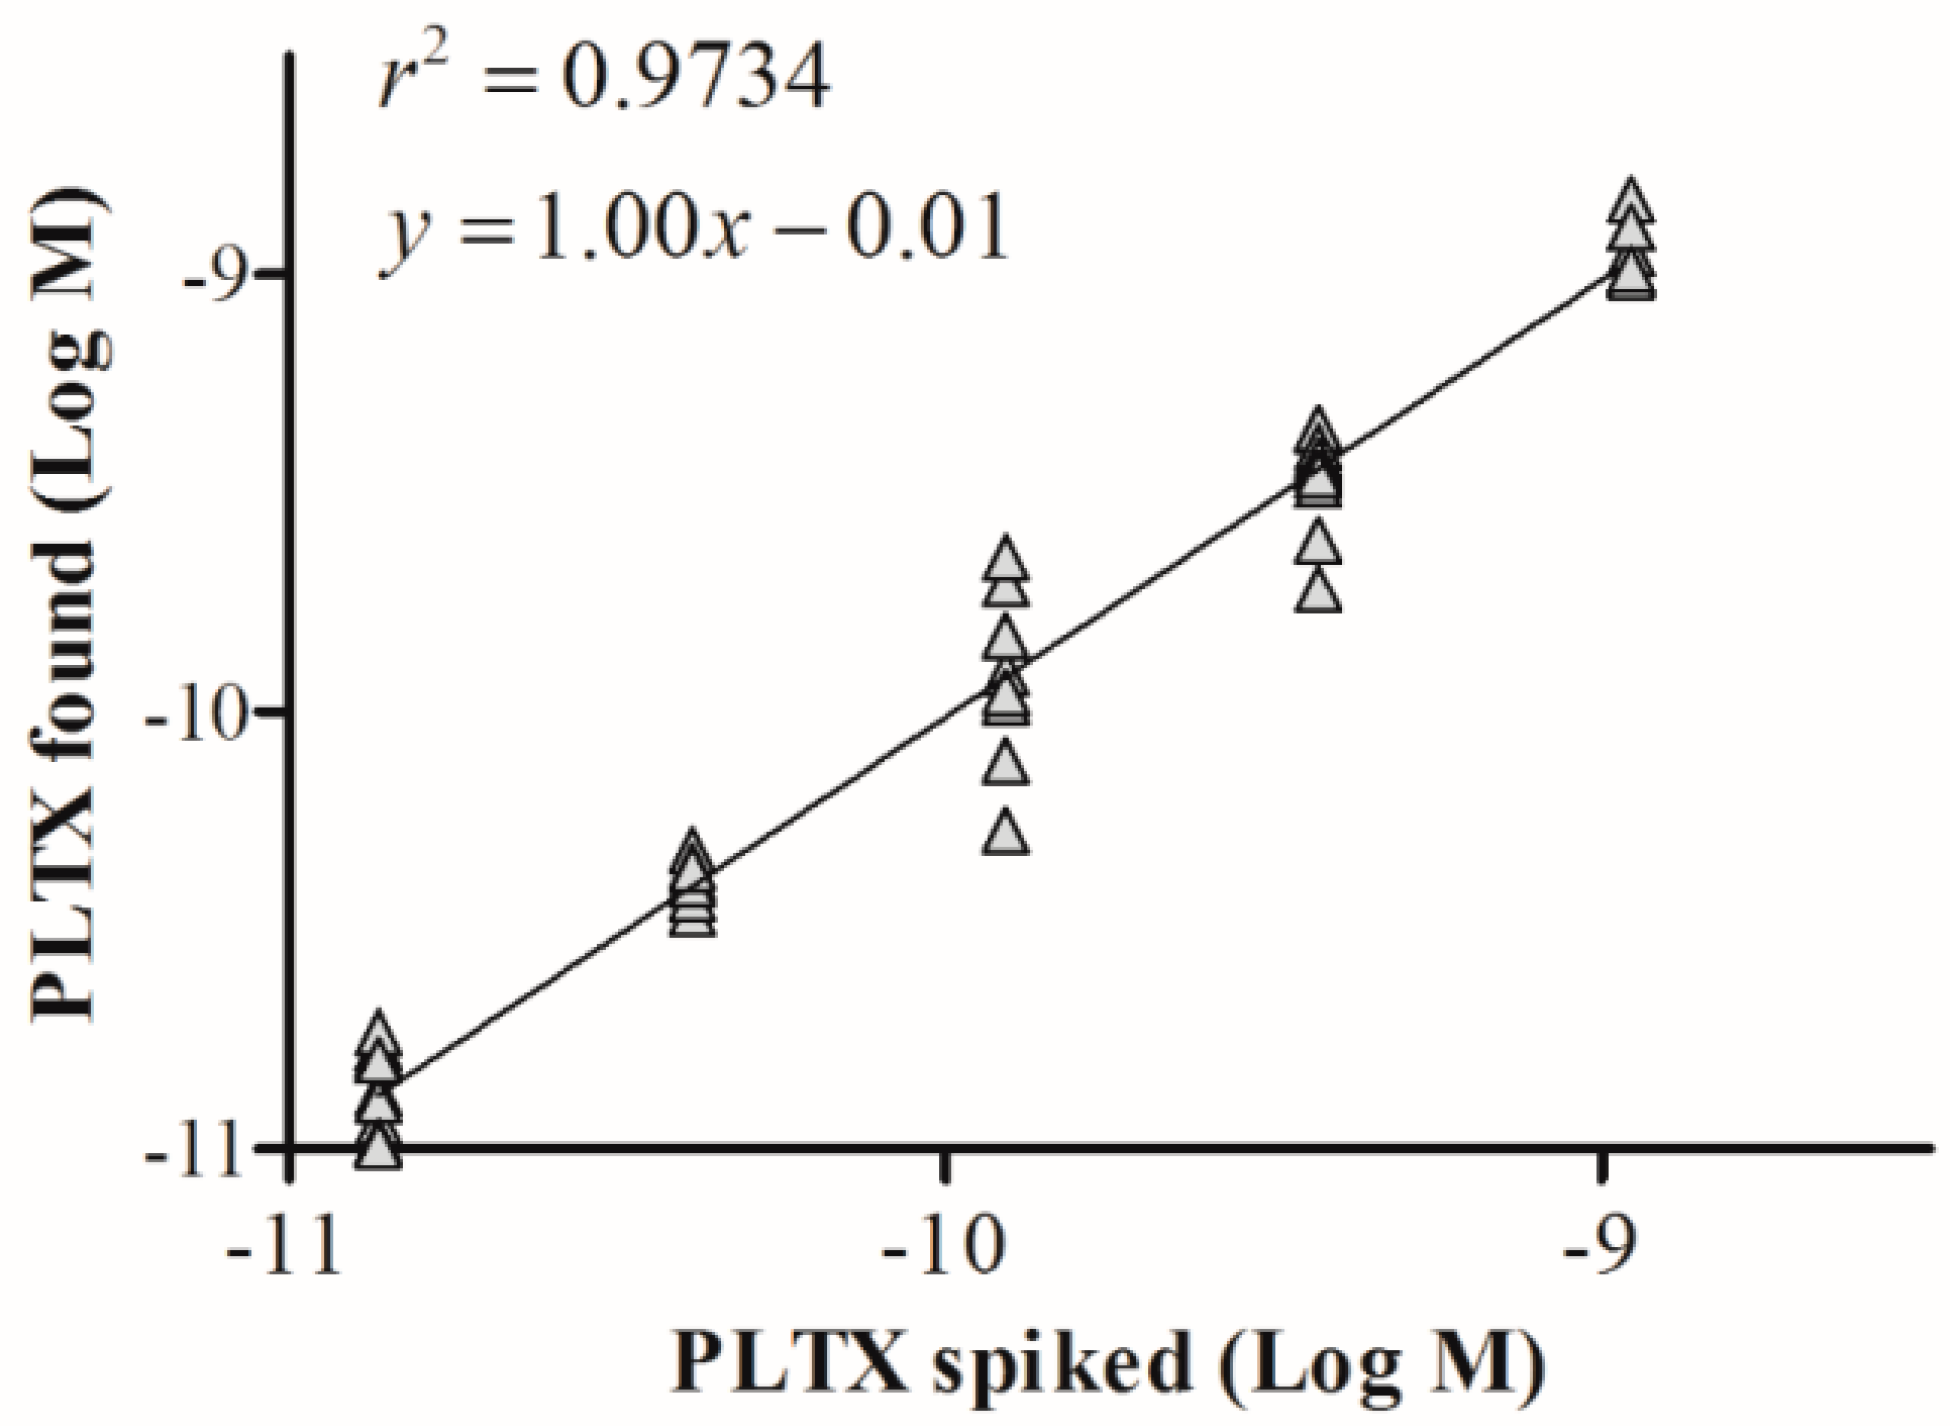
The suitability of the cell-based ELISA for quantitation of PLTX in mussels was evaluated by assessing matrix interference on the assay sensitivity. Dilutions (1:2, 1:5, 1:10, 1:50) of the PLTX-free mussel extract in PBS were spiked with known PLTX amounts. Each extract was then analyzed by the cell-based ELISA and the OD values were compared to those obtained by analyzing the same PLTX concentrations without matrix. The minimum extract dilution that did not interfere with the assay was 1:10 (Supplementary Figure S2). At the same dilution, the solvent alone did not interfere with the assay (data not shown). The linear regression analysis between the results obtained by analyzing the 10-fold diluted mussel extract spiked with PLTX and those obtained by analyzing the same PLTX concentrations without matrix (Figure 7) revealed a good correlation coefficient (r2 = 0.9734) and an excellent mean bias value (mean bias = −1.4%; Table 2). In addition, the estimated LOQ for PLTX in mussels was 3.5 × 10⁻¹¹ M, equal to 9.3 µg/kg mussel meat.
2.6. Recovery of PLTX from Mussels
Recovery experiments were carried out to determine the efficiency of extraction and quantitation of PLTX from mussel meat. Aliquots of PLTX-free mussel homogenate were spiked with PLTX (1.4 × 10⁻¹¹ to 1.1 × 10⁻⁹ M) and subsequently extracted as described above to obtain extracts containing 0.1 g meat equivalent/mL. Extracts were diluted 1:10 and analyzed by the cell-based ELISA. Recovery of PLTX from mussels ranged between 94% and 110% (coefficient of variability: 13–17%; Table 3).
3. Discussion
In recent years, Ostreopsis cf. ovata has bloomed with increasing frequency in temperate areas such as the Mediterranean Sea and along the Atlantic coast of Portugal [31,34]. Peculiar climate changes and marine conditions, high availability of nutrients, and hydrographic conditions characterized by low wave energy may play important roles in this phenomenon [57]. Concomitant with Ostreopsis blooms, PLTXs have been detected in microalgae, aerosolized seawater, and edible marine organisms [30,58,59]. Despite no foodborne poisonings being attributed to PLTX and analogues in this area to date, these toxins can represent a significant public health concern. Therefore, there is a need to develop new detection methods able to quantify PLTXs in seafood at concentrations lower than the maximum limit suggested by EFSA (30 µg PLTX/kg of shellfish meat) [35]. Over the years, various detection methods have been developed, some with limited sensitivity or other limitations, such as significant matrix effects. We developed a cell-based immunoenzymatic assay (cell-based ELISA) that combines the high binding potency of PLTX with the sensitivity and specificity provided by anti-PLTX antibody detection and evaluated it for its ability to accurately quantify PLTX in mussels.
Initially, the sensitivity of different cell lines to PLTX binding was evaluated to select the most suitable cell line. To this aim, different cell lines derived from colon cancer (LoVo, Caco2, HCT-116), pancreatic cancer (PANC-1), hepatic cancer (HepG2), and breast cancer (MCF-7, MDA-MB-231) were considered. In addition, nontumor cell lines were used, such as the HaCaT skin keratinocyte cell line and the immortalized human hepatic (IHH) cell line. A wide distribution of binding parameters (Kd and maximal binding) was observed, suggesting a wide sensitivity range among the different cell lines. Consequently, the HaCaT cell line turned out to be the most sensitive to PLTX binding, corroborating literature data showing that HaCaT keratinocytes are among the cell models most sensitive to the toxin [60]. For these reasons, this cell line was chosen as the most suitable model to develop the cell-based ELISA.
To optimize the method, the influence of the incubation temperature of the antibodies on the assay signal as well as the effects of different cell fixing agents were evaluated. The highest signal was obtained using 4% PFA as a fixative solution and incubating the primary and secondary antibodies at 50 °C. The decreased signal recorded after increasing the incubation temperature of the mAb is probably due to a thermal denaturation of the antibodies [61]. For the fixation phase, we chose formaldehyde, a commonly used fixative that easily diffuses into cells, allowing optimal fixation [62].
Once the final protocol of the assay was defined, an intralaboratory validation demonstrated good sensitivity, accuracy, and repeatability. As expected, with the combination of two sensitive features, PLTX binding to Na+/K+ ATPase of HaCaT cells and its detection by monoclonal antibodies, the sensitivity of the cell-based ELISA was higher than that of other PLTX immunoassays [46,48]. In addition, this assay was almost 35 time more sensitive than the indirect sandwich ELISA (estimated LOD = 1.1 ng/mL) developed by our group [47]. With respect to the latter, a significant improvement was achieved in terms of not only sensitivity but also assay time (less than 3 h compared to about 6 h for the sandwich ELISA). Moreover, the sensitivity of the cell-based ELISA, expressed as LOD value (estimated at 1.2 × 10⁻¹¹ M, 32.2 pg/mL) was more than 400 times higher than that of LC-HRMS [36]. Similarly, the estimated LOD was more than 10-fold more sensitive than an SPR-based immunoassay [50] and about twofold more sensitive than the carbon nanotube–based biosensor (70 pg/mL) developed by Zamolo et al. [51]. On the other hand, the sensitivity of the cell-based ELISA was lower than that of the immunoassay (0.5 pg/mL) developed by Garet et al. [49], who employed a single-chain antibody isolated by phage display technology. However, cross-reactivity with other toxins was not investigated and, as discussed later, the method was affected by variable toxin recovery from mussels, hindering its use for PLTX quantitation in this matrix.
The specificity of the cell-based ELISA for PLTX was demonstrated by the lack of cross-reactivity toward other marine algal toxins contaminating seafood [63] and potentially co-occurring with PLTX in edible marine organisms. Moreover, the interference of mussel extract was minimal, as demonstrated by the 1:10 extract dilution that did not interfere with the assay. The 80% aqueous methanol was chosen as an extraction solvent based upon previous studies demonstrating that it is the most suitable for PLTX extraction as assessed by LC-HRMS [64] and the sandwich ELISA [47]. The estimated LOQ of the cell-based ELISA for PLTX in mussels was 9.3 µg PLTX/kg mussel meat, about three times lower than the safety limit suggested by EFSA (30 µg PLTXs/kg of shellfish meat). This result, together with the excellent toxin recovery from mussels (94–110%), suggests the ability of this novel cell-based ELISA to quantify PLTX in mussels with good precision. This is further supported by the good recovery recorded also at very low concentration (1.37 × 10⁻¹¹ M), even lower than that of the estimated LOQ, strengthening the ability of the cell-based ELISA to accurately quantify the toxin in mussels at very low concentrations.
On the contrary, despite its higher sensitivity, the immunoassay of Garet and colleagues [49] suffers from variable toxin recovery from mussels (64–113%), impairing its suitability for PLTX detection in this matrix. Similarly, significant interference by mussel matrix was observed for other methods, such as the hemolytic assay (LOQ = 640 µg PLTX equivalent/kg mussel meat) [42] and the lactate dehydrogenase–based hemolytic biosensor [43], for which a 1:50 dilution of the mussel extract was necessary. Furthermore, the sensitivity of the cell-based ELISA to quantify PLTX in mussels is higher than that of other antibody-based assays, such as the flow cytometry–based immunoassay (LOQ from 374 to 4430 µg/kg), which required at least a 30-fold extract dilution to avoid matrix effect [50]. In addition, the estimated LOQ of the cell-based ELISA for PLTX in mussels was close to that of other detection methods, such as the sandwich ELISA (11 µg/kg meat) [47], the carbon nanotube–based biosensor (2.2 µg/kg meat) [51], and LC-HRMS (15 µg/kg meat) [36]. However, it must be considered that the cell-based ELISA is a simple, fast, and inexpensive method. Moreover, due to its high sensitivity in buffer solution, it could be further exploited for its suitability to detect and quantify PLTX in other matrices.
4. Conclusions
In conclusion, the combination of PLTX binding to Na+/K+ ATPase with PLTX detection by specific antibodies allowed the development of a novel and sensitive cell-based immunoenzymatic assay for PLTX detection. This combination resulted in higher sensitivity as compared to other very sensitive methods. Hence, the cell-based ELISA described here is sensitive, repeatable, and accurate, and is able to quantify PLTX in mussels at concentrations lower than the maximum limit suggested by EFSA (30 µg PLTX/kg shellfish meat). Thus, the high sensitivity, specificity, and rapidity make the cell-based ELISA a suitable method for PLTX screening in mussels during monitoring programs. Further studies are in progress to characterize the ability of the cell-based ELISA to detect and quantify PLTX in other frequently contaminated matrices, such as other shellfish, fish, crabs, and other seafood.
5. Materials and Methods
5.1. Chemicals
Palytoxin, isolated from Palythoa tuberculosa (purity > 90%), was purchased from Wako Pure Chemicals Industries Ltd. (Osaka, Japan). Yessotoxin and maitotoxin were kindly provided by Prof. T. Yasumoto (Japan Food Research Laboratories, Tokyo, Japan). Brevetoxin-3, saxitoxin, and azaspiracid-1 were supplied by Dr. M. Poli (U.S. Army Medical Research Institute of Infectious Diseases, Ft. Detrick, MD, USA), Dr. F. Van Dolah (National Oceanic and Atmospheric Administration, Charleston, SC, USA), and Dr. J. Kilcoyne (Marine Institute, Rinville, Oranmore, County Galway, Ireland), respectively. Okadaic and domoic acids were purchased from Sigma-Aldrich (Milan, Italy). The mouse monoclonal anti-palytoxin antibody 73D3 (mAb-PLTX) was produced and purified from a hybridoma cell culture at the U.S. Army Medical Research Institute of Infectious Diseases (Ft. Detrick, MD, USA). The horseradish peroxidase (HRP)-conjugated anti-mouse immunoglobulin G (IgG) was purchased from Jackson ImmunoResearch (Newmarket, UK). HaCaT cell line was purchased from Cell Line Service (DKFZ, Eppelheim, Germany), and all cell culture reagents were purchased from EuroClone (Milan, Italy). All other reagents were of analytical grade and purchased from Sigma-Aldrich (Milan, Italy).
5.2. Cell Cultures
HaCaT, PANC-1, and HCT-116 cells were cultured in Dulbecco’s Modified Eagle’s Medium (DMEM) high glucose, supplemented with 10% fetal bovine serum, L-glutamine (1.0 × 10⁻² M), penicillin (1.0 × 10⁻⁴ g/mL), and streptomycin (1.0 × 10⁻⁴ g/mL). HepG2 and Caco2 cells were maintained in Eagle’s Minimal Essential Medium (EMEM) with the addition of 10% fetal bovine serum (FBS), L-glutamine (1.0 × 10⁻² M), penicillin (1.0 × 10⁻⁴ g/mL) and streptomycin (1.0 × 10⁻⁴ g/mL), and 1% sodium pyruvate 100 mM. LoVo, MCF-7, and MDA-MB-231 cells were maintained in RPMI 1640 containing 10% FBS, L-glutamine (1.0 × 10⁻² M), penicillin (1.0 × 10⁻⁴ g/mL), and streptomycin (1.0 × 10⁻⁴ g/mL). IHH cells were maintained in DMEM medium-high glucose with the addition of 10% FBS, 1.25% L-glutamine 200 mM, penicillin (1.0 × 10⁻⁴ g/mL) and streptomycin (1.0 × 10⁻⁴ g/mL), 1% HEPES buffer 1 M, 0.01% human insulin 10−4 M, and 0.04% dexamethasone 1 mg/mL.
Cell cultures were maintained according to standard procedures in a humidified incubator at 37 °C with 5% CO2, and cell passage was performed at confluence once per week.
5.3. Experimental Design
- Development of the cell-based ELISA. The cell-based ELISA was developed starting from the protocol used to characterize PLTX binding to cultured cells reported by Pelin et al. [54]. Cells were seeded in 96-well plates (1.5 × 10⁴ cells/well) and cultured for 3 days. The assay procedure consisted of the following steps: (i) cell exposure to PLTX (5.1 × 10⁻¹³ to 1.0 × 10⁻⁸ M) for 10 min at 37 °C, followed by washing away unbound toxin with PBS; (ii) cell fixation with 4% PFA for 30 min; (iii) blocking with TBB buffer (50 mM Tris-HCl, 0.15 M NaCl, 2% bovine serum albumin (BSA), and 0.2% Tween 20, pH 7.5) containing 10% HS for 30 min, followed by washing with PBS; (iv) incubation with mouse monoclonal anti-PLTX antibody (2 µg/mL; primary antibody) for 1 h at room temperature (RT) followed by washing with PBS containing 0.1% Tween 20 and PBS; (v) incubation with 1:6000 HRP-conjugated anti-mouse IgG (secondary antibody) for 1 h at 37 °C, followed by washing with PBS containing 0.1% Tween 20 and PBS; (vi) incubation with 60 µL/well of tetramethylbenzidine (TMB) chromogen and hydrogen peroxide substrate for 20 min; (vii) stopping the colorimetric reaction by 1 M H2SO4 (30 µL/well); and (viii) measuring the optical density at 450 nm (Spectra® photometer, Tecan Italia, Milan, Italy).
- Assay optimization. The assay was optimized by varying the following parameters: (i) type of cell line, (ii) fixative agents and temperature of incubation with primary and secondary antibodies, (iii) sequence of cell fixation and cell exposure to PLTX, (iv) blocking agents, and (v) dilution of the primary antibody.
- Assay characterization. The optimized assay was characterized following the Eurachem Guide [64] as described in the Statistical Analysis section.
5.4. Evaluation of Mussel Matrix Effect
The suitability of the cell-based ELISA for PLTX quantitation in mussels was assessed using different extracts from edible parts of Mytilus galloprovincialis collected in the Gulf of Trieste (Trieste, Italy). Shucked mussel meat (200 g) was homogenized using an Ultra-Turrax (Ika-Werk; Staufen, Germany) at 14,000 rpm and room temperature, until a homogeneous pulp was obtained (about 5 min). Mussel homogenate (1 g) was extracted 3 times with 3 mL 80% aqueous MeOH by Ultra-Turrax homogenization (14,000 rpm, 3 min) followed by centrifugation at 5500 rpm for 30 min. The supernatants were then pooled and the volume adjusted to 10 mL with 80% aqueous methanol to obtain 0.1 g mussel meat equivalent/mL. The extract was analyzed by LC-MS/MS (Thermo-Fisher, San Josè, CA, USA) to confirm the absence of PLTX before the matrix effect evaluation. Then, dilutions (1:2, 1:5, 1:10, and 1:50 in PBS, v/v) of the PLTX-free mussel extract were spiked with known PLTX concentrations to prepare a series of matrix matched samples at PLTX concentrations ranging from 1.4 × 10⁻¹¹ M to 1.1 × 10⁻⁹ M. These samples were then analyzed by the cell-based ELISA and compared to the same PLTX concentrations in solutions free of mussel matrix.
5.5. Evaluation of PLTX Recovery from Mussels
To evaluate the recovery of PLTX from mussels, samples of the PLTX-free mussel homogenate were spiked with known amounts of PLTX and then extracted as described above to obtain extracts containing different theoretic concentrations of PLTX (1.4 × 10⁻¹¹ to 1.1 × 10⁻⁹ M). Each extract was then analyzed by the cell-based ELISA, as previously described.
5.6. Statistical Analysis
PLTX concentrations are reported as mean ± SE of at least 3 independent experiments performed in triplicate, unless otherwise specified. For binding experiments, dissociation constant (Kd) was calculated by a 1-site binding hyperbola nonlinear regression analysis using GraphPad Prism software version 6.0 (GraphPad, Inc., San Diego, CA, USA). Maximal binding was evaluated as the maximal optical density (OD) normalized for the µg of proteins of each sample. Linearity (r2) of the calibration curve was estimated by linear regression analysis, also using GraphPad Prism version 6.0. Data were compared by 2-way ANOVA followed by Bonferroni post test, and significant differences were considered at p values < 0.05.
The optimized assay was characterized according to the international principles defined by the Eurachem Guide [65]: limits of detection (LOD) and quantitation (LOQ) were estimated as PLTX concentration corresponding to the average of the optical density of 10 blank values plus 3 or 10 times the standard deviation, respectively. Repeatability was expressed as relative standard deviation of repeatability (RSDr), measured as % ratio between the standard deviation of independent results and their mean value. Independent results obtained by the same operator in 1 day (intraassay RSDr; n = 6) and by different operators within a 6-month period (interassay RSDr; n = 10) were evaluated. Accuracy was measured as % bias (n = 10), calculated as % difference between PLTX concentration measured by the assay and the theoretical concentration in the sample divided for theoretical PLTX concentrations.
Supplementary Materials
The following are available online at https://0-www-mdpi-com.brum.beds.ac.uk/2072-6651/10/8/329/s1. Figure S1: Cross-reactivity of cell-based ELISA with other marine toxins, Figure S2: Evaluation of mussel matrix effect on cell-based ELISA.
Author Contributions
Conceptualization, M.P., S.S., and A.T.; methodology, V.B. and L.F.; formal analysis, M.P. and S.S.; data curation, M.P., V.B., S.S., and M.P.; writing—original draft preparation, M.P., S.S., and A.T.; writing—review and editing, M.P., S.S., M.P., and A.T.; funding acquisition, A.T.
Funding
This research received no external funding.
Acknowledgments
The authors are grateful to T. Yasumoto (Japan Food Research Laboratories, Tokyo, Japan), F. Van Dolah (National Oceanic and Atmospheric Administration, Charleston, SC, USA), and J. Kilcoyne (Marine Institute, Rinville, Oranmore, County Galway, Ireland) for the generous gifts of yessotoxin, maitotoxin, and azaspiracid-1.
Conflicts of Interest
The authors declare no conflict of interest. The funders had no role in the design of the study, in the collection, analyses, or interpretation of data, in the writing of the manuscript, and in the decision to publish the results.
References
- Moore, R.E.; Scheuer, P.J. Palytoxin: A new marine toxin from a coelenterate. Science 1971, 172, 495–498. [Google Scholar] [CrossRef] [PubMed]
- Ciminiello, P.; Dell’Aversano, C.; Dello Iacovo, E.; Fattorusso, E.; Forino, M.; Grauso, L.; Tartaglione, L.; Florio, C.; Lorenzon, P.; De Bortoli, M.; et al. Stereostructure and biological activity of 42-Hydroxy-palytoxin: A new palytoxin analogue from Hawaiian Palythoa subspecies. Chem. Res. Toxicol. 2009, 22, 1851–1859. [Google Scholar] [CrossRef] [PubMed]
- Ciminiello, P.; Dell’Aversano, C.; Dello Iacovo, E.; Forino, M.; Tartaglione, L.; Pelin, M.; Sosa, S.; Tubaro, A.; Chaloin, O.; Poli, M.; et al. Stereoisomers of 42-hydroxy palytoxin from Hawaiian Palythoa toxica and P. tuberculosa: Stereostructure elucidation, detection, and biological activities. J. Nat. Prod. 2014, 77, 351–357. [Google Scholar] [CrossRef] [PubMed]
- Deeds, J.R.; Handy, S.M.; White, K.D.; Reimer, J.D. Palytoxin found in Palythoa sp. zoanthids (Anthozoa, Hexacorallia) sold in the home aquarium trade. PLoS ONE 2011, 6, 18235. [Google Scholar] [CrossRef] [PubMed]
- Tartaglione, L.; Pelin, M.; Morpurgo, M.; Dell’Aversano, C.; Montenegro, J.; Sacco, G.; Sosa, S.; Reimer, J.D.; Ciminiello, P.; Tubaro, A. An aquarium hobbyist poisoning: Identification of new palytoxins in Palythoa cf. toxica and complete detoxification of the aquarium water by activated carbon. Toxicon 2016, 121, 41–50. [Google Scholar] [CrossRef] [PubMed]
- Pelin, M.; Brovedani, V.; Sosa, S.; Tubaro, A. Palytoxin-Containing Aquarium Soft Corals as an Emerging Sanitary Problem. Mar. Drugs 2016, 14, 33. [Google Scholar] [CrossRef] [PubMed] [Green Version]
- Fraga, M.; Vilariño, N.; Louzao, M.C.; Molina, L.; López, Y.; Poli, M.; Botana, L.M. First Identification of Palytoxin-Like Molecules in the Atlantic Coral Species Palythoa canariensis. Anal. Chem. 2017, 89, 7438–7446. [Google Scholar] [CrossRef] [PubMed]
- Gleibs, S.; Mebs, D.; Werding, B. Studies on the origin and distribution of palytoxin in a Caribbean coral reef. Toxicon 1995, 33, 1531–1537. [Google Scholar] [CrossRef]
- Ciminiello, P.; Dell’Aversano, C.; Fattorusso, E.; Forino, M.; Tartaglione, L.; Grillo, C.; Melchiorre, N. Putative palytoxin and its new analogue, ovatoxin-a, in Ostreopsis ovata collected along the Ligurian coasts during the 2006 toxic outbreak. J. Am. Soc. Mass. Spectrom 2008, 19, 111–120. [Google Scholar] [CrossRef] [PubMed]
- Lenoir, S.; Ten-Hage, L.; Turquet, J.; Quod, J.P.; Bernard, C.; Hennion, M.C. First evidence of palytoxin analogues from an Ostreopsis mascarenensis (Dinophyceae) bentic bloom in Southwestern Indian Ocean. J. Phycol. 2004, 40, 1042–1051. [Google Scholar] [CrossRef]
- Ukena, T.; Satake, M.; Usami, M.; Oshima, Y.; Naoki, H.; Fujita, T.; Kan, Y.; Yasumoto, T. Structure elucidation of ostreocin D, a palytoxin analog isolated from the dinoflagellate Ostreopsis siamensis. Biosci. Biotechnol. Biochem. 2001, 65, 2585–2588. [Google Scholar] [CrossRef] [PubMed]
- Garcia-Altares, M.; Tartaglione, L.; Dell’Aversano, C.; Carnicer, O.; De la Iglesia, P.; Forino, M.; Diogene, J.; Ciminiello, P. The novel ovatoxin-g and isobaric palytoxin (so far referred to as putative palytoxin) from Ostreopsis cf. ovata (NW Mediterranean Sea): Structural insights by LC-high resolution MS. Anal. Bioanal. Chem. 2015, 407, 1191–1204. [Google Scholar] [CrossRef] [PubMed]
- Brissard, C.; Herrenknecht, C.; Sechet, V.; Herve, F.; Pisapia, F.; Harcouet, J.; Lemee, R.; Chomerat, N.; Hess, P.; Amzil, Z. Complex toxin profile of French Mediterranean Ostreopsis cf. ovata strains, seafood accumulation and ovatoxins prepurification. Mar. Drugs 2014, 12, 2851–2876. [Google Scholar] [CrossRef] [PubMed] [Green Version]
- Amzil, Z.; Sibat, M.; Chomerat, N.; Grossel, H.; Marco-Miralles, F.; Lemee, R.; Nezan, E.; Sechet, V. Ovatoxin-a and palytoxin accumulation in seafood in relation to Ostreopsis cf. ovata blooms on the French Mediterranean coast. Mar. Drugs 2012, 10, 477–496. [Google Scholar] [CrossRef] [PubMed]
- Rossi, R.; Castellano, V.; Scalco, E.; Serpe, L.; Zingone, A.; Soprano, V. New palytoxin-like molecules in Mediterranean Ostreopsis cf. ovata (dinoflagellates) and in Palythoa tuberculosa detected by liquid chromatography-electrospray ionization time-of-flight mass spectrometry. Toxicon 2010, 56, 1381–1387. [Google Scholar] [CrossRef] [PubMed]
- Kerbrat, A.S.; Amzil, Z.; Pawlowiez, R.; Golubic, S.; Sibat, M.; Darius, H.T.; Chinain, M.; Laurent, D. First evidence of palytoxin and 42-hydroxy-palytoxin in the marine cyanobacterium Trichodesmium. Mar. Drugs 2011, 9, 543–660. [Google Scholar] [CrossRef] [PubMed]
- Tubaro, A.; Del Favero, G.; Beltramo, D.; Ardizzone, M.; Forino, M.; De Bortoli, M.; Pelin, M.; Poli, M.; Bignami, G.; Ciminiello, P.; et al. Acute oral toxicity in mice of a new palytoxin analog: 42-hydroxy-palytoxin. Toxicon 2011, 57, 755–763. [Google Scholar] [CrossRef] [PubMed]
- Ito, E.; Yasumoto, T. Toxicological studies on palytoxin and ostreocin-D administered to mice by three different routes. Toxicon 2009, 54, 244–251. [Google Scholar] [CrossRef] [PubMed]
- Ares, I.R.; Cagide, E.; Louzao, M.C.; Espiña, B.; Vieytes, M.R.; Yasumoto, T.; Botana, L.M. Ostreocin-D impact on globular actin of intact cells. Chem. Res. Toxicol. 2009, 22, 374–381. [Google Scholar] [CrossRef] [PubMed]
- Usami, M.; Satake, M.; Ishida, S.; Inoue, A.; Kan, Y.; Yasumoto, T. Palytoxin analogs from the dinoflagellate Ostreopsis siamensis. J. Am. Chem. Soc. 1995, 117, 5389–5390. [Google Scholar] [CrossRef]
- Ciminiello, P.; Dell’Aversano, C.; Dello Iacovo, E.; Fattorusso, E.; Forino, M.; Grauso, L.; Tartaglione, L.; Guerrini, F.; Pezzolesi, L.; Pistocchi, R.; et al. Isolation and structure elucidation of ovatoxin-a, the major toxin produced by Ostreopsis ovata. J. Am. Chem. Soc. 2012, 134, 1869–1875. [Google Scholar] [CrossRef] [PubMed]
- Pelin, M.; Forino, M.; Brovedani, V.; Tartaglione, L.; Dell’Aversano, C.; Pistocchi, R.; Poli, M.; Sosa, S.; Florio, C.; Ciminiello, P.; et al. Ovatoxin-a, A palytoxin analogue isolated from Ostreopsis cf. ovata Fukuyo: Cytotoxic activity and ELISA detection. Environ. Sci. Technol. 2016, 50, 1544–1551. [Google Scholar] [CrossRef] [PubMed]
- Poli, M.; Ruiz-Olvera, P.; Nalca, A.; Ruiz, S.; Livingston, V.; Frick, O.; Dyer, D.; Schellhase, C.; Raymond, J.; Kulis, D.; et al. Toxicity and pathophysiology of palytoxin congeners after intraperitoneal and aerosol administration in rats. Toxicon 2018, 150, 235–250. [Google Scholar] [CrossRef] [PubMed]
- Biré, R.; Trotereau, S.; Lemée, R.; Delpont, C.; Chabot, B.; Aumond, Y.; Krys, S. Occurrence of palytoxins in marine organisms from different trophic levels of the French Mediterranean coast harvested in 2009. Harmful Algae 2013, 28, 10–22. [Google Scholar] [CrossRef]
- Gleibs, S.; Mebs, D. Distribution and sequestration of palytoxin in coral reef animals. Toxicon 1999, 37, 1521–1527. [Google Scholar] [CrossRef]
- Deeds, J.R.; Schwartz, M.D. Human risk associated with palytoxin exposure. Toxicon 2010, 56, 150–162. [Google Scholar] [CrossRef] [PubMed] [Green Version]
- Tubaro, A.; Durando, P.; Del Favero, G.; Ansaldi, F.; Icardi, G.; Deeds, J.R.; Sosa, S. Case definitions for human poisonings postulated to palytoxins exposure. Toxicon 2011, 57, 478–495. [Google Scholar] [CrossRef] [PubMed]
- Wu, M.L.; Yang, C.C.; Deng, J.F.; Wang, K.Y. Hyperkalemia, hyperphosphatemia, acute kidney injury, and fatal dysrhythmias after consumption of palytoxin contaminated goldspot herring. Ann. Emerg. Med. 2014, 64, 633–636. [Google Scholar] [CrossRef] [PubMed]
- Patocka, J.; Nepovimova, E.; Wu, Q.; Kuca, K. Palytoxin congeners. Arch. Toxicol. 2018, 92, 143–156. [Google Scholar] [CrossRef] [PubMed]
- Del Favero, G.; Sosa, S.; Pelin, M.; D’Orlando, E.; Florio, C.; Lorenzon, P.; Poli, M.; Tubaro, A. Sanitary problems related to the presence of Ostreopsis spp. in the Mediterranean Sea: A multidisciplinary scientific approach. Ann. Ist. Super. Sanita 2012, 48, 407–414. [Google Scholar] [CrossRef] [PubMed]
- Silva, M.; Pratheepa, V.K.; Botana, L.M.; Vasconcelos, V. Emergent toxins in North Atlantic temperate waters: A challenge for monitoring programs and legislation. Toxins (Basel) 2015, 7, 859–885. [Google Scholar] [CrossRef] [PubMed]
- Durando, P.; Ansaldi, F.; Oreste, P.; Moscatelli, P.; Marensi, L.; Grillo, C.; Gasparini, R.; Icardi, G. Collaborative Group for the Ligurian Syndromic Algal Surveillance. Ostreopsis ovata and human health: Epidemiological and clinical features of respiratory syndrome outbreaks from a two-year syndromic surveillance, 2005-06, in north-west Italy. Euro Surveill. 2007, 12, E070607.1. [Google Scholar] [PubMed]
- Tichadou, L.; Glaizal, M.; Armengaud, A.; Grossel, H.; Lemée, R.; Kantin, R.; Lasalle, J.L.; Drouet, G.; Rambaud, L.; Malfait, P.; et al. Health impact of unicellular algae of the Ostreopsis genus blooms in the Mediterranean Sea: Experience of the French Mediterranean coast surveillance network from 2006 to 2009. Clin. Toxicol. 2010, 48, 839–844. [Google Scholar] [CrossRef] [PubMed]
- Rhodes, L. World-wide occurrence of the toxic dinoflagellate genus Ostreopsis Schmidt. Toxicon 2011, 57, 400–407. [Google Scholar] [CrossRef] [PubMed]
- EFSA. Scientific Opinion on marine biotoxins in shellfish-Palytoxin group: Marine Biotoxins in Shellfish-Palytoxin group. EFSA J. 2009, 7, 1393. [Google Scholar] [CrossRef]
- Ciminiello, P.; Dell’Aversano, C.; Dello Iacovo, E.; Forino, M.; Tartaglione, L. Liquid chromatography-high-resolution mass spectrometry for palytoxins in mussels. Anal. Bioanal. Chem. 2015, 407, 1463–1473. [Google Scholar] [CrossRef] [PubMed]
- Wunschel, D.S.; Valenzuela, B.R.; Kaiser, B.L.D.; Victry, K.; Woodruff, D. Method development for comprehensive extraction and analysis of marine toxins: Liquid-liquid extraction and tandem liquid chromatography separations coupled to electrospray tandem mass spectrometry. Talanta 2018, 187, 302–307. [Google Scholar] [CrossRef] [PubMed]
- Habermann, E.; Ahnert-Hilger, G.; Chhatwal, G.S.; Beress, L. Delayed haemolytic action of palytoxin. General characteristics. Biochim. Biophys. Acta 1981, 649, 481–486. [Google Scholar] [CrossRef]
- Bignami, G.S. A rapid and sensitive hemolysis neutralization assay for palytoxin. Toxicon 1993, 31, 817–820. [Google Scholar] [CrossRef]
- Riobò, P.; Paz, B.; Franco, J.M.; Vazquez, J.A.; Murado, M.A. Proposal for a simple and sensitive haemolytic assay for palytoxin: Toxicological dynamics, kinetics, ouabain inhibition and thermal stability. Harmful Algae 2008, 7, 415–429. [Google Scholar] [CrossRef] [Green Version]
- Seemann, P.; Gernert, C.; Schmitt, S.; Mebs, D.; Hentschel, U. Detection of hemolytic bacteria from Palythoa caribaeorum (Cnidaria, Zoantharia) using a novel palytoxin-screening assay. Antonie Van Leeuwenhoek 2009, 96, 405–411. [Google Scholar] [CrossRef] [PubMed]
- Brovedani, V.; Sosa, S.; Poli, M.; Forino, M.; Varello, K.; Tubaro, A.; Pelin, M. A revisited hemolytic assay for palytoxin detection: Limitations for its quantitation in mussels. Toxicon 2016, 119, 225–233. [Google Scholar] [CrossRef] [PubMed] [Green Version]
- Volpe, G.; Cozzi, L.; Migliorelli, D.; Croci, L.; Palleschi, G. Development of a haemolytic-enzymatic assay with mediated amperometric detection for palytoxin analysis: Application to mussels. Anal. Bioanal. Chem. 2014, 406, 2399–2410. [Google Scholar] [CrossRef] [PubMed]
- Alfonso, A.; Fernández-Araujo, A.; Alfonso, C.; Caramés, B.; Tobio, A.; Louzao, M.C.; Vieytes, M.R.; Botana, L.M. Palytoxin detection and quantification using the fluorescence polarization technique. Anal. Biochem. 2012, 424, 64–70. [Google Scholar] [CrossRef] [PubMed]
- Alfonso, A.; Pazos, M.J.; Fernández-Araujo, A.; Tobio, A.; Alfonso, C.; Vieytes, M.R.; Botana, L.M. Surface plasmon resonance biosensor method for palytoxin detection based on Na+,K+-ATPase affinity. Toxins 2013, 6, 96–107. [Google Scholar] [CrossRef] [PubMed]
- Bignami, G.S.; Raybould, T.J.; Sachinvala, N.D.; Grothaus, P.G.; Simpson, S.B.; Lazo, C.B.; Byrnes, J.B.; Moore, R.E.; Vann, D.C. Monoclonal antibody-based enzyme-linked immunoassays for the measurement of palytoxin in biological samples. Toxicon 1992, 30, 687–700. [Google Scholar] [CrossRef]
- Boscolo, S.; Pelin, M.; De Bortoli, M.; Fontanive, G.; Barreras, A.; Berti, F.; Sosa, S.; Chaloin, O.; Bianco, A.; Yasumoto, T.; et al. Sandwich ELISA assay for the quantitation of palytoxin and its analogs in natural samples. Environ. Sci. Technol. 2013, 47, 2034–2042. [Google Scholar] [CrossRef] [PubMed]
- Frolova, G.M.; Kuznetsova, T.A.; Mikhaĭlov, V.V.; Eliakov, G.B. Immunoenzyme method for detecting microbial producers of palytoxin. Bioorg. Khim. 2000, 26, 315–320. [Google Scholar] [PubMed]
- Garet, E.; Cabado, A.G.; Vieites, J.M.; González-Fernández, A. Rapid isolation of single-chain antibodies by phage display technology directed against one of the most potent marine toxins: Palytoxin. Toxicon 2010, 55, 1519–1526. [Google Scholar] [CrossRef] [PubMed]
- Yakes, B.J.; DeGrasse, S.L.; Poli, M.; Deeds, J.R. Antibody characterization and immunoassays for palytoxin using an SPR biosensor. Anal. Bioanal. Chem. 2011, 400, 2865–2869. [Google Scholar] [CrossRef] [PubMed]
- Zamolo, V.A.; Valenti, G.; Venturelli, E.; Chaloin, O.; Marcaccio, M.; Boscolo, S.; Castagnola, V.; Sosa, S.; Berti, F.; Fontanive, G.; et al. Highly sensitive electrochemiluminescent nanobiosensor for the detection of palytoxin. ACS Nano 2012, 6, 7989–7997. [Google Scholar] [CrossRef] [PubMed]
- Fraga, M.; Vilariño, N.; Louzao, M.C.; Fernández, D.A.; Poli, M.; Botana, L.M. Detection of palytoxin-like compounds by a flow cytometry-based immunoassay supported by functional and analytical methods. Anal. Chim. Acta 2016, 903, 1–12. [Google Scholar] [CrossRef] [PubMed]
- Gao, S.; Zheng, X.; Hu, B.; Sun, M.; Wu, J.; Jiao, B.; Wang, L. Enzyme-linked, aptamer-based, competitive biolayer interferometry biosensor for palytoxin. Biosens. Bioelectron. 2017, 89, 952–958. [Google Scholar] [CrossRef] [PubMed]
- Pelin, M.; Boscolo, S.; Poli, M.; Sosa, S.; Tubaro, A.; Florio, C. Characterization of palytoxin binding to HaCaT cells using a monoclonal anti-palytoxin antibody. Mar. Drugs 2013, 11, 584–598. [Google Scholar] [CrossRef] [PubMed]
- Habermann, E.; Chhatwal, G.S. Ouabain inhibits the increase due to palytoxin of cation permeability of erythrocytes. Naunyn Schmiedebergs Arch. Pharmacol. 1982, 319, 101–107. [Google Scholar] [CrossRef] [PubMed]
- Vale-González, C.; Gómez-Limia, B.; Vieytes, M.R.; Botana, L.M. Effects of the marine phycotoxin palytoxin on neuronal pH in primary cultures of cerebellar granule cells. J. Neurosci. Res. 2007, 85, 90–98. [Google Scholar] [CrossRef] [PubMed]
- Barone, R.; Prisinzano, A. Peculiarità comportamentale del dinoflagellato Ostreopsis ovata Fukuyo (Dinophyceae): la strategia del ragno. Naturalista Sicil. 2006, 30, 401–418. [Google Scholar]
- Ciminiello, P.; Dell’Aversano, C.; Iacovo, E.D.; Fattorusso, E.; Forino, M.; Tartaglione, L.; Benedettini, G.; Onorari, M.; Serena, F.; Battocchi, C.; et al. First Finding of Ostreopsis cf. ovata Toxins in Marine Aerosols. Environ. Sci. Technol. 2014, 48, 3532–3540. [Google Scholar] [CrossRef] [PubMed]
- Aligizaki, K.; Katikou, P.; Milandri, A.; Diogène, J. Occurrence of palytoxin-group toxins in seafood and future strategies to complement the present state of the art. Toxicon 2011, 57, 390–399. [Google Scholar] [CrossRef] [PubMed]
- Pelin, M.; Zanette, C.; De Bortoli, M.; Sosa, S.; Della Loggia, R.; Tubaro, A.; Florio, C. Effects of the marine toxin palytoxin on human skin keratinocytes: Role of ionic imbalance. Toxicology 2011, 282, 30–38. [Google Scholar] [CrossRef] [PubMed]
- Hartmann, W.K.; Saptharishi, N.; Yang, X.Y.; Mitra, G.; Soman, G. Characterization and analysis of thermal denaturation of antibodies by size exclusion high-performance liquid chromatography with quadruple detection. Anal. Biochem. 2004, 325, 227–239. [Google Scholar] [CrossRef] [PubMed]
- Thavarajah, R.; Mudimbaimannar, V.K.; Elizabeth, J.; Rao, U.K.; Ranganathan, K. Chemical and physical basics of routine formaldehyde fixation. J. Oral Maxillofac. Pathol. 2012, 16, 400–405. [Google Scholar] [CrossRef] [PubMed]
- Munday, R.; Reeve, J. Risk assessment of shellfish toxins. Toxins 2013, 5, 2109–2137. [Google Scholar] [CrossRef] [PubMed]
- Ciminiello, P.; Dell’Aversano, C.; Dello Iacovo, E.; Fattorusso, E.; Forino, M.; Tartaglione, L.; Rossi, R.; Soprano, V.; Capozzo, D.; Serpe, L. Palytoxin in seafood by liquid chromatography tandem mass spectrometry: Investigation of extraction efficiency and matrix effect. Anal. Bioanal. Chem. 2011, 401, 1043–1050. [Google Scholar] [CrossRef] [PubMed]
- Eurachem Guide: The Fitness for Purpose of Analytical Methods—A Laboratory Guide to Method Validation and Related Topics. Available online: https://www.eurachem.org/images/stories/Guides/pdf/MV_guide_2nd_ed_EN.pdf (accessed on 20 May 2018).
Figure 1.
Palytoxin (PLTX) binding evaluated on a panel of different cell lines, detected by a monoclonal mouse anti-PLTX antibody targeted by horseradish peroxidase (HRP)-conjugated anti-mouse immunoglobulin G. (A) Saturation curves of PLTX binding. Box plots showing (B) distribution of Kd values and (C) maximal bindings obtained by the binding assay for PLTX. Results are expressed as mean ± SE of three experiments performed in triplicate.

Figure 2.
Optimization of the cell-based ELISA. Influence of temperature during cell incubation with the antibodies on the assay signal, using (A) 4% paraformaldehyde (PFA), (B) 4% PFA + 1% glutaraldehyde, or (C) neutral-buffered formalin (NBF) as fixative solutions. (D) Influence of the three fixative solutions on the assay signal with antibody incubation at 50 °C. Each point represents mean ± SE of three experiments. Statistical differences: * p < 0.05; ** p < 0.01; *** p < 0.001 (two-way ANOVA and Bonferroni post test).

Figure 3.
Optimization of the cell-based ELISA. (A) Temporal change between the fixation phase (4% PFA) and cell treatment with PLTX (4.1 × 10⁻¹¹–1.0 × 10⁻⁸ M); (B) influence of three blocking agents on the assay signal; (C) influence of primary antibody dilution on the assay signal. Each point represents mean ± SE of three experiments. Statistical differences: ** p < 0.01; *** p < 0.001 (two-way ANOVA and Bonferroni post test).

Figure 4.
(A) Calibration curve of cell-based ELISA for PLTX quantitation. Each point represents mean ± SE of 10 different experiments. (B) Linear regression analysis performed within the working range of the cell-based ELISA (1.4 × 10⁻¹¹ to 1.1 × 10⁻⁹ M) by plotting theoretical PLTX concentrations against toxin concentrations measured by the cell-based ELISA (n = 10).

Figure 5.
Repeatability of the cell-based ELISA. Linear regression analysis performed within the working range of the assay (1.4 × 10⁻¹¹ to 1.1 × 10⁻⁹ M) by plotting theoretical PLTX concentrations against toxin concentrations measured by the cell-based ELISA. (A) Intraday repeatability (one day, n = 6); (B) interday repeatability (6 months, n = 10).

Figure 6.
Effect of cell pre-exposure to ouabain on PLTX detection by the cell-based ELISA. Each point represents mean ± SE of three different experiments. Statistical differences: *** p < 0.001 as compared to PLTX (two-way ANOVA and Bonferroni post test).
Figure 6.
Effect of cell pre-exposure to ouabain on PLTX detection by the cell-based ELISA. Each point represents mean ± SE of three different experiments. Statistical differences: *** p < 0.001 as compared to PLTX (two-way ANOVA and Bonferroni post test).

Figure 7.
Mussel matrix effect in the cell-based ELISA. Linear regression analysis within the working range of the cell-based ELISA (1.4 × 10⁻¹¹ to 1.1 × 10⁻⁹ M) performed on 80% aqueous methanol mussel extract diluted 1:10. Linear regression analysis was performed by plotting theoretical PLTX concentrations against toxin concentrations measured by the cell-based ELISA.


Table 1.
Bias values (%) for PLTX analysis by the cell-based ELISA, intraday (n = 6, 1 day) and interday (n = 10, 6 months) repeatability (relative standard deviation of repeatability, RSDr %), and mean of PLTX concentrations measured by the assay.
Table 1.
Bias values (%) for PLTX analysis by the cell-based ELISA, intraday (n = 6, 1 day) and interday (n = 10, 6 months) repeatability (relative standard deviation of repeatability, RSDr %), and mean of PLTX concentrations measured by the assay.
| Theoretical PLTX Concentration (M) | Bias (%) | Intraday Repeatability | Interday Repeatability | ||
|---|---|---|---|---|---|
| Mean of Measured PLTX Concentration (M) | RSDr (%) | Mean (M) | RSDr (%) | ||
| 1.37 × 10⁻¹¹ | 6.9 | 1.83 × 10⁻¹¹ | 8 | 1.42 × 10⁻¹¹ | 14 |
| 4.12 × 10⁻¹¹ | −5.1 | 3.22 × 10⁻¹¹ | 10 | 3.94 × 10⁻¹¹ | 6 |
| 1.24 × 10⁻¹⁰ | −1.6 | 1.15 × 10⁻¹⁰ | 12 | 1.21 × 10⁻¹⁰ | 15 |
| 3.70 × 10⁻¹⁰ | 2.6 | 5.01 × 10⁻¹⁰ | 21 | 3.80 × 10⁻¹⁰ | 21 |
| 1.11 × 10⁻⁹ | 9.8 | 1.11 × 10⁻⁹ | 10 | 1.22 × 10⁻⁹ | 16 |
| Mean | 2.5 | 12 | 15 | ||
Table 2.
Bias values (%) for PLTX detected in 80% aqueous methanol mussel extract spiked with the toxin after 1:10 dilution compared to theoretical PLTX concentrations (n = 10).
Table 2.
Bias values (%) for PLTX detected in 80% aqueous methanol mussel extract spiked with the toxin after 1:10 dilution compared to theoretical PLTX concentrations (n = 10).
| PLTX Concentration (M) | Bias (%) |
|---|---|
| 1.37 × 10⁻¹¹ | −0.3 |
| 4.12 × 10⁻¹¹ | −0.6 |
| 1.23 × 10⁻¹⁰ | 1.5 |
| 3.70 × 10⁻¹⁰ | −4.8 |
| 1.11 × 10⁻⁹ | −3.0 |
| Mean | −1.4 |
Table 3.
Recovery of PLTX from mussels analyzed by the cell-based ELISA.
| PLTX Concentration (M) | Recovery (%) | Coefficient of Variability (%) | No. of Replicas |
|---|---|---|---|
| 1.37 × 10⁻¹¹ | 99.6 | 15 | 5 |
| 4.12 × 10⁻¹¹ | 101.0 | 13 | 5 |
| 1.23 × 10⁻¹⁰ | 93.7 | 17 | 5 |
| 3.70 × 10⁻¹⁰ | 110.2 | 14 | 5 |
| 1.11 × 10⁻⁹ | 101.9 | 13 | 5 |
© 2018 by the authors. Licensee MDPI, Basel, Switzerland. This article is an open access article distributed under the terms and conditions of the Creative Commons Attribution (CC BY) license (http://creativecommons.org/licenses/by/4.0/).
Share and Cite
MDPI and ACS Style
Pelin, M.; Sosa, S.; Brovedani, V.; Fusco, L.; Poli, M.; Tubaro, A. A Novel Sensitive Cell-Based Immunoenzymatic Assay for Palytoxin Quantitation in Mussels. Toxins 2018, 10, 329. https://0-doi-org.brum.beds.ac.uk/10.3390/toxins10080329
AMA Style
Pelin M, Sosa S, Brovedani V, Fusco L, Poli M, Tubaro A. A Novel Sensitive Cell-Based Immunoenzymatic Assay for Palytoxin Quantitation in Mussels. Toxins. 2018; 10(8):329. https://0-doi-org.brum.beds.ac.uk/10.3390/toxins10080329
Chicago/Turabian StylePelin, Marco, Silvio Sosa, Valentina Brovedani, Laura Fusco, Mark Poli, and Aurelia Tubaro. 2018. "A Novel Sensitive Cell-Based Immunoenzymatic Assay for Palytoxin Quantitation in Mussels" Toxins 10, no. 8: 329. https://0-doi-org.brum.beds.ac.uk/10.3390/toxins10080329
Note that from the first issue of 2016, this journal uses article numbers instead of page numbers. See further details here.