Article

Osmotic-Adaptation Response of sakA/hogA Gene to Aflatoxin Biosynthesis, Morphology Development and Pathogenicity in Aspergillus flavus

Key Laboratory of Pathogenic Fungi and Mycotoxins of Fujian Province, Key Laboratory of Biopesticide and Chemical Biology of the Ministry of Education and School of Life Sciences, Fujian Agriculture and Forestry University, Fuzhou 350002, China
*
Authors to whom correspondence should be addressed.
Submission received: 23 November 2018 / Revised: 19 December 2018 / Accepted: 11 January 2019 / Published: 14 January 2019
(This article belongs to the Section Mycotoxins)

Abstract

:
Aspergillus flavus is one of the fungi from the big family of Aspergillus genus and it is capable of colonizing a large number of seed/crops and living organisms such as animals and human beings. SakA (also called hogA/hog1) is an integral part of the mitogen activated protein kinase signal of the high osmolarity glycerol pathway. In this study, the AfsakA gene was deleted (∆AfsakA) then complemented (∆AfsakA::AfsakA) using homologous recombination and the osmotic stress was induced by 1.2 mol/L D-sorbital and 1.2 mol/L sodium chloride. The result showed that ∆AfsakA mutant caused a significant influence on conidial formation compared to wild-type and ∆AfsakA::AfsakA strains. It was also found that AfsakA responds to both the osmotic stress and the cell wall stress. In the absence of osmotic stress, ∆AfsakA mutant produced more sclerotia in contrast to other strains, whereas all strains failed to generate sclerotia under osmotic stress. Furthermore, the deletion of AfsakA resulted in the increase of Aflatoxin B1 production compared to other strains. The virulence assay on both maize kernel and peanut seeds showed that ∆AfsakA strain drastically produced more conidia and Aflatoxin B1 than wild-type and complementary strains. AfSakA-mCherry was located to the cytoplasm in the absence of osmotic stress, while it translocated to the nucleus upon exposure to the osmotic stimuli. This study provides new insights on the development and evaluation of aflatoxin biosynthesis and also provides better understanding on how to prevent Aspergillus infections which would be considered the first step towards the prevention of the seeds damages caused by A. flavus.
Key Contribution: MAPK sakA gene is identified in A. flavus and has an influence in virulence, aflatoxin biosynthesis and responds to osmotic stress.

1. Introduction

The A. flavus is one of the fungi from the big family of Aspergillus genus and this fungus is capable of colonizing a large number of seed/crops and living organisms such as animals and human beings [1,2]. Aspergillus genus is one of the most aflatoxigenic fungi ever identified worldwide [3,4]. Most of the highly toxic secondary metabolites (aflatoxins) are extensively produced by fungi from this group including A. flavus, A. parasiticus and A. nomius. If ingested by humans, these massively toxic secondary metabolites often cause acute and chronic toxicity which lead to serious health issues [2,5]. These findings were recently corroborated by Yu et al. [6] and later by Cleveland et al. [7] who further added that the aflatoxin biosynthesis pathway is one of the mostly understood pathways for fungal secondary metabolites. It is important to indicate that A. flavus has been known for a very long time not only as the major producer of mycotoxins but also as the foremost producer of the Aflatoxin B1 (AFB1) and B2, among which AFB11 is known to be the most poisonous [8,9].
As indicated earlier, A. flavus causes severe diseases to the seed/crops like peanuts, corn, rice, cotton, beans and wheat which lead to a significant loss of agriculture commodities. For example, in case A. flavus is highly inhaled or ingested by living organisms, this fungus can cause various fungal infections such as invasive and non-invasive human aspergillosis [10,11,12]. For more than 40 years, unlike A. fumigatus, A. flavus has been studied in animals’ standards even though they are hardly used [5]. Studies indicated that A. flavus is more virulent than any other Aspergillus species capable of producing toxins [5,13]. Therefore, a deep understanding on the signaling pathways that has an influence on the regulation of factors involved in this virulence is needed.
Mitogen activated protein kinases (MAPKs) are protein kinases which are present in eukaryotes. These proteins are not only capable of differentiating immune responses in mammalian cells but also capable of mediating differentiation of programs in their cells [14]. Their signaling pathways are necessary for the adaptation of the environmental changes and are controlled by phosphorylation cascades [15]. Their kinases-cascades are composed of three-component signal relay, that is, MAPKKK (MAP kinase kinase kinase), MAPKK (MAP kinase kinase) and MAPK (MAP kinase) and work in sequential activation. Once the cell receives different environmental stimuli, the former initiates an activation of a MAPK cascade. The MAPKKK first phosphorylates the MAPKK which phosphorylates MAPK on its turn [16,17,18]. Several studies propound that MAPKs are also referred to as SAPKs (stress activated protein kinases) and their pathways are able to respond to multiple stress signals [19,20,21]. The recent study by May et al. [22] and Nascimento et al. [13] reported that A. fumigatus contains 4 MAPK genes including mpkA, mpkB, mpkC and sakA/hogA. Their findings were corroborated by several other researchers who further reiterated that MAPK SakA plays an important role in stress response [14,23]. A study conducted by Jaimes-Arroyo et al. [24] also found that MAPK SakA is an integral components of a central multiple stress-signaling pathway that also regulates development in A. nidulans. Similar studies on other Aspergillus species revealed that sakA gene is a homologue to hog1 gene of the Saccharomyces cerevisiae.
Of significance, sakA is also a part of MAPK signaling pathways in high osmolarity glycerol (HOG) pathway where it acts as an osmotic regulator [13,25]. Upon exposure to a hyperosmotic pressure, HOG pathway gets activated and causes the alteration in the expression of various genes in S.cerevisiae [15]. For example, upon exposure to a hyperosmotic pressure, genes which are essential for growth and their expression are controlled by HOG pathway, such as glycerol biosynthesis genes GPD1 (glycerol-3-phosphate dehydrogenase) [26], GPP1 and GPP2 (glycerol-3-phosphotase) [27,28]. In a recent study, Duran et al. [15] corroborated what has been reported by several studies highlighting the influence of osmotic pressure on Aspergillus species as induced by solute concentrations, water content as well as water activity. In the case of A. parasiticus, moisture and substrate variation affected the development on corn kernels [29], whereas in A. niger, the hyperosmotic NaCl increased the secretion and production of glucose oxidase during fermentation [30].
Although sakA gene has been extensively studied in many different organisms, to our best knowledge, it has not been reported in A. flavus. Therefore, it was deemed necessary to investigate how MAPK AfSakA responds to different environmental stress. Therefore, in this study, we investigated the role of AfSakA in the presence and absence of osmotic stress and its subsequent response to conidia formation, sclerotia production, seeds pathogenicity as well as aflatoxin production.

2. Results

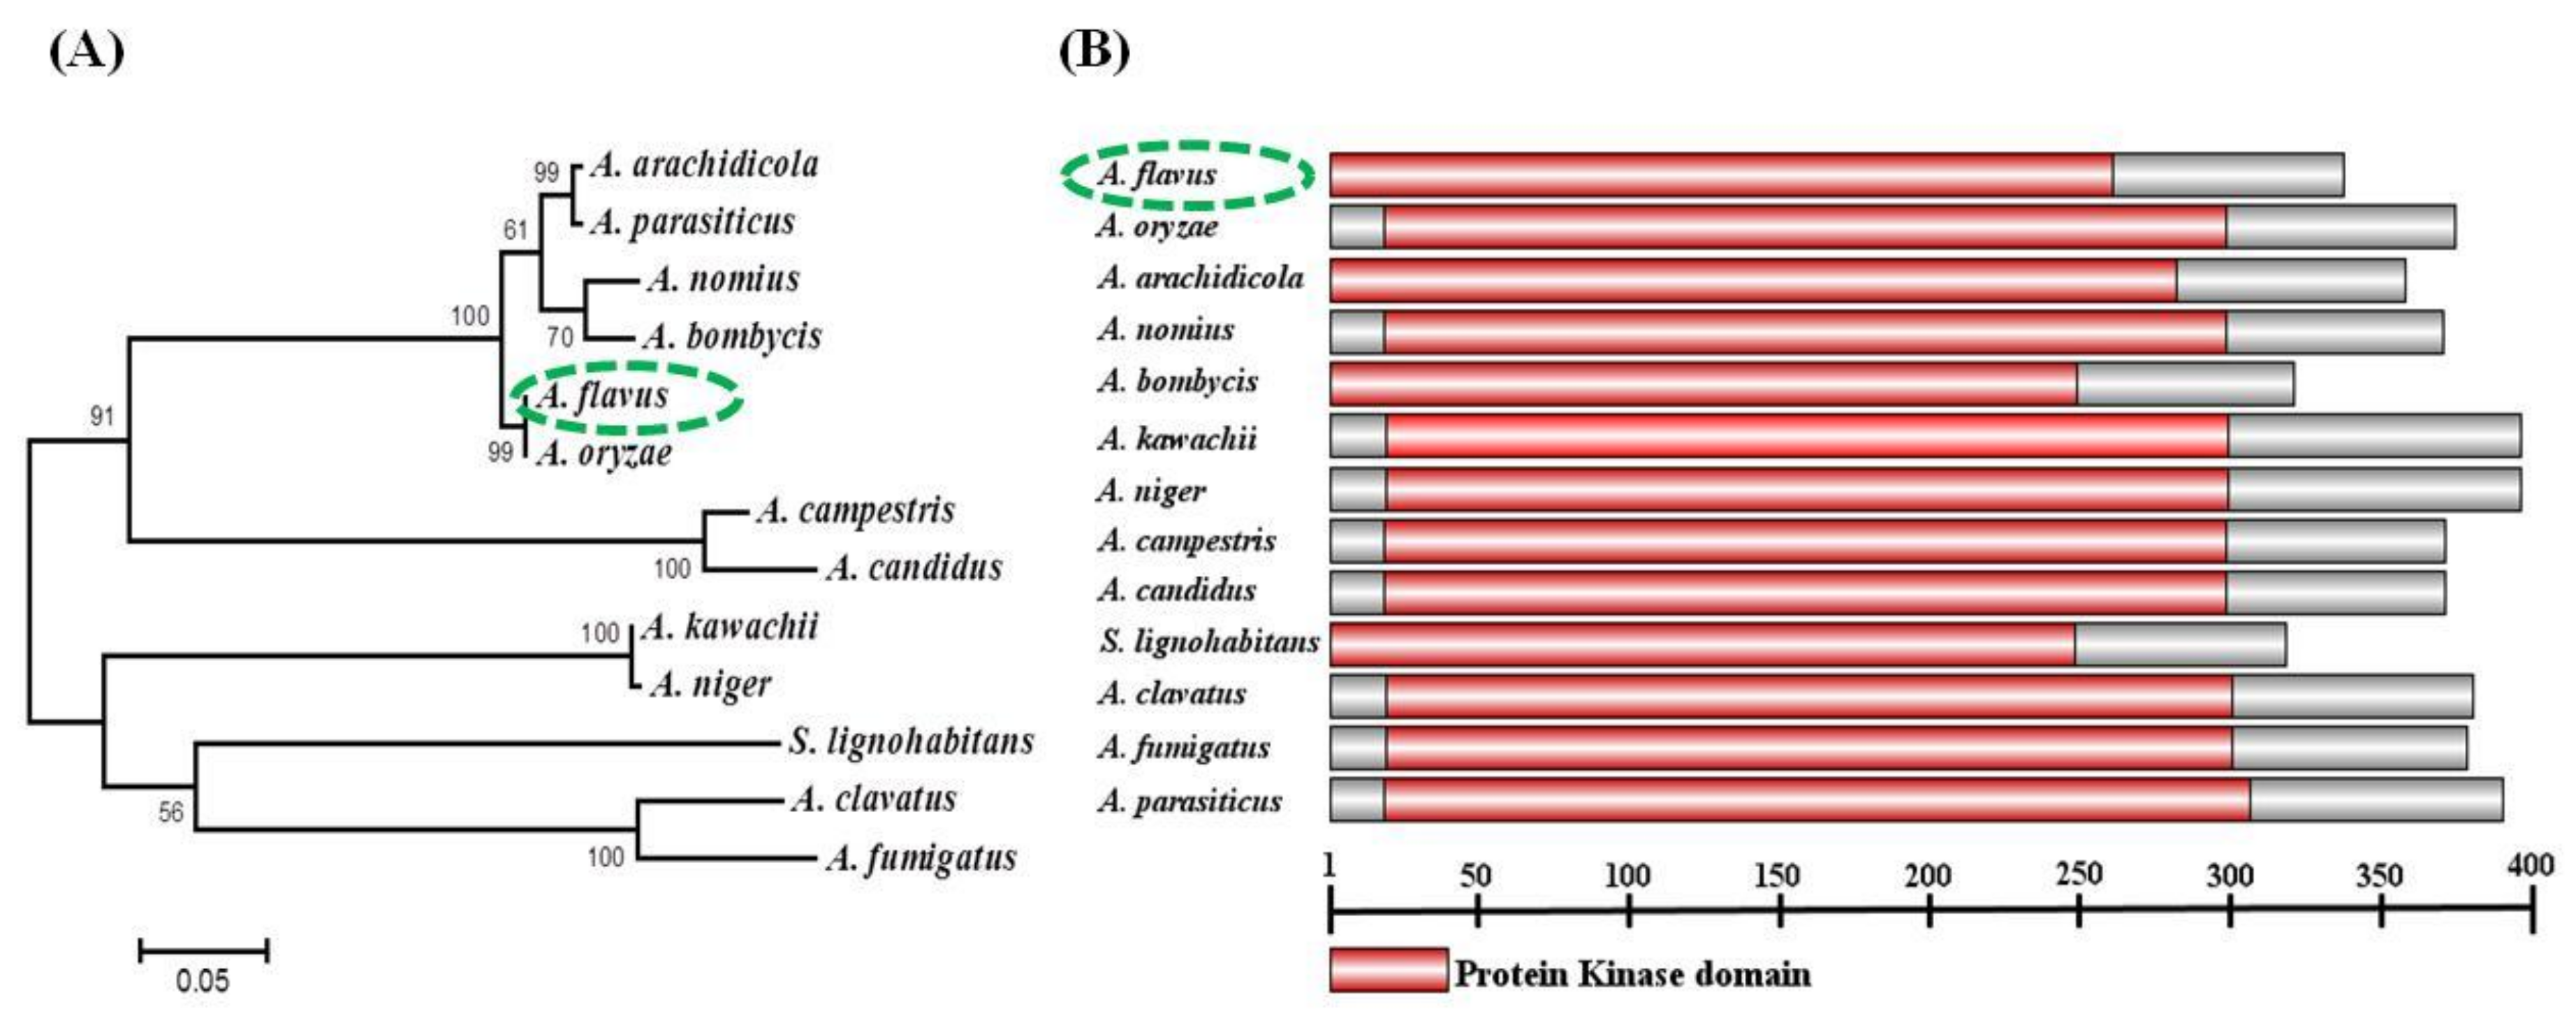
2.1. Identification and Analysis of sakA in A. flavus

Gene sequence of AfsakA was obtained from NCBI with the sequence ID AFLA-099500 and protein ID EED46287.1. MAP kinase AfSakA protein EED46287.1 was predicted to consist of 337-amino-acid. Then SakA protein sequences from other 12 different type of fungi namely A. oryzae (KDE75035), A. arachidicola (PIG85517) A. parasiticus (KJK67979), A. nomius (XP_015400855), A. bombycis (XP022385176), A. kawachii (GAA86222), A. niger (GAQ39538), A. campestris (XP_024694930), A. candidus (XP_024671978), Sugiyamaella lignohabitans (XP_018738467), A. clavatus (XP_001274144) and A. fumigatus (XP_753727.2) were also downloaded from NCBI. The recovered protein sequences were used in Molecular Evolutionary Genetic Analysis Version 7.0.26 (MEGA 7) software for the revolutionary relationship analysis between all these species. The results showed that AfSakA of A. flavus had the highest similarity to that of A. oryzae (96% identity, query cover 100%) (Figure 1A). Thus we analyzed SakA protein sequence in each fungi specie from Interpro (protein sequence analysis and classification) database. The identified protein kinase domain was constructed using a free software called Illustrator for Biological Sequences Version 1.0 (IBS 1.0) and all the 13 fungi share a highly conserved protein kinase domain (Figure 1B).

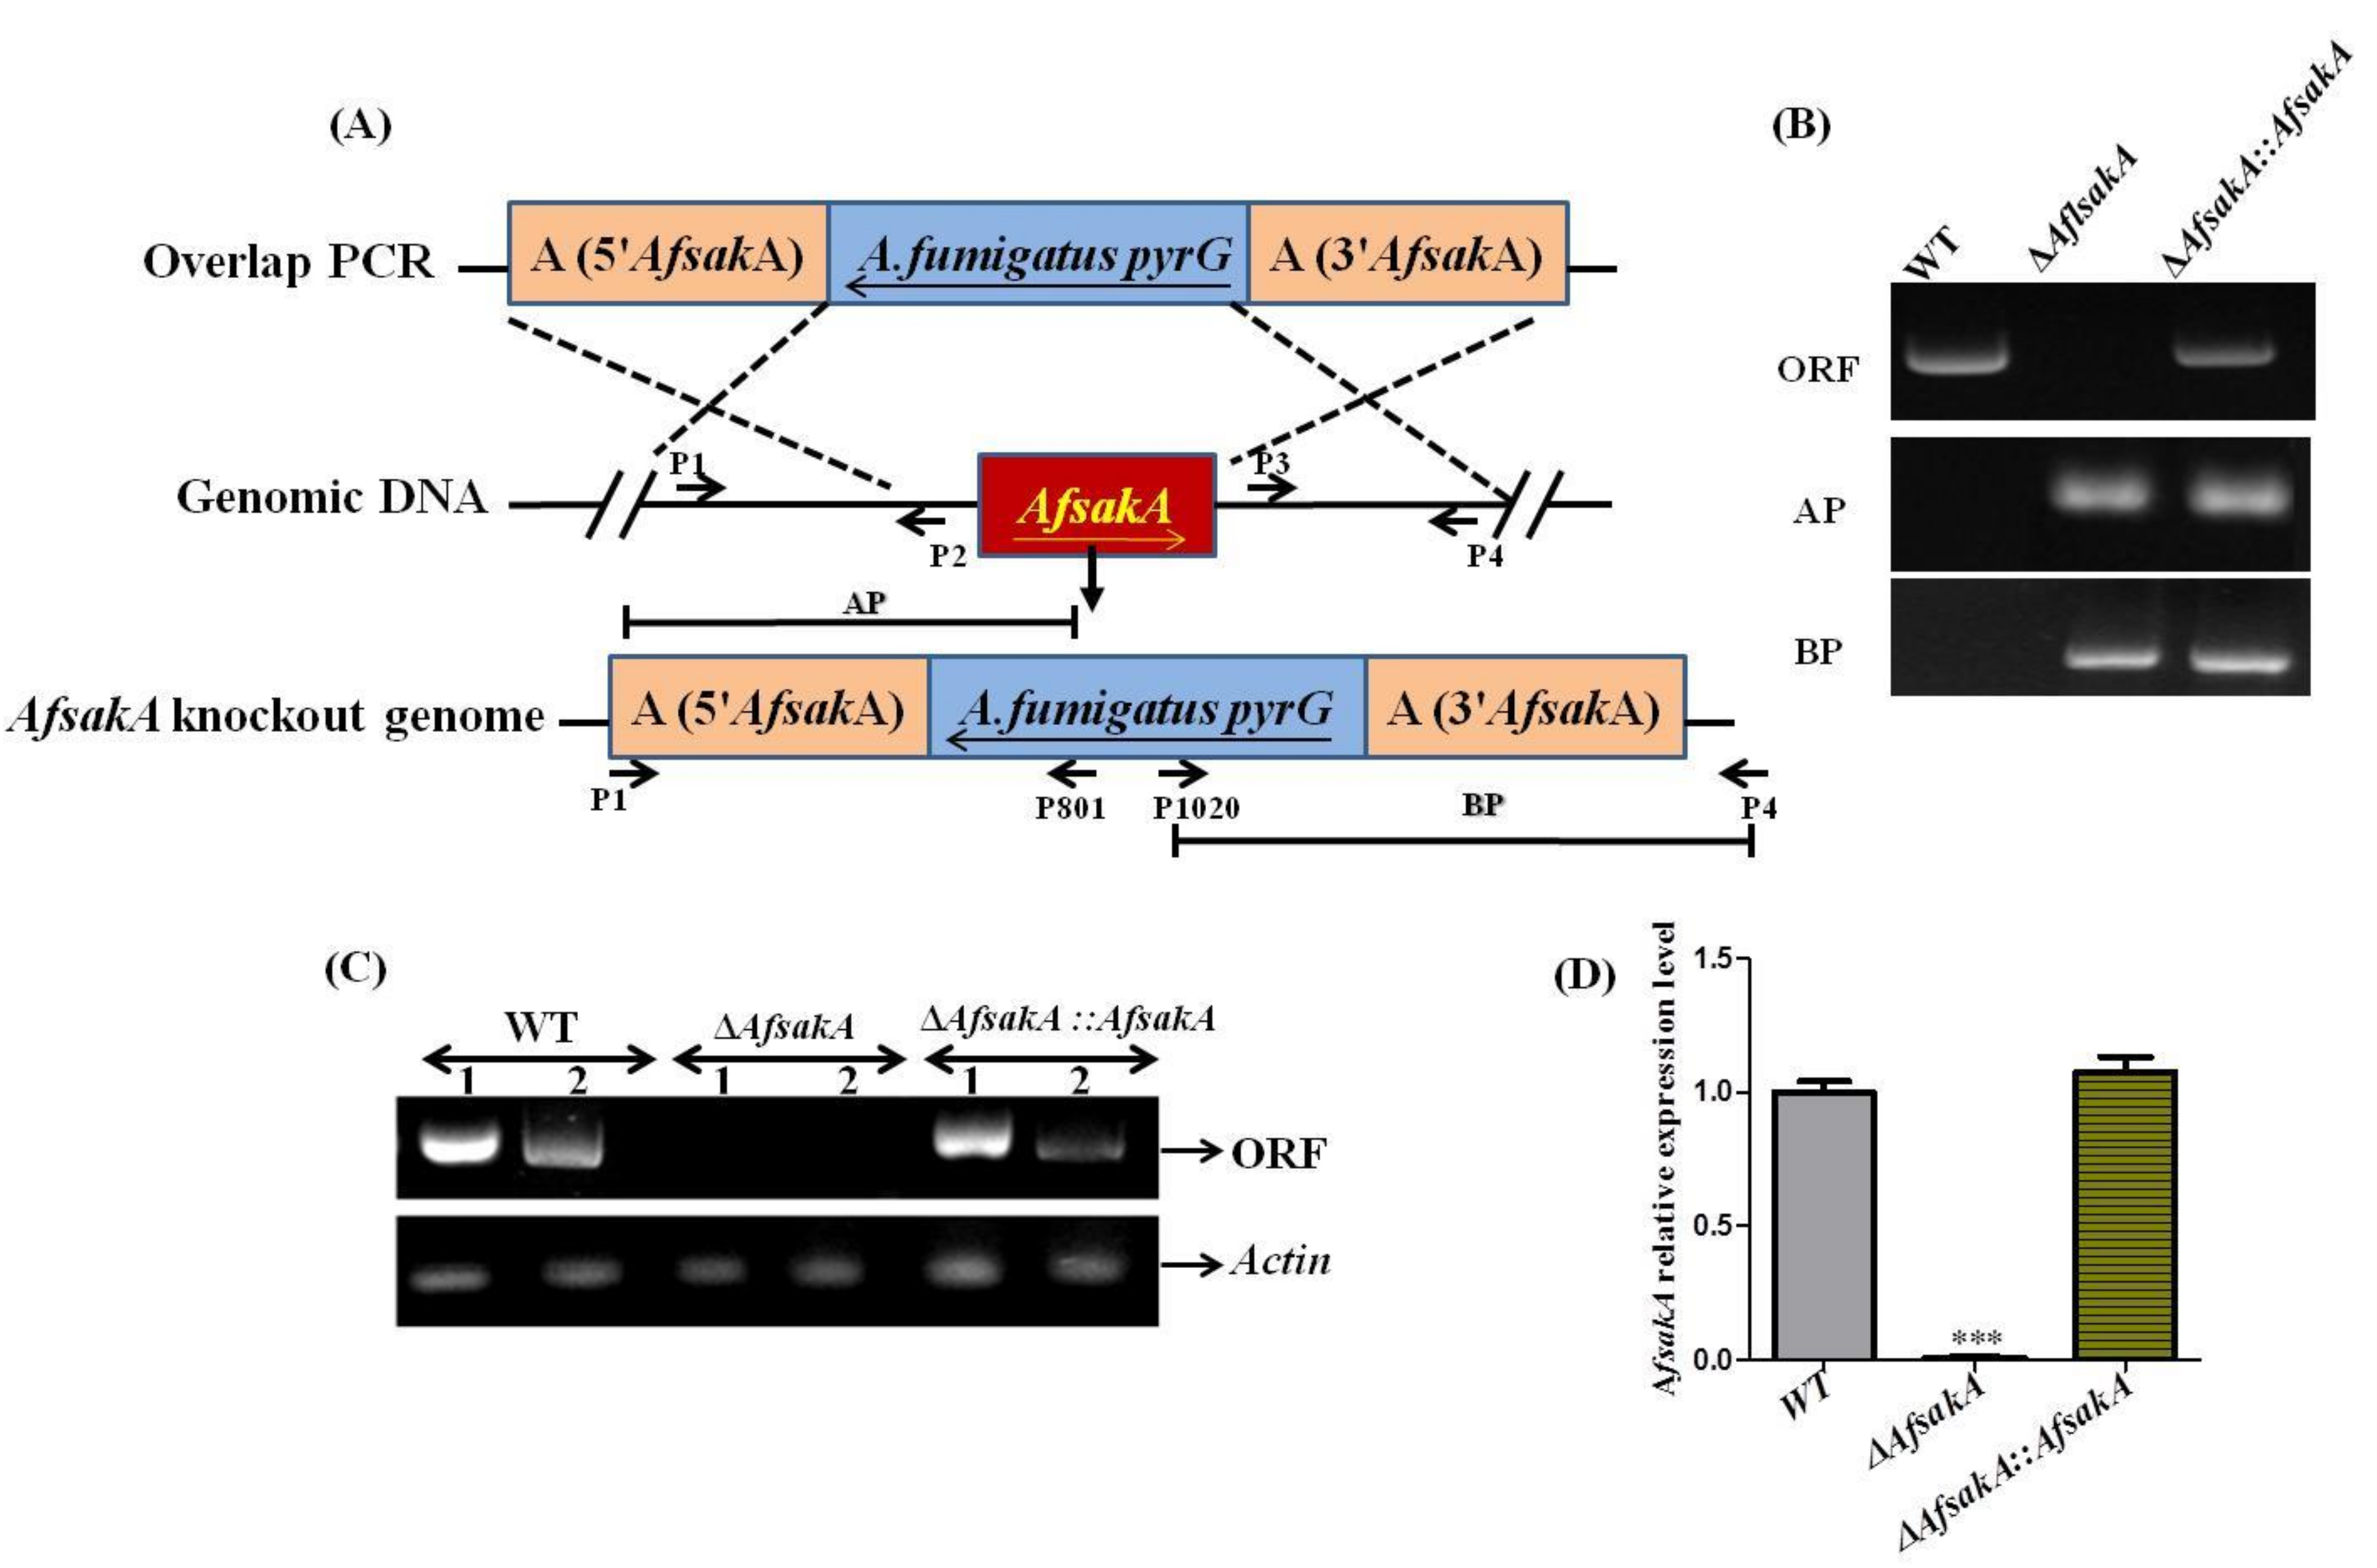
2.2. Generation of AfsakA Deletion and Complementation Mutant Strains

To study the role of AfsakA gene in A. flavus, we constructed the knockout (∆AfsakA) and complementation mutant (∆AfsakA::AfsakA) strains by homologous recombination strategy (Figure 2A). To construct AfsakA deletion strain, the ORF of AfsakA gene was replaced by pyrG gene. Whereas, in order to confirm the role of AfsakA gene and to insure that AfsakA was fully functional, we created AfsakA complementation strain. Thus, we assembled complementation vector (pPTR-AfsakA) and transferred it into ∆AfsakA protoplast. The transformants were first proved by both PCR (Figure 2B) and the result showed that both AP and BP fragments were missing in the WT but present in ∆AfsakA and in ∆AfsakA::AfsakA (Figure 2B), indicating that A. fumigatus pyrG had replaced ORF of AfsakA. The positive mutant strains were further confirmed by RT-PCR and the result in Figure 2C demonstrated that AfsakA gene was present both in the WT and in ∆AfsakA::AfsakA strains but it was absent in ∆AfsakA. Further results of qRT-PCR showed that AfsakA could not be expressed in ∆AfsakA (Figure 2D). Hence, all these results revealed that ∆AfsakA strain and ∆AfsakA::AfsakA strain were successfully constructed.

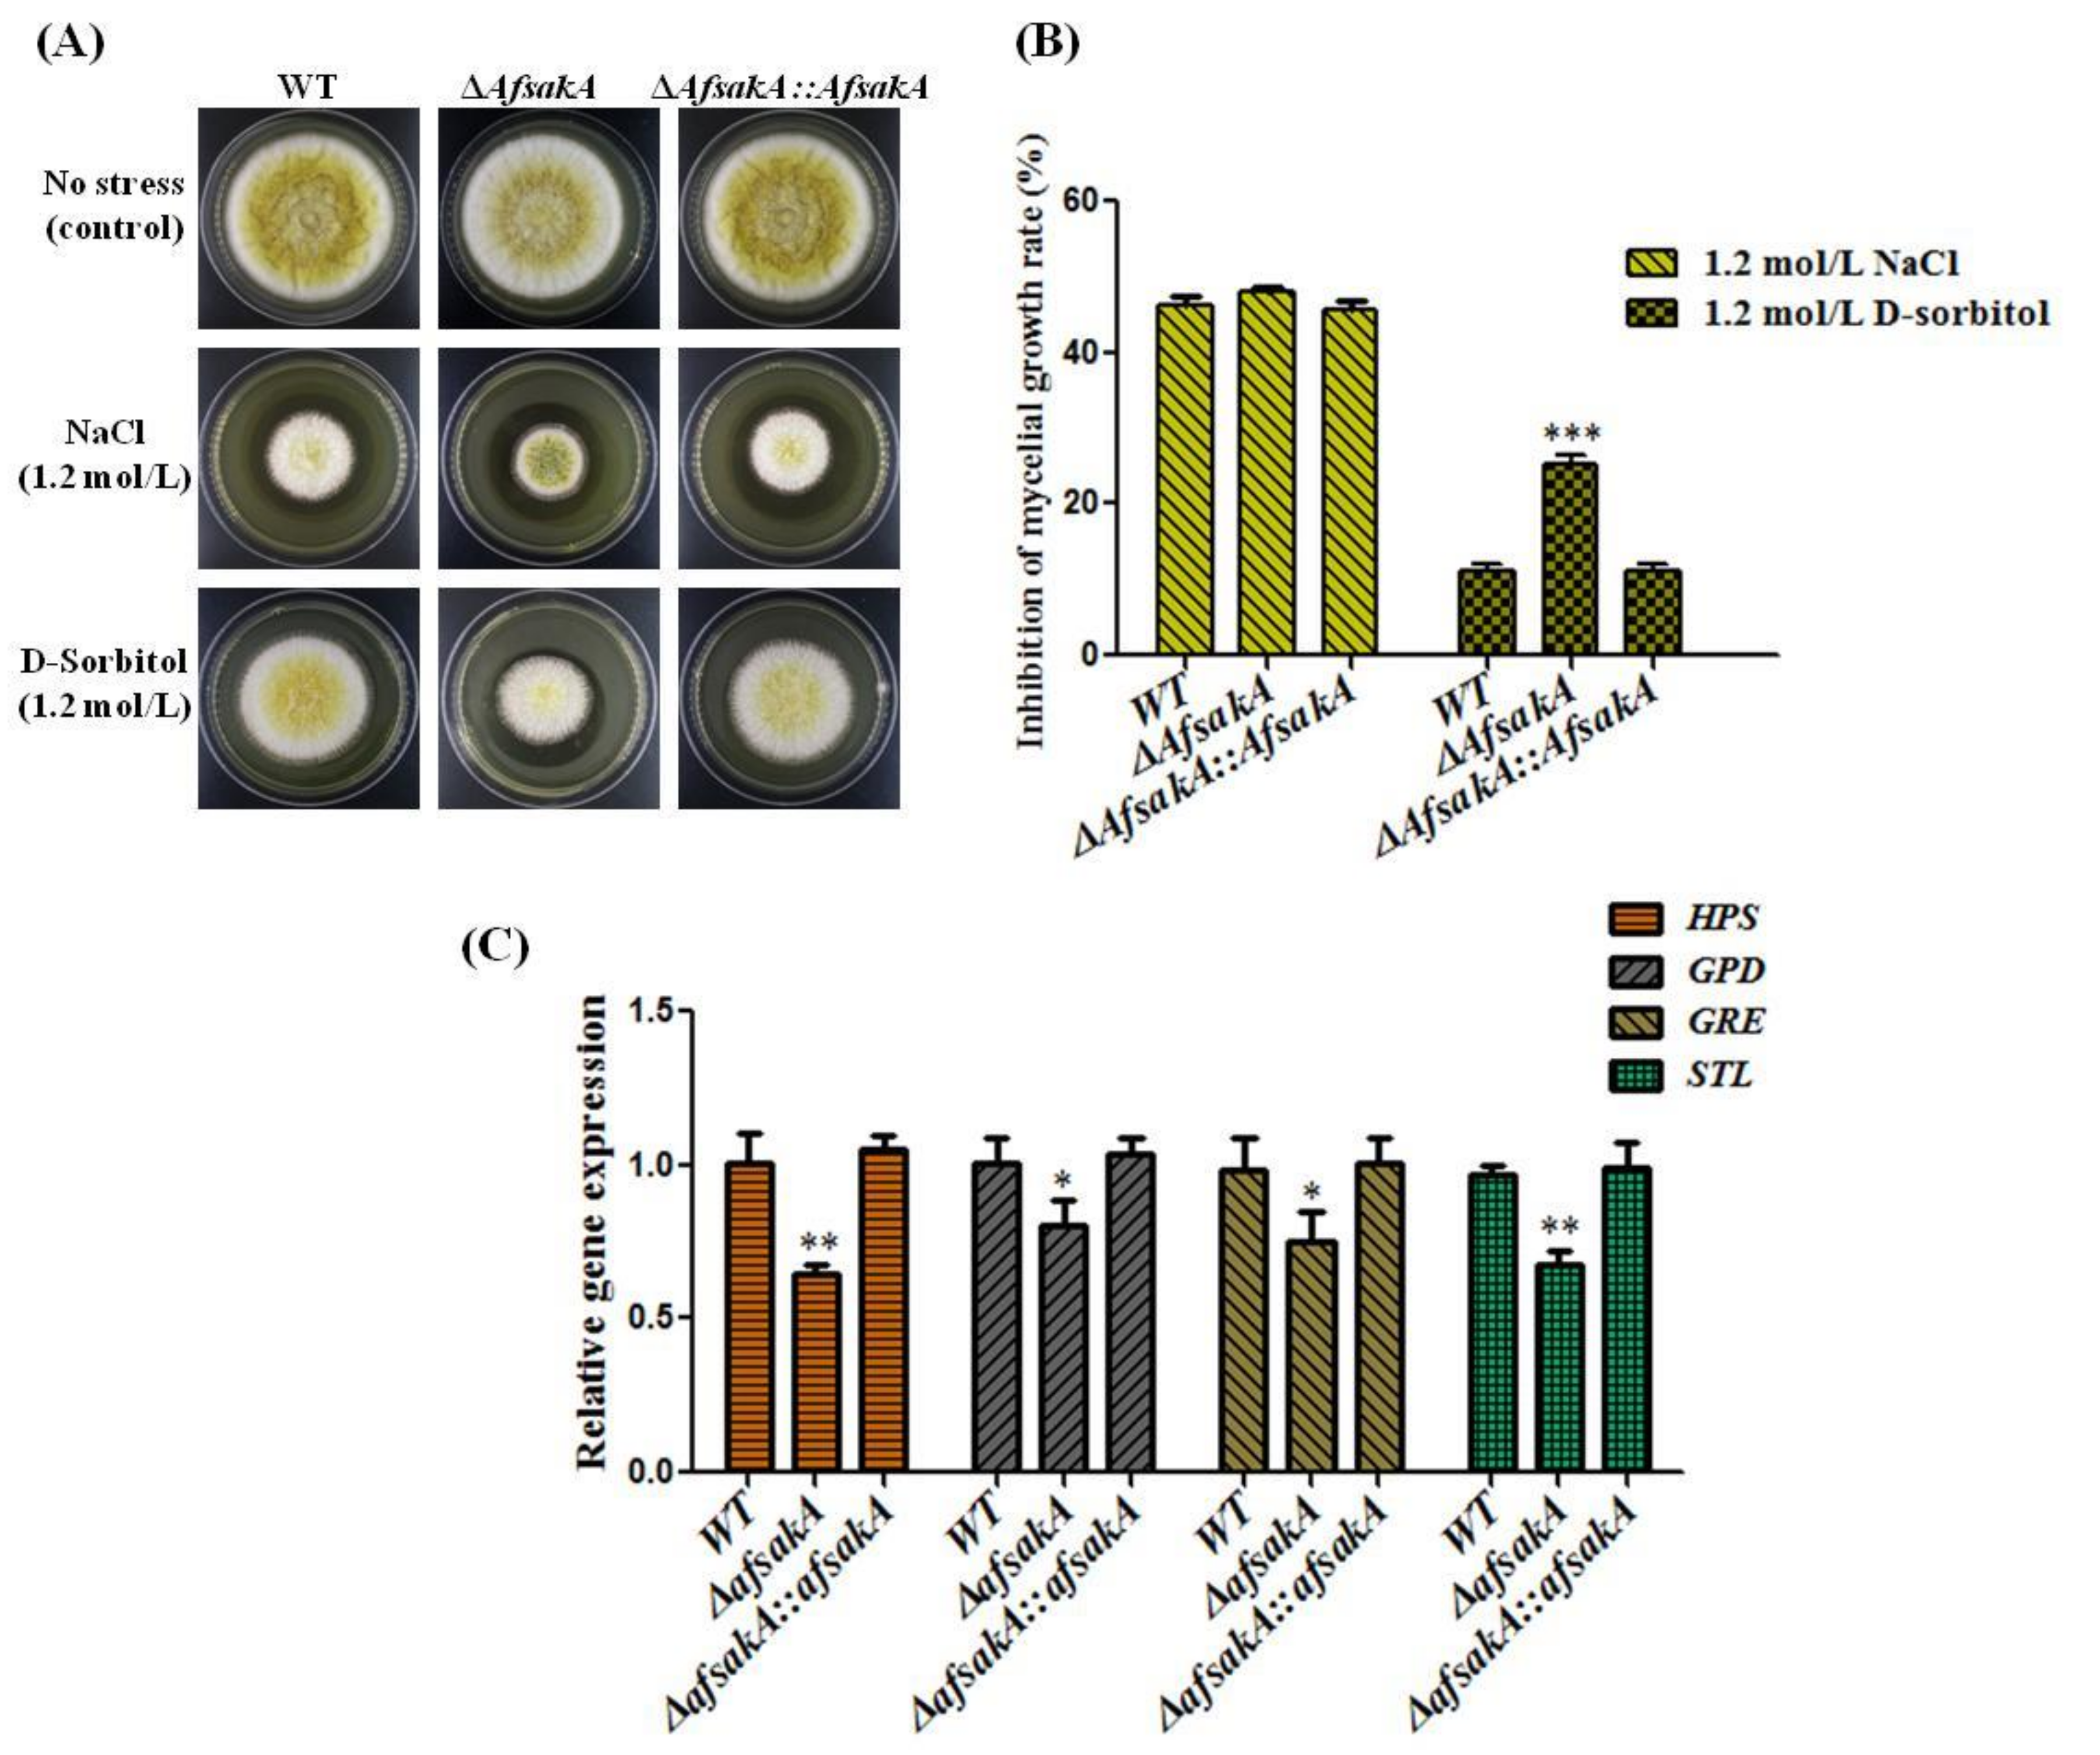
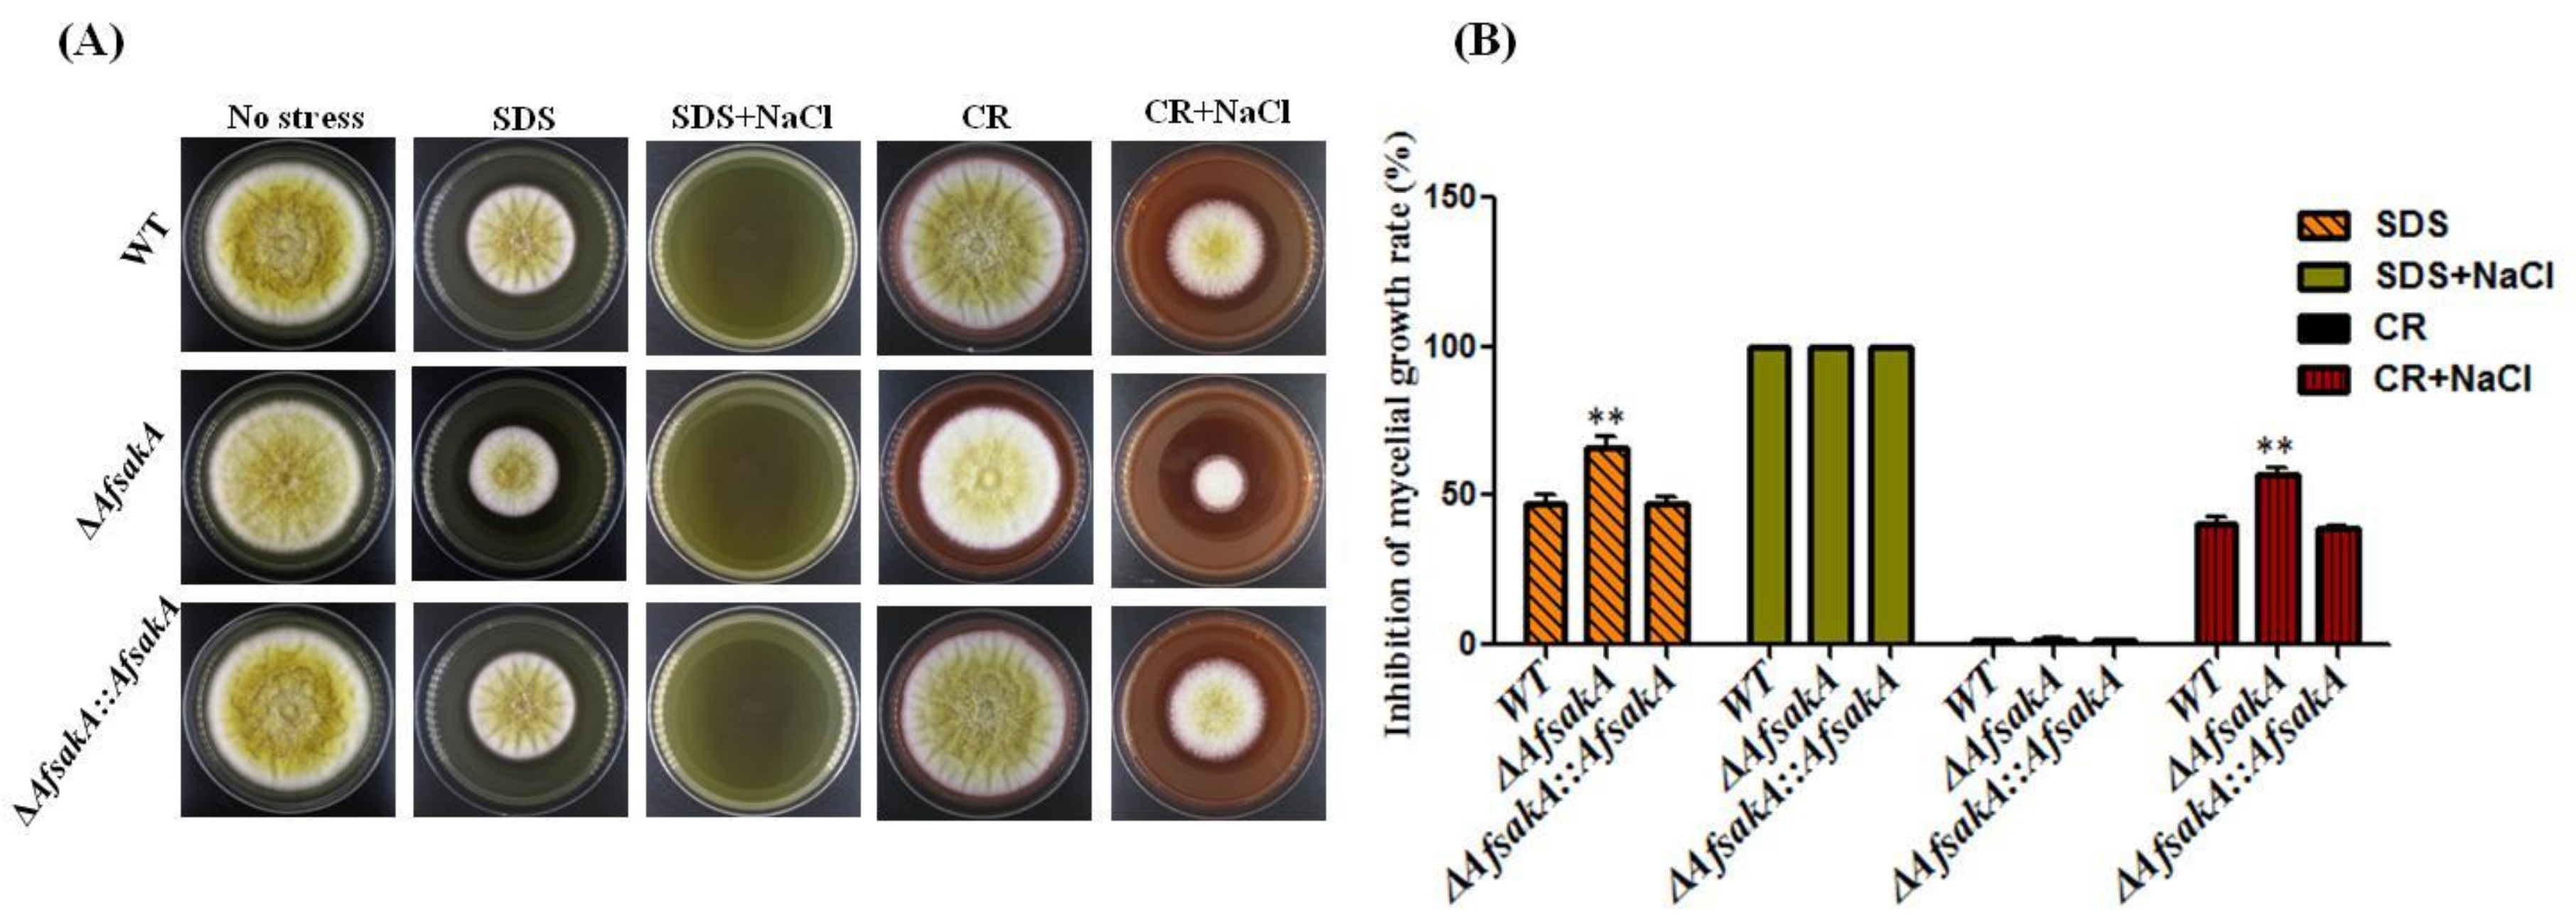
2.3. Effects of AfsakA Deletion on Osmotic Stress Response in A. flavus

To evaluate the potential functions of AfsakA under extracellular stimuli responses, we analyzed the sensitivity of WT, ∆AfsakA and ∆AfsakA::AfsakA to osmotic stress agents. To do this, 106 conidia were inoculated onto YES agar media with and without the formerly described osmotic stress supplements. The cultures were then incubated for 4 days at 37 °C in dark condition. The results indicated that without the stress, WT and complementary strains grew a little better than ∆AfsakA mutant but not significant (Figure 3A). Subsequently we analyzed the expression level of HPS, GPD, GRE and STL genes which are related with osmolality and the result showed that the expression levels of all these 4 genes were significantly decreased in ∆AfsakA than that in WT and ∆AfsakA::AfsakA strains (Figure 3C). Then growth inhibition rate of WT, ∆AfsakA and ∆AfsakA::AfsakA strains under D-sorbitol and NaCl were also examined. Surprisingly, all the strains showed almost the same sensitivity to 1.2 mol/L NaCl, whereas ∆AfsakA mutant was more sensitive to hyperosmotic stress induced by 1.2 mol/L D-sorbitol than the WT and complementary strains strain (Figure 3A,B). These finding suggested that AfsakA is involved in responses to some hyperosmotic stress in A. flavus.

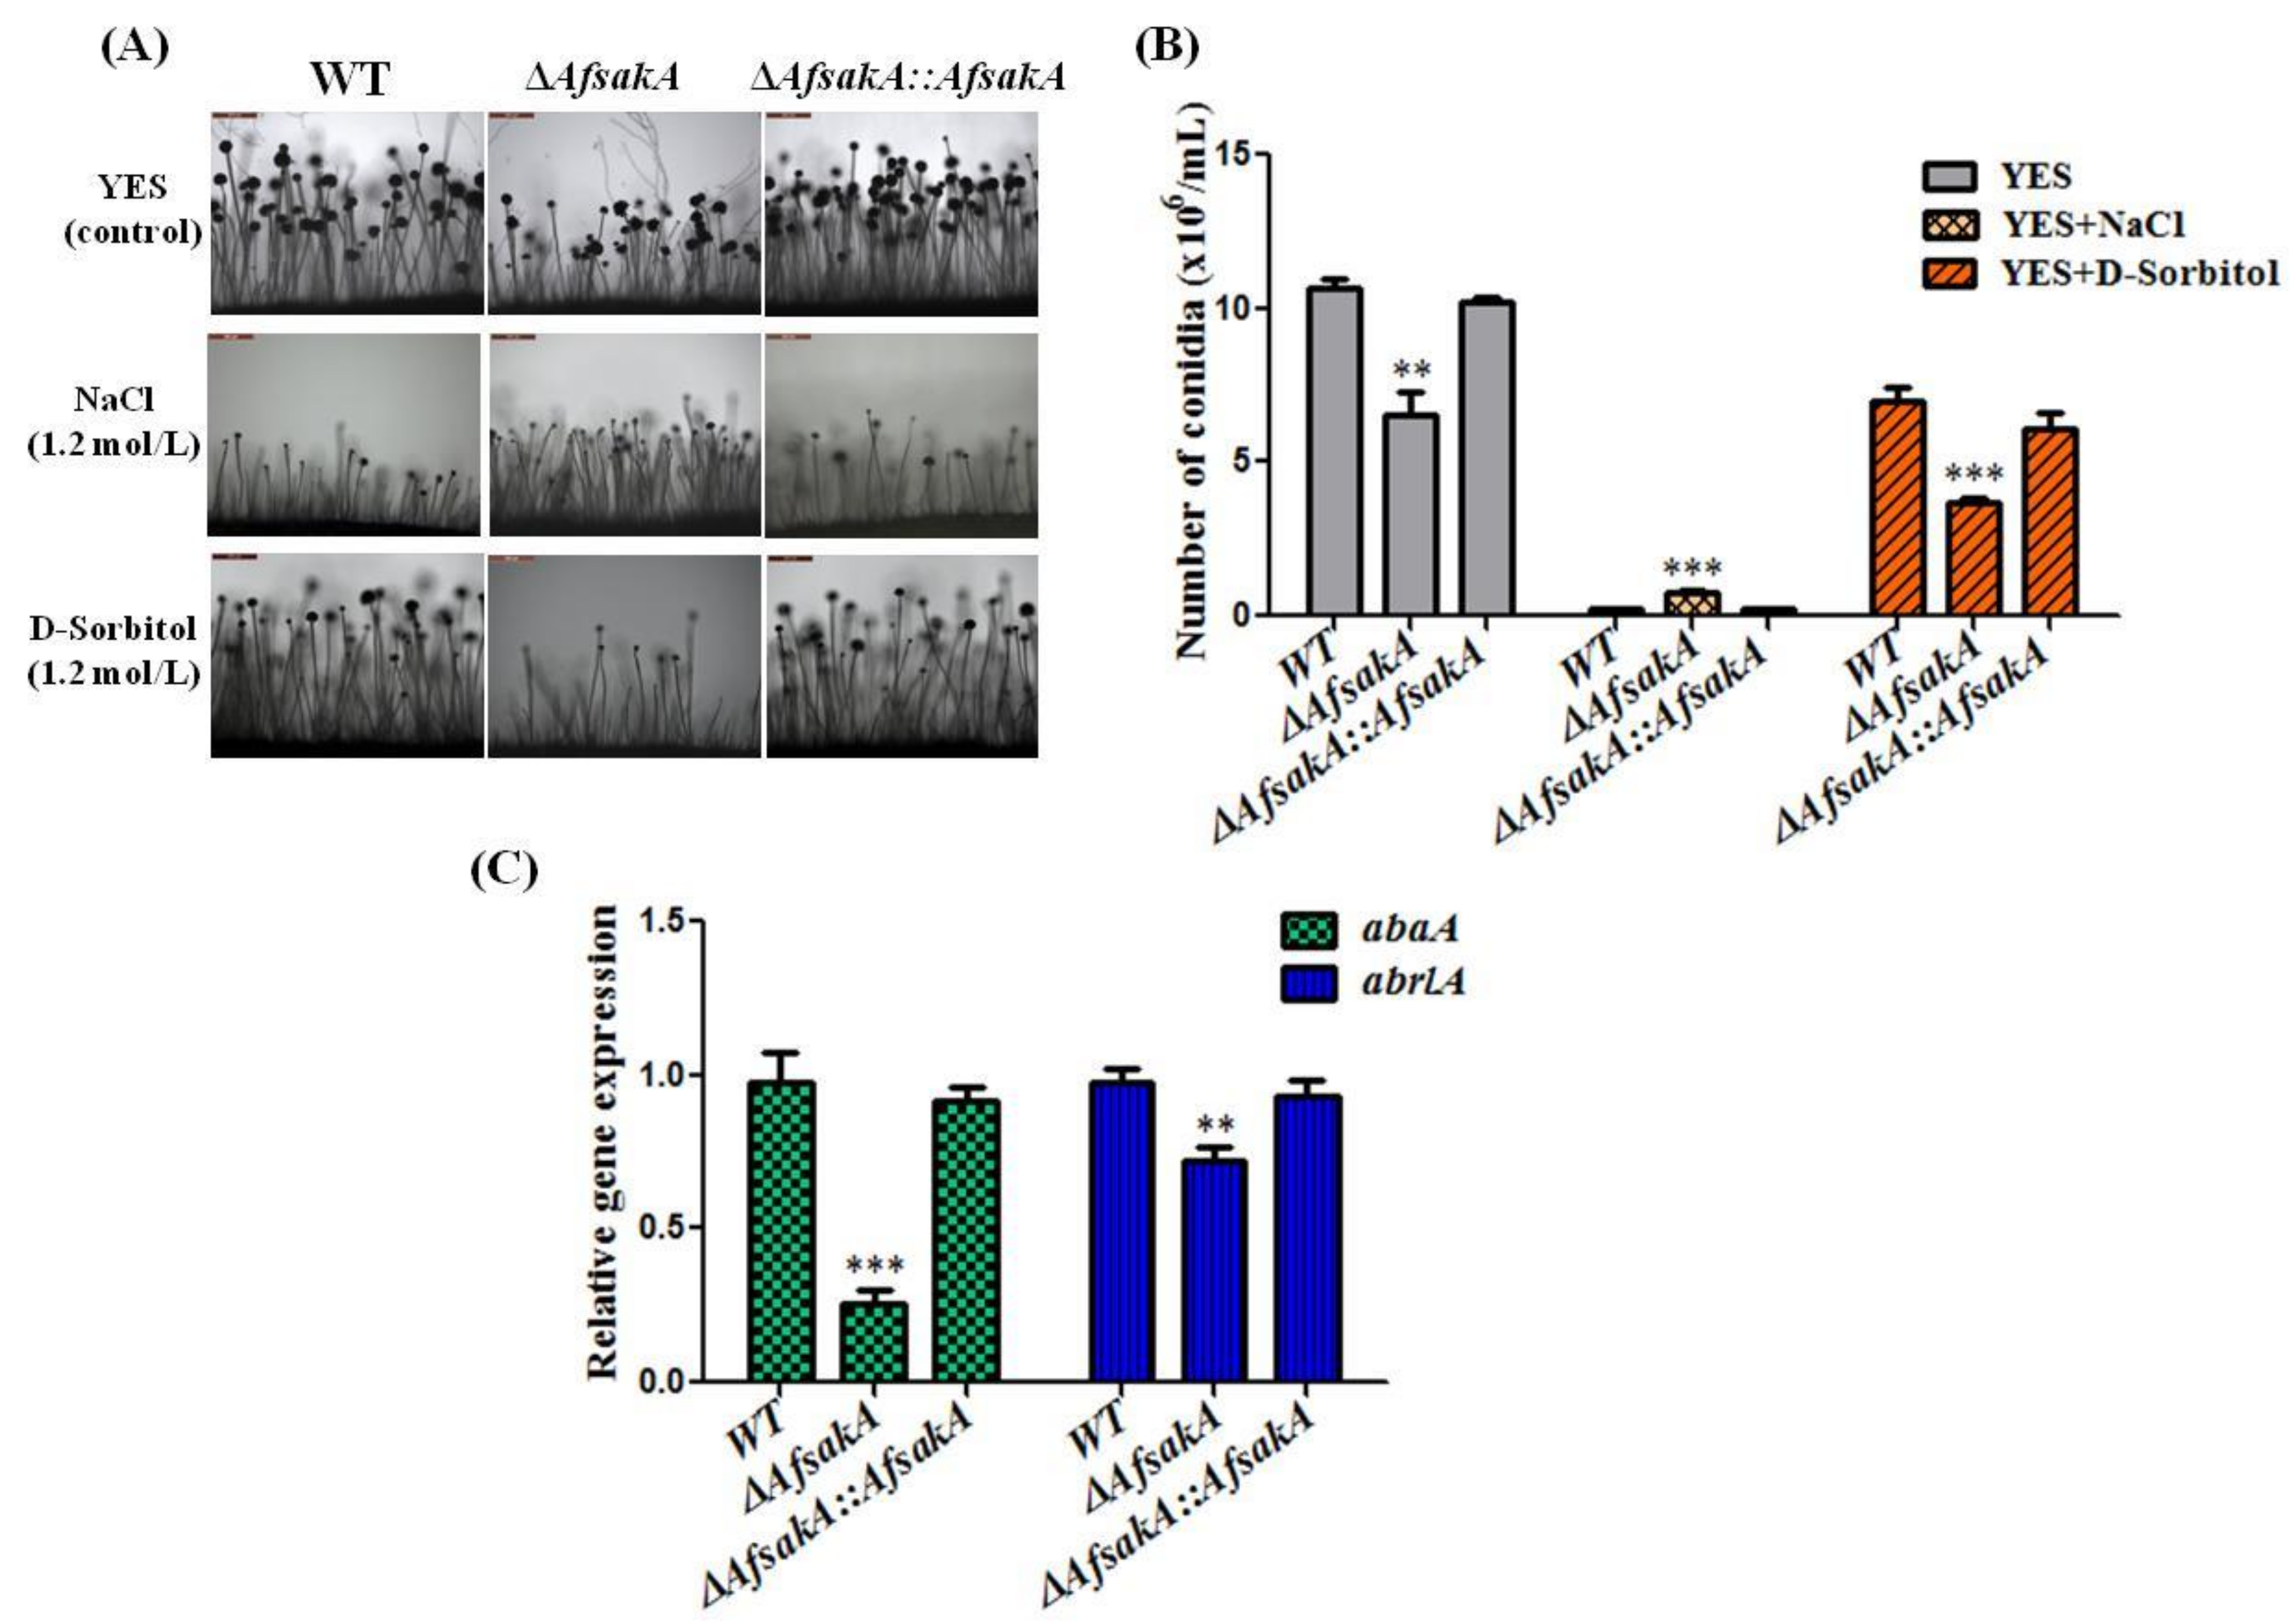
2.4. Effects of AfsakA Deletion on Conidial Production in A. flavus

Conidia are the asexual spores which are produced by different type of fungi and their conidiation (asexual development) lead to mycotoxins production [31,32]. In this section, we analyzed the effect of ∆AfsakA on conidial and conidiophores formation under stress, in order to describe the function of AfsakA during asexual development. Microscopic examination showed that ∆AfsakA mutant produced less and short conidiophores than the WT and complementary ∆AfsakA::AfsakA strains in the absence of osmotic stress agents/supplements. In order to confirm the obtained variation in conidial formation, we examined the expression level of regulatory genes for conidial formation (abaA and brlA) during asexual development without stress. We found that the expression levels of these two genes were significantly decreased in ∆AfsakA compared to that in WT and complemented strains (Figure 4C). Under osmotic stress conditions induced by 1.2 mol/L D-sorbital or 1.2 mol/L NaCl, ∆AfsakA mutant indicated an extra reduction or increase of conidial formation respectively, compared to WT and ∆AfsakA::AfsakA (Figure 4A,B). These results suggest that AfsakA might be playing an important role in conidiation production and conidiophores formation.

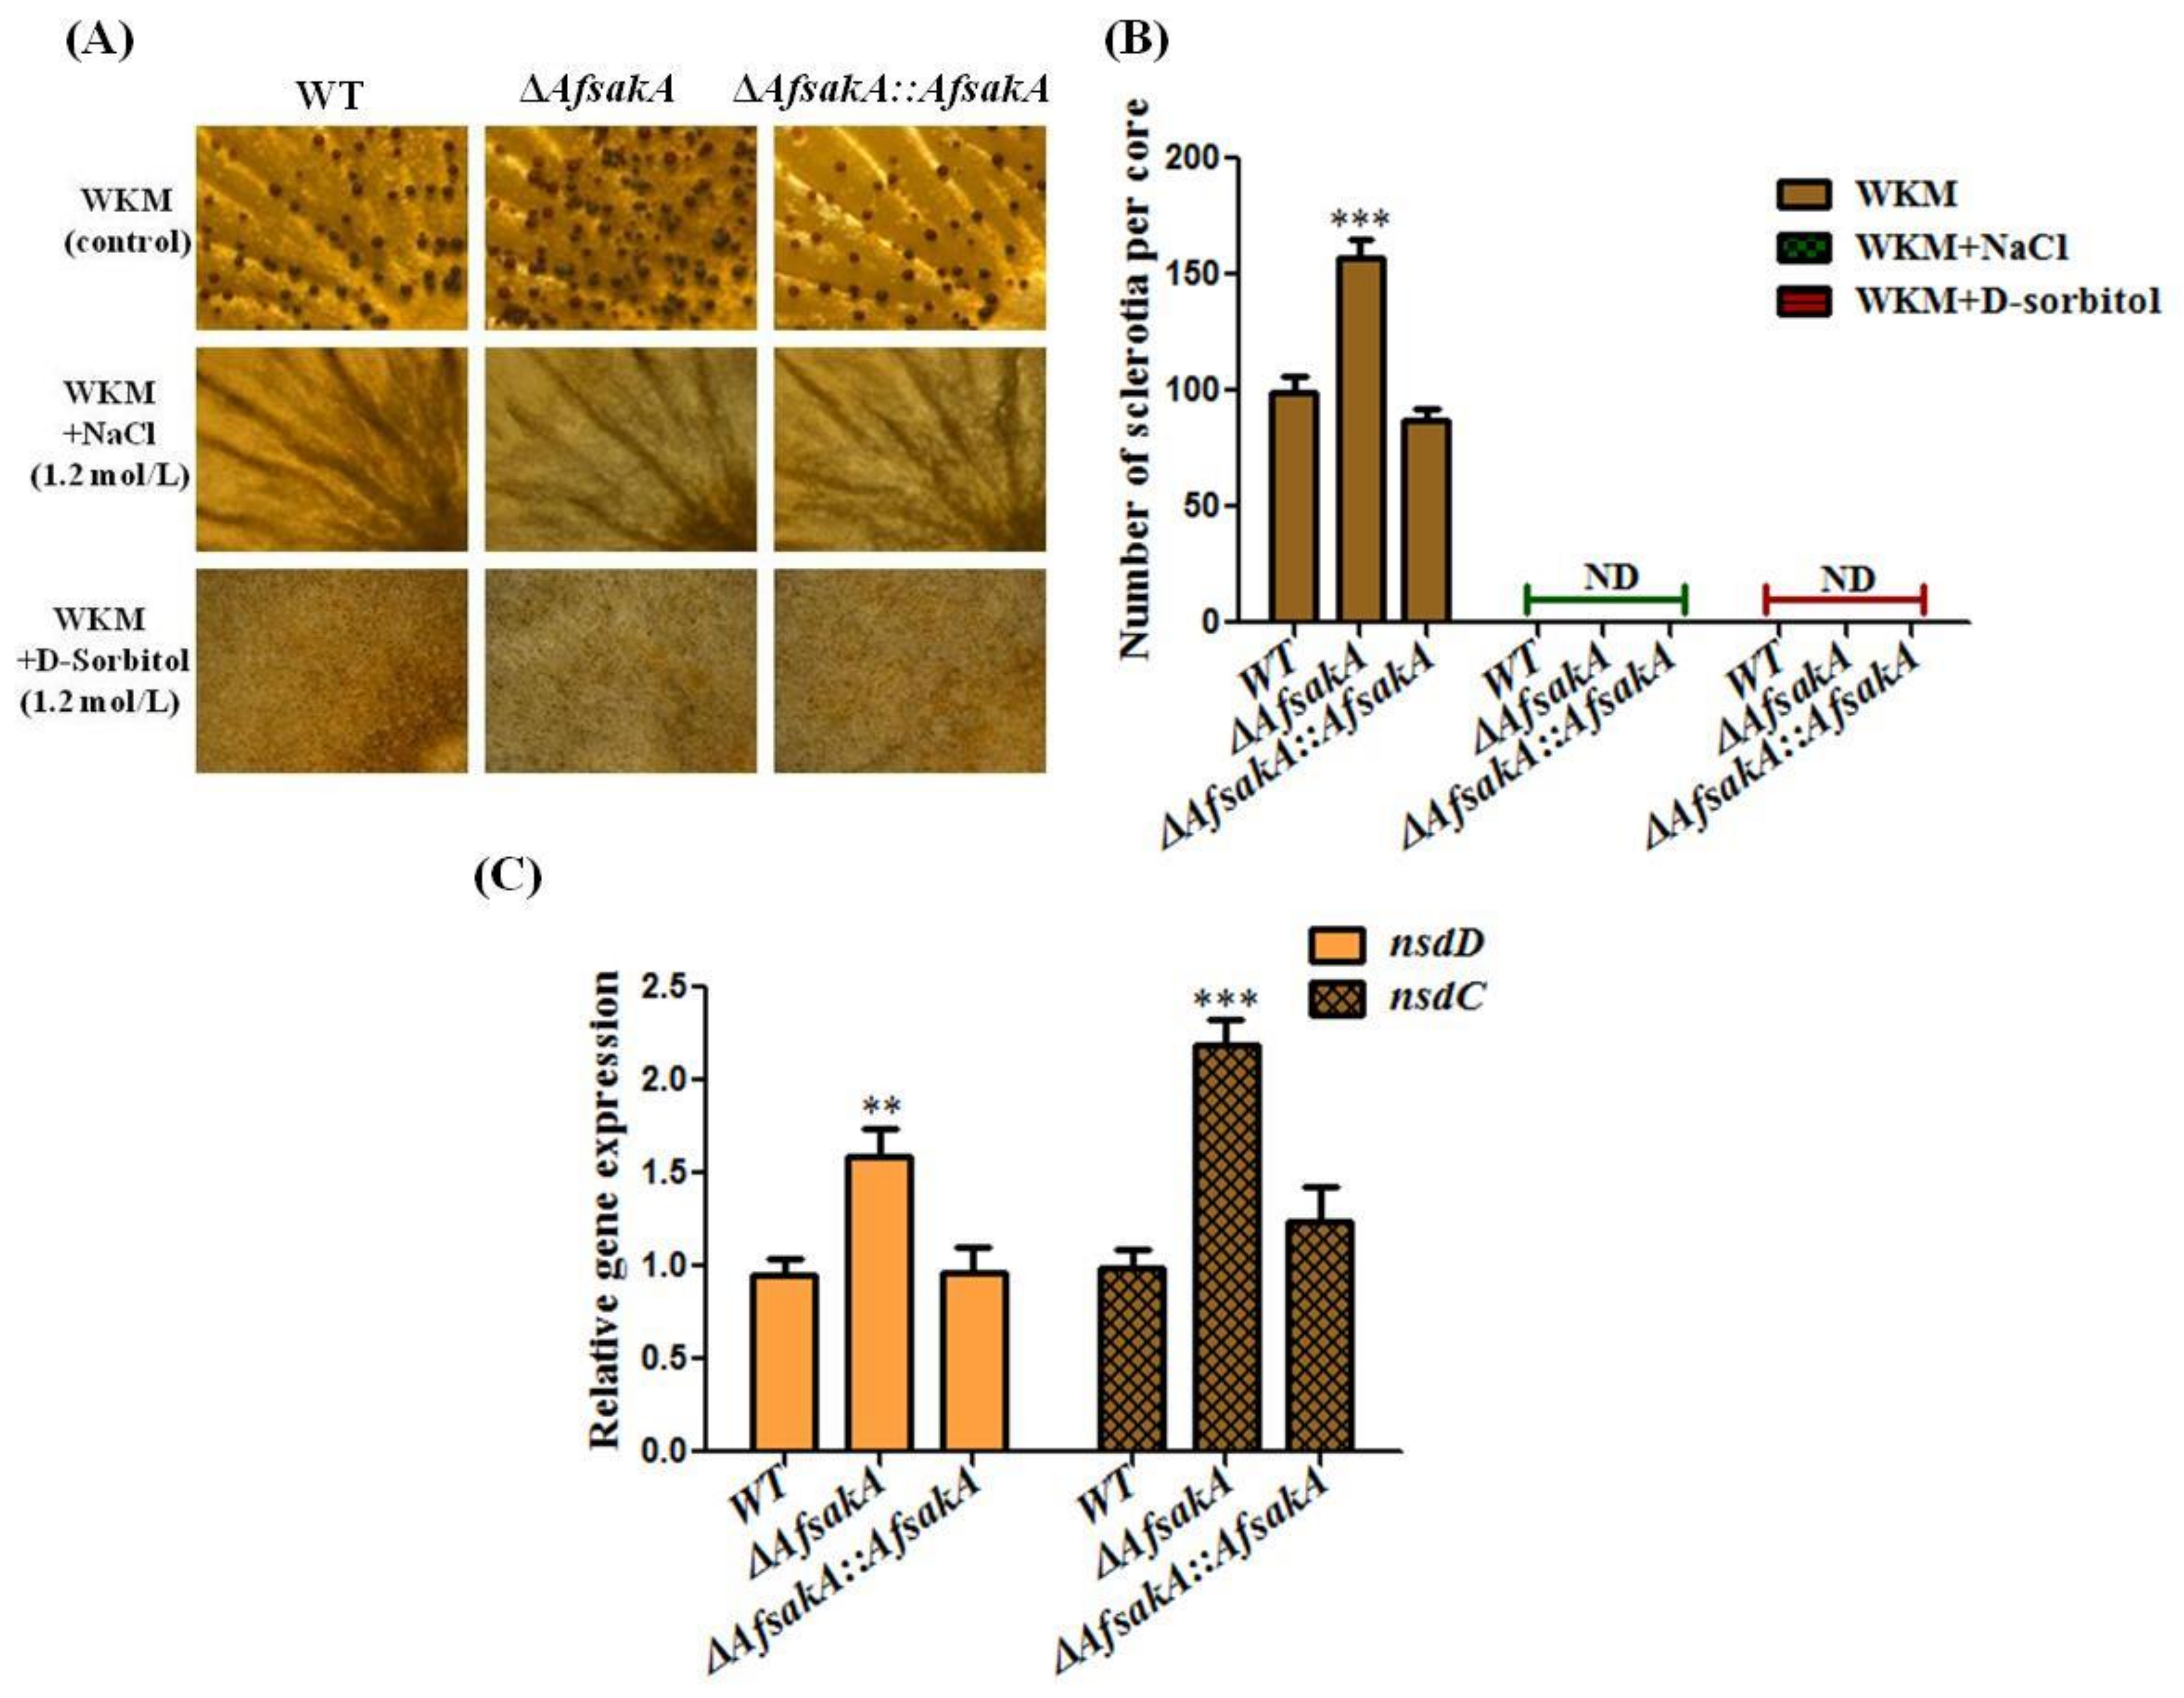
2.5. Effects of AfsakA Deletion on Sclerotia Production in A. flavus

It has been previously stated that A. flavus produces the sclerotia, which are known to be the sexual reproductive and survival structures that allow fungi to adjust to unsuitable environments [33] and some studies argued that sclerotia formation is inhibitory affected under osmotic stress [15,34]. In order to identify the role of AfsakA in sclerotia production, the strains were grown at 37 °C for 7 days on sclerotia-generating WKM medium in the presence/absence of osmotic stress agents. Results showed that sclerotia production in ∆AfsakA mutant was significantly increased on WKM without any osmotic stress agents in contrast to both WT and ∆AfsakA::AfsakA strains. Also, the expression levels of nsdC and nsdD genes related to sclerotial development was measured to confirmed the obtained results in sclerotia production, The results illustrated that the expression levels of both genes were higher in ∆AfsakA than that in ∆AfsakA::AfsakA and WT strains with no stress (Figure 5C). Of significance, WKM medium under osmotic stress could not produce sclerotia in all strains (Figure 5A,B). All these findings suggest that AfsakA could play a negative role in sclerotia production and osmotic stress might influence sclerotia formation in A. flavus.

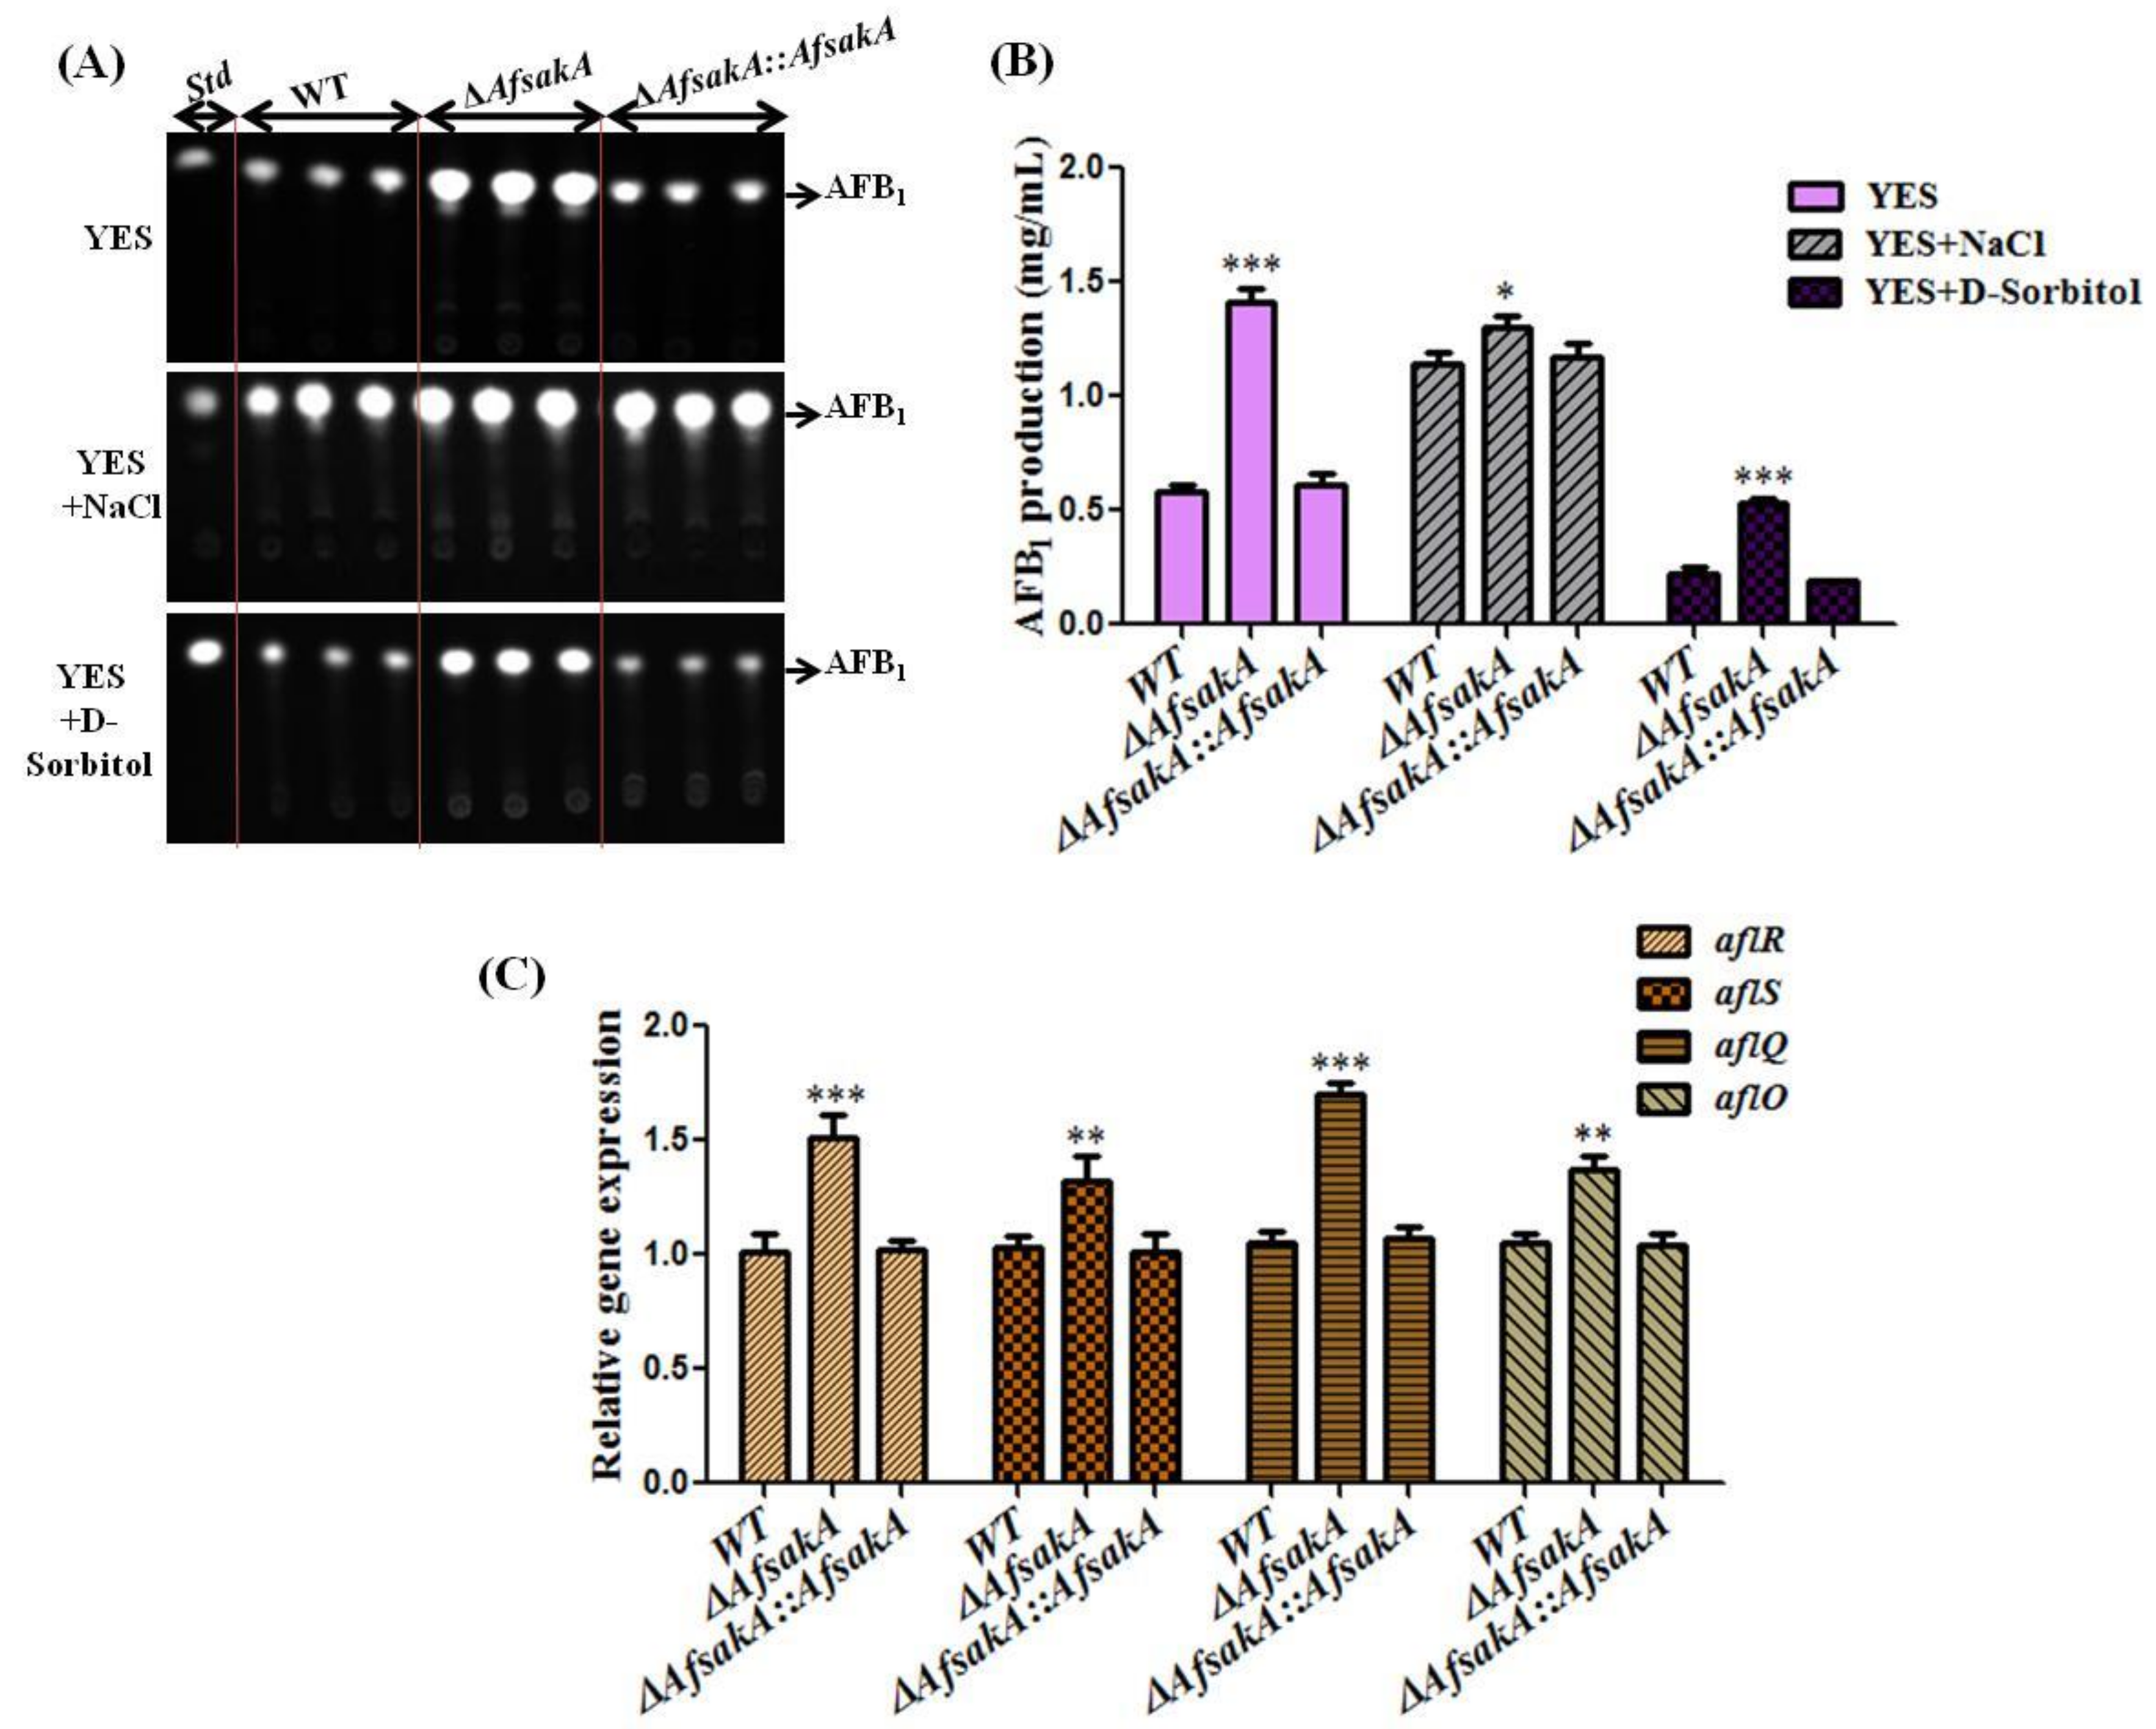
2.6. AfsakA Plays a Negative Role in Regulating AFB1 Biosynthesis in A. flavus

To further investigate the role of AfsakA in biosynthesis of aflatoxin, WT, ∆AfsakA and ∆AfsakA::AfsakA strains were grown at 29 °C for 5 days on a YES agar medium with and without osmotic stress supplements and tested by TLC (Thin Layer Chromatograph) (Figure 6A). TLC results showed that in contrast to the WT and ∆AfsakA::AfsakA, ∆AfsakA mutant produced more AFB1 under YES and stressed medium (Figure 6A,B). Furthermore, we evaluated the expression levels of aflR, aflS, aflQ and aflO genes (genes related to aflatoxin biosynthesis) in these strains. We found that, without osmotic stress, the transcription levels of all 4 candidates were apparently enhanced for the disruption of AfsakA (Figure 6C). Taken together, these results indicate that AfsakA could reduce aflatoxin biosynthesis by suppressing gene expression of the aflatoxin cluster in A. flavus.

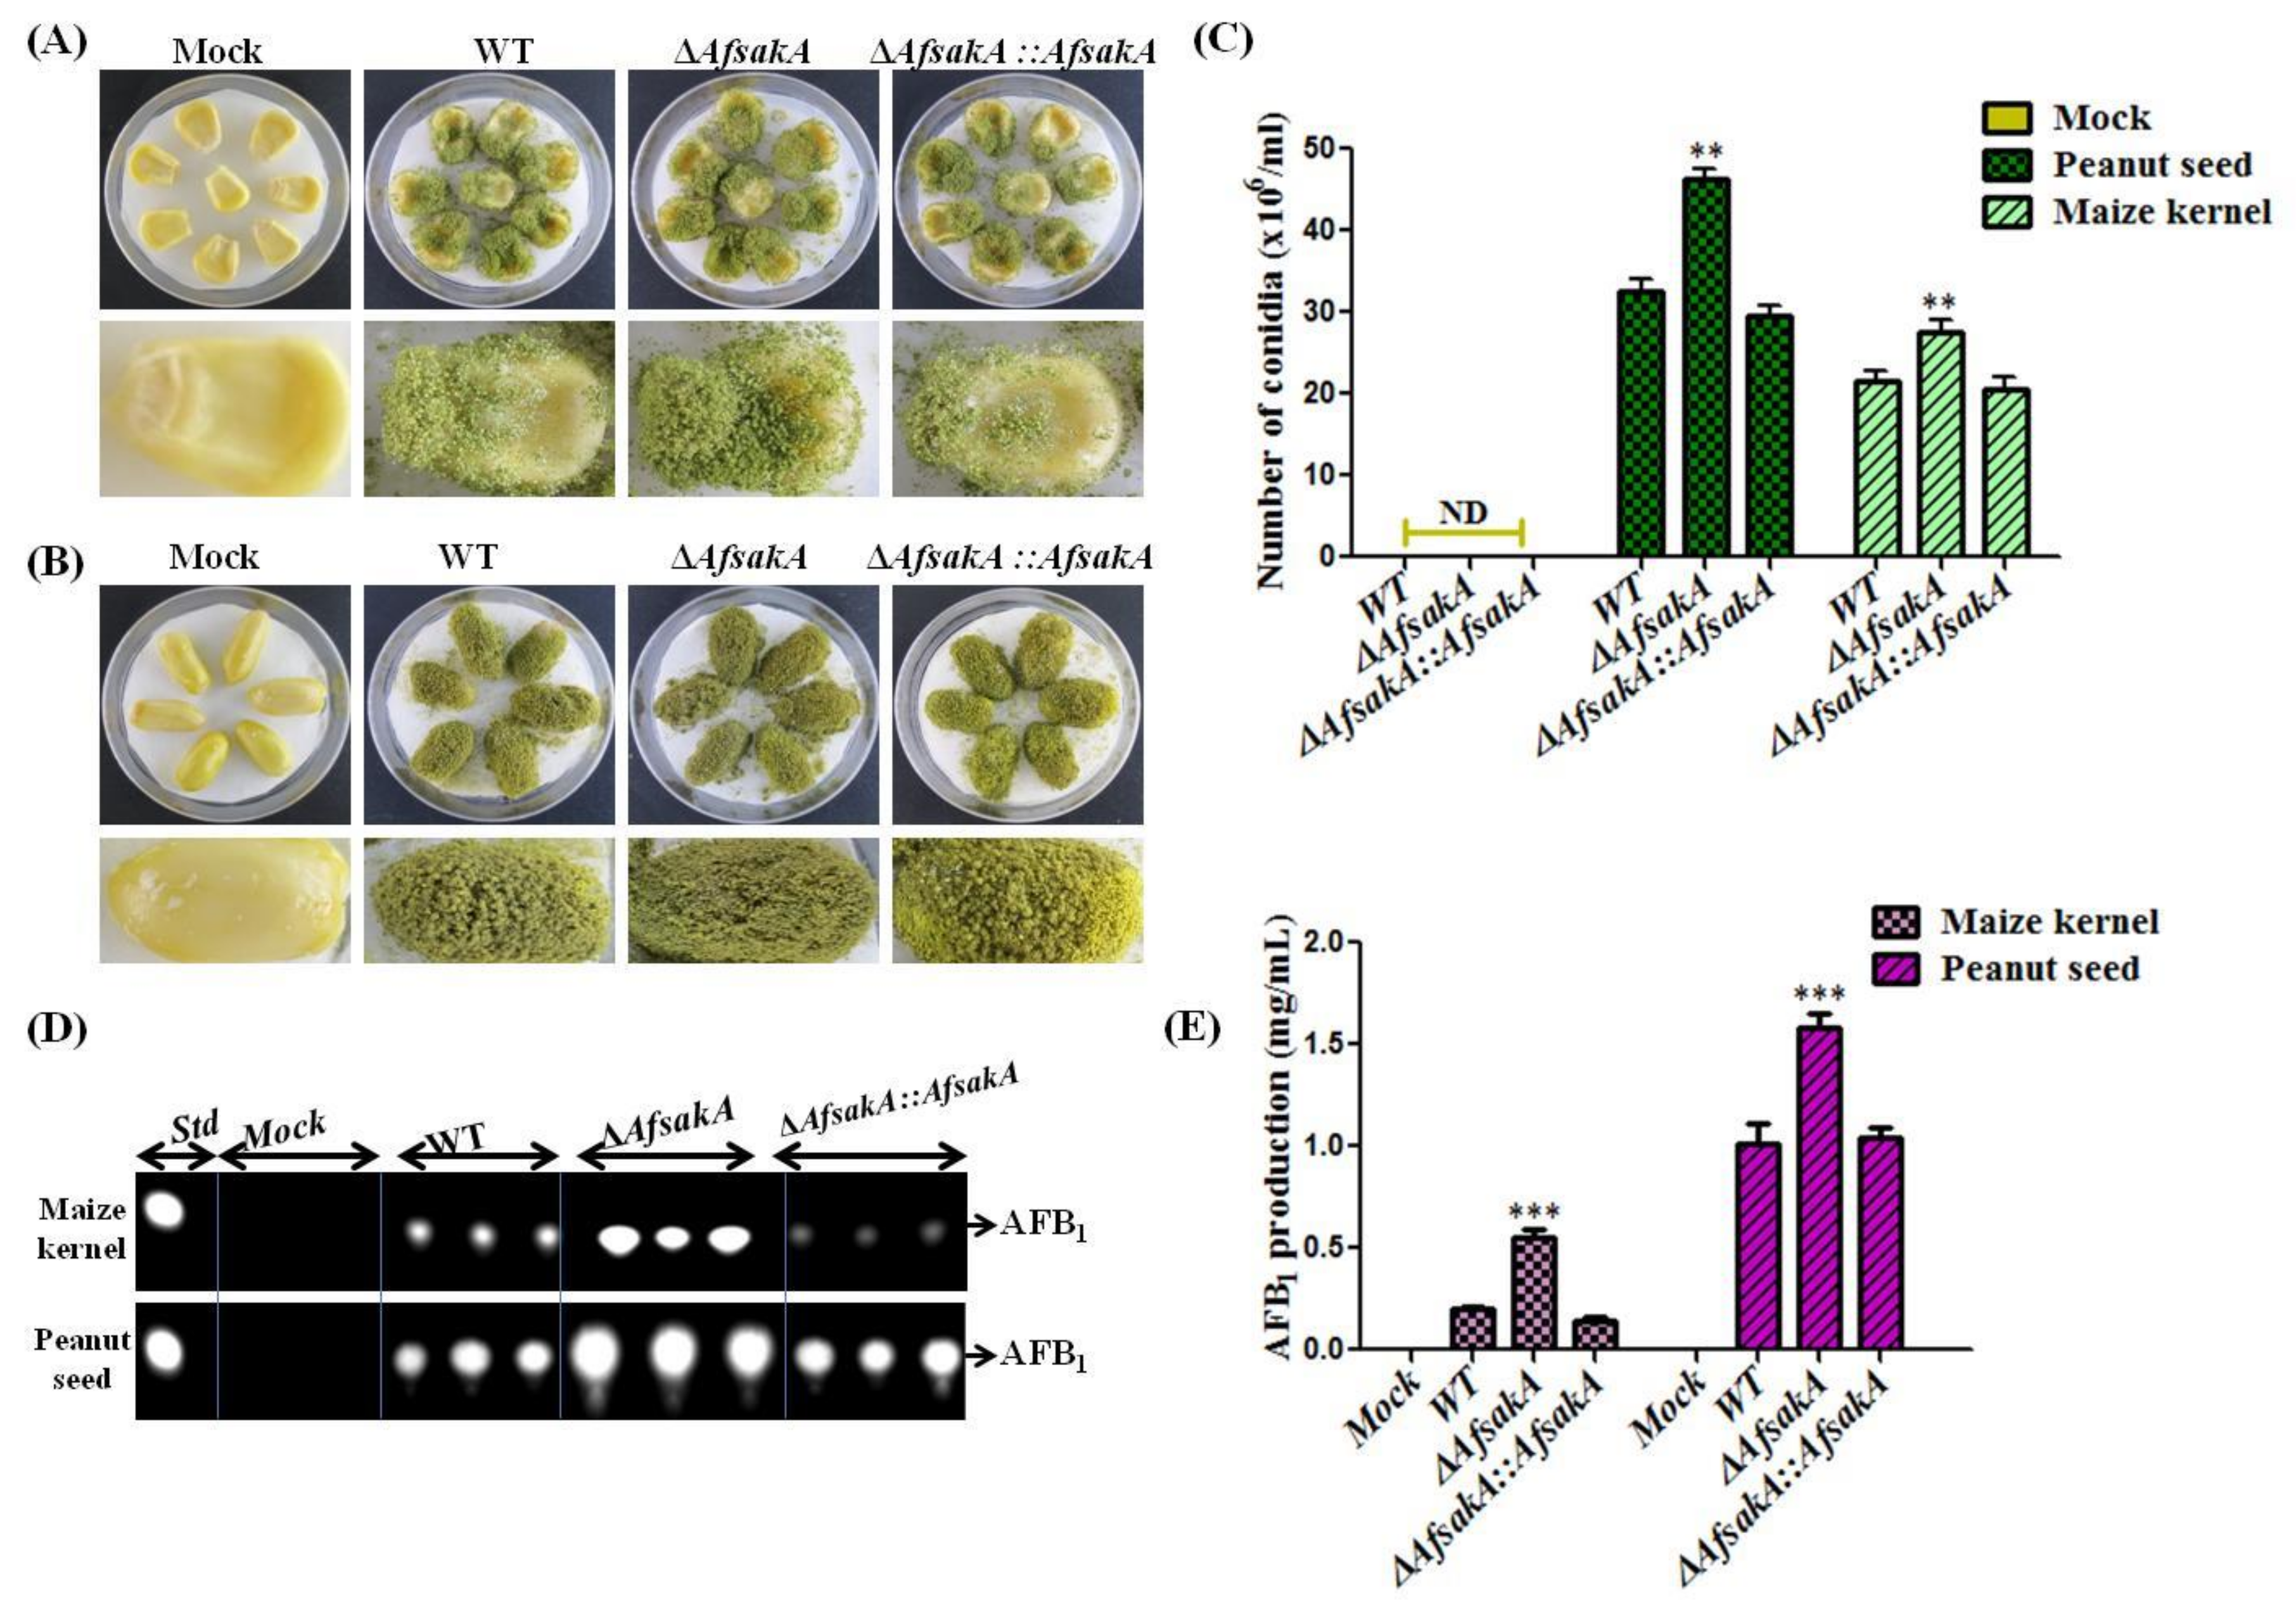
2.7. AfsakA Has an Influence on Virulence to Crop Seeds

As indicated early, A.flavus is capable of colonizing a large number of seed crops. This characteristic was taken advantage of investigating the effect of AfsakA on pathogenicity. To do this, both maize kernels and peanut seeds were infected with ∆AfsakA::AfsakA, ∆AfsakA and WT strains and grown for 6 days at 29 °C in the dark. Seeds treated with water (mock inoculation) were used as a control to ensure they were free from any infection. We found that ∆AfsakA strain appeared to produce more dark green conidia than complementation and WT in both the maize kernels and peanut seeds (Figure 7A,B). We also calculated the amount of conidia produced by each strain on seed crops and found that AfsakA deletion mutant produced more conidia compare to other strains (Figure 7C). Consistent with the previously results for the strains grown in YES agar media, ∆AfsakA strain produced more AFB1 on the infected crop seeds than the WT and ∆AfsakA::AfsakA (Figure 7D,E). All these findings suggest that AfsakA may have an influence on virulence to crop seeds.

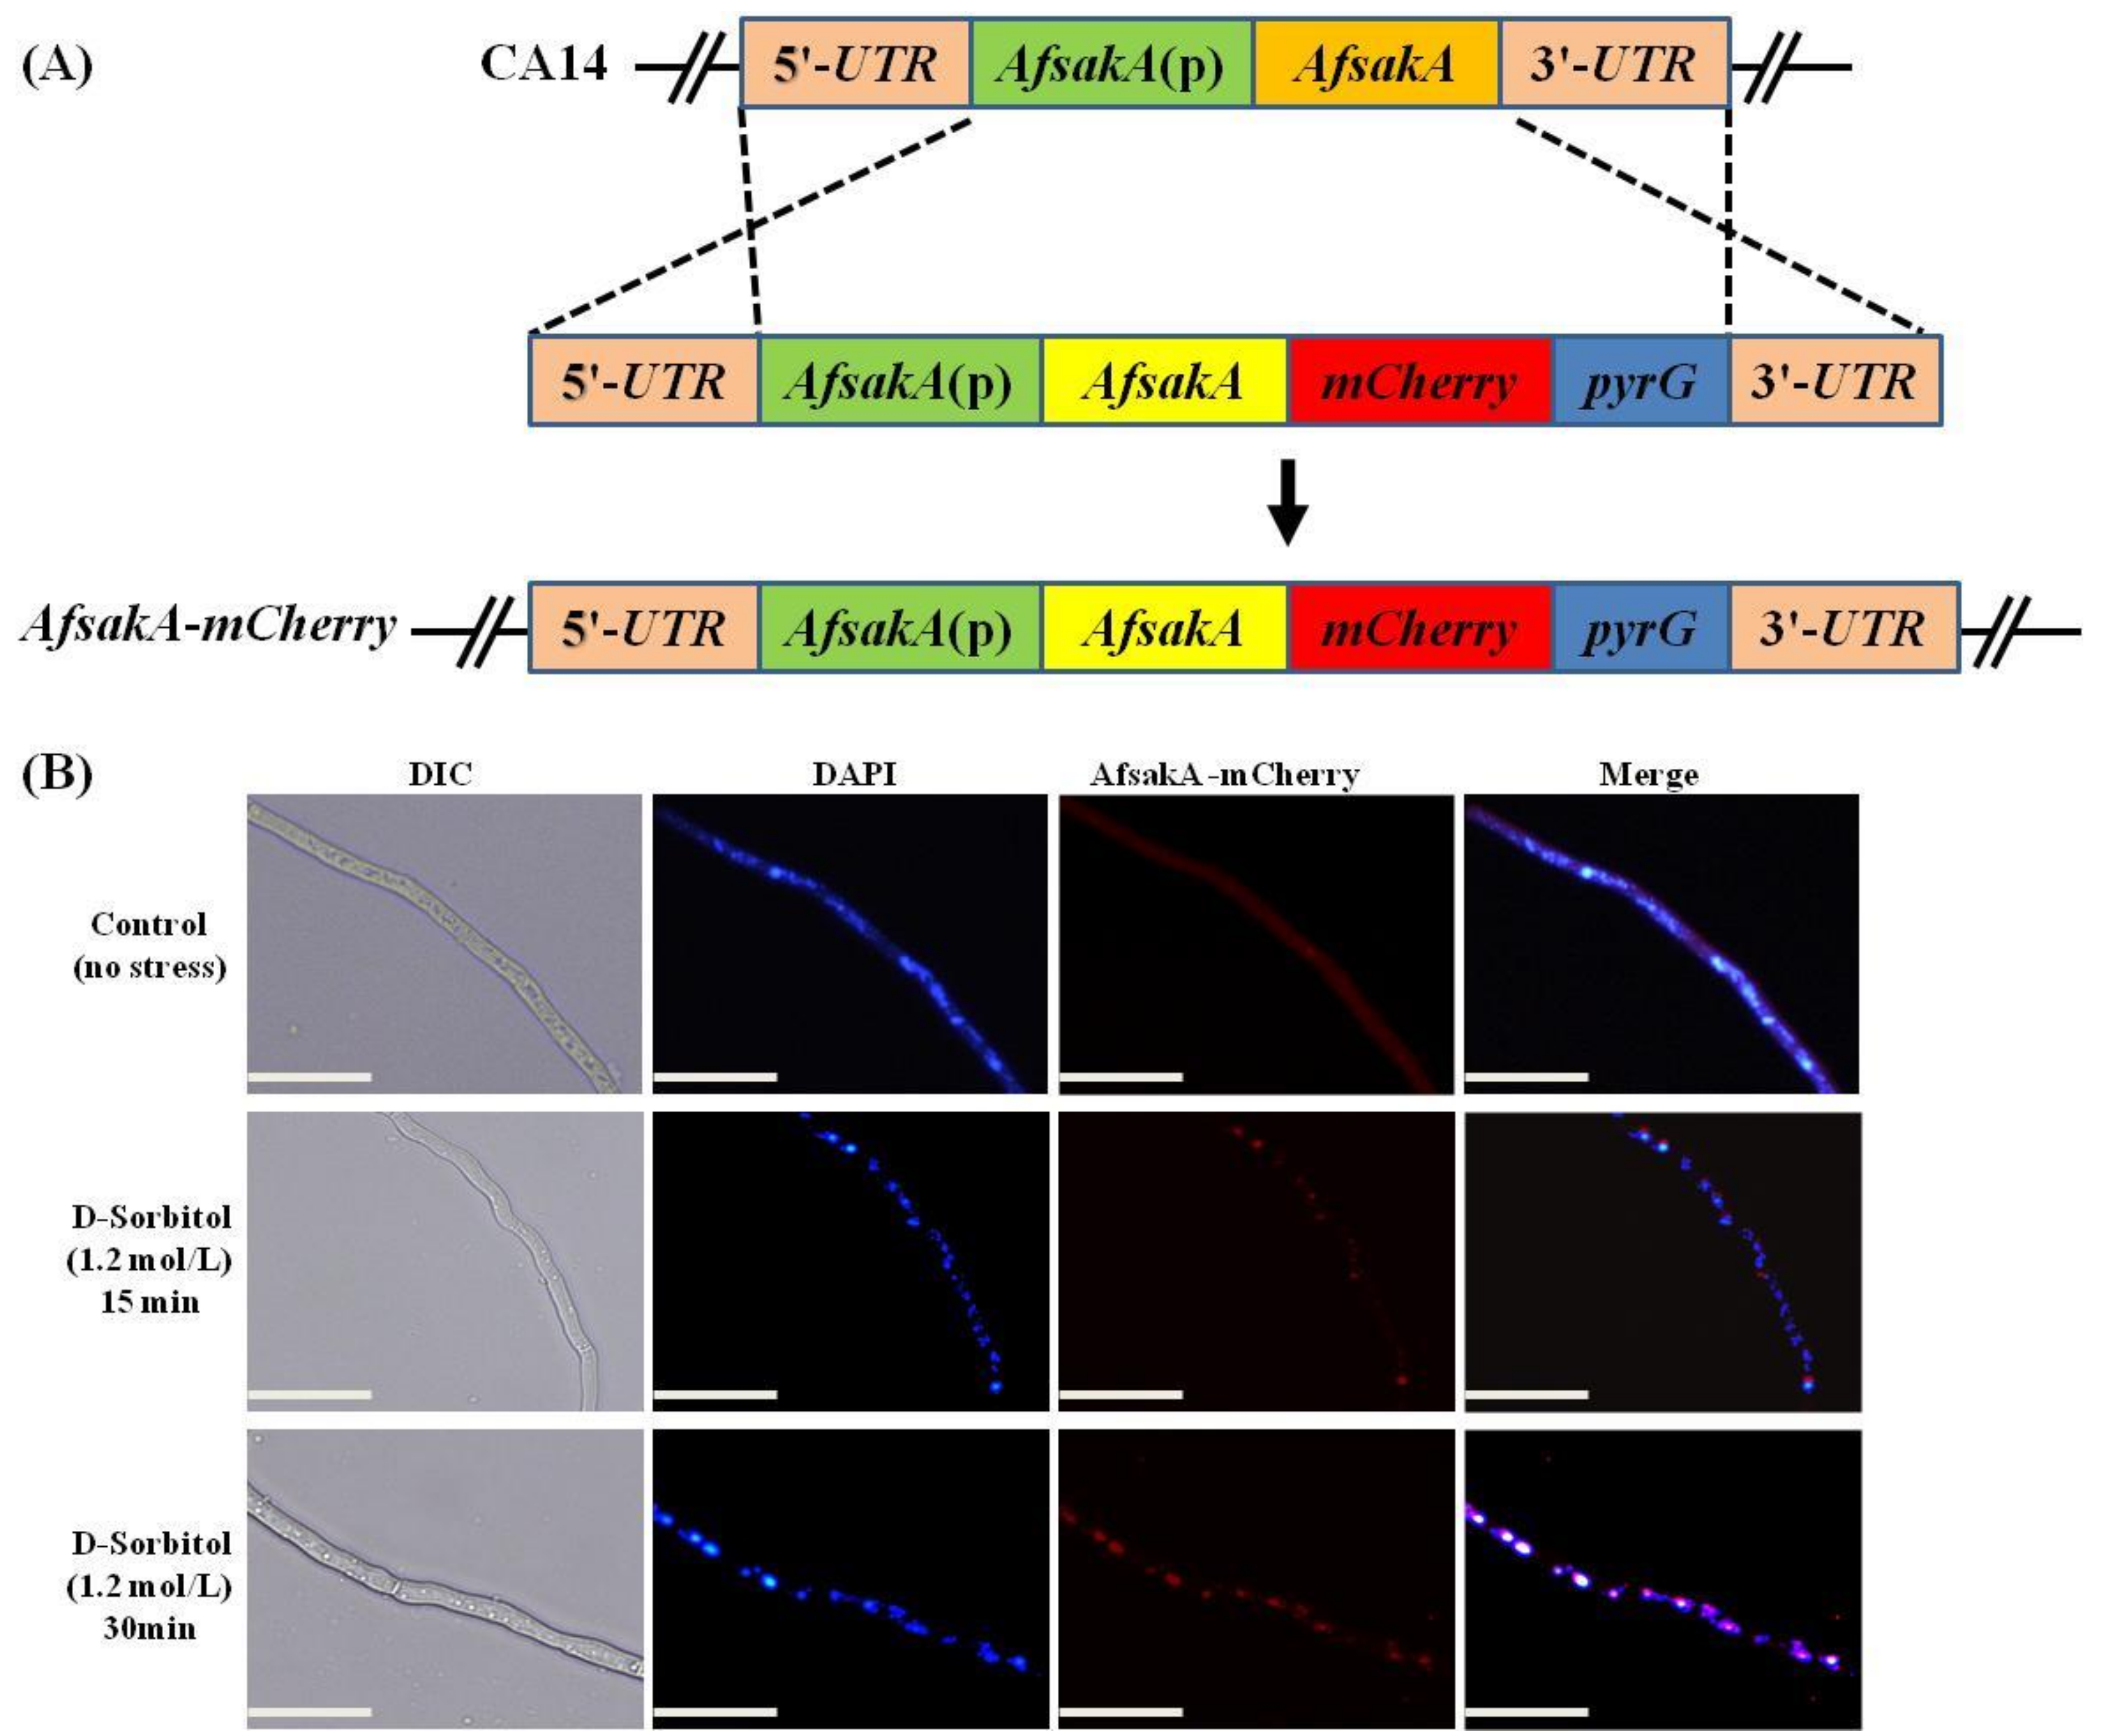
2.8. Subcellular Localization of AfSakA in A. flavus

In order to identify subcellular location of the target AfSakA, mCherry tag was assembled at the C-terminal of AfSakA (AfSakA-mCherry) under the control of the native promoter (Figure 8A). The constructed AfSakA-mCherry vector was transferred into the protoplast of A. flavus CA14 strain. The AfsakA-mCherry showed the same phenotype as the WT (data not shown), implying that mCherry fusion did not affect the phenotype of A. flavus. The AfsakA-mCherry strain was grown overnight in YES liquid medium and osmotic stress agents were added to this medium while the control was left untreated. We found that, during the vegetative growth, the control showed a frail and diffused fluorescence signal in the cytoplasm of hyphae, whereas a strong fluorescence was observed in the hyphae’s nucleus on a medium with 1.2 mol/L NaCl after 15 and 30 min of incubation. (Figure 8B). These findings suggest that AfSakA is located in the cytoplasm in the absence of stress, while it translocated into the nucleus under osmotic stress.

2.9. Effects of AfsakA Deletion on Growth and Sensitivity to Stress

AfsakA involves in responses to osmotic and cell wall stress in many fungi. Therefore, we studied the effect of AfsakA under stress conditions in A. flavus. At the beginning of this study, a series of studies were conducted to identify the type of stress that has greater effects on growth and sensitivity following the deletion of AfsakA. The above was done by first analyzing the effects of AfsakA deletion on growth and sensitivity to different types of stresses using various stress stimuli. The former included genotoxic stress, cell wall stress, osmotic stress and oxidative stress. It was found that significant response was found under Cell wall and osmotic stress.
Consistent with the aforementioned, we then decided to find out what might happen once the cell wall stress alone and/or osmotic stress is applied. As such, we investigated the sensitivity of WT, ∆AfsakA and ∆AfsakA::AfsakA strains under cell wall stress and/or osmotic stress. All strains were spotted on YES agar medium in the absence of stress stimuli (control) and with cell wall damaging agents (SDS, CR) with and without osmotic stress agent (NaCl). All the cultures were grown in the dark for 4 d at 37 °C and photographed (Figure 9A). Then, we measured the diameter of each colony and calculated the growth rate inhibition (Figure 9B). We observed that on media with SDS and CR+NaCl, the ∆AfsakA mutant was more sensitive than the WT and ∆AfsakA::AfsakA. However, on media containing CR, the ∆AfsakA mutant showed slightly relative levels of stress tolerance in contrast to WT and ∆AfsakA::AfsakA. Interestingly, medium supplemented with SDS+NaCl completely inhibited growth of all strains. The aforementioned findings suggest that AfsakA responds to all simultaneously induced stresses (cell wall stress + osmotic stress) and cell wall stress stability in A. flavus.

3. Discussion

It has been demonstrated that MAPK signaling pathway plays an important role in eukaryotic organisms and cascades of MAPK involves in regulating the apoptosis, growth, expression of the genes, hyperosmoregulation, cell division, cell endurance and ascospore development [17,19]. Similarly, in both A. fumigatus and A. nidulans, sakA gene intervenes in MAPK signaling cascades in HOG pathway as an osmotic regulator. SakA gene is also a homologue of hog1 within the S. cerevisiae [13,14,19] and acts as an essential response to numerous types of stress [13]. In the present study, our main interest was to understand how MAPK AfsakA gene responds to osmotic stress signals in A. flavus. During the identification process of our target gene in A. flavus, we realized that sakA gene was conserved among all Aspergillus species. The sequence alignments of all the analyzed fungal species revealed that sakA has high similarity as they all share a highly conserved protein kinase domain. All these results confirmed that sakA is conserved in MAP kinase/SAPKs family, which is in consistence with earlier studies that sakA gene was found to encode a part of MAPK gene family in both A. nidulans [19] and P. marneffei [20].
The function of AfsakA in responses to osmotic stress was examined. ∆AfsakA proved to be more sensitive to 1.2 mol/L D-Sorbitol than WT and ∆AfsakA::AfsakA strains and our results also demonstrated that growth rate in ∆AfsakA could be related to the expression of the HPS, GPD, GRE and STL genes which are related with osmolarity. Surprisingly, when using 1.2 mol/L NaCl, no growth rate differences were detected in all the strains. As a result, we suspect that AfsakA involves in multiple mechanisms that contribute to osmotic regulation. The above was corroborated by Xue et al. [23] who reiterated that A.fumigatus sakA deletion affect growth and conidia germination at a high osmolarity (1 mol/L NaCl). The current results were also supported by the findings of Nimmanee et al. [20] and Hagiwara et al. [31] who previously reported that A. fumigatus sakA gene contributes to the regulation of hyperosmotic stress.
Conidiophores are known as the multicellular structures which produces conidia during the vegetative growth under favorable conditions and in a particular period of time [32]. In the present study, we evaluated the role of AfsakA gene in asexual development (conidiation) and we found that ∆AfsakA mutant produced less conidia than other strains in the absence of environmental stress. In the presence of extracellular stress induced by 1.2 mol/L NaCl, ∆AfsakA exhibited a significant increase in conidial formation, whereas with 1.2 mol/L D-sorbitol, ∆AfsakA illustrated a decrease in conidial formation in contrast to WT and ∆AfsakA::AfsakA strains. We concurrently found that without stress the expression levels of abaA and brlA genes which are related with conidia production were significantly down-regulated in ∆AfsakA compared to that in both WT and complemented strains. Previous studies indicated that an increased amount of sorbitol increases the conidia production in A. nidulans [15,35]. Mert et al. [36] and Duran et al. [15] also indicated that a decrease in conidia production was observed when A. flavus was cultured on a medium with a high amount of NaCl. These results taken together indicate that AfsakA might play an essential role in asexual development more especially in the survival of conidia and conidiophores under harsh conditions. This corroborates the findings in the earlier study by Kawasaki et al. [19] which reported that A. nidulans sakA plays a role in the asexual development where it regulates the genes that are involve in sustention of conidia and their persistence.
Sclerotia are the sexual reproductive and survival structures which are produced by different fungi which helps fungi to adapt to unsuitable environmental conditions [33]. Our results indicated that A. flavus produced sclerotia in the absence of stress and the deletion of AfsakA increased sclerotia production in contrast to other strains. This might be due to inactivation of AfsakA affected other signal pathway that are involved in normalization of sexual development in A. flavus. Further, the qRT-PCR results of the expression level of nsdC and nsdD genes related to sclerotial development indicated that the expression levels of both genes were significantly up-regulated in ∆AfsakA than that in ∆AfsakA::AfsakA and WT. Putting all these results together, we can confirm that AfsakA regulates the sexual development of A. flavus and the hyperosmotic stress may have been preventing, delaying or inhibiting sclerotia formation. Our results showed that under osmotic stress, sclerotia could not be produced in all strains after 7 days of incubation at 37 °C. Other studies also confirmed that salt stress have inhibitory effect on sclerotia production in various fungal species viz. Sclerotium rolfsii, Sclerotinia sclerotiorum and Rhizoctonia solani [15,34]. Moreover, stressed fungi with different types of salts produced fewer sclerotia in contrast to the unaltered control [34] after 15 d of incubation. In 1999, Ramos et al. [37] also reported that A. ochraceus treated with different levels of water activity exhibits different levels of sclerotia formation. They went on and indicated that sclerotia were freely produced in A. ochraceus treated with more than 0.99aw, while only initials were formed for A. ochraceus treated with 0.975aw and no sclerotia at all were produced for A. ochraceus treated less than 0.975aw.
The characterization of the function of AfsakA in aflatoxin production was also performed. Obtained data proved that ∆AfsakA considerably increased the production of AFB1 compared to WT and ∆AfsakA::AfsakA when the agar medium was induced by hyperosmotic stress agents. This finding is consistent with the observed increase of the transcription levels of aflR, aflS, aflQ and aflO genes which are related to aflatoxin biosynthesis. Therefore, we can conclude that sakA gene acts by negatively regulating the aflatoxin formation while the osmotic stress affects the biosynthesis of aflatoxin in A. flavus. However, the details on the function of sakA gene in AFB1 biosynthesis under hyperosmotic are still unknown in other world of fungi.
In a recent study, Nascimento et al. confirmed that sakA and mpkC collaborate during A. fumigatus virulence in neutropenic mice [13]. An earlier study by Rementeria et al. [38] indicated that not only sakA involved in the cellular homeostasis regulation but also participates in a coordinated response to H2O2. Moreover, it has been demonstrated that sakA homologue, that is, hog1 gene, has a major function in virulence and stress response in Cryptococcus neoformans [39]. In the present study, we examined the role of AfsakA in pathogenicity by infecting both the maize kernels and peanuts seeds. Results revealed that ∆AfsakA strain on the infected crop seeds appeared to produce a higher number of dark-green conidia than the WT and complemented strains in A. flavus and ∆AfsakA increased the production of AFB1 on the infected crop seeds than the WT and ∆AfsakA::AfsakA. The above findings suggest that AfsakA has an influence on virulence and pathogenicity.
Here, we also addressed the effect of AfsakA on sensitivity of A. flavus to cell wall stress and the simultaneous induction of both cell wall and osmotic stresses. We discovered that the growth inhibition of ∆AfsakA mutant was greater on media with SDS and CR+NaCl compared with WT and ∆AfsakA::AfsakA. However, all strains were unable to growth in the presence of SDS+NaCl. Our results suggested that AfsakA gene has an influence on these two simultaneous induced stresses and on cell wall integrity. Our results was reliable to the former studies on A. fumigatus which showed that sakA plays the important functions in responses to various stresses such as osmotic stress, heat shock, oxidative stress and cell wall damage [13]. Nimmanee et al. [17] reported that S.cerevisiae Hog1 protein responds to UV, heat, oxidative stress, heavy metal and cell wall interfering agents. These studies also mentioned that Hog1 protein has an important role in the transmission process of osmotic pressure signals. So far, no report was found on the response of sakA under simultaneously induced stress, that is, cell wall stress together with osmotic stress.
Alves de Castro et al. [40] found that SakA was translocated to the nucleus of A. fumigatus after 30 min of exposure to osmotic stimuli. Similarly, Nascimento et al. [13] noticed a fast migration of A. fumigatus SakA to the nucleus after 10 min of exposure to osmotic stress. This was in consistence with our result which showed that AfsakA was located into cytoplasm of hypae in the absence of osmotic stress and migrated to the nuclei of the hyphae upon the exposure to the osmotic stress. Our results were also supported by the findings by Lara-Rojas et al. [41] which indicated that in the absence of an induced stress on hyphae, A. nidulans SakA was not located in the nucleus.

4. Conclusions

In conclusion, AfsakA gene was deleted (∆AfsakA) and complemented (∆AfsakA::AfsakA) using homologous recombination. We found that AfsakA plays an essential role in the production of sclerotia, conidiophores and conidia, as well as mycelia growth, AFB1 production and virulence in A. flavus. In addition, AfsakA plays a tremendous role in the regulation of both the osmotic and cell wall stresses in A. flavus. It was also found that AfSakA is located in the cytoplasm in the absence of osmotic stress and translocates into the nucleus upon exposure to hyperosmotic stress. It is believed that this research provides a more reliable and practical insights on how to control A. flavus infections based on the full understanding of AfsakA gene functions. Moreover, our findings present the vital information that helps us to understand how to prevent the aflatoxin biosynthesis. Consistent with the aforementioned, we found that it is possible to mitigate damages caused by A. flavus to the agriculture commodities and to control the invasive fungal infections in human and animals by storing both the harvested crops and food commodities in conditions different to those that favor the production of AFB1 (i.e., the latter being in the dark at 29 °C). Furthermore, we found that AfsakA negatively regulated the biosynthesis of AFB1. In the future work, we could find the inducers of AfsakA to inhibit the toxin production in the crops such as peanut and maize.

5. Materials and Methods

5.1. Fungal Strains and Culture Conditions

All A. flavus strains used in this study were described in Table 1. The plasmids DNA were extracted from E. coli strain. YES (Yeast Extract Sucrose) media [42] supplemented with or without 1.2 mol/L NaCl, 1.2 mol/L D-sorbitol were used to evaluate the growth rate, conidial development and AFB1 production. Similarly, YES media supplemented with or without 100 µg/mL SDS (Sodium dodecyl sulfate) and 200 µg/mL Congo Red were used to analyze the influence of cell wall stress after AfsakA deletion. Also, a wickerham medium (WKM) [43] complemented with/without osmotic stress agents was utilized to determine sclerotia production. The wild-type (WT), knockout and complementation mutant strains were cultured and grown in dark condition at the 37 °C and 29 °C which are the optimum temperatures for A. flavus growth and AFB1production respectively. Every strain was cultured and grown at least on four replicate plates and every experiment was repeated three times.

5.2. Sequence and Phylogenetic Tree Analysis

AfsakA gene sequence with the accession number AFLA-099500 and protein sequence with query ID EED46287.1 were obtained from the National Center For Biotechnology Information Database (NCBI). Protein sequences of other sakA orthologs were also downloaded from NCBI using blast algorithm with AfSakA protein sequence as inquiry. Protein kinase domains were constructed by using free software called Illustrator for Biological Sequences Version 1.0 (IBS1.0). Molecular Evolutionary Genetic Analysis Version 7.0.26 (MEGA 7) software was used to align sequences (ClustalW toolbox) and created the phylogenetic tree.

5.3. Construction of AfsakA Deletion and Complementation Strains

The deletion mutant ΔAfsakA was obtained by using homologous recombination method [42,45]. Standard PCR and A. flavus genomic DNA extraction were also carried out as formerly described [46]. Both 1307 bp upstream and 1096 bp downstream sequences of AfsakA gene were obtained from https://0-www-ncbi-nlm-nih-gov.brum.beds.ac.uk/ and the primers used in this study were listed in Table 2. Overlap PCR was carried out to join them and form a knockout cassette as A-pyrG-B. A. flavus CA14 were used as a starting strain during the preparation of protoplast [47] and the knockout cassette transformation was conducted and successively verified as previously described [44,47]. In order to obtain complementation strain ∆AfsakA::AfsakA, we followed the method described by Yao et al. [48] and transformants were verified by PCR and qRT-PCR. The primers used for qRT-PCR were listed in Table 3.

5.4. Stress Assay

A YES agar medium supplemented with/without osmotic stress mediators (1.2 mol/L NaCl, 1.2 mol/L D-Sorbitol) and cell wall stress agents (100 µg/mL SDS, 200 µg/mL Congo Red) were inoculated with WT, knockout and complementary A. flavus strains. Four plates were used for each strain and incubated for 4 days in dark conditions at 37 °C (optimum growth conditions). The mycelium diameter was then measured and the growth inhibition rate was subsequently calculated. The following formula was used for this calculation: Growth rate inhibition = ((diameter of the unstressed strain—diameter of the stressed strain)/diameter of the unstressed strain) × 100.

5.5. Morphological Analysis

To determine the amount and quality of sclerotia, conidiophores and conidia, all the A. flavus strains were grown, photographed, measured and observed under microscope. To evaluate conidial formation, YES solid media in the presence or absence of osmotic stress agents were poured onto plates (15 mL per plate). After 4 days, conidia were harvested and counted as previously described [49,50]. In order to evaluate the amount of conidiophores produced, YES solid media with and without stress was also used and the strain cultures and mycelia were grown in the dark at 37 °C for 2 days. The hyphae were cut and added to a glass slide and observed through light microscope the following day. Determination of sclerotial formation was carried out as a former described method [51] with minor modification. In short, all strains were inoculated in WKM agar media supplemented with/without osmotic stress compounds as mentioned above, then grown in the dark for 7 days at 37 °C. Afterward, conidia were washed with 75% ethanol to allow visualization and counting of sclerotia.

5.6. Determination of AFB1 Production

A. flavus WT, ΔAfsakA and ΔAfsakA::AfsakA strains were inoculated onto a petri dish with 15 mL of YES agar media in the presence/absence of the aforementioned osmotic pressure agents. AFB1 was analyzed as previous method [47,52,53] with slight modifications. To produce AFB1, cultures were incubated for 5 days under the optimum condition (29 °C in dark conditions). Chloroform was used to extract the AFB1 and the extracts were spotted on TLC (Thin layer chromatography plate). The plate was added into a developing chamber containing a developing solvent of chloroform and acetone (9:1 v/v) and results were viewed under ultra violet (UV) light at 365 nm. Gene Tools image analysis system software version 4.03.05.0 was used for the quantification of AFB1.

5.7. Localization of AfsakA gene in A. flavus

AfsakA-mCherry strain was prepared by using a modified published methods [54,55] and the used primers were listed in Table 2. Then, the target gene AfsakA was tagged with mCherry for the construction of AfsakA-mCherry vector through the PCR amplification of four different fragments. AfsakA ORF fragment, mCherry fragment, selection marker pyrG and the downstream region of AfsakA were amplified and fused together by the overlap PCR. The mycelium of positive construct were cultured onto YES liquid medium and grown at 30 °C overnight in the shaker. Different osmotic stress agents were added. Then, mycelia were washed with PBS (Phosphate buffer saline) and stained with 1 µg/mL DAPI (4,6-diamidino-2-phenylindole) to allow the observation of the nucleus. Then, AfsakA gene location was checked in the hyphae for all the stress conditions and at different time interval, using laser confocal scanning microscope.

5.8. Pathogenicity Test

Peanut and maize seeds were used for pathogenicity assay according to the previously illustrated procedure [56,57]. In brief, the maize seed and peanuts cotyledons were inoculated with A. flavus 105 conidia/mL and mock inoculation was used as a control. The seeds were placed in a petri dish (4 replicates for each sample) with a piece of moisture filter paper and incubated for 6 days at 29 °C in a dark condition. Peanuts and maize seeds were collected and placed into 50 mL centrifuge tubes containing 0.05% tween 80 and 15 mL of sterilized water and vortexed for 1 min. For conidia counting, 500 µL aliquot of conidia was diluted and counted haemocytometrically. Aflatoxin was extracted as previously described method by Yuan et al. [58]. The extracted samples were spotted on TLC plate and viewed under ultra violet (UV) light at 365 nm. Gene Tools image analysis system software version 4.03.05.0 was used for the quantification of AFB1.

5.9. Reverse Transcriptase Polymerase Chain Reaction (RT-PCR) and Quantitative Real Time Polymerase Chain Reaction (qRT-PCR)

qRT-PCR were carried out following the descriptions and guidelines that were previously described [53,55] with minor modifications. Consistent with the aforementioned, A. flavus wild-type and mutant strains were inoculated into YES agar media and grown in the dark for 2 days at 37 °C. Their mycelia were then collected and strongly grounded in liquid nitrogen to break down the cell wall material and get access to RNA molecules isolation. The total RNA was extracted from 100mg smashed mycelia for every sample using Total RNA Extraction kit (Promega, Madison, WI, USA). The first strand cDNA for each sample was synthesized from the extracted total RNA using revertAid first strand cDNA synthesis kit (ThermoFisher scientific, Waltham, MA, USA). To analyze qRT-PCR 2xSYBR Green mix kit (Takara Dalian China), a pair of primers (Table 3) for target genes were used and amplified with ThermoFisher scientific Real-time PCR system (PikoReal 96 Real-Time PCR system/from Vantaa, Finland). The valuation of relative transcript level of every target gene was done by the 2−ΔΔCT method [59] and A. flavus actin gene was used as a control. The qPCR test was carried out with technological quadruplet for wild-type, ΔAfsakA and ΔAfsakA::AfsakA and the experiments was repeated at least in triplicate.

5.10. Statistical Analysis

GraphPad Prism Version 5.01 software was used for significance and statistical analysis and every data were presented as ± standard deviation (SD). Afterward, Colum analysis with one way ANOVA were used to find out the presence of statistical differences between the grouped data of at least replicates three values of A. flavus wild-type, ΔafsakA and ΔafsakA::afsakA. Also, for determining the significance difference among the groups, Dunnett’s multiple comparisons test method was used and every column group was compared with control column (WT). Asterisks were used to represent significant different whereby * represents significant different p ≤ 0.05, ** stands for significant different p ≤ 0.01 and *** correspond to significant different p ≤ 0.001.

Author Contributions

J.Y. and S.W. conceive and designed the experiments, J.Y. and E.T. performed the experiments and analyzed the data. D.L., L.Q. and J.S. contributed in the preparation of materials used in the study. J.S., E.T., Y.L. prepared the strains used in the study. W.S. and E.T. wrote the manuscript. All authors read and approved the final manuscript.

Funding

This research was supported by the National Natural Science Foundation of China (Grant No.31600118) and Technology Talents in Fujian Agriculture and Forestry University (xjq201412).

Acknowledgments

We especially thanked Bowen Li for his kindness in providing the plasmid pmCherry-C1 for amplify mCherry. We also thank Guangshan Yao (FAFU, Life Science College) for his advice for this study.

Conflicts of Interest

There is no potential conflict of interest declared by the authors.

References

  1. Krishnan, S.; Manavathu, E.K.; Chandrasekar, P.H. Aspergillus flavus: An emerging non-fumigatus Aspergillus species of significance. Mycoses 2009, 52, 206–222. [Google Scholar] [CrossRef] [PubMed]
  2. Nie, X.; Yu, S.; Qiu, M.; Wang, X.; Wang, Y.; Bai, Y.; Zhang, F.; Wang, S. Aspergillus flavus SUMO Contributes to Fungal Virulence and Toxin Attributes. J. Agric. Food Chem. 2016, 64, 6772–6782. [Google Scholar] [CrossRef] [PubMed]
  3. Rodrigues, P.; Venâncio, A.; Kozakiewicz, Z.; Lima, N. A polyphasic approach to the identification of aflatoxigenic and non-aflatoxigenic strains of Aspergillus section Flavi isolated from Portuguese almonds. Int. J. Food Microbiol. 2009, 129, 187–193. [Google Scholar] [CrossRef] [PubMed]
  4. Davari, E.; Mohsenzadeh, M.; Mohammadi, G.; Rezaeian-Doloei, R. Characterization of aflatoxigenic Aspergillus flavus and A. parasiticus strain isolates from animal feedstuffs in northeastern Iran. Iran. J. Vet. Res. 2015, 16, 150. [Google Scholar] [PubMed]
  5. Hedayati, M.; Pasqualotto, A.; Warn, P.; Bowyer, P.; Denning, D. Aspergillus flavus: Human pathogen, allergen and mycotoxin producer. Microbiology 2007, 153, 1677–1692. [Google Scholar] [CrossRef] [PubMed]
  6. Yu, J.; Chang, P.-K.; Ehrlich, K.C.; Cary, J.W.; Bhatnagar, D.; Cleveland, T.E.; Payne, G.A.; Linz, J.E.; Woloshuk, C.P.; Bennett, J.W. Clustered pathway genes in aflatoxin biosynthesis. Appl. Environ. Microbiol. 2004, 70, 1253–1262. [Google Scholar] [CrossRef]
  7. Cleveland, T.E.; Yu, J.; Fedorova, N.; Bhatnagar, D.; Payne, G.A.; Nierman, W.C.; Bennett, J.W. Potential of Aspergillus flavus genomics for applications in biotechnology. Trends Biotechnol. 2009, 27, 151–157. [Google Scholar] [CrossRef]
  8. Yang, K.; Qin, Q.; Liu, Y.; Zhang, L.; Liang, L.; Lan, H.; Chen, C.; You, Y.; Zhang, F.; Wang, S. Adenylate cyclase AcyA regulates development, aflatoxin biosynthesis and fungal virulence in Aspergillus flavus. Front. Cell. Infect. Microbiol. 2016, 6, 190. [Google Scholar] [CrossRef]
  9. Zhang, F.; Guo, Z.; Zhong, H.; Wang, S.; Yang, W.; Liu, Y.; Wang, S. RNA-Seq-based transcriptome analysis of aflatoxigenic Aspergillus flavus in response to water activity. Toxins 2014, 6, 3187–3207. [Google Scholar] [CrossRef]
  10. Gonçalves, S.S.; Cano, J.F.; Stchigel, A.M.; Melo, A.S.; Godoy-Martinez, P.C.; Correa, B.; Guarro, J. Molecular phylogeny and phenotypic variability of clinical and environmental strains of Aspergillus flavus. Fungal Biol. 2012, 116, 1146–1155. [Google Scholar] [CrossRef]
  11. Yu, J.; Cleveland, T.E.; Nierman, W.C.; Bennett, J.W. Aspergillus flavus genomics: Gateway to human and animal health, food safety, and crop resistance to diseases. Revista Iberoamericana de Micología 2005, 22, 194–202. [Google Scholar] [CrossRef]
  12. Amaike, S.; Keller, N.P. Aspergillus flavus. Ann. Rev. Phytopathol. 2011, 49, 107–133. [Google Scholar] [CrossRef] [PubMed]
  13. Nascimento, B.; de Oliveira, A.C.M.; dos Reis, T.F.; de Castro, P.A.; Hori, J.I.; Bom, V.L.P.; de Assis, L.J.; Ramalho, L.N.Z.; Rocha, M.C.; Malavazi, I. Mitogen activated protein kinases SakAHOG1 and MpkC collaborate for Aspergillus fumigatus virulence. Mol. Microbiol. 2016, 100, 841–859. [Google Scholar] [CrossRef] [PubMed]
  14. Du, C.; Sarfati, J.; Latge, J.; Calderone, R. The role of the sakA (Hog1) and tcsB (sln1) genes in the oxidant adaptation of Aspergillus fumigatus. Med. Mycol. 2006, 44, 211–218. [Google Scholar] [CrossRef] [PubMed]
  15. Duran, R.; Cary, J.W.; Calvo, A.M. Role of the osmotic stress regulatory pathway in morphogenesis and secondary metabolism in filamentous fungi. Toxins 2010, 2, 367–381. [Google Scholar] [CrossRef] [PubMed]
  16. Johnson, G.L.; Lapadat, R. Mitogen-activated protein kinase pathways mediated by ERK, JNK, and p38 protein kinases. Science 2002, 298, 1911–1912. [Google Scholar] [CrossRef]
  17. Nimmanee, P.; Tam, E.W.; Woo, P.C.; Vanittanakom, P.; Vanittanakom, N. Role of the Talaromyces marneffei (Penicillium marneffei) sakA gene in nitrosative stress response, conidiation and red pigment production. FEMS Microbiol. Lett. 2017, 364. [Google Scholar] [CrossRef]
  18. Saito, H.; Tatebayashi, K. Regulation of the osmoregulatory HOG MAPK cascade in yeast. J. Biochem. 2004, 136, 267–272. [Google Scholar] [CrossRef]
  19. Kawasaki, L.; Sánchez, O.; Shiozaki, K.; Aguirre, J. SakA MAP kinase is involved in stress signal transduction, sexual development and spore viability in Aspergillus nidulans. Mol. Microbiol. 2002, 45, 1153–1163. [Google Scholar] [CrossRef]
  20. Nimmanee, P.; Woo, P.C.; Kummasook, A.; Vanittanakom, N. Characterization of sakA gene from pathogenic dimorphic fungus Penicillium marneffei. Int. J. Med. Microbiol. 2015, 305, 65–74. [Google Scholar] [CrossRef]
  21. Hagiwara, D.; Takahashi-Nakaguchi, A.; Toyotome, T.; Yoshimi, A.; Abe, K.; Kamei, K.; Gonoi, T.; Kawamoto, S. NikA/TcsC histidine kinase is involved in conidiation, hyphal morphology, and responses to osmotic stress and antifungal chemicals in Aspergillus fumigatus. PLoS ONE 2013, 8, e80881. [Google Scholar] [CrossRef] [PubMed]
  22. May, G.; Xue, T.; Kontoyiannis, D.; Gustin, M. Mitogen activated protein kinases of Aspergillus fumigatus. Med. Mycol. 2005, 43, 83–86. [Google Scholar] [CrossRef]
  23. Xue, T.; Nguyen, C.K.; Romans, A.; May, G.S. A mitogen-activated protein kinase that senses nitrogen regulates conidial germination and growth in Aspergillus fumigatus. Eukaryot. Cell 2004, 3, 557–560. [Google Scholar] [CrossRef] [PubMed]
  24. Jaimes-Arroyo, R.; Lara-Rojas, F.; Bayram, Ö.; Valerius, O.; Braus, G.H.; Aguirre, J. The SrkA kinase is part of the SakA MAPK interactome and regulates stress responses and development in Aspergillus nidulans. Eukaryot. Cell 2015, 14, 459–510. [Google Scholar] [CrossRef] [PubMed]
  25. Pereira Silva, L.; Alves de Castro, P.; Dos Reis, T.F.; Paziani, M.H.; Von Zeska Kress, M.R.; Riaño-Pachón, D.M.; Hagiwara, D.; Ries, L.N.; Brown, N.A.; Goldman, G.H. Genome-wide transcriptome analysis of Aspergillus fumigatus exposed to osmotic stress reveals regulators of osmotic and cell wall stresses that are SakAHOG1 and MpkC dependent. Cell. Microbiol. 2017, 19, e12681. [Google Scholar] [CrossRef] [PubMed]
  26. Albertyn, J.; Hohmann, S.; Thevelein, J.M.; Prior, B.A. GPD1, which encodes glycerol-3-phosphate dehydrogenase, is essential for growth under osmotic stress in Saccharomyces cerevisiae, and its expression is regulated by the high-osmolarity glycerol response pathway. Mol. Cell. Biol. 1994, 14, 4135–4144. [Google Scholar] [CrossRef] [PubMed]
  27. Norbeck, J.; Påhlman, A.-K.; Akhtar, N.; Blomberg, A.; Adler, L. Purification and characterization of two isoenzymes of dl-glycerol-3-phosphatase from Saccharomyces cerevisiae identification of the corresponding GPP1 and GPP2 genes and evidence for osmotic regulation of Gpp2p expression by the osmosensing mitogen-activated protein kinase signal transduction pathway. J. Biol. Chem. 1996, 271, 13875–13881. [Google Scholar]
  28. Påhlman, A.-K.; Granath, K.; Ansell, R.; Hohmann, S.; Adler, L. The yeast glycerol 3-phosphatases Gpp1p and Gpp2p are required for glycerol biosynthesis and differentially involved in the cellular responses to osmotic, anaerobic, and oxidative stress. J. Biol. Chem. 2001, 276, 3555–3563. [Google Scholar] [CrossRef]
  29. Lillehoj, E.; Wall, J.; Bowers, E. Preharvest aflatoxin contamination: Effect of moisture and substrate variation in developing cottonseed and corn kernels. Appl. Environ. Microbiol. 1987, 53, 584–586. [Google Scholar]
  30. Fiedurek, J. Effect of osmotic stress on glucose oxidase production and secretion by Aspergillus niger. J. Basic Microbiol. 1998, 38, 107–112. [Google Scholar] [CrossRef]
  31. Hagiwara, D.; Suzuki, S.; Kamei, K.; Gonoi, T.; Kawamoto, S. The role of AtfA and HOG MAPK pathway in stress tolerance in conidia of Aspergillus fumigatus. Fungal Genet. Biol. 2014, 73, 138–149. [Google Scholar] [CrossRef] [PubMed]
  32. Seo, J.-A.; Guan, Y.; Yu, J.-H. FluG-dependent asexual development in Aspergillus nidulans occurs via de-repression. Genetics 2005, 172, 1535–1544. [Google Scholar] [CrossRef] [PubMed]
  33. Smith, M.E.; Henkel, T.W.; Rollins, J.A. How many fungi make sclerotia? Fungal Ecol. 2015, 13, 211–220. [Google Scholar] [CrossRef]
  34. El-Abyad, M.; Hindorf, H.; Rizk, M. Impact of salinity stress on soil-borne fungi of sugarbeet. Plant Soil 1988, 110, 27–32. [Google Scholar] [CrossRef]
  35. Han, K.H.; Seo, J.A.; Yu, J.H. A putative G protein-coupled receptor negatively controls sexual development in Aspergillus nidulans. Mol. Microbiol. 2004, 51, 1333–1345. [Google Scholar] [CrossRef] [PubMed]
  36. Mert, H.; Ekmekci, S. The effect of salinity and osmotic pressure of the medium on the growth, sporulation and changes in the total organic acid content of Aspergillus flavus and Penicillium chrysogenum. Mycopathologia 1987, 100, 85–89. [Google Scholar] [CrossRef]
  37. Ramos, A.; Magan, N.; Sanchis, V. Osmotic and matric potential effects on growth, sclerotia and partitioning of polyols and sugars in colonies and spores of Aspergillus ochraceus. Mycol. Res. 1999, 103, 141–147. [Google Scholar] [CrossRef]
  38. Rementeria, A.; López-Molina, N.; Ludwig, A.; Vivanco, A.B.; Bikandi, J.; Pontón, J.; Garaizar, J. Genes and molecules involved in Aspergillus fumigatus virulence. Rev. Iberoam. Micol. 2005, 22, 1–23. [Google Scholar] [CrossRef]
  39. Zhao, X.; Mehrabi, R.; Xu, J.-R. Mitogen-activated protein kinase pathways and fungal pathogenesis. Eukaryot. Cell 2007, 6, 1701–1714. [Google Scholar] [CrossRef]
  40. Alves de Castro, P.; Dos Reis, T.F.; Dolan, S.K.; Oliveira Manfiolli, A.; Brown, N.A.; Jones, G.W.; Doyle, S.; Riaño-Pachón, D.M.; Squina, F.M.; Caldana, C. The Aspergillus fumigatus SchASCH9 kinase modulates SakAHOG1 MAP kinase activity and it is essential for virulence. Mol. Microbiol. 2016, 102, 642–671. [Google Scholar] [CrossRef]
  41. Lara-Rojas, F.; Sánchez, O.; Kawasaki, L.; Aguirre, J. Aspergillus nidulans transcription factor AtfA interacts with the MAPK SakA to regulate general stress responses, development and spore functions. Mol. Microbiol. 2011, 80, 436–454. [Google Scholar] [CrossRef] [PubMed]
  42. Li, Y.; He, Y.; Li, X.; Fasoyin, O.E.; Hu, Y.; Liu, Y.; Yuan, J.; Zhuang, Z.; Wang, S. Histone Methyltransferase aflrmtA gene is involved in the morphogenesis, mycotoxin biosynthesis, and pathogenicity of Aspergillus flavus. Toxicon 2017, 127, 112–121. [Google Scholar] [CrossRef] [PubMed]
  43. Chang, P.-K.; Scharfenstein, L.L.; Mack, B.; Ehrlich, K.C. Deletion of the Aspergillus flavus orthologue of Aspergillus nidulans fluG reduces conidiation, promotes sclerotial production, but does not abolish aflatoxin biosynthesis. Appl. Environ. Microbiol. 2012, 78, 7557–7563. [Google Scholar] [CrossRef] [PubMed]
  44. Chang, P.-K.; Scharfenstein, L.L.; Wei, Q.; Bhatnagar, D. Development and refinement of a high-efficiency gene-targeting system for Aspergillus flavus. J. Microbiol. Methods 2010, 81, 240–246. [Google Scholar] [CrossRef]
  45. Zhuang, Z.; Lohmar, J.M.; Satterlee, T.; Cary, J.W.; Calvo, A.M. The master transcription factor mtfA governs aflatoxin production, morphological development and pathogenicity in the fungus Aspergillus flavus. Toxins 2016, 8, 29. [Google Scholar] [CrossRef] [PubMed]
  46. Yu, J.-H.; Hamari, Z.; Han, K.-H.; Seo, J.-A.; Reyes-Domínguez, Y.; Scazzocchio, C. Double-joint PCR: A PCR-based molecular tool for gene manipulations in filamentous fungi. Fungal Genet. Biol. 2004, 41, 973–981. [Google Scholar] [CrossRef] [PubMed]
  47. Yang, K.; Liang, L.; Ran, F.; Liu, Y.; Li, Z.; Lan, H.; Gao, P.; Zhuang, Z.; Zhang, F.; Nie, X. The DmtA methyltransferase contributes to Aspergillus flavus conidiation, sclerotial production, aflatoxin biosynthesis and virulence. Sci. Rep. 2016, 6, 23259. [Google Scholar] [CrossRef]
  48. Yao, G.; Yue, Y.; Fu, Y.; Fang, Z.; Xu, Z.; Ma, G.; Wang, S. Exploration of the regulatory mechanism of secondary metabolism by comparative transcriptomics in Aspergillus flavus. Front. Microbiol. 2018, 9, 1568. [Google Scholar] [CrossRef]
  49. Lan, H.; Sun, R.; Fan, K.; Yang, K.; Zhang, F.; Nie, X.Y.; Wang, X.; Zhuang, Z.; Wang, S. The Aspergillus flavus histone acetyltransferase AflGcnE regulates morphogenesis, aflatoxin biosynthesis, and pathogenicity. Front. Microbiol. 2016, 7, 1324. [Google Scholar] [CrossRef]
  50. Fasoyin, O.E.; Wang, B.; Qiu, M.; Han, X.; Chung, K.-R.; Wang, S. Carbon catabolite repression gene creA regulates morphology, aflatoxin biosynthesis and virulence in Aspergillus flavus. Fungal Genet. Biol. 2018, 115, 41–51. [Google Scholar] [CrossRef]
  51. Yang, G.; Hu, Y.; Wang, S.; Fasoyin, O.E.; Yue, Y.; Qiu, Y.; Wang, X. The Aspergillus flavus Phosphatase CDC14 Regulates Development, Aflatoxin Biosynthesis and Pathogenicity. Front. Cell. Infect. Microbiol. 2018, 8, 141. [Google Scholar] [CrossRef] [PubMed]
  52. Wang, B.; Han, X.; Bai, Y.; Lin, Z.; Qiu, M.; Nie, X.; Wang, S.; Zhang, F.; Zhuang, Z.; Yuan, J. Effects of nitrogen metabolism on growth and aflatoxin biosynthesis in Aspergillus flavus. J. Hazard. Mater. 2017, 324, 691–700. [Google Scholar] [CrossRef] [PubMed]
  53. Han, X.; Qiu, M.; Wang, B.; Yin, W.-B.; Nie, X.; Qin, Q.; Ren, S.; Yang, K.; Zhang, F.; Zhuang, Z. Functional analysis of the nitrogen metabolite repression regulator gene nmrA in Aspergillus flavus. Front. Microbiol. 2016, 7, 1794. [Google Scholar] [CrossRef] [PubMed]
  54. Wong, K.H.; Todd, R.B.; Oakley, B.R.; Oakley, C.E.; Hynes, M.J.; Davis, M.A. Sumoylation in Aspergillus nidulans: SumO inactivation, overexpression and live-cell imaging. Fungal Genet. Biol. 2008, 45, 728–737. [Google Scholar] [CrossRef] [PubMed]
  55. Yang, K.; Liu, Y.; Liang, L.; Li, Z.; Qin, Q.; Nie, X.; Wang, S. The high-affinity phosphodiesterase PdeH regulates development and aflatoxin biosynthesis in Aspergillus flavus. Fungal Genet. Biol. 2017, 101, 7–19. [Google Scholar] [CrossRef] [PubMed]
  56. Hu, Y.; Yang, G.; Zhang, D.; Liu, Y.; Li, Y.; Lin, G.; Guo, Z.; Wang, S.; Zhuang, Z. The PHD Transcription Factor Rum1 Regulates Morphogenesis and Aflatoxin Biosynthesis in Aspergillus flavus. Toxins 2018, 10, 301. [Google Scholar] [CrossRef] [PubMed]
  57. Kale, S.P.; Milde, L.; Trapp, M.K.; Frisvad, J.C.; Keller, N.P.; Bok, J.W. Requirement of LaeA for secondary metabolism and sclerotial production in Aspergillus flavus. Fungal Genet. Biol. 2008, 45, 1422–1429. [Google Scholar] [CrossRef]
  58. Yuan, J.; Chen, Z.; Guo, Z.; Li, D.; Zhang, F.; Shen, J.; Zhang, Y.; Wang, S.; Zhuang, Z. PbsB regulates morphogenesis, Aflatoxin B1 biosynthesis and pathogenicity of Aspergillus flavus. Front. Cell. Infect. Microbiol. 2018, 8, 162. [Google Scholar] [CrossRef]
  59. Livak, K.J.; Schmittgen, T.D. Analysis of relative gene expression data using real-time quantitative PCR and the 2− ΔΔCT method. Methods 2001, 25, 402–408. [Google Scholar] [CrossRef]
Figure 1. Bioinformatics analysis of SakA protein from 13 different fungi (A) Phylogenetic analysis of SakA protein from different fungi such as A. flavus, A. oryzae, A. arachidicola, A. nomius, A. bombycis, A. kawachii, A. niger, A. campestris, A. candidus, S. lignohabitans (Sugiyamaella lignohabitans), A. clavatus and A. fumigatus. The phylogenetic tree was created from different SakA aligned protein sequences from all the above listed fungi. Neighbor joining and bootstrap methods with 1000 replications were used to generate this phylogenetic tree. (B) Conserved domain analysis of the fungi. The gray color stands for the non-conserved part, the red color corresponds to protein kinase domain and the scale symbolizes the protein length.
Toxins 11 00041 g001
Figure 2. Schematic illustration of AfsakA deletion and complementation strains of A. flavus. (A) Homologous recombination technique was applied for the deletion of AfsakA. The fragments 5′ UTR (untranslated region) (5′AfsakA), A. fumigatus pyrG and 3′ UTR (3′AfsakA) were each amplified with primer pairs of P1/P2, pyrG-F/pyrG-R and P3/P4 and fused together with primer pairs P7/P8. The fusion PCR product was transferred into CA14 (PyrG, Δku70) in order to produce ΔAfsakA (Δku70; pyrG; ΔAfsakA::pyrG). (B) The results of the PCR analysis of ΔAfsakA and ∆AfsakA::AfsakA. ORF (open reading frame), AP and BP fragments were amplified with a couple of primers P9/P10, P1/P801 and P4/P1020 respectively. (C) Verification of AfsakA deletion and complementary strains with reverse transcription-PCR. Actin gene was used as an endogenous control. Lane 1 used gDNA and lane 2 used cDNA as template. (D) qRT-PCR analysis of the expression level of AfsakA gene in ∆AfsakA mutant, WT (wild-type) and ∆AfsakA::AfsakA strains. The line bar in every column in (D) indicates standard errors of four replicates and the asterisks show significant difference between the knockout mutant and other strains (WT and complementation strain) (*** p ≤ 0.001).
Toxins 11 00041 g002
Figure 3. Phenotype and inhibition rate of WT (wild-type), ∆AfsakA and ∆AfsakA::AfsakA strains under osmotic stress induced by NaCl (sodium chloride) and D-sorbitol. (A) the morphology of WT, ∆AfsakA and ∆AfsakA::AfsakA strains under osmotic stress. (B) the mycelial growth inhibition of WT, ∆AfsakA and ∆AfsakA::AfsakA strains under osmotic stress. (C) qRT-PCR analysis of the expression level of the gene related with osmolality at 48 h without stress. The 2−ΔΔCT method was used to calculate the expression levels of our target gene and β-actin gene was taken as a reference gene. The line bar in every column indicates the standard errors of the four replicates and the asterisks show significant difference level between WT and other strains (* p ≤ 0.05, ** p ≤ 0.01 and *** p ≤ 0.001).
Toxins 11 00041 g003
Figure 4. Conidiation analysis between WT(wild-type), ∆AfsakA and ∆AfsakA::AfsakA strains in the presence or absence of osmotic stress induced by NaCl (sodium chloride) and D-sorbitol. (A) Indicates the conidiophores under light microscope at 200× magnification. (B) Indicates the number of conidia produced by WT, ∆AfsakA and ∆AfsakA::AfsakA. (C) qRT-PCR analysis of the expression level of the gene related with conidia production in 48 h without osmotic stress agents. The line bar in each column in (B,C) shows standard errors of four replicates and the asterisks indicate significant difference between WT and other strains (** p ≤ 0.01 and *** p ≤ 0.001).
Toxins 11 00041 g004
Figure 5. Sclerotia production analysis in the WT (wild-type), ∆AfsakA and ∆AfsakA::AfsakA strains. (A) presents the phenotype of WT, ∆AfsakA and ∆AfsakA::AfsakA to sclerotia formation. All the strains were grown in the dark for 7 days at 37 °C on WKM (wickerham) media with and without the indicated osmotic stress supplements. (B) reports the number of sclerotia produced from the four replicates. The abbreviation ND stands for “no detection” of sclerotia. (C) depictures the expression levels of nsdC and nsdD genes related with sclerotial development at 48 h without stress. The 2−ΔΔCT process was used to calculate the expression levels of target gene which were normalized to β-actin as an endogenous gene. The asterisks show significant difference level when other strains were compared with WT (** p ≤ 0.01 and *** p ≤ 0.001) and the line bar in every column indicates standard errors of the four repeats.
Toxins 11 00041 g005
Figure 6. Aflatoxin B1 (AFB1) production analysis of WT, ∆AfsakA and ∆AfsakA::AfsakA strains. (A) AFB1 tested by tin layer chromatograph in all the strains after being grown in dark at 29 °C for 5 days on YES agar medium with or without osmotic stress supplements. The acronym Std correspond to the AFB1 standard. (B) the computation of AFB1 produced from TLC (Thin Layer Chromatograph) analysis in Figure 6A. (C) the qRT-PCR results of the expression level of aflR, aflS, aflQ and aflO genes related to the aflatoxin biosynthesis at 48 h in the absence of stress agents. The line bar in every column in (B,C) indicates the standard errors of the three replicates and the asterisks show significant difference level between WT and other strains (* p ≤ 0.05, ** p ≤ 0.01 and *** p ≤ 0.001).
Toxins 11 00041 g006
Figure 7. Effect of AfsakA deletion on fungal pathogenicity on peanut seeds and maize kernel. (A) Maize kernels were treated with ∆AfsakA::AfsakA, ∆AfsakA, WT strains and water (mock) and grown for 6 days at 29 °C in the dark. (B) Peanut seeds were treated with ∆AfsakA::AfsakA, ∆AfsakA, WT strains and water (mock) and grown in the dark for 6 days at 29 °C. (C) Quantitative evaluation of the amount of conidia produced on the infected crop seeds in every strain from (A,B). The abbreviation ND stands for “no detection.” (D) TLC analysis of Aflatoxin B1 (AFB1) produced by both the infected maize kernels and peanut seeds. (E) Relative amount of AFB1 produced in (D). The abbreviation Std corresponds to the AFB1 standard. The line bar in every column indicates standard errors of three replicates and the asterisks show significant difference level between WT and other strains (** p ≤ 0.01, *** p ≤ 0.001).
Toxins 11 00041 g007
Figure 8. Subcellular allocation of AfSakA-mCherry fusion. (A) Gene replacement approach was used during construction of AfsakA(p)-AfsakA-mCherry strain. The UTR and AfsakA(p) abbreviations stand for “untranslated region” and “native promoter of AfsakA,” respectively. (B) Laser confocal scanning images of AfSakA-mCherry in vegetative mycelium. The AfSakA-mCherry strain was cultured for 16 h at 30 °C in YES liquid medium and cultured for 15, 30 min in the presence of 1.2 mol/L D-sorbitol. On the scale, 1 bar = 10 µm.
Toxins 11 00041 g008
Figure 9. Phenotype and inhibition of growth rate of WT, ∆AfsakA and ∆AfsakA::AfsakA strains under cell wall stress only or together with osmotic stress. (A) All strains were grown on a control and on a YES agar media with various cell wall stress agents such as 100 µg/mL SDS (Sodium dodecyl sulfate) and 200 µg/mL CR (Congo Red) only or together with 1.2 mol/L NaCl. (B) Inhibition of mycelial growth rate. The line bar in column of the graph indicates standard errors of all three replicates and the asterisks demonstrate significant difference levels between WT and other strains (** p ≤ 0.01).
Toxins 11 00041 g009
Table 1. A. flavus strains used in this study.
Strain NameRelated GenotypeSource
CA14Δku70; niaD-; ΔpyrGChang et al. [44]
Wild-typeΔku70; niaD-; ΔpyrG::pyrGThis study
ΔAfsakAΔku70; ΔAfsakA::pyrGThis study
ΔAfsakA::AfsakAΔku70; ΔAfsakA::pyrG; AfsakA (p)::sakA::ptrAThis study
AfsakA-mCherryΔku70; AfsakA (p)::mCherry::AfsakA::pyrG.This study
Table 2. Primers used for gene deletion, complementary and localization.
PrimersSequence (5′-3′)Application
P1TGTTATAGGGACGCTCTGAfsakA deletion
P2CGAACGTAGTACCCAAGAT
P3CGGAGCATTGTCCTACAT
P4GAGCGAATTACTGTTTGAGT
P7CATGTCGGGACGAGTTTG
P8GAAGTGGTTTACGGTGGT
P9ATACGCCTGCAACGCTAA
P10ATCCGCCTGGAGAAAGTC
pyrG-FGCCTCAAACAATGCTCTTCACCCpyrG amplification
pyrG-RGTCTGAGAGGAGGCACTGATGC
P801CAGGAGTTCTCGGGTTGTCGAfsakA mutant verification
P1080ATCGGCAATACCGTCCAGAAGC
AfSakA-FTGTTATAGGGACGCTCTGAfsakA complementation
AfsakA-RTCATATATCCGCCTGGAGAAAG
mCherry/FATGGTGAGCAAGGGCGAGAfsakA- mCherry tag construction
mCherry/RGGGTGAAGAGCATTGTTTGAGGCCTACTTGTACAGCTCGTCCAT
pyrG-R/RGCCTCAAACAATGCTCTTCACCC
pyrG-R/FAGTTGGTACGAAACAGATCAGTCTGAGAGGAGGCACTGATGC
AfsakA-mCherry/FTCGGTTTGGGTGCGTTTG
AfsakA-mCherry/RCTCGCCCTTGCTCACCATGACTAGTTTGTAAAGTTTACTTTGGACTAT
AfsakA-B/FGTCTGAGAGGAGGCACTGATGCTGATCTGTTTCGTACCAACT
AfsakA-B/RTGAGACCGCCGTCCTAAC
AfsakA-O/FGGTTTGGGTGCGTTTG
AfsakA-O/RCCCGAATTTATTGTAGCG
Table 3. Primers used for qRT-PCR.
PrimersSequence (5′-3′)Application
Q-AfsakA-FCCCACTACCAAAGGCACTCAfsakA detection
Q-AfsakA-RGGCATCATTGAACGACCAG
AflO-FGATTGGGATGTGGTCATGCGATTAflO qRT-PCR
AflO-RGCCTGGGTCCGAAGAATGC
AflQ-FGTCGCATATGCCCCGGTCGGAflQ qRT-PCR
AflQ-RGGCAACCAGTCGGGTTCCGG
AflR-FAAAGCACCCTGTCTTCCCTAACAflR qRT-PCR
AflR-RGAAGAGGTGGGTCAGTGTTTGTAG
AflS-FGCTCAGACTGACCGCCGCTCAflR qRT-PCR
AflS-RGCTCAGACTGACCGCCGCTC
NsdC-FGCCAGACTTGCCAATCACNsdC qRT-PCR
NsdC-RCATCCACCTTGCCCTTTA
NsdD-FGGACTTGCGGGTCGTGCTANsdD qRT-PCR
NsdD-RAGAACGCTGGGTCTGGTGC
abaA-F TCTTCGGTTGATGGATGATTTCabaA qRT-PCR
abaA-RCCGTTGGGAGGCTGGGT
brlA-FGCCTCCAGCGTCAACCTTCbrlA qRT-PCR
brlA-RTCTCTTCAAATGCTCTTGCCTC
HSP-FCCGGCATACTATGTCTCGTCTHSP qRT-PCR
HSP-RTAGGGCCTTCGTCGAACA
GPD-FTGTCTCGGTGGTGTCCCTATGPD qRT-PCR
GPD-RACCATGGCTGATGGAAGACT
GRE-FGCGTATCGTCGTTACCTCATCGRE qRT-PCR
GRE-RCCTTCTCCTTTACCTCCTCGAT
STL-FCGTTTACCACGACCAGAGCSTL qRT-PCR
STL-RAAGCTCAAGCCATGTGCAG
Actin-FACGGTGTCGTCACAAACTGGActin qRT-PCR
Actin-RCGGTTGGACTTAGGGTTGATAG

