Biomarkers for Exposure as a Tool for Efficacy Testing of a Mycotoxin Detoxifier in Broiler Chickens and Pigs

 ,
,  ,
,
Abstract
:1. Introduction
2. Results
2.1. Biomarkers for Exposure
2.2. Broiler Chicken Trial
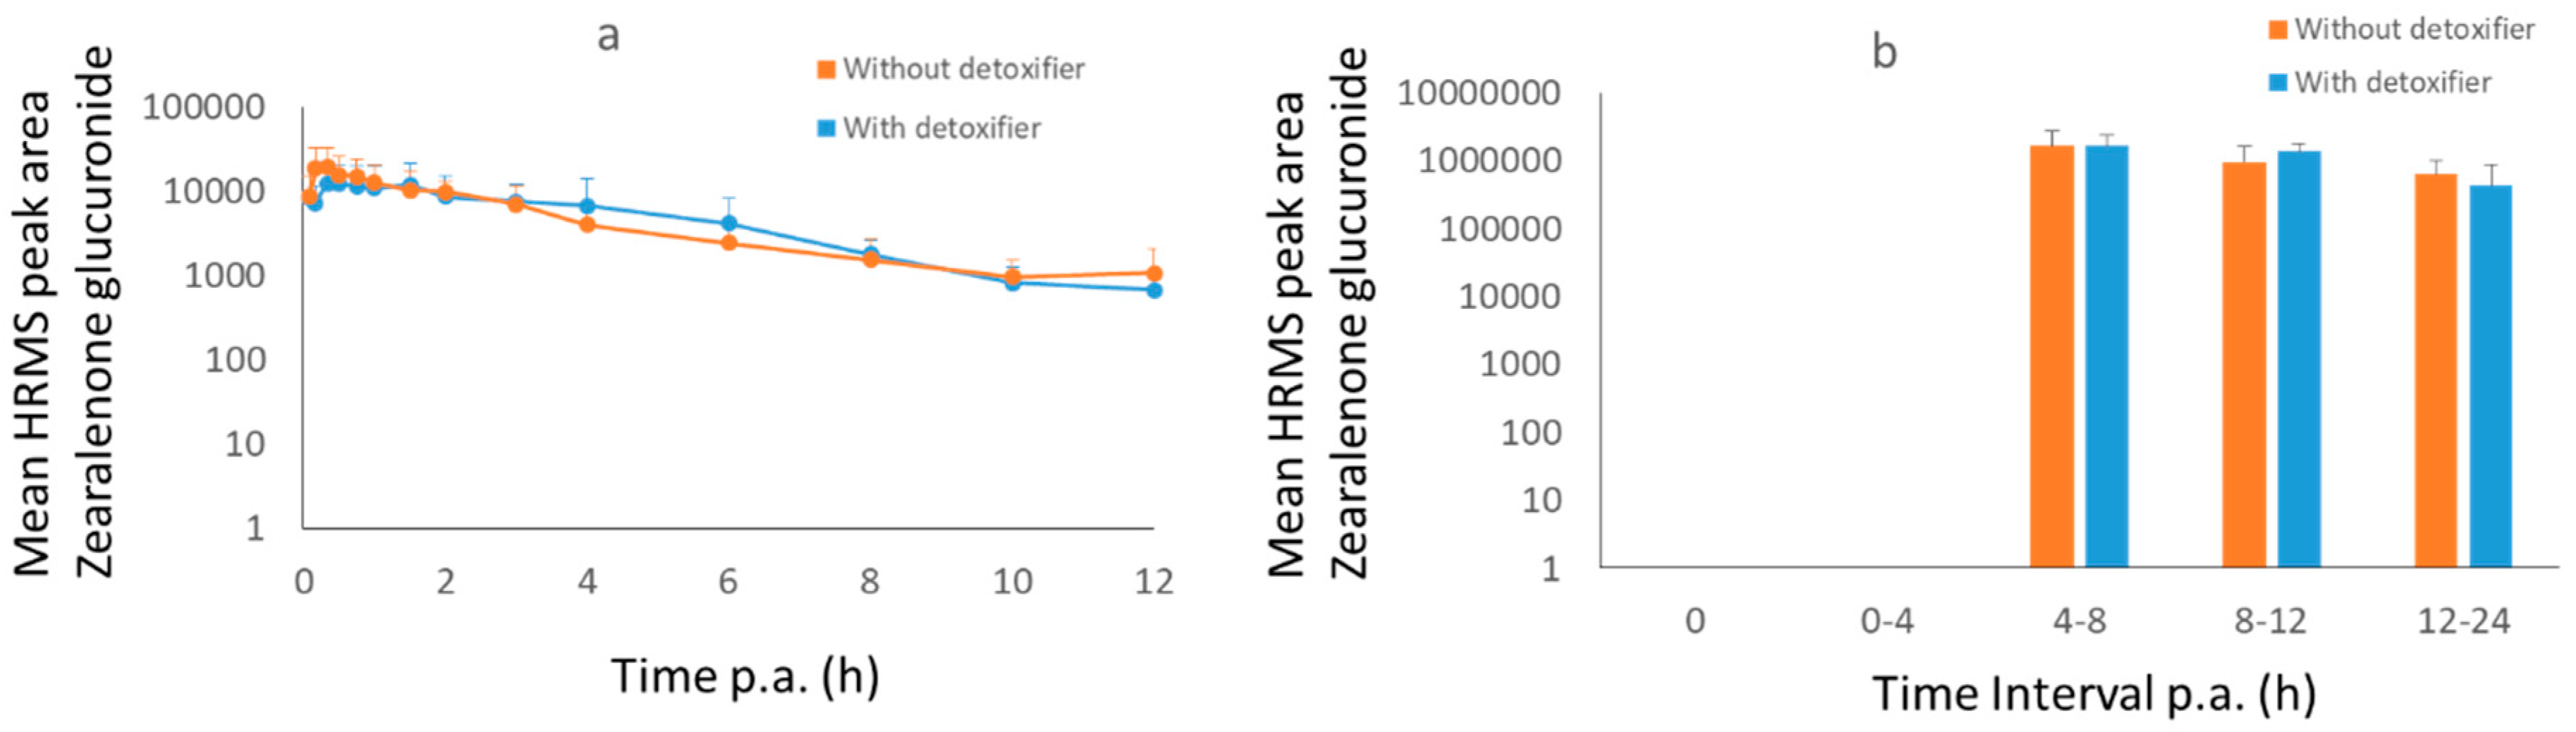
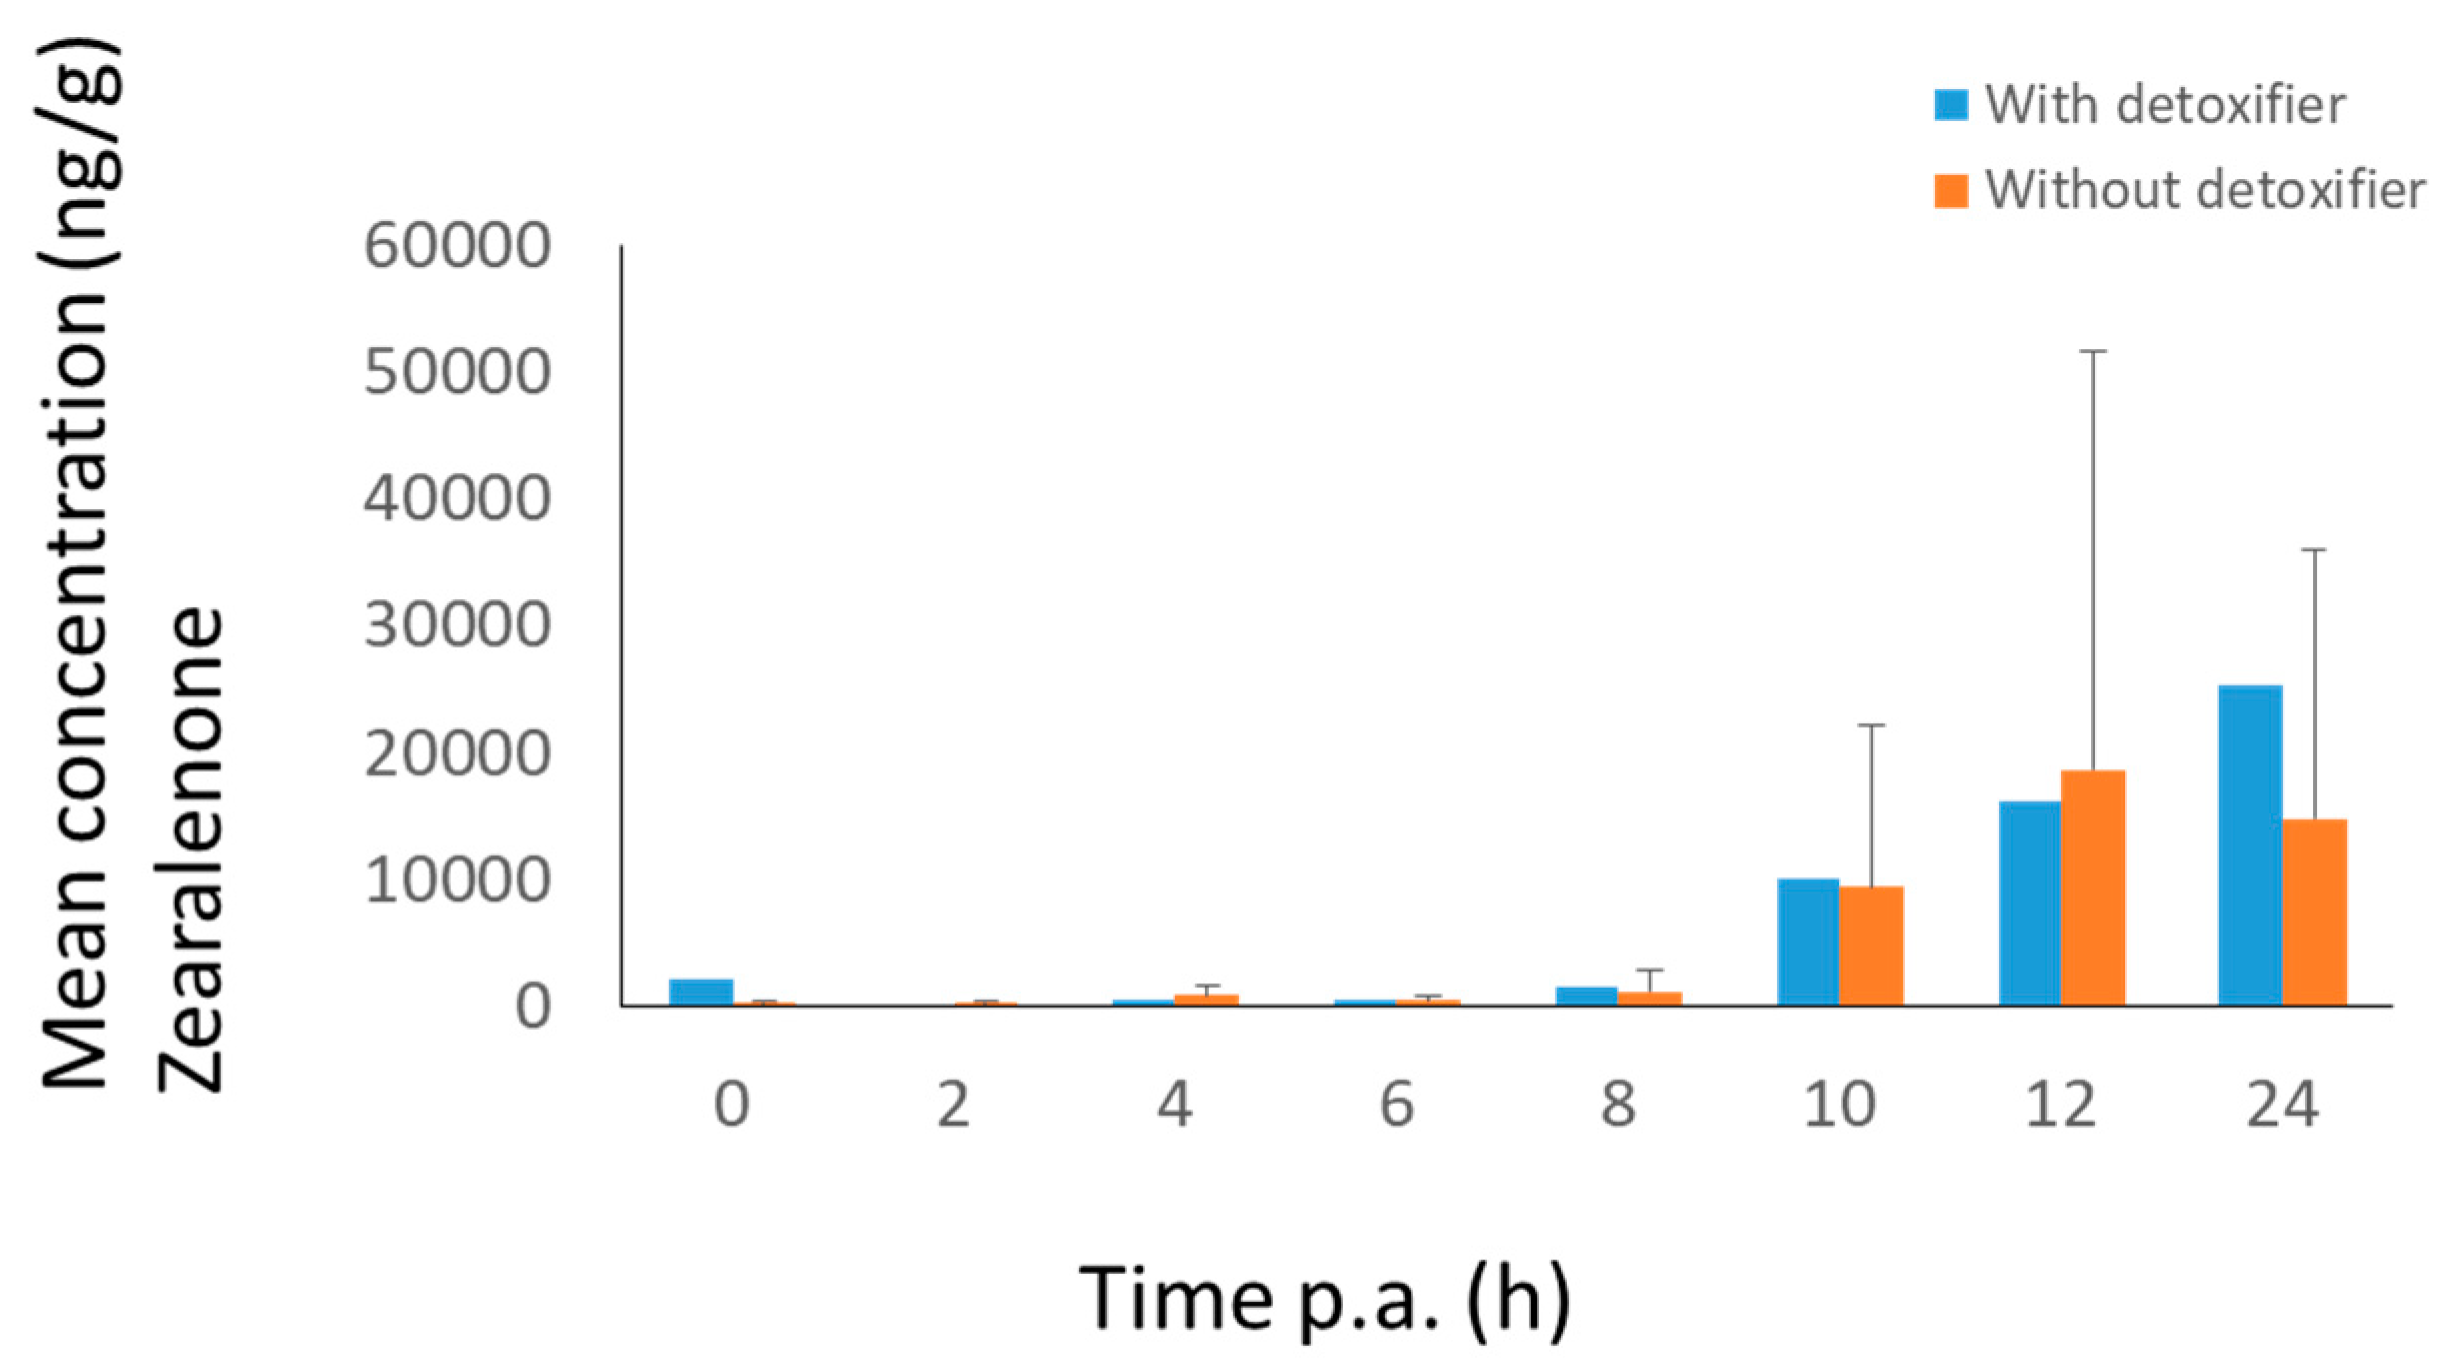
2.3. Pig Trial
3. Discussion
3.1. Biomarkers for Exposure
3.1.1. Broiler Chickens
3.1.2. Pigs
3.2. Efficacy of the Mycotoxin Detoxifier
3.2.1. Broiler Chickens
3.2.2. Pigs
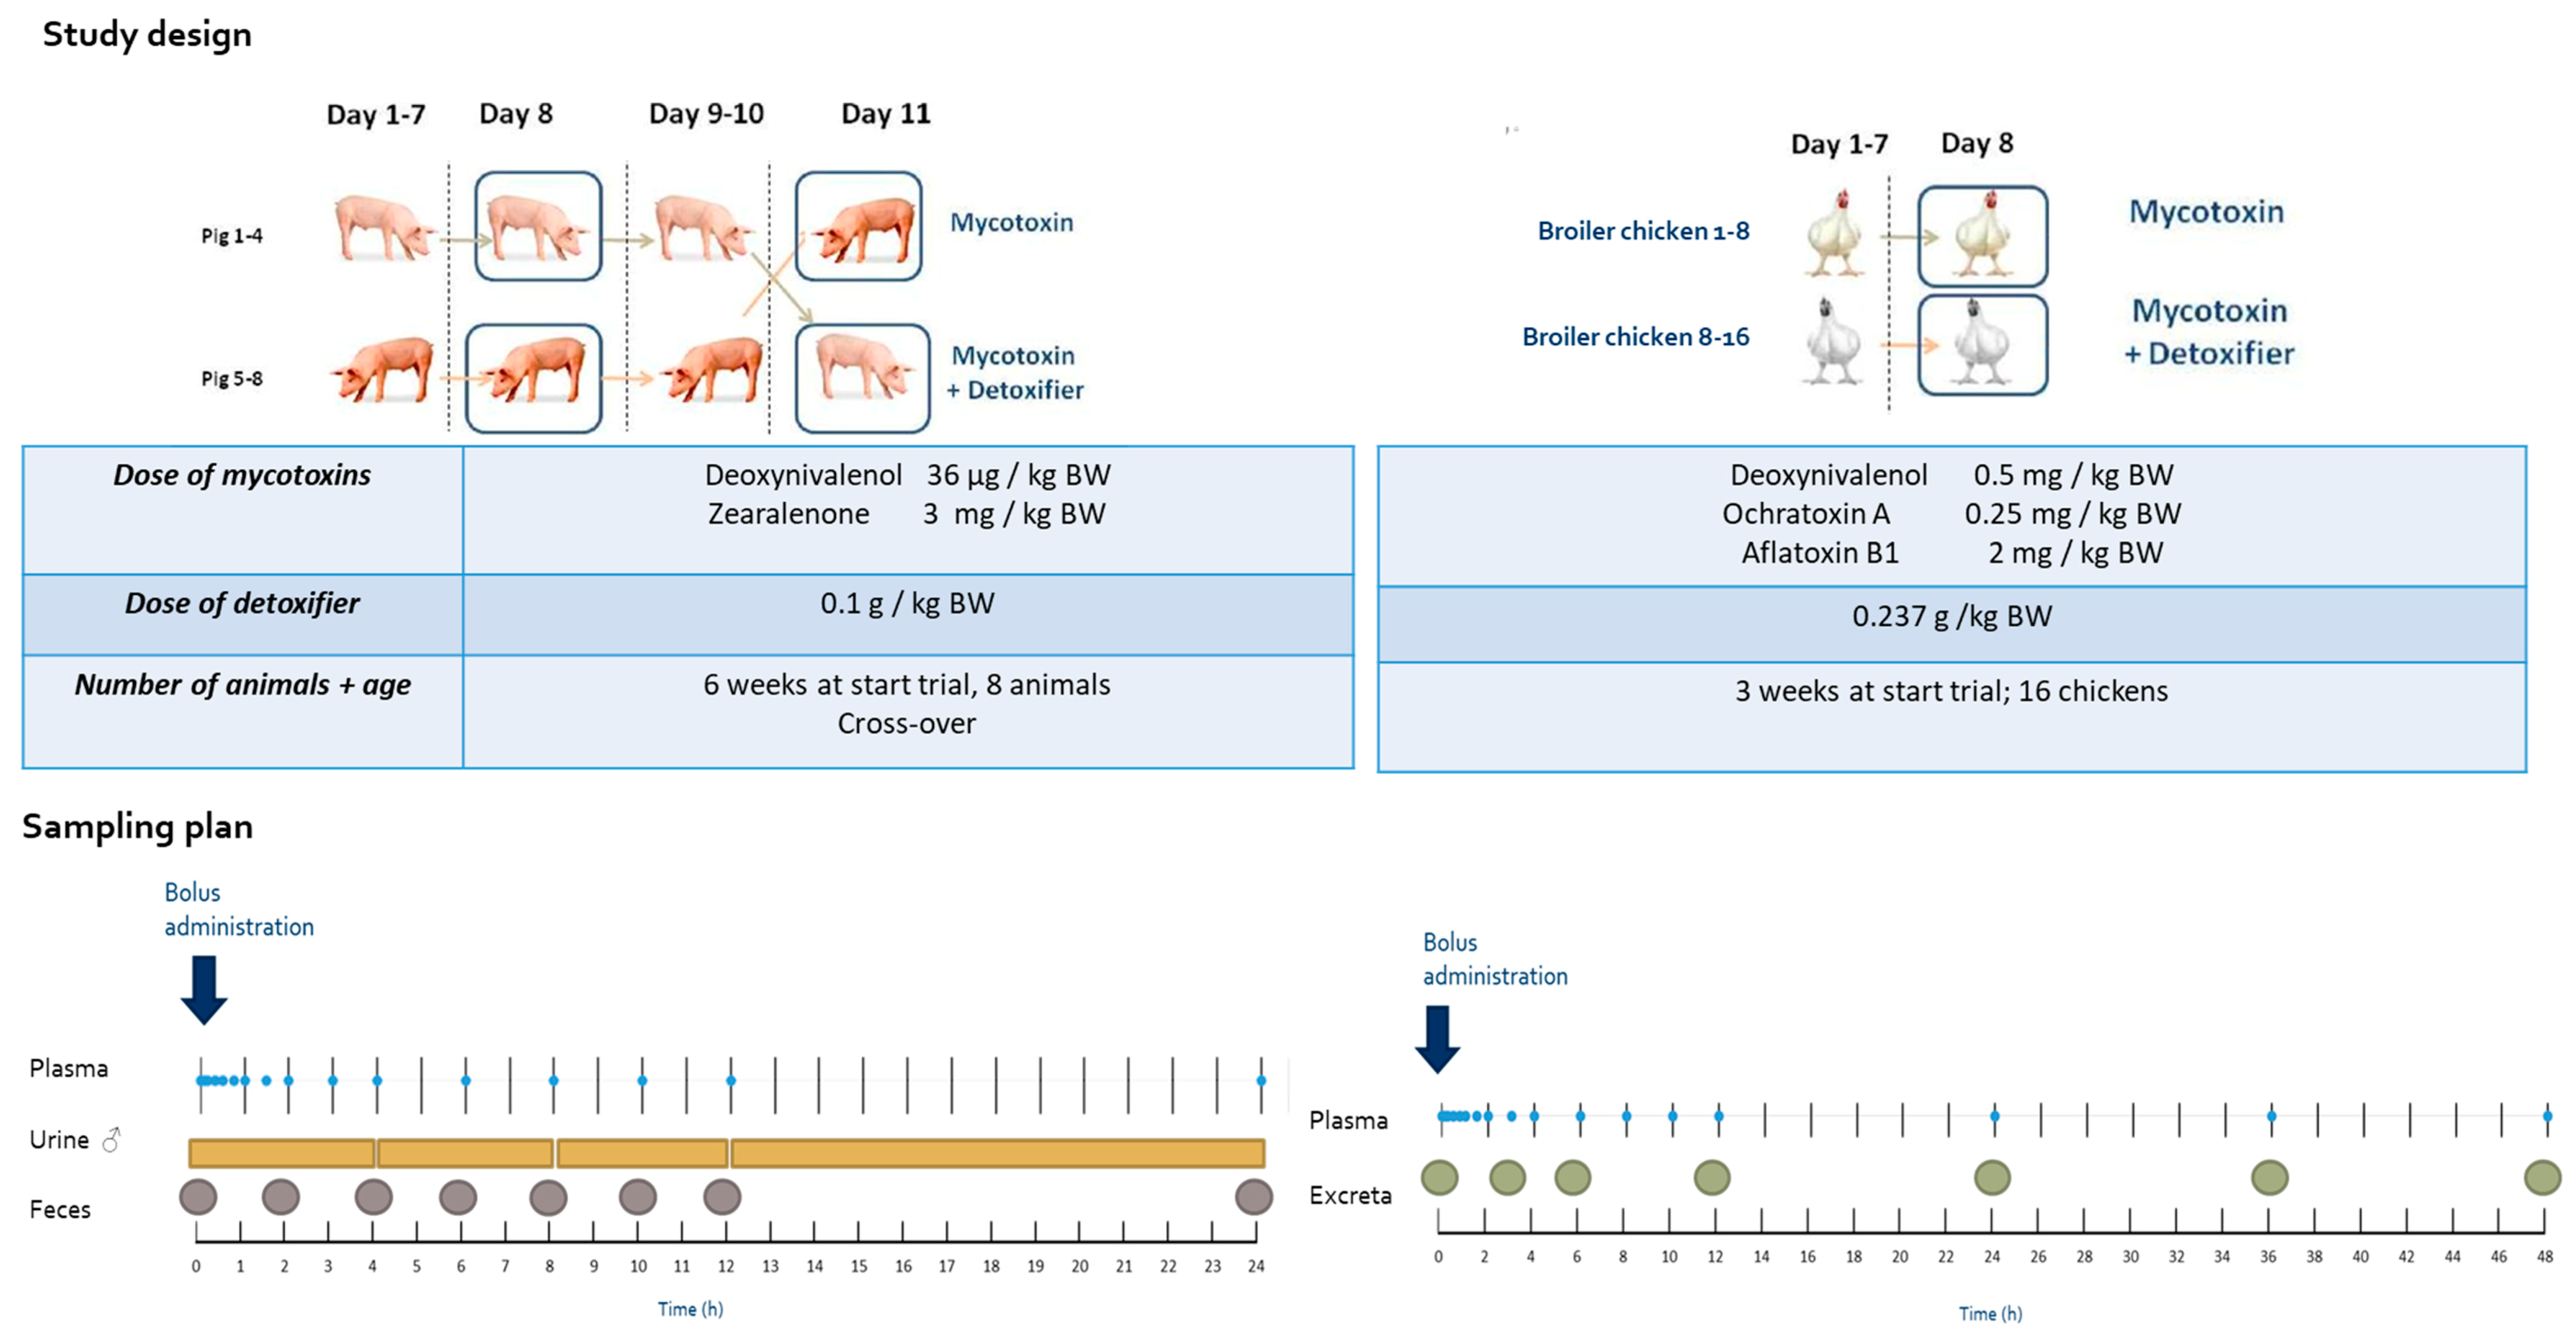
4. Material and Methods
4.1. Chemicals, Products, and Reagent
4.2. Broiler Chicken Trial
4.3. Pig Trial
4.4. Sample Preparation, LC-MS/MS and LC-HRMS Analysis
4.5. Toxicokinetic and Statistical Analysis
Supplementary Materials
Author Contributions
Funding
Acknowledgments
Conflicts of Interest
References
- Kongkapan, J.; Poapolathep, S.; Isariyodom, S.; Kumagai, S.; Poapolathep, A. Simultaneous detection of multiple mycotoxins in broiler feeds using a liquid chromatography tandem-mass spectrometry. J. Vet. Med. Sci. 2016, 78, 259–264. [Google Scholar] [CrossRef]
- Rawal, S.; Kim, J.E.; Coulombe, R. Aflatoxin B1 in poultry: Toxicology, metabolism and prevention. Res. Vet. Sci. 2010, 89, 325–331. [Google Scholar] [CrossRef]
- Khatoon, A.; Khan, M.Z.; Abidin, Z.; Bhatti, S.A. Effects of feeding bentonite clay upon ochratoxin A-induced immunosuppression in broiler chicks. Food Addit. Contam. Part A Chem. Anal. Control. Expo. Risk Assess. 2018, 35, 538–545. [Google Scholar] [CrossRef] [PubMed]
- Pfohl-Leszkowicz, A.; Manderville, R.A. Ochratoxin A: An overview on toxicity and carcinogenicity in animals and humans. Mol. Nutr. Food Res. 2007, 51, 61–99. [Google Scholar] [CrossRef] [PubMed]
- Kovalsky, P.; Kos, G.; Nährer, K.; Schwab, C.; Jenkins, T.; Schatzmayr, G.; Sulyok, M.; Krska, R. Co-occurrence of regulated, masked and emerging mycotoxins and secondary metabolites in finished feed and maize–An extensive survey. Toxins 2016, 8, 363. [Google Scholar] [CrossRef] [PubMed]
- Yu, Y.H.; Hsiao, F.S.H.; Proskura, W.S.; Dybus, A.; Siao, Y.H.; Cheng, Y.H. An impact of Deoxynivalenol produced by Fusarium graminearum on broiler chickens. J. Anim. Physiol. Anim. Nutr. 2018, 102, 1012–1019. [Google Scholar] [CrossRef]
- Döll, S.; Dänicke, S. The Fusarium toxins deoxynivalenol (DON) and zearalenone (ZON) in animal feeding. Prev. Vet. Med. 2011, 102, 132–145. [Google Scholar] [CrossRef] [PubMed]
- Awad, W.A.; Ghareeb, K.; Böhm, J.; Zentek, J. Decontamination and detoxification strategies for the Fusarium mycotoxin deoxynivalenol in animal feed and the effectiveness of microbial biodegradation. Food Addit. Contam. Part A Chem. Anal. Control. Expo. Risk Assess. 2010, 27, 510–520. [Google Scholar] [CrossRef] [PubMed]
- Pappas, A.C.; Tsiplakou, E.; Tsitsigiannis, D.I.; Georgiadou, M.; Iliadi, M.K.; Sotirakoglou, K.; Zervas, G. The role of bentonite binders in single or concomitant mycotoxin contamination of chicken diets. Br. Poult. Sci. 2016, 57, 551–558. [Google Scholar] [CrossRef] [PubMed]
- Pasha, T.N.; Farooq, M.U.; Khattak, F.M.; Jabbar, M.A.; Khan, A.D. Effectiveness of sodium bentonite and two commercial products as aflatoxin absorbents in diets for broiler chickens. Anim. Feed Sci. Technol. 2007, 132, 103–110. [Google Scholar] [CrossRef]
- Bhatti, S.A.; Khan, M.Z.; Saleemi, M.K.; Saqib, M.; Khan, A.; Ul-Hassan, Z. Protective role of bentonite against aflatoxin B1- and ochratoxin A-induced immunotoxicity in broilers. J. Immunotoxicol. 2017, 14, 66–76. [Google Scholar] [CrossRef]
- Miazzo, R.; Peralta, M.F.; Magnoli, C.; Salvano, M.; Ferrero, S.; Chiacchiera, S.M.; Carvalho, E.C.Q.; Rosa, C.A.R.; Dalcero, A. Efficacy of sodium bentonite as a detoxifier of broiler feed contaminated with aflatoxin and fumonisin. Poult. Sci. 2005, 84, 1–8. [Google Scholar] [CrossRef] [PubMed]
- Neeff, D.V.; Ledoux, D.R.; Rottinghaus, G.E.; Bermudez, A.J.; Dakovic, A.; Murarolli, R.A.; Oliveira, C.A.F. In vitro and in vivo efficacy of a hydrated sodium calcium aluminosilicate to bind and reduce aflatoxin residues in tissues of broiler chicks fed aflatoxin B1. Poult. Sci. 2013, 92, 131–137. [Google Scholar] [CrossRef] [PubMed]
- Eckhardt, J.C.; Santurio, J.M.; Zanette, R.A.; Rosa, A.P.; Scher, A.; Dal Pozzo, M.; Alves, S.H.; Ferreiro, L. Efficacy of a Brazilian calcium montmorillonite against toxic effects of dietary aflatoxins on broilers reared to market weight. Br. Poult. Sci. 2014, 55, 215–220. [Google Scholar] [CrossRef]
- Magnoli, A.P.; Texeira, M.; Rosa, C.A.R.; Miazzo, R.D.; Cavaglieri, L.R.; Magnoli, C.E.; Dalcero, A.M.; Chiacchiera, S.M. Sodium bentonite and monensin under chronic aflatoxicosis in broiler chickens. Poult. Sci. 2011, 90, 352–357. [Google Scholar] [CrossRef]
- Santurio, J.M.; Mallmann, C.A.; Rosa, A.P.; Appel, G.; Heer, A.; Dageförde, S.; Böttcher, M. Effect of sodium bentonite on the performance and blood variables of broiler chickens intoxicated with aflatoxins. Br. Poult. Sci. 1999, 40, 115–119. [Google Scholar] [CrossRef]
- EFSA Panel on Additives and Products or Substances used in Animal Feed (FEEDAP). EFSA Statement on the establishment of guidelines for the assessment of additives from the functional group ‘substances for reduction of the contamination of feed by mycotoxins’. EFSA J. 2010, 8, 1963. [Google Scholar] [CrossRef]
- Lauwers, M.; De Baere, S.; Letor, B.; Rychlik, M.; Croubels, S.; Devreese, M. Multi LC-MS/MS and LC-HRMS Methods for Determination of 24 Mycotoxins including Major Phase I and II Biomarker Metabolites in Biological Matrices from Pigs and Broiler Chickens. Toxins 2019, 11, 171. [Google Scholar] [CrossRef] [PubMed]
- Dohnal, V.; Wu, Q.; Kuča, K. Metabolism of aflatoxins: Key enzymes and interindividual as well as interspecies differences. Arch. Toxicol. 2014, 88, 1635–1644. [Google Scholar] [CrossRef] [PubMed]
- Mughal, M.J.; Peng, X.; Kamboh, A.A.; Zhou, Y.; Fang, J. Aflatoxin B1 Induced Systemic Toxicity in Poultry and Rescue Effects of Selenium and Zinc. Biol. Trace Elem. Res. 2017, 178, 292–300. [Google Scholar] [CrossRef]
- Vidal, A.; Mengelers, M.; Yang, S.; De Saeger, S.; De Boevre, M. Mycotoxin Biomarkers of Exposure: A Comprehensive Review. Compr. Rev. Food Sci. Food Saf. 2018, 17, 1127–1155. [Google Scholar] [CrossRef]
- Tao, Y.; Xie, S.; Xu, F.; Liu, A.; Wang, Y.; Chen, D.; Pan, Y.; Huang, L.; Peng, D.; Wang, X.; et al. Ochratoxin A: Toxicity, oxidative stress and metabolism. Food Chem. Toxicol. 2018, 112, 320–331. [Google Scholar] [CrossRef]
- Yang, S.; Zhang, H.; De Saeger, S.; De Boevre, M.; Sun, F.; Zhang, S.; Cao, X.; Wang, Z. In vitro and in vivo metabolism of ochratoxin A: A comparative study using ultra-performance liquid chromatography-quadrupole/time-of-flight hybrid mass spectrometry. Anal. Bioanal. Chem. 2015, 407, 3579–3589. [Google Scholar] [CrossRef]
- Ringot, D.; Chango, A.; Schneider, Y.J.; Larondelle, Y. Toxicokinetics and toxicodynamics of ochratoxin A, an update. Chem. Biol. Interact. 2006, 159, 18–46. [Google Scholar] [CrossRef]
- Dänicke, S.; Brezina, U. Kinetics and metabolism of the Fusarium toxin deoxynivalenol in farm animals: Consequences for diagnosis of exposure and intoxication and carry over. Food Chem. Toxicol. 2013, 60, 58–75. [Google Scholar] [CrossRef]
- Valgaeren, B.; Théron, L.; Croubels, S.; Devreese, M.; De Baere, S.; Van Pame, E.; Daeseleire, L.; De Boevre, M.; De Saeger, S.; Vidal, A.; et al. The role of roughage provision on the absorption and disposition of the mycotoxin deoxynivalenol and its acetylated derivatives in calves: From field observations to toxicokinetics. Arch. Toxicol. 2018, 93, 293–310. [Google Scholar] [CrossRef]
- Devreese, M.; Antonissen, G.; Broekaert, N.; De Mil, T.; De Baere, S.; Vanhaecke, L.; De Backer, P.; Croubels, S. Toxicokinetic study and oral bioavailability of deoxynivalenol in turkey poults, and comparative biotransformation between broilers and turkeys. World Mycotoxin J. 2015, 8, 533–539. [Google Scholar] [CrossRef]
- Malekinejad, H.; Maas-Bakker, R.; Fink-Gremmels, J. Species differences in the hepatic biotransformation of zearalenone. Vet. J. 2006, 172, 96–102. [Google Scholar] [CrossRef]
- Fleck, S.C.; Churchwell, M.I.; Doerge, D.R. Metabolism and pharmacokinetics of zearalenone following oral and intravenous administration in juvenile female pigs. Food Chem. Toxicol. 2017, 106, 193–201. [Google Scholar] [CrossRef]
- Catteuw, A.; Broekaert, N.; De Baere, S.; Lauwers, M.; Gasthuys, E.; Huybrechts, B.; Callebaut, A.; Ivanova, L.; Uhlig, S.; De Boevre, M.; et al. Insights into In Vivo Absolute Oral Bioavailability, Biotransformation, and Toxicokinetics of Zearalenone, α-Zearalenol, β-Zearalenol, Zearalenone-14-glucoside, and Zearalenone-14-sulfate in Pigs. J. Agric. Food Chem. 2019. [Google Scholar] [CrossRef]
- Broekaert, N.; Devreese, M.; van Bergen, T.; Schauvliege, S.; De Boevre, M.; De Saeger, S.; Vanhaecke, L.; Berthiller, F.; Michlmayr, H.; Malachová, A.; et al. In vivo contribution of deoxynivalenol-3-β-d-glucoside to deoxynivalenol exposure in broiler chickens and pigs: Oral bioavailability, hydrolysis and toxicokinetics. Arch. Toxicol. 2017, 91, 699–712. [Google Scholar] [CrossRef]
- Devreese, M.; Antonissen, G.; Broekaert, N.; De Baere, S.; Vanhaecke, L.; De Backer, P.; Croubels, S. Comparative Toxicokinetics, Absolute Oral Bioavailability, and Biotransformation of Zearalenone in Different Poultry Species. J. Agric. Food Chem. 2015, 63, 5092–5098. [Google Scholar] [CrossRef]
- Devreese, M.; Osselaere, A.; Goossens, J.; Vandenbroucke, V.; De Baere, S.; Eeckhout, M.; De Backer, P.; Croubels, S. New bolus models for in vivo efficacy testing of mycotoxin-detoxifying agents in relation to EFSA guidelines, assessed using deoxynivalenol in broiler chickens. Food Addit. Contam. Part A Chem. Anal. Control. Expo. Risk Assess. 2012, 29, 1101–1107. [Google Scholar] [CrossRef]
- Osselaere, A.; Devreese, M.; Watteyn, A.; Vandenbroucke, V.; Goossens, J.; Hautekiet, V.; Eeckhout, M.; De Saeger, S.; De Baere, S.; De Backer, P.; et al. Efficacy and safety testing of mycotoxin-detoxifying agents in broilers following the European Food Safety Authority guidelines. Poult. Sci. 2012, 91, 2046–2054. [Google Scholar] [CrossRef]
- Di Gregorio, M.C.; Jager, A.V.; Souto, P.C.M.C.; Costa, A.A.; Rottinghaus, G.E.; Passarelli, D.; Budiño, F.E.L.; Corassin, C.H.; Oliveira, C.A.F. Determination of serum aflatoxin B1-lysine to evaluate the efficacy of an aflatoxin-adsorbing feed additive in pigs fed an aflatoxin B1-contaminated diet. Mycotoxin Res. 2017, 33, 93–102. [Google Scholar] [CrossRef]
- Masching, S.; Naehrer, K.; Schwartz-Zimmermann, H.E.; Sărăndan, M.; Schaumberger, S.; Dohnal, I.; Nagl, V.; Schatzmayr, D. Gastrointestinal degradation of fumonisin B1 by carboxylesterase FumD prevents fumonisin induced alteration of sphingolipid metabolism in Turkey and swine. Toxins 2016, 8, 84. [Google Scholar] [CrossRef]
- Dänicke, S.; Ueberschär, K.-H.; Halle, I.; Valenta, H.; Flachowsky, G. Excretion kinetics and metabolism of zearalenone in broilers in dependence on a detoxifying agent. Arch. Anim. Nutr. 2001, 55, 299–313. [Google Scholar] [CrossRef]
- Gambacorta, L.; Pinton, P.; Avantaggiato, G.; Oswald, I.P.; Solfrizzo, M. Grape Pomace, an Agricultural Byproduct Reducing Mycotoxin Absorption: In Vivo Assessment in Pig Using Urinary Biomarkers. J. Agric. Food Chem. 2016, 64, 6762–6771. [Google Scholar] [CrossRef]
- Lozano, M.C.; Diaz, G.J. Microsomal and cytosolic biotransformation of aflatoxin B1 in four poultry species. Br. Poult. Sci. 2006, 47, 734–741. [Google Scholar] [CrossRef]
- Di Gregorio, M.C.; Jager, A.V.; Costa, A.A.; Bordin, K.; Rottinhghaus, G.E.; Petta, T.; Souto, P.C.M.C.; Budiño, F.E.L.; Oliveira, C.A.F. Determination of Aflatoxin B1-Lysine in Pig Serum and Plasma by Liquid Chromatography—Tandem Mass Spectrometry. J. Anal. Toxicol. 2016, 41, 236–241. [Google Scholar] [CrossRef]
- Leong, Y.H.; Latiff, A.A.; Ahmad, N.I.; Rosma, A. Exposure measurement of aflatoxins and aflatoxin metabolites in human body fluids. A short review. Mycotoxin Res. 2012, 28, 79–87. [Google Scholar] [CrossRef]
- Cortés, G.; Carvajal, M.; Méndez-Ramírez, I.; Ávila-González, E.; Chilpa-Galván, N.; Castillo-Urueta, P.; Flores, C.M. Identification and quantification of aflatoxins and aflatoxicol from poultry feed and their recovery in poultry litter. Poult. Sci. 2010, 89, 993–1001. [Google Scholar] [CrossRef]
- Devreese, M.; Croubels, S.; De Baere, S.; Gehring, R.; Antonissen, G. Comparative Toxicokinetics and Plasma Protein Binding of Ochratoxin A in Four Avian Species. Agric. Food Chem. 2018, 66, 2129–2135. [Google Scholar] [CrossRef]
- Schwartz-Zimmermann, H.E.; Fruhmann, P.; Dänicke, S.; Wiesenberger, G.; Caha, S.; Weber, J.; Berthiller, F. Metabolism of deoxynivalenol and deepoxy-deoxynivalenol in broiler chickens, pullets, roosters and turkeys. Toxins 2015, 7, 4706–4729. [Google Scholar] [CrossRef]
- Dänicke, S.; Valenta, H.; Döll, S. On the toxicokinetics and the metabolism of deoxynivalenol (don) in the pig. Arch. Anim. Nutr. 2007, 58, 169–180. [Google Scholar] [CrossRef]
- Nagl, V.; Woechtl, B.; Schwartz-Zimmermann, H.E.; Hennig-Pauka, I.; Moll, W.D.; Adam, G.; Berthiller, F. Metabolism of the masked mycotoxin deoxynivalenol-3-glucoside in pigs. Toxicol. Lett. 2014, 229, 190–197. [Google Scholar] [CrossRef]
- Goyarts, T.; Dänicke, S. Bioavailability of the Fusarium toxin deoxynivalenol (DON) from naturally contaminated wheat for the pig. Toxicol. Lett. 2006, 163, 171–182. [Google Scholar] [CrossRef]
- De Baere, S.; Osselaere, A.; Devreese, M.; Vanhaecke, L.; De Backer, P.; Croubels, S. Development of a liquid-chromatography tandem mass spectrometry and ultra-high-performance liquid chromatography high-resolution mass spectrometry method for the quantitative determination of zearalenone and its major metabolites in chicken and pig plasma. Anal. Chim. Acta 2012, 756, 37–48. [Google Scholar] [CrossRef]
- Binder, S.B.; Schwartz-Zimmermann, H.E.; Varga, E.; Bichl, G.; Michlmayr, H.; Adam, G.; Berthiller, F. Metabolism of zearalenone and its major modified forms in pigs. Toxins 2017, 9, 56. [Google Scholar] [CrossRef]
- Antonissen, G.; Martel, A.; Pasmans, F.; Ducatelle, R.; Verbrugghe, E.; Vandenbroucke, V.; Li, S.; Haesebrouck, F.; Van Immerseel, F.; Croubels, S. The impact of Fusarium Mycotoxins on human and animal host susceptibility to infectious diseases. Toxins 2014, 6, 430–452. [Google Scholar] [CrossRef]
- Miazzo, R.; Rosa, C.A.R.; De Queiroz Carvalho, E.C.; Magnoli, C.; Chiacchiera, S.M.; Palacio, G.; Saenz, M.; Kikot, A.; Basaldella, E.; Dalcero, A. Efficacy of synthetic zeolite to reduce the toxicity of aflatoxin in broiler chicks. Poult. Sci. 2000, 79, 1–6. [Google Scholar] [CrossRef]
- Rychen, G.; Aquilina, G.; Azimonti, G.; Bampidis, V.; de Lourdes Bastos, M.; Bories, G.; Chesson, A.; Cocconcelli, P.S.; Flachowsky, G.; Gropp, J.; et al. Safety and efficacy of bentonite as a feed additive for all animal species. EFSA J. 2017, 15, 5096. [Google Scholar] [CrossRef]
- Jiang, S.Z.; Yang, Z.B.; Yang, W.R.; Wang, S.J.; Wang, Y.; Broomhead, J.; Johnston, S.L.; Chi, F. Effect on hepatonephric organs, serum metabolites and oxidative stress in post-weaning piglets fed purified zearalenone-contaminated diets with or without Calibrin-Z. J. Anim. Physiol. Anim. Nutr. 2012, 96, 1147–1156. [Google Scholar] [CrossRef]
- Jin, L.; Wang, W.; Degroote, J.; Van Noten, N.; Yan, H.; Majdeddin, M.; Van Poucke, M.; Peelman, L.; Goderis, A.; Van De Mierop, K.; et al. Mycotoxin binder improves growth rate in piglets associated with reduction of toll-like receptor-4 and increase of tight junction protein gene expression in gut mucosa. J. Anim. Sci. Biotechnol. 2017, 8, 80. [Google Scholar] [CrossRef]
- Shehata, S.; Richter, W.; Schuster, M.; Lindermayer, H. Effect of Deoxynivalenol (DON) on growing pigs and its modification by modified yeast cell wall or modified yeast cell wall and bentonite. Mycotoxin Res. 2004, 20, 42–48. [Google Scholar] [CrossRef]
- Frobose, H.L.; Erceg, J.A.; Fowler, S.Q.; Tokach, M.D.; DeRouchey, J.M.; Woodworth, J.C.; Dritz, S.S.; Goodband, R.D. The progression of deoxynivalenol-induced growth suppression in nursery pigs and the potential of an algae-modified montmorillonite clay to mitigate these effects1,2. J. Anim. Sci. 2016, 94, 3746–3759. [Google Scholar] [CrossRef]
- Döll, S.; Gericke, S.; Dänicke, S.; Raila, J.; Ueberschär, K.H.; Valenta, H.; Schnurrbusch, U.; Schweigert, F.J.; Flachowsky, G. The efficacy of a modified aluminosilicate as a detoxifying agent in Fusarium toxin contaminated maize containing diets for piglets. J. Anim. Physiol. Anim. Nutr. 2005, 89, 342–358. [Google Scholar] [CrossRef]
- Gasthuys, E.; Schauvliege, S.; van Bergen, T.; Millecam, J.; Cerasoli, I.; Martens, A.; Gasthuys, F.; Vandecasteele, T.; Cornillie, P.; Van den Broeck, W.; et al. Repetitive urine and blood sampling in neonatal and weaned piglets for pharmacokinetic and pharmacodynamic modelling in drug discovery: A pilot study. Lab. Anim. 2017, 51, 498–508. [Google Scholar] [CrossRef]
- Heitzman, R. Veterinary Drug Residues: Residues in Food Producing Animals and Their Products: Reference Materials and Methods; Blackwell Scientific Publication: Oxford, UK, 1996; Volume 636, ISBN 0-8412-3419-1. [Google Scholar]
- EMA/CMVP/VICH Steering Committee. VICH Topic GL49: Studies to Evaluate the Metabolism and Residues Kinetics of Veterinary Drugs in Human Food-Producing Animals: Validation of Analytical Methods Used in Residue Depletion Studies; European Medicine Agency: Brussels, Belgium, 2016; Volume 44. [Google Scholar]
- European Commission. COMMISSION DECISION 2002/657/Implementing Council Directive 96/23/EC concerning the performance of analytical methods and the interpretation of results. Off. J. Eur. Communities 2002, L221, 29. [Google Scholar] [CrossRef]


| Mycotoxin(s) against Which the Additive Is Intended to Act | Most Relevant Biomarkers for Exposure |
|---|---|
| Aflatoxin B1 (AFB1) | Aflatoxin M1 in milk/egg yolk |
| Deoxynivalenol (DON) | DON/metabolites in blood serum |
| Zearalenone (ZEN) | ZEN + α- and β-zearalenol in plasma Excretion of ZEN/metabolites |
| Ochratoxin A (OTA) | OTA in kidney (or blood serum) |
| Fumonisins B1+B2 | Sphinganine/sphingosine ratio in blood, plasma or tissue |
| Pig | Plasma | Urine | Feces |
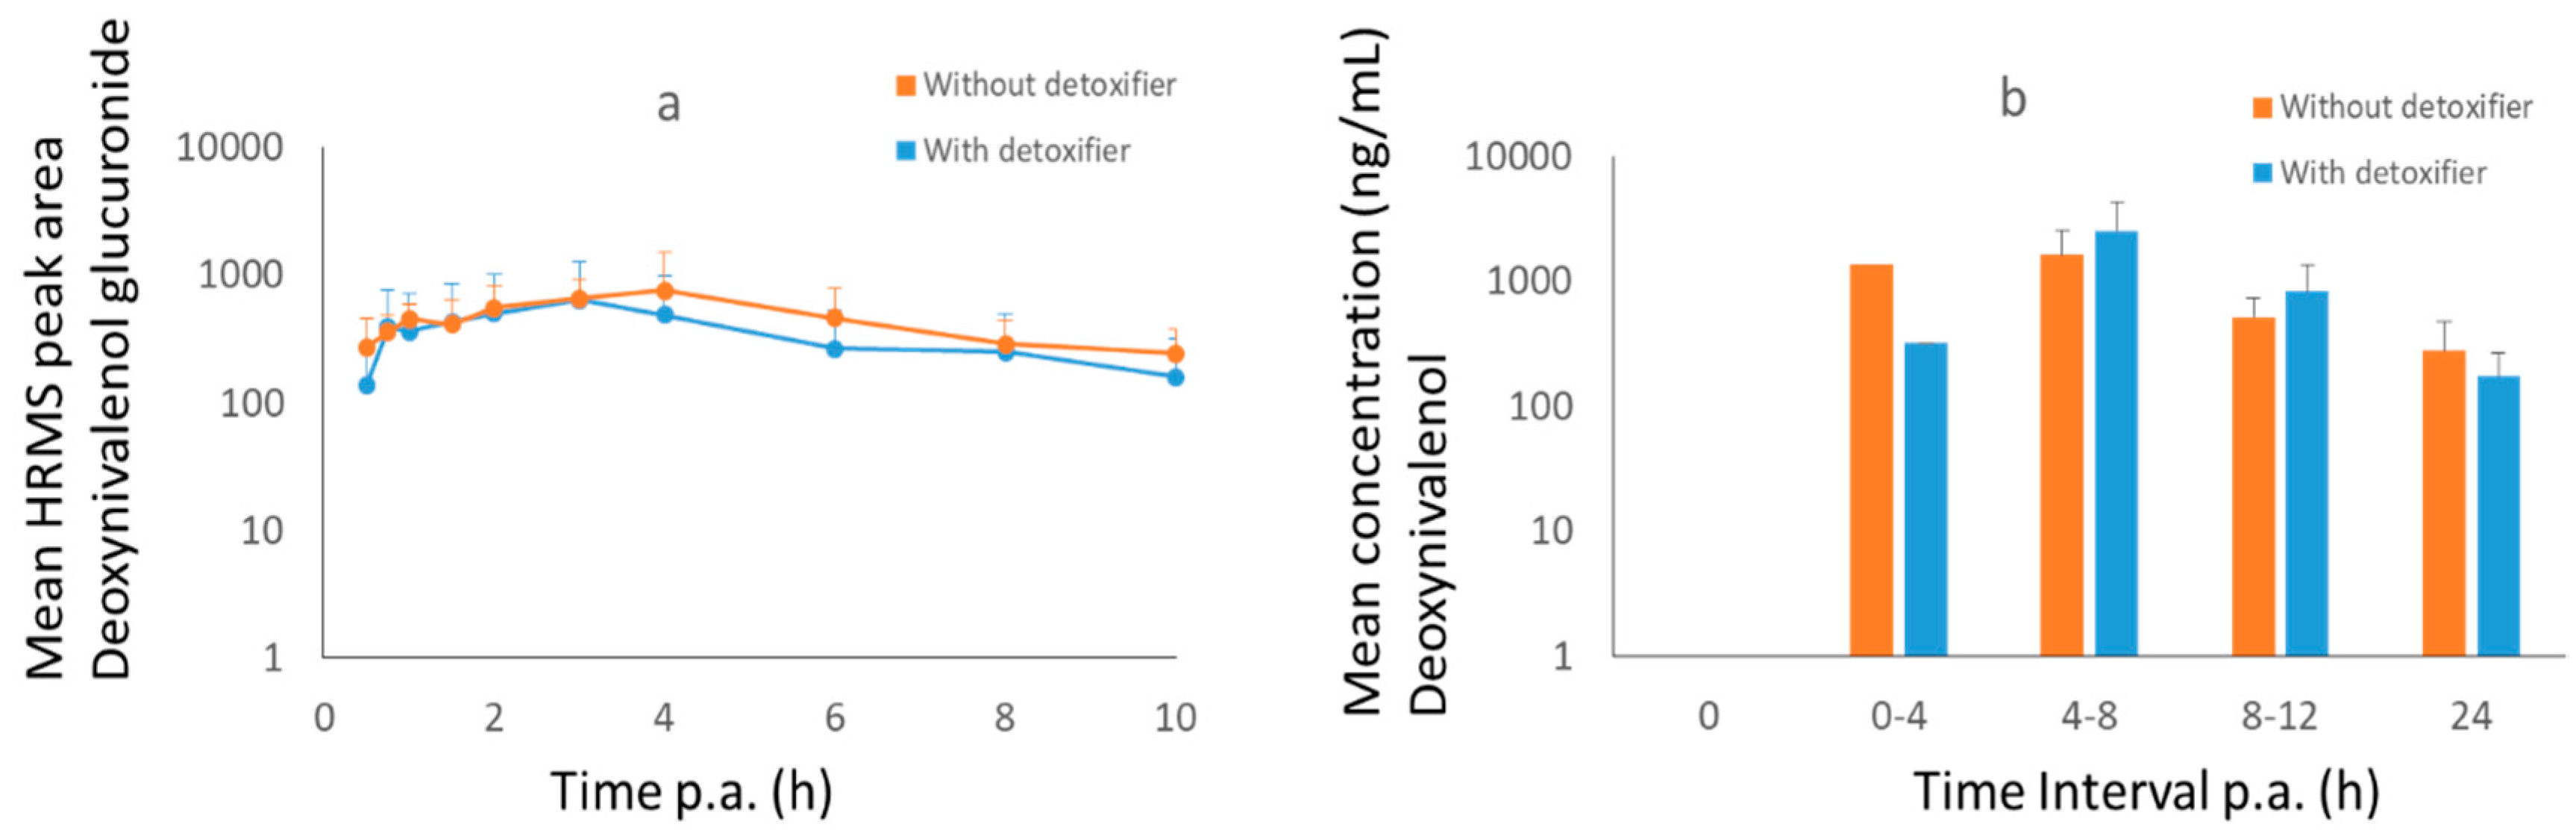
| DON | DON DON-GlcA | DON, DOM-1 DON-GlcA (below LOQ) | DON (below LOQ) DOM-1 (below LOQ) |
| ZEN | ZEN ZEN-GlcA | ZEN, AZEL, BZEL, ZAN ZEN-GlcA | ZEN, AZEL, BZEL, AZAL, BZAL, ZAN |
| Broiler Chicken | Plasma | Excreta | |
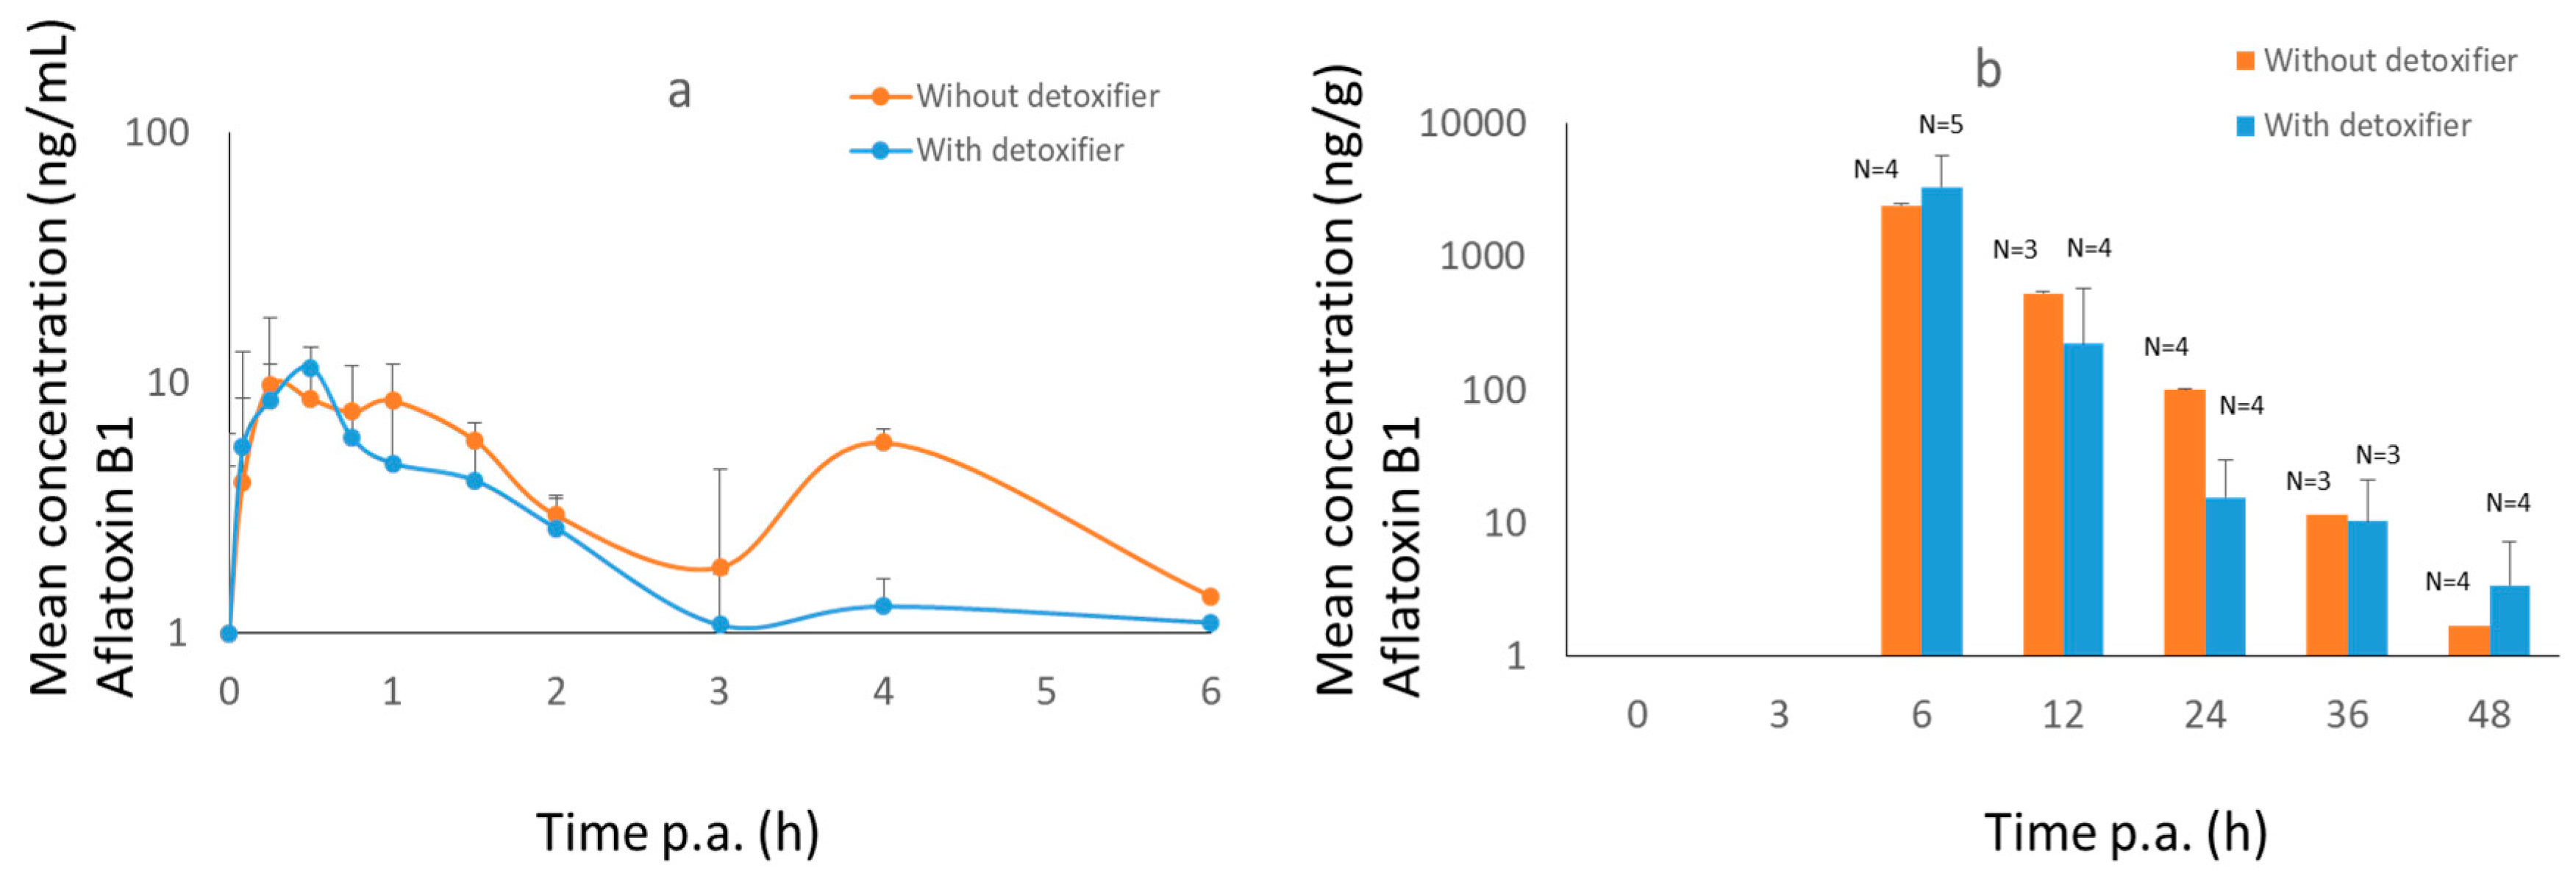
| AFB1 | AFL AFB1 | AFB1 | |
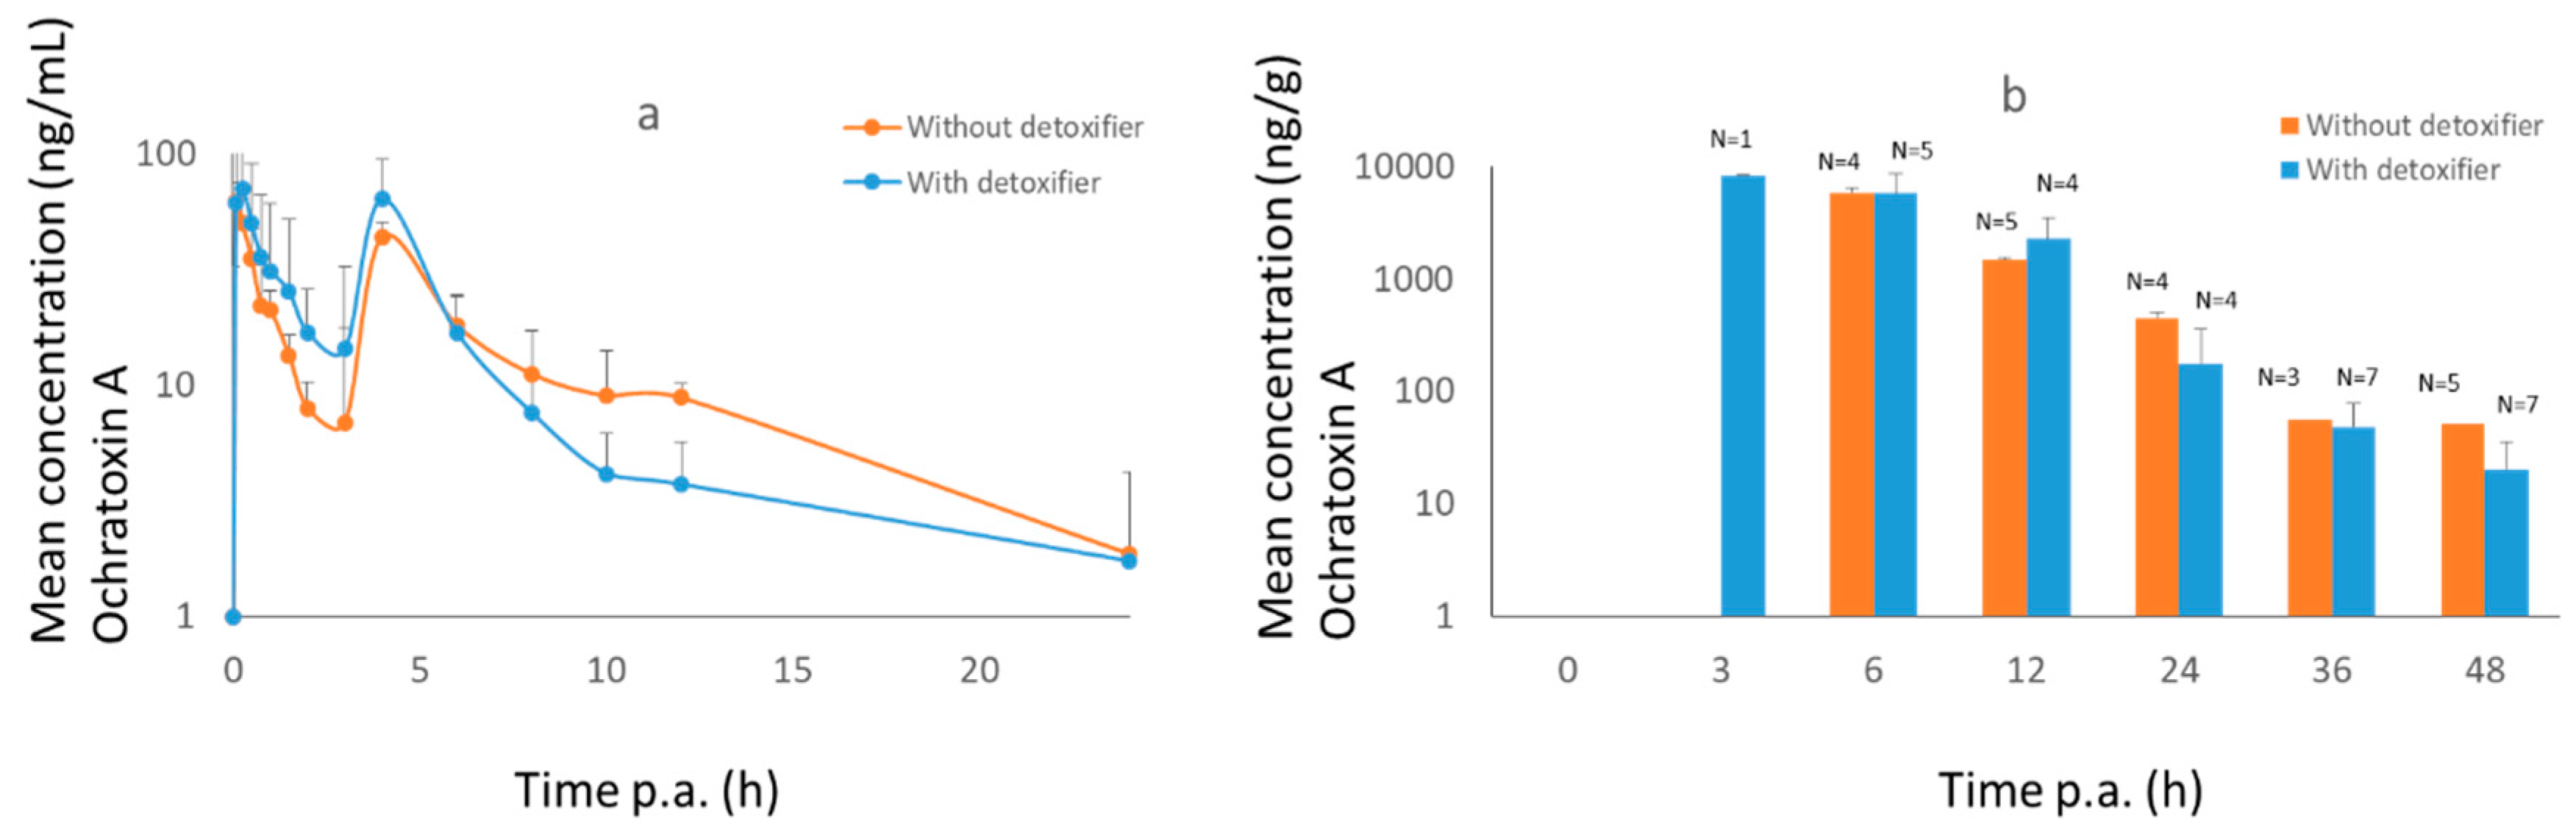
| OTA | OTA | OTA | |
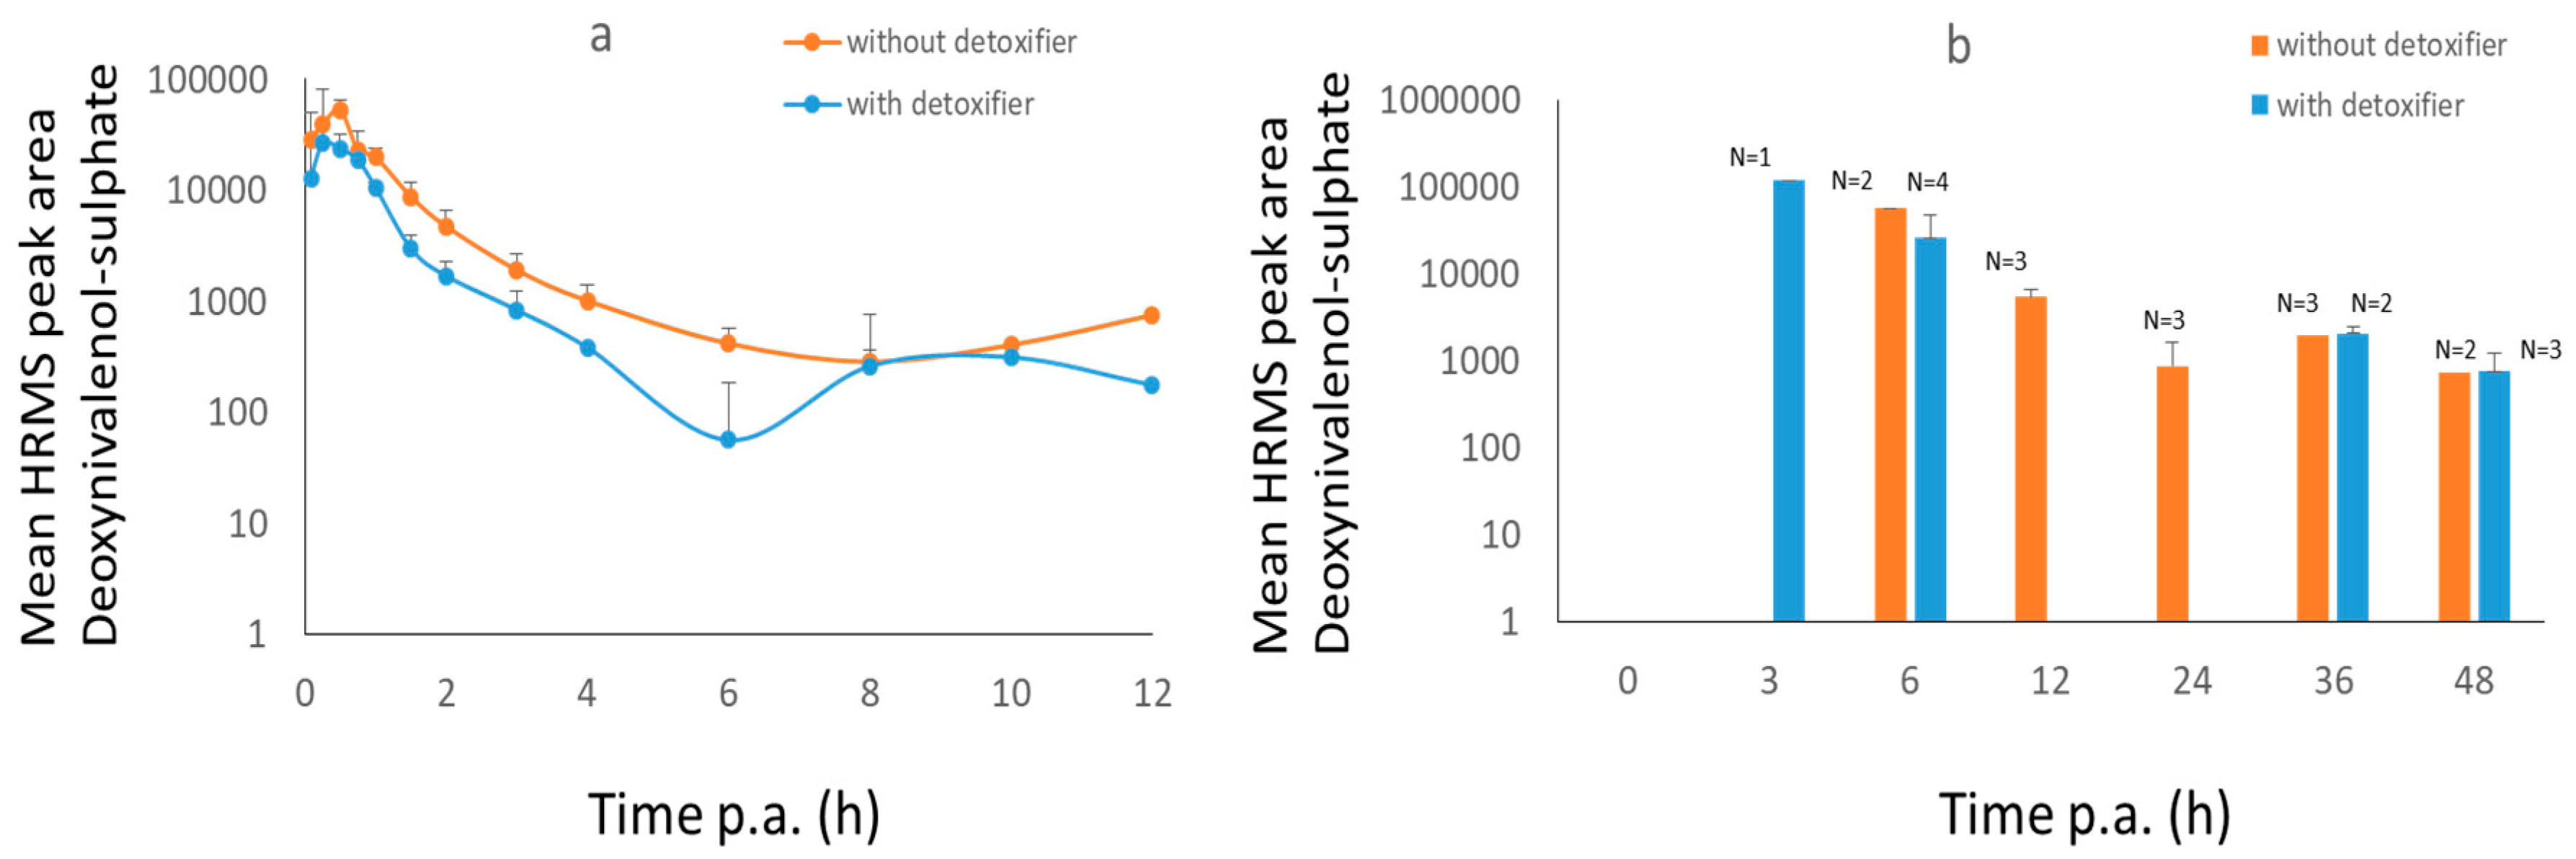
| DON | DON-S | DON-S |
| Mycotoxins in Matrix | Treatment or Control | Area Under the Concentration–Time Curve from Time Zero to the Last Time Point (AUC0→t) | Area Under the Concentration–Time Curve from Time Zero to Infinity (AUC0→∞) | % Difference of AUC0→∞ between Treatment and Control [(Tr-C)/C)] | Maximum Concentration Cmax | Time to Maximum Concentration Tmax (h) |
|---|---|---|---|---|---|---|
| DON-S in plasma | Treatment | 1,484,621 (peak area * h) | 1,545,085 (peak area * h) | −49% * | 26,260 (peak area) | 0.25 |
| DON-S in plasma | Control | 2,960,870 (peak area * h) | 3,009,746 (peak area * h) | 52,183 (peak area) | 0.5 | |
| DON-S in excreta | Treatment | n.a. | n.a. | 118,670 (peak area) | 3.00 | |
| DON-S in excreta | Control | n.a. | n.a. | 55,753 (peak area) | 6.00 | |
| AFB1 in plasma | Treatment | 992 (h * ng/mL) | 1156 (h * ng/mL) | −40% * | 11.5 ng/mL | 0.50 |
| AFB1 in plasma | Control | 1600 (h * ng/mL) | 1914 (h * ng/mL) | 9.8 ng/mL | 0.25 | |
| AFB1 in excreta | Treatment | n.a. | n.a. | 3309 ng/g | 6.00 | |
| AFB1 in excreta | Control | n.a. | n.a. | 2400 ng/g | 6.00 | |
| OTA in plasma | Treatment | 16,874 (h * ng/mL) | 17,560 (h * ng/mL) | +13% | 70.3 ng/mL | 0.25 |
| OTA in plasma | Control | 16,315 (h * ng/mL) | 17,322 (h * ng/mL) | 62.1 ng/mL | 0.083 | |
| OTA in excreta | Treatment | n.a. | n.a. | 8252 ng/g | 3.00 | |
| OTA in excreta | Control | n.a. | n.a. | 5838 ng/g | 6.00 |
| Mycotoxins in Matrix | Treatment or Control | Area Under the Concentration–Time Curve from Time Zero to the Last Sampling Point (AUC0→t) | Area Under the Concentration–Time Curve from Time Zero to Infinity (AUC0→∞) | % Difference of AUC0→∞ between Treatment and Control [(Tr-C)/C)] | Maximum Concentration Cmax | Time at Maximum Concentration Tmax (h) |
|---|---|---|---|---|---|---|
| DON-GlcA in plasma | Treatment | 3287 (peak area * h) | 4739 (peak area * h) | −13% | 600 (peak area) | 3 |
| DON-GlcA in plasma | Control | 4819 (peak area * h) | 5433 (peak area * h) | 755 (peak area) | 4 | |
| DON in urine | Treatment | 9729 (h * ng/mL) | 12,429 (h * ng/mL) | −26% | 2532 ng/mL | 4–8 |
| DON in urine | Control | 11,990 (h * ng/mL) | 17,006 (h * ng/mL) | 1597 ng/mL | 4–8 | |
| ZEN-GlcA in plasma | Treatment | 54,606 (peak area * h) | 56,594 (peak area * h) | −12% | 12,247 (peak area) | 0.75 |
| ZEN-GlcA in plasma | Control | 61,708 (peak area * h) | 64,456 (peak area * h) | 19,487 (peak area) | 0.33 | |
| ZEN-GlcA in urine | Treatment | 19,559,385 (peak area * h) | 24,454,352 (peak area * h) | −4% | 1,640,555 (peak area) | 4–8 |
| ZEN-GlcA in urine | Control | 16,850,362 (peak area * h) | 25,470,498 (peak area * h) | 1,639,248 (peak area) | 4–8 | |
| ZEN in feces | Treatment | 267,115 (h * ng/g) | n.a. | +21% | n.a. | n.a. |
| ZEN in feces | Control | 220,788 (h * ng/g) | n.a. | 18,621 ng/g | 12 |
© 2019 by the authors. Licensee MDPI, Basel, Switzerland. This article is an open access article distributed under the terms and conditions of the Creative Commons Attribution (CC BY) license (http://creativecommons.org/licenses/by/4.0/).
Share and Cite
Lauwers, M.; Croubels, S.; Letor, B.; Gougoulias, C.; Devreese, M. Biomarkers for Exposure as a Tool for Efficacy Testing of a Mycotoxin Detoxifier in Broiler Chickens and Pigs. Toxins 2019, 11, 187. https://0-doi-org.brum.beds.ac.uk/10.3390/toxins11040187
Lauwers M, Croubels S, Letor B, Gougoulias C, Devreese M. Biomarkers for Exposure as a Tool for Efficacy Testing of a Mycotoxin Detoxifier in Broiler Chickens and Pigs. Toxins. 2019; 11(4):187. https://0-doi-org.brum.beds.ac.uk/10.3390/toxins11040187
Chicago/Turabian StyleLauwers, Marianne, Siska Croubels, Ben Letor, Christos Gougoulias, and Mathias Devreese. 2019. "Biomarkers for Exposure as a Tool for Efficacy Testing of a Mycotoxin Detoxifier in Broiler Chickens and Pigs" Toxins 11, no. 4: 187. https://0-doi-org.brum.beds.ac.uk/10.3390/toxins11040187