15N Stable Isotope Labeling PSTs in Alexandrium minutum for Application of PSTs as Biomarker
by
Wancui Xie
1,2, 
Min Li
1,
Lin Song
1,2,
Rui Zhang
3,
Xiaoqun Hu
1,
Chengzhu Liang
4 and
Xihong Yang
1,2,* 1
College of Marine Science and Biological Engineering, Qingdao University of Science & Technology, Qingdao 266042, China
2
Key Laboratory for Biochemical Engineering of Shandong Province, Qingdao 266042, China
3
College of Food Science and Technology, Guangdong Ocean University, Zhanjiang 524088, China
4
Shandong Entry-Exit Inspection and Quarantine Bureau, Qingdao 266000, China
*
Author to whom correspondence should be addressed.
Toxins 2019, 11(4), 211; https://0-doi-org.brum.beds.ac.uk/10.3390/toxins11040211
Submission received: 27 February 2019
/
Revised: 4 April 2019
/
Accepted: 4 April 2019
/
Published: 8 April 2019
(This article belongs to the Collection Toxicological Challenges of Aquatic Toxins)
Abstract
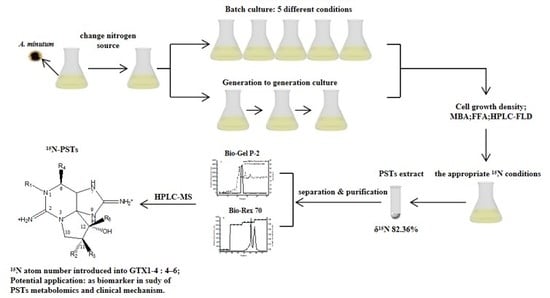
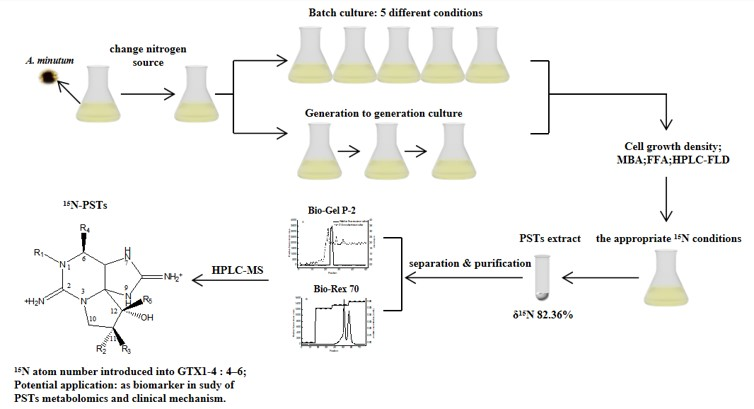
:The dinoflagellate Alexandrium minutum (A. minutum) which can produce paralytic shellfish toxins (PSTs) is often used as a model to study the migration, biotransformation, accumulation, and removal of PSTs. However, the mechanism is still unclear. To provide a new tool for related studies, we tried to label PSTs metabolically with 15N stable isotope to obtain 15N-PSTs instead of original 14N, which could be treated as biomarker on PSTs metabolism. We then cultured the A. minutum AGY-H46 which produces toxins GTX1-4 in f/2 medium of different 15N/P concentrations. The 15N-PSTs’ toxicity and toxin profile were detected. Meanwhile, the 15N labeling abundance and 15N atom number of 15N-PSTs were identified. The 14N of PSTs produced by A. minutum can be successfully replaced by 15N, and the f/2 medium of standard 15N/P concentration was the best choice in terms of the species’ growth, PST profile, 15N labeling result and experiment cost. After many (>15) generations, the 15N abundance in PSTs extract reached 82.36%, and the 15N atom number introduced into GTX1-4 might be 4–6. This paper innovatively provided the initial evidence that 15N isotope application of labeling PSTs in A. minutum is feasible. The 15N-PSTs as biomarker can be applied and provide further information on PSTs metabolism.
Keywords:
Alexandrium minutum; dinoflagellate; paralytic shellfish toxins (PSTs); 15N stable isotope labeling; biomarkerKey Contribution: The 14N of paralytic shellfish toxins produced by experimental Alexandrium minutum can be replaced by 15N successfully. 15N abundance in paralytic shellfish toxins extract reached 82.36%, and 15N atom number introduced into Gonyautoxin1-4 may be 4–6. 15N-paralytic shellfish toxins as biomarker have potential application in some fields such as metabolomics and clinical mechanism of paralytic shellfish toxins.
1. Introduction
Harmful algal blooms (HABs) occur frequently in coastal areas worldwide, causing public concerns. Firstly, HABs cause millions of dollars economic losses in the tourism and industry sectors [1]. Secondly, HABs break the balance of marine ecosystems as they can disrupt communities and food web structures [2,3]. Thirdly, phycotoxins produced by HABs may be transferred through the food cycle, thereby causing lethal and sublethal effects on humans [4,5]. Among all the toxins produced by HABs species, paralytic shellfish toxins (PSTs) produced by dinoflagellates are the most widespread and potent shellfish contaminating biotoxins [6]. They are accumulated by filter-feeding bivalve mollusks and some zoophagous mollusks [7]. One of the most widespread toxigenic microalgal taxa is the dinoflagellate Alexandrium, and studies have demonstrated that toxic Alexandrium spp. disrupt behavioral and physiological processes in marine filter feeders [8,9]. In recent years, A. tamarense, A. minutum, A. ostenfeldii, and others were used as carriers of PSTs to track the migration, biotransformation, accumulation, and removal of PSTs under experimental conditions [10,11,12]. However, the metabolism of PSTs in bivalves is still unclear. Thus, there is a need for a new powerful tool to conduct PST-related researches.
Isotopic tracer technique can be used to study the absorption, distribution, metabolism, and excretion of some substances, such as protein and lipid, or to establish organism trophic links in the ecosystem [13,14,15,16]. The stable isotope labeling (ICAT, ICPL, IDBEST, iTRAQ, TMT, IPTL, and SILAC)-based quantitative approaches are highly efficient for obtaining highly accurate quantification results and for building more extensive small molecule databases [14,17], especially in proteomics [18,19]. Some studies were conducted on microalgae due to their ability to fix stable isotopes photosynthetically into cells and offer various target products [20,21,22,23]. Artificially enriched stable isotopes of nitrogen can be fed to cells, either in the form of 15N-labeled amino acid or 15N-labeled inorganic salt. According to [24], the microalgae Chlamydomonas reinhardtii was used to produce 15N-labeled amino acids with a high isotopic enrichment and sixteen 15N-labelled amino acids could be obtained.
However, isotope-labeling toxin-producing algae have been rarely studied so far. In the present study, we metabolically labeled the A. minutum produced gonyautoxins1-4 (GTX1-4) that belonging to mono-sulfated subgroup of PSTs [25]. The culture was carried out with 15N-NaNO3 as nitrogen source to obtain the 15N-PSTs that could be used as biomarker and provide further information on PSTs metabolism in filter feeding bivalve.
2. Results
2.1. Batch Culture: 15N/P Influence in Algal Growth and Toxicity
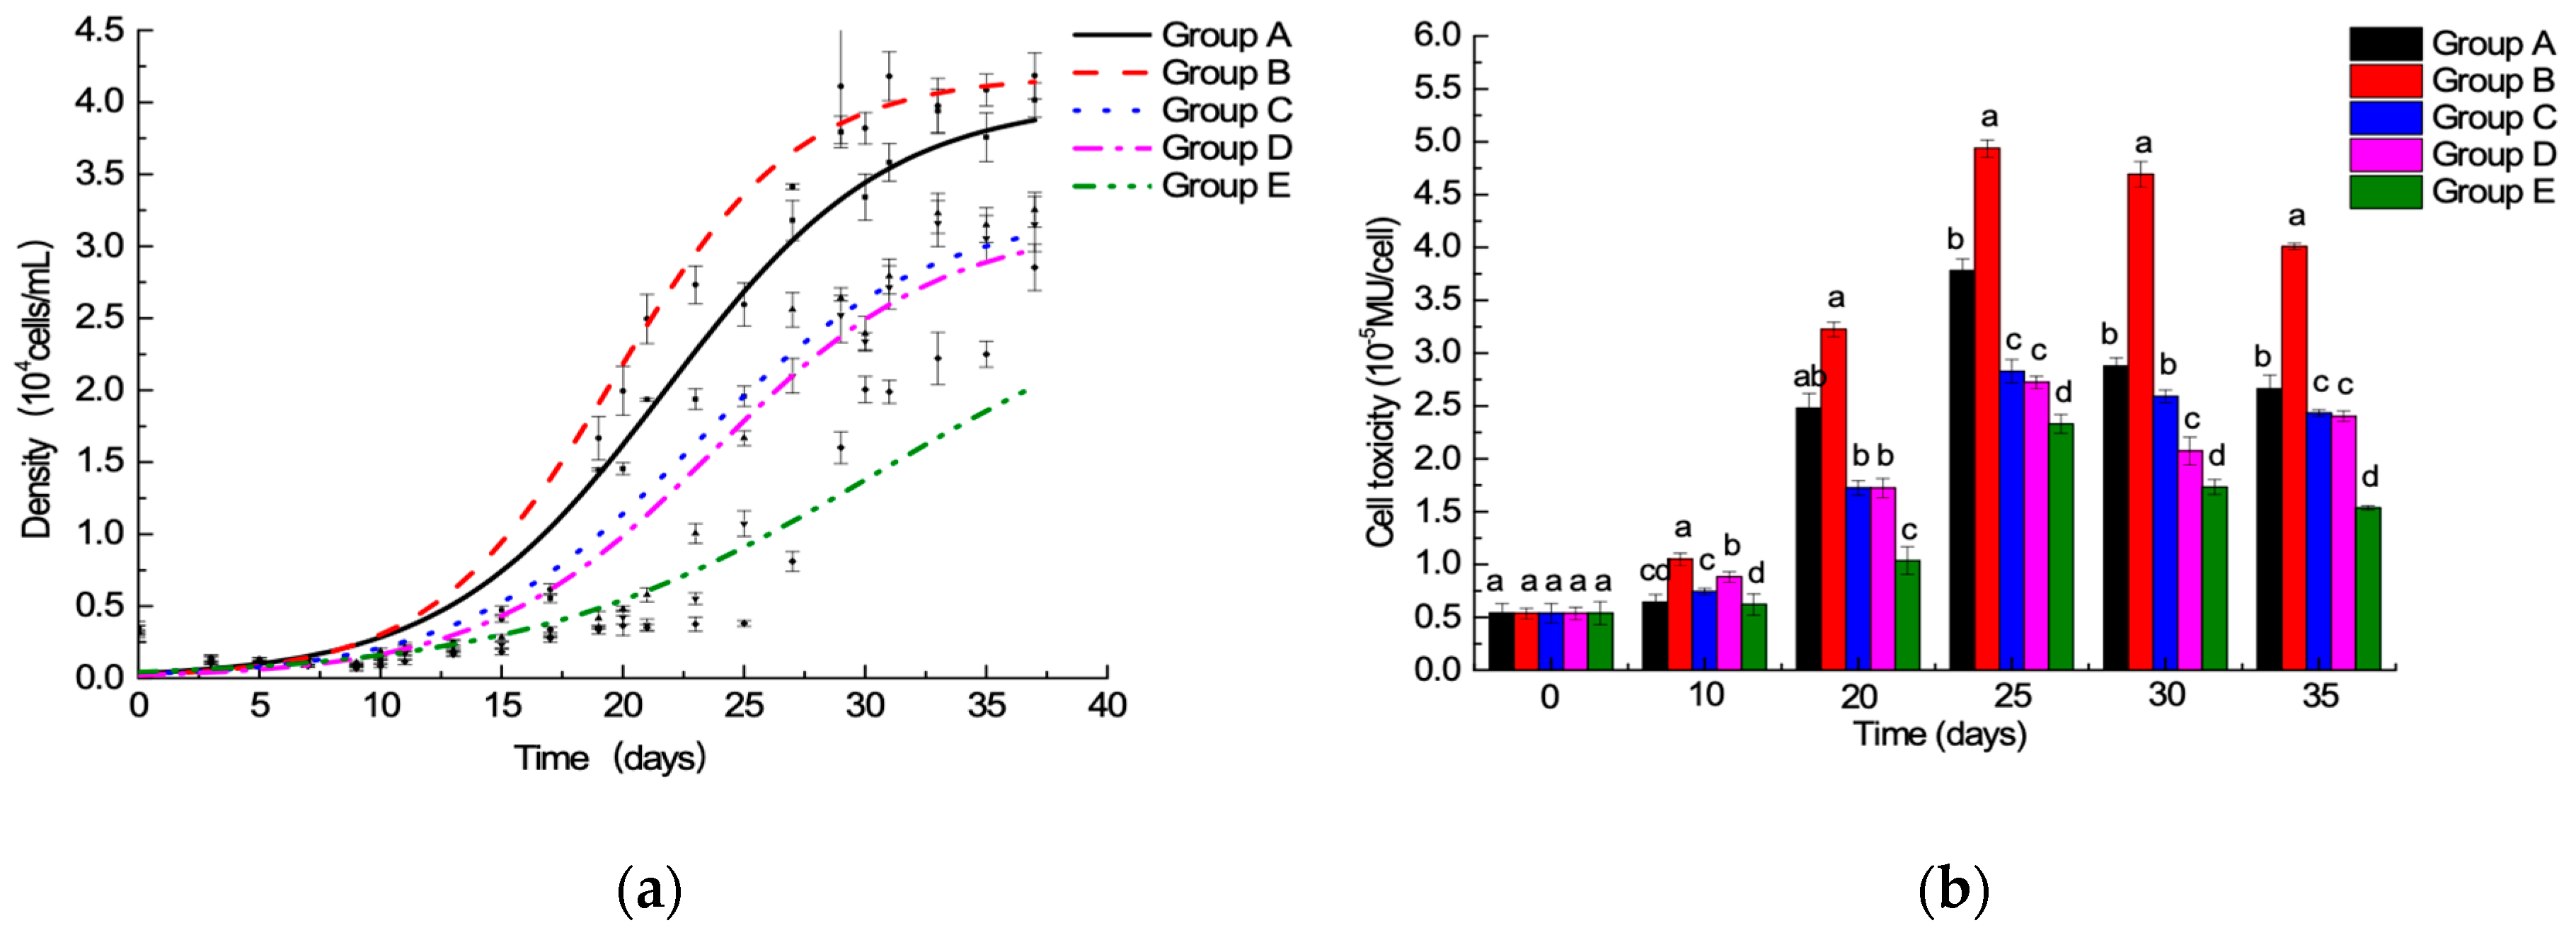
Initial batch culture experiments allowed comparison of algae growth under different 15N/P conditions, as follows: Group A: 1.0 time of the f/2 medium standard 15N/P concentration; Group B: 1.5 times of the f/2 medium standard 15N/P concentration; Group C: 2.0 times of the f/2 medium standard 15N/P concentration; Group D: 2.5 times of the f/2 medium standard 15N/P concentration; and Group E: 3.0 times of the f/2 medium standard 15N/P concentration. The results showed that 15N/P concentration can affect algal growth (Figure 1a). In an optimal culture environment, the growth curve of algae cell can be roughly divided into 4 phases, as follows: lag phase 0–15 days; log phase 16–30 days; 31 days of the stable phase; and decay phase. In this study, the decay phase was not studied, because the focus was on the degree of 15N labeling of algal cellular toxin. The results were similar to those obtained in the report [26]. However, the lag phase of this experiment was much longer, and it may have been caused by partial mechanical damage to cells when algal cells were collected by centrifugation. After the growth of algal cells into the log phase, Group B cell density was higher than those of the other four groups (p < 0.05). At 30 days, the maximum value of Group B reached 3.820 × 10⁴ cells/mL, and there was no significant difference in Group A cell density (3.342 × 10⁴ cells/mL) (p > 0.05). However, the biomass of Groups A and B biomass was much higher than that of the other three groups (p < 0.01). Lower biomass at high nutrient concentration could be attributed to the inhabitation of photosystem II’s photosynthetic capacity at high nutrient levels [27].
15N/P conditions also can affect toxicity of algae cells (Figure 1b). The highest toxin levels were determined at day 25 in the log phase in all groups, the same as [28], not early- or post- stationary growth phase mentioned in [29,30]. Concerning the factors influencing toxicity, the toxin content per cell in batch culture was not only related to the cell growth stage, but was also affected by intracellular nutrient salts (e.g., nitrogen, phosphorus, and carbon dioxide), thereby reflecting the balance between synthesis and leakage of toxins (e.g., catabolism and cell division) [31].
2.2. Generation to Generation Culture: 15N/P Influence in Algal Growth and Toxicity
The algal cells of Groups A and B were chosen via generation to generation culture (three generations) because of better growth. The effects of 15N/P concentration on cell growth and toxicity are displayed in Figure 2. In the first generation, Group B algae cell growth was better than that of Group A; the same results were obtained in batch culture experiments. In the second and third generations, the cell density of Group B was less than that of Group A, especially in the third generation. Interestingly, there was no significant difference (p < 0.05) in algal cytotoxicity between the two groups in all three generations. The experimental results showed the algae cells cultured in a nutrient solution with a higher 15N/P than f/2 medium standard 15N/P concentration gradually deteriorated, indicating that f/2 medium standard 15N/P concentration was more suitable for domesticating high abundance 15N-PST A. minutum.
2.3. 15N/P Effect on Algae PSTs Profile
The experiment was carried out using 1.0 and 1.5 times of the f/2 medium standard 15N/P concentration compared with 1.0 and 1.5 times of the f/2 medium standard 15N/P concentration. The experimental A. minutum only produced GTX1-4; the major components are GTX-2,-3, which accounted for about 74% of the total toxin (Figure 3). Changing the standard N/P concentration influenced the profile of PSTs, and no significant difference was found between 1.0 time of the f/2 medium standard 15N/P and 14N/P concentration, indicating that the application of 15N isotope labeling can feasibly be used to study PSTs production and metabolism.
2.4. 15N Labeling Abundance Change of 15N-PSTs
The 15N labeling abundance was calculated according to the following formula:
15N atom% = 1/(2I28/I29 + 1) × 100 (15N atom% < 10%);
15N atom% = 2/(I29/I30 + 2) × 100 (15N atom% > 10%)
15N atom% = 2/(I29/I30 + 2) × 100 (15N atom% > 10%)
In the algal culture environment, 15N-NaNO3 of f/2 medium is not the only nitrogen source because of the inorganic 14N existing in natural seawater. A. minutum cells prefer absorbing light elements (14N) and rejecting heavy elements (15N), resulting in nitrogen stable isotope fractionation. With increasing cell density and size, less and less 14N can be utilized. Thus, more 15N can enter cells, and nitrogen stable isotopes fractionation weakens. Two culture methods and gas isotope mass spectrometer were used to determine the relationship between 15N-labeling abundance and culture time, as shown in Table 1. During the batch culture, 15N abundance was positively related to culture time and reached the highest value at day 30. There are significant differences (p < 0.01) in terms of 15N abundance among lag, log, and stable phases. After many generations, 15N abundance reached to 82.36 atom%, but this percentage was still far below the abundance of the labeling material 15N-NaNO3 (δ15N = 99.14%), not reaching our expectation (>90%).
2.5. The Efficiency of 15N-PSTs Separation and Purification
15N-PSTs extracts were separated and purified by column chromatography on the Bio-Gel P-2 and the weak cation exchanger Bio-Rex 70. In the process of column chromatography on the Bio-Gel P-2, fluorescence detection and UV absorbance detection were carried out (Figure 4a). The UV absorption peak did not coincide with the fluorescence absorption peak. Thus, the UV absorption signal had no relationship with the toxin component. As shown by the fluorescence absorption peak, Bio-Gel P-2 effectively separated 15N-PSTs with impurities in crude extracts, such as proteins and pigments. The liquid of fluorescence absorption peak was collected, freeze-dried (10 mg), and redissolved with 0.05 M Tri-HCl (2 mL). The redissolved sample (1 mL) was used for purification by column chromatography on weak cation exchanger Bio-Rex 70 at gradient elution condition and was separated (Figure 4b). After analysis, the Peak Ⅰ was determined to be the isomer mixture of GTX1/4, and Peak Ⅱ was the isomer mixture of GTX2/3.
2.6. 15N Atom Number Identification of 15N-PSTs
As demonstrated previously [32], GTX1-4 (Figure 5) can be ionized in ESI positive ion mode, thereby giving abundant fragment ions (Table 2). When 14N of PSTs is replaced by 15N, [M+H]+ and fragment ions will change with the number of 15N atoms, so that primary mass spectrum can be used to determine the 15N atom number of 15N-PSTs. After the addition of artificial nitrogen in A. minutum culture, 15N was successfully introduced to PSTs, and characteristic fragment ions were produced. There was no [M+H]+ peak in the mass spectrum as the result of high capillary voltage in this experiment (Figure 6). GTX1 produced three characteristic fragment ions (m/z = 334.2966; 318.3007; 319.3054) with the loss of -SO3 or -SO3-H2O. GTX4 generated three characteristic fragment ions (m/z = 318.3007; 319.3054; 338.3418) with the loss of -SO3-H2O or -SO3 and had two fragment ions (m/z = 318.3007; 319.3054) similar to those of GTX1. There were four characteristic fragment ions (m/z = 322.1197; 321.1252; 305.1583; 317.0497) in GTX2 with the loss of -SO3 or -SO3-H2O, whereas two characteristic fragment ions (m/z = 302.3054; 303.3095) were obtained with the loss of -SO3-H2O. Theoretically, the m/z of fragment ions can increase (+1,+2,+3,+4,+5,+6,+7) corresponding with the number (1,2,3,4,5,6,7) of introduced 15N atoms in PSTs. Based on these data, 2~6 15N atoms can be introduced into the 15N-PSTs molecule, and 4~6 15N atoms is most possible.
3. Discussion
Numerous studies have focused on the bioaccumulation and biotransformation of PSTs using Alexandrium strains, such as A. minutum in marine organisms [33]. Stable isotopes have been often used to study lipid synthesis, proteomics and ecosystem [13,15,34] and rarely applied to toxin-producing algae [35]. This study intends to use the biosynthetic process to replace the nitrogen atom of A. minutum with a stable isotope 15N to form a tracer-enabled A. minutum for PST synthesis and metabolism.
3.1. Effect 15N/P of on A. minutum Culture
Growth and toxin production of toxic dinoflagellates vary with nutrients supply. High nutrient cultures can inhibit the photosynthetic capacity of photosystem II, which related to algae growth [27]. The N:P ratio can be used as an index for the nutritional status and physiological behavior of phytoplanktons [36]. Kinds of nitrogen sources and N:P supply ratio can affect the physiological responses of a tropical Pacific strain of A. minutum, the cellular toxin quota (Qt) was higher in P-depleted, nitrate-grown cultures [37]. To assure the feasibility of isotope 15N, some experiments were carried out, including the comparison of different 15N:P ratio. In batch culture, five 15N:P ratios were compared, and the growth of A. minutum under 1.0 and 1.5 times of the f/2 medium standard 15N/P concentration was better than others (Figure 1a). Similar previous findings reported that cell densities and growth rates of A. minutum were severely suppressed under high N/P ratios (>100) in both N-NO3 and N-NH4 treatments [38]. Some studies showed that the incorporation of 15N-labeled salt did not affect the growth of green alga Chlamydomonas reinhardtii [24,39], and our study achieved the same result with A. minutum. The toxin profile of this A. minutum strain is relatively stable and predominantly constitutes GTX1-4 (Figure 3), the same as four strains of A. minutum collected from southern Taiwan [40], even under different N:P supply ratios. The highest algae toxicity per cell of all five groups was observed at day 25, and cellular toxin quota of the exponential growth phase was higher than that of the stable phase, even though the total number of stable cells is highest during the entire growth process (Figure 1b). The explanation could be that there was a negative correlation between algae toxicity per cell and cell density. In other words, the cell size was smaller when cell density was higher; thus, toxicity per cell of stable phase was lower. As previously reported, changes of nutrient availability with time in batch culture caused growth stage variability in toxin content, which peaked during mid-exponential growth [31]. Total toxicity, toxicity per cell, and the number of and relative proportion of toxin analogs changed in relation to the 15N:P ratio. The f/2 medium standard 15N/P concentration at 1.0 time was a better choice to label PSTs with 15N regardless of cultivation method, i.e., batch culture or generation to generation culture, for A. minutum growth, PST production and profile, and experimental cost.
3.2. The Replacement of Stable Isotope 15N
The successful production PSTs of labeled substances from A. minutum was detected by MAT-271 Gas isotope mass spectrometer to determine 15N abundance, Analysis by HPLC-MS was performed to identify 15N atom number. In batch culture, δ15N of two groups’ PSTs had a significant difference (p < 0.01) in different growth stages (lag, log, and stable phases) (Table 2). Combining 15N labeling abundance with mass spectrum results, it can be presumed that artificial 15N addition can bring 2~6 15N atoms into the 15N-PSTs molecule, and the 4~6 15N atoms’ replacement becomes most possible. Recently, 15N stable-isotope-labeling was applied to the toxic dinoflagellate Alexandrium catenella and the relationship between the order of 15N incorporation % values of the labeled populations and the proposed biosynthetic route was established [35]. Relative abundance % of m+6 and m+7 isotopomers of PSTs were the highest in A. catenella after a two month passage in 15N-NaNO3 medium in [35], which is similar to our conclusion. Nitrogen (N) isotopic compositions of PSTs in A. minutum cells reflect the isotopic fractionations associated with diverse biochemical reactions. Based on PSTs being a secondary metabolite, a small part of the supplied nitrogen was assimilated into PSTs, and most of the nitrogen may participate in the synthesis of other nitrogen compounds. Some findings on high abundance in biomass (not extracted) have been reported; a process for the cost-effective production of 13C/15N-labelled biomass of microalgae on a commercial scale is presented, and 97.8% of the supplied nitrogen is assimilated into the biomass [23]. However, in the present paper, 15N-labeling abundance of the 15N-PSTs extract was 82.36%, lower than the abundance of whole cell in existing research [23]. The occurrence of this situation can be explained by the following reasons. Firstly, the time of each generation culture is not sufficiently long enough. Secondly, the total 15N abundance in the crude extract of the toxin cannot fully represent 15N in the pure toxin, because extract impurities (e.g., protein and pigment) can cause interference. Thirdly, trace amounts of nitrogen in natural seawater and the culture solution reagent may affect 15N-labeled PSTs.
4. Conclusions
This paper provides the initial evidence that 15N isotope is feasible to label PSTs in A. minutum and worthy of being a powerful tool to conduct PST-related researches. In our study, 15N abundance, PSTs content and profile were detected and the 15N atom number introduced into GTX1-4 should be 4–6. However, it is a pity that the precursor and the biosynthetic intermediates of PSTs in A. minutum were not analyzed. Further study is needed to apply isotope-labeling on both toxin-producing algae and vector mollusk species so that we can better elucidate the mechanism of PSTs biosynthesis and metabolism.
5. Materials and Methods
5.1. Chemicals and Analytical Standards
15N-NaNO3 (δ15N = 99.14%) was obtained from SRICI (Shanghai Research Institute of Chemical Industry CO., LTD., Shanghai, China). Bio-gel P-2 (400 mesh), Bio-Rex 70 (400 mesh) were obtained from BIO-RAD (Hercules, CA, USA). Certified reference materials for PSTs, including gonyautoxin 1/4 (GTX 1/4), gonyautoxin 2/3 (GTX 2/3), were purchased from the National Research Council, Institute for Marine Bioscience (Halifax, Canada). Analytical grade solvents were used for extraction purposes while LC grade solvents were used for HPLC-FLD applications.
5.2. Algal Culture
The PSTs-producing dinoflagellate A. minutum (strain AGY-H46, purchased from Leadingtec, Shanghai, China) was cultivated in thermo regulated rooms (25 ± 1 °C) with filtered (0.45 μm, Jinjing Ltd., China) and sterilized (121 °C, 20 min) seawater before enrichment with f/2 medium amendments (Table 3). The light intensity was set at 3000–4000 lux with a dark:light cycle of 14:10 h. The seawater was obtained from Donghai Island waters (Zhanjiang, China). Algal cell densities were determined by optical microscope and cells were collected at particular time for 15N abundance analysis and PSTs detection.
5.3. 15N-PSTs Extraction
An aliquot (60 mL) of the algal fluid was centrifuged at 6000 r/min under 4 °C for 10 min, and the supernatant was carefully discarded. The sedimentary cells were resuspended with 0.05 M acetic acid and then broken using ultrasonic processor in an ice bath for 10 min (power 80%, working 3 s, gap 3 s) until there was no whole cell. The combined liquid was centrifuged at 12000 r/min under 4 °C for 10 min, then the supernatant was filtered (0.22 μm, Jinjing Ltd., China) and stored under −20 °C for purification.
5.4. 15N-PSTs Separation and Purification
Separation and purification were carried on by reference to published papers [41,42]. The PSTs extract was adsorbed to a column of Bio-Gel P-2 equilibrated with water. Furthermore, the column was first washed with a sufficient volume of water and eluted with 0.1 mM acetic acid at a flow rate of 0.5 mL/min. After separation, toxin mixture was purified by ion exchange chromatography using a column of Bio-Rex 70 equilibrated with water and gradient eluted with acetic acid (acetic acid concentration was as follows: 0, 0.05, 0.055 and 0.060 mM). The fraction was collected every 12 min and then analyzed by FFA to assure purification efficiency.
5.5. 15N Abundance Analysis of 15N-PSTs Extracts
15N abundance was analyzed by MAT-271 Gas isotope mass spectrometer (Finnigan, Santa Clara Valley, CA, USA). Operating conditions were set to high voltage (10 kV), emission current (0.040 mA), electronic energy (100 eV) and well voltage (134 eV). 15N-PSTs extraction after freeze-drying was converted to gas by micro-high-heat combustion method, then entered into gas isotope mass spectrometer sample introduction system via sample adapter. Mass spectrometer vacuum was less than 2 × 10⁻⁵ Pa. After making the necessary calibration settings for the instrument, the instrument background measurement was performed. The sample gas was introduced into the sample storage system at a pressure of 5–10 Pa. The measurement process was automatically performed by computer instructions, and the signal strength (in mV) of mass number 28, 29, 30 was output as I28, I29 and I30.
5.6. PSTs Toxicity Test by the Mouse Bioassay
The mouse bioassay (MBA) was a referenced method from [43]. 10 healthy male mice were injected intraperitoneally with 1 mL aliquot of 15N-PSTs extracts and observed to quantify the toxin according to the time of death. The toxicity was expressed in mouse units (MU), 1 MU representing the average toxin amount to kill a mouse weighing 20 g within 15 min.
5.7. 15N-PSTs Detection by the Fast Fluorimetric Assay (FFA)
The fast fluorimetric assay (FFA) was performed by fluorospectrophotometer (HITACHI, Japan) at a 333 nm excitation wavelength, 10 nm excitation slit, emission wavelength 390 nm and 20 nm emission slit. The method was from [44] and got some modification in this paper. A portion (0.5 mL) of each extract or blank solution (0.05 M acetic acid), respectively, was mixed with 2 mL of oxidation solution (50 mM dipotassium phosphate with 10 mM periodic acid) and incubated for 15 min at 50 °C. After incubation, the reaction mixture was neutralized with 2.5 mL of 1 M acetic acid and transferred to a cuvette for detection by the fast fluorimetric assay (FFA). Relative fluorescence units (RFU) was recorded and this experiment was conducted to get an overview of the fluorescence of oxidized samples, but not for accurate quantification.
5.8. 15N-PSTs Determination by HPLC-FLD
HPLC-FLD analysis was carried out using Agilent 1100 (Agilent, Santa Clara, CA, USA) coupled to PCX5200 (Pickering Laboratories Company) post-column reactor and Agilent G1321A detector (λex = 330 nm, λem = 390 nm). Chromatographic separation of compounds was achieved on a reversed-phase C8 column (150 mm × 4.6 mm i.d.; 5 μm, GL Sciences, Tokyo, Japan). The system was managed by an Agilent Chem. Station 2.1 workstation. The PST extract was subjected to HPLC-FLD after ultrafiltration (10,000 Da ultrafiltration centrifuge tube, 12,000 r/min for 10 min at 4 °C). Analysis method was performed according to [45]. The oxidant solution was 50 mM potassium hydrogen phosphate containing 7 mM periodic acid. The acidifying agent was 0.5 M acetic acid. The flow rates were 0.8 mL/min for the elution solution and 0.4 mL/min for the oxidant and acidifying agent.
5.9. 15N-PSTs Quantification by HPLC-MS
HPLC-MS analysis was carried out on Agilent 1100 (Agilent, USA) coupled to Waters FIN_C2-XS QTof mass spectrometer (Waters, Milford, MA, USA) with an electrospray ionization interface. PSTs were separated on a TSKgel Amide-80 HILIC column (250 mm × 2 mm i.d.; 5 μm, Tosoh Bioscience, LLC, Montgomeryville, PA, USA). The PSTs extract after purification was subjected to HPLC-MS after ultrafiltration (10000 Da ultrafiltration centrifuge tube, 12000 r/min for 10 min at 4 °C). A binary mobile phase included “solvent A” and “solvent B”, in which “solvent A” was water containing 2.0 mM ammonium formate containing 0.1% (v/v) formic acid and “solvent B” was acetonitrile containing 0.1% (v/v) formic acid. Parameters of mass spectrometer were multiple reaction monitoring (MRM) mode, positive polarity of ESI, capillary voltage (3.2 kV), ion source temperature (150 °C), desolvation temperature (400 °C), cone gas flow (50 L/h) and desolvation gas flow (700 L/h).
Author Contributions
Methodology, X.Y.; investigation, M.L., R.Z. and X.H.; writing-original draft preparation, M.L.; writing-review and editing, W.X.; supervision, L.S., and C.L.; project administration, W.X. and X.Y.
Funding
This research was funded by National Natural Science Foundation of China, grant number 31271938 and 31772089, and Shandong Province Key Research and Development Program, grant number 2017GHY15127. This work was also financially supported by Major Scientific Research Projects in Universities Cultivation Plan (Q15137) GDOU2015050202.
Acknowledgments
This research was funded by National Natural Science Foundation of China, grant number 31271938 and 31772089, and Shandong Province Key Research and Development Program, grant number 2017GHY15127. This work was also financially supported by Major Scientific Research Projects in Universities Cultivation Plan (Q15137) GDOU2015050202. We gratefully acknowledge the help of the other members in our lab, who have offered us valuable suggestions in the academic studies. Besides, we also show our gratitude to Shanghai Research Institute of Chemical Industry CO., LTD., which provided technical support for us.
Conflicts of Interest
The authors declare no conflict of interest.
References
- Hoagland, P.A.; Anderson, D.M.; Kaoru, Y.; White, A.W. The Economic Effects of Harmful Algal Blooms in the United States: Estimates, Assessment Issues, and Information Needs. Estuaries 2002, 25, 819–837. [Google Scholar] [CrossRef]
- Gustaafm, H. Ocean climate change, phytoplankton community responses, and harmful algal blooms: A formidable predictive challenge. J. Phycol. 2010, 46, 220–235. [Google Scholar] [CrossRef]
- Rolton, A.; Vignier, J.; Soudant, P.; Shumway, S.E.; Bricelj, V.M.; Volety, A.K. Effects of the red tide dinoflagellate, Karenia brevis, on early development of the eastern oyster Crassostrea virginica and northern quahog Mercenaria mercenaria. Aquat. Toxicol. 2014, 155, 199–206. [Google Scholar] [CrossRef] [PubMed]
- Brooks, B.W.; Lazorchak, J.M.; Howard, M.D.; Johnson, M.V.; Morton, S.L.; Perkins, D.A.; Reavie, E.D.; Scott, G.I.; Smith, S.A.; Steevens, J.A. Are harmful algal blooms becoming the greatest inland water quality threat to public health and aquatic ecosystems? Environ. Toxicol. Chem. 2016, 35, 6–13. [Google Scholar] [CrossRef] [PubMed]
- Grattan, L.M.; Holobaugh, S.; Morris, J.G. Harmful algal blooms and public health. Harmful Algae 2016, 57, 2–8. [Google Scholar] [CrossRef] [PubMed]
- Zhang, Y.; Zhang, S.F.; Lin, L.; Wang, D.Z. Whole Transcriptomic Analysis Provides Insights into Molecular Mechanisms for Toxin Biosynthesis in a Toxic Dinoflagellate Alexandrium catenella (ACHK-T). Toxins 2017, 9, 213. [Google Scholar] [CrossRef]
- Li, A.; Chen, H.; Qiu, J.; Lin, H.; Gu, H. Determination of multiple toxins in whelk and clam samples collected from the Chukchi and Bering seas. Toxicon 2016, 109, 84–93. [Google Scholar] [CrossRef]
- Jiang, T.; Xu, Y.; Li, Y.; Jiang, T.; Wu, F.; Zhang, F. Seasonal dynamics of Alexandrium tamarense and occurrence of paralytic shellfish poisoning toxins in bivalves in Nanji Islands, East China Sea. Mar. Freshw. Res. 2014, 65, 350. [Google Scholar] [CrossRef]
- Fabioux, C.; Sulistiyani, Y.; Haberkorn, H.; Hegaret, H.; Amzil, Z.; Soudant, P. Exposure to toxic Alexandrium minutum activates the detoxifying and antioxidant systems in gills of the oyster Crassostrea gigas. Harmful Algae 2015, 48, 55–62. [Google Scholar] [CrossRef]
- Xie, W.; Liu, X.; Yang, X.; Zhang, C.; Bian, Z. Accumulation and depuration of paralytic shellfish poisoning toxins in the oyster Ostrea rivularis Gould—Chitosan facilitates the toxin depuration. Food Control 2013, 30, 446–452. [Google Scholar] [CrossRef]
- Ding, L.; Qiu, J.; Li, A. Proposed Biotransformation Pathways for New Metabolites of Paralytic Shellfish Toxins Based on Field and Experimental Mussel Samples. J. Agric. Food Chem. 2017, 65, 5494–5502. [Google Scholar] [CrossRef] [PubMed]
- Mat, A.M.; Klopp, C.; Payton, L.; Jeziorski, C.; Chalopin, M.; Amzil, Z.; Tran, D.; Wikfors, G.H.; Hegaret, H.; Soudant, P.; et al. Oyster transcriptome response to Alexandrium exposure is related to saxitoxin load and characterized by disrupted digestion, energy balance, and calcium and sodium signaling. Aquat. Toxicol. 2018, 199, 127–137. [Google Scholar] [CrossRef] [PubMed]
- Han, S.; Yan, S.; Chen, K.; Zhang, Z.; Zed, R.; Zhang, J.; Song, W.; Liu, H. 15N isotope fractionation in an aquatic food chain: Bellamya aeruginosa (Reeve) as an algal control agent. J. Environ. Sci. 2010, 22, 242–247. [Google Scholar] [CrossRef]
- Chahrour, O.; Cobice, D.; Malone, J. Stable isotope labelling methods in mass spectrometry-based quantitative proteomics. J. Pharm. Biomed. Anal. 2015, 113, 2–20. [Google Scholar] [CrossRef] [PubMed]
- Brandsma, J.; Bailey, A.P.; Koster, G.; Gould, A.P.; Postle, A.D. Stable isotope analysis of dynamic lipidomics. Biochim. Biophys. Acta 2017, 1862, 792–796. [Google Scholar] [CrossRef]
- Schneider, L.; Maher, W.A.; Potts, J.; Taylor, A.M.; Batley, G.E.; Krikowa, F.; Adamack, A.; Chariton, A.A.; Gruber, B. Trophic transfer of metals in a seagrass food web: Bioaccumulation of essential and non-essential metals. Mar. Pollut. Bull. 2018, 131, 468. [Google Scholar] [CrossRef] [PubMed]
- He, Y.-L.; Luo, Y.-B.; Chen, H.; Hou, H.-W.; Hu, Q.-Y. Research Progress in Analysis of Small Molecule Metabolites in Bio-matrices by Stable Isotope Coded Derivatization Combining with Liquid Chromatography–tandem Mass Spectrometry. Chin. J. Anal. Chem. 2017, 45, 1066–1077. [Google Scholar] [CrossRef]
- Thomas, M.; Huck, N.; Hoehenwarter, W.; Conrath, U.; Beckers, G.J.M. Combining Metabolic 15N Labeling with Improved Tandem MOAC for Enhance; Springer: New York, NY, USA, 2015; pp. 81–96. [Google Scholar]
- Lehmann, W.D. A timeline of stable isotopes and mass spectrometry in the life sciences. Mass Spectrom. Rev. 2016, 36. [Google Scholar] [CrossRef]
- Bequette, B.J.; Backwell, F.R.C.; Calder, A.G.; Metcalf, J.A.; Beever, D.E.; Macrae, J.C.; Lobley, G.E. Application of a U-13C-Labeled Amino Acid Tracer in Lactating Dairy Goats for Simultaneous Measurements of the Flux of Amino Acids in Plasma and the Partition of Amino Acids to the Mammary Gland. J. Dairy Sci. 1997, 80, 2842–2853. [Google Scholar] [CrossRef]
- Cox, J.; Kyle, D.; Radmer, R.; Delente, J. Stable-isotope-labeled biochemicals from microalgae. Trends Biotechnol. 1988, 6, 279–282. [Google Scholar] [CrossRef]
- Fernández, F.G.A.; Alias, C.B.; Pérez, J.A.S.; Sevilla, J.M.F.; González, M.J.I.; Grima, E.M. Production of 13C polyunsaturated fatty acids from the microalga Phaeodactylum tricornutum. J. Appl. Phycol. 2003, 15, 229–237. [Google Scholar] [CrossRef]
- Acien Fernandez, F.G.; Fernandez Sevilla, J.M.; Egorova-Zachernyuk, T.A.; Molina Grima, E. Cost-effective production of 13C, 15N stable isotope-labelled biomass from phototrophic microalgae for various biotechnological applications. Biomol. Eng. 2005, 22, 193–200. [Google Scholar] [CrossRef] [PubMed]
- Carcelén, J.N.; Marchante-Gayón, J.M.; González, P.R.; Valledor, L.; Cañal, M.J.; Alonso, J.I.G. A cost-effective approach to produce 15N-labelled amino acids employing Chlamydomonas reinhardtii CC503. Microb. Cell Factories 2017, 16, 146. [Google Scholar] [CrossRef] [PubMed]
- Wiese, M.; D’Agostino, P.M.; Mihali, T.K.; Moffitt, M.C.; Neilan, B.A. Neurotoxic alkaloids: Saxitoxin and its analogs. Mar. Drugs 2010, 8, 2185–2211. [Google Scholar] [CrossRef] [PubMed]
- Hwang, D.F.; Lu, Y.H. Influence of environmental and nutritional factors on growth, toxicity, and toxin profile of dinoflagellate Alexandrium minutum. Toxicon 2000, 38, 1491–1503. [Google Scholar] [CrossRef]
- Hui, G.; Jianting, Y.; Zhongmin, S.; Delin, D. Effects of salinity and nutrients on the growth and chlorophyll fluorescence of Caulerpa lentillifera. Chin. J. Oceanol. Limnol. 2015, 33, 410–418. [Google Scholar] [CrossRef]
- Boyer, G.L.; Sullivan, J.J.; Andersen, R.J.; Harrison, P.J.; Taylor, F.J.R. Effects of nutrient limitation on toxin production and composition in the marine dinoflagellate Protogonyaulax tamarensis. Mar. Boil. 1987, 96, 123–128. [Google Scholar] [CrossRef]
- Hamasaki, K.; Horie, M.; Tokimitsu, S.; Toda, T.; Taguchi, S. Variability in Toxicity of the Dinoflagellate Alexandrium Tamarense Isolated from Hiroshima Bay, Western Japan, as a Reflection of Changing Environmental Conditions. J. Plankton Res. 2001, 23, 271–278. [Google Scholar] [CrossRef]
- Wang, D.-Z.; Hsieh, D.P.H. Growth and toxin production in batch cultures of a marine dinoflagellate Alexandrium tamarense HK9301 isolated from the South China Sea. Harmful Algae 2005, 4, 401–410. [Google Scholar] [CrossRef]
- Anderson, D.M.; Kulis, D.M.; Sullivan, J.J.; Hall, S.; Lee, C. Dynamics and physiology of saxitoxin production by the dinoflagellates Alexandrium spp. Mar. Boil. 1990, 104, 511–524. [Google Scholar] [CrossRef]
- Dell’Aversano, C.; Hess, P.; Quilliam, M.A. Hydrophilic interaction liquid chromatography–mass spectrometry for the analysis of paralytic shellfish poisoning (PSP) toxins. J. Chromatogr. A 2005, 1081, 190–201. [Google Scholar] [CrossRef] [PubMed]
- Guéguen, M.; Baron, R.; Bardouil, M.; Truquet, P.; Haberkorn, H.; Lassus, P.; Barillé, L.; Amzil, Z. Modelling of paralytic shellfish toxin biotransformations in the course of Crassostrea gigas detoxification kinetics. Ecol. Model. 2011, 222, 3394–3402. [Google Scholar] [CrossRef]
- Brandsma, J.; Postle, A.D. Analysis of the regulation of surfactant phosphatidylcholine metabolism using stable isotopes. Ann. Anat. Anat. Anz. 2017, 211, 176–183. [Google Scholar] [CrossRef] [PubMed]
- Cho, Y.; Tsuchiya, S.; Omura, T.; Koike, K.; Oikawa, H.; Konoki, K.; Oshima, Y.; Yotsu-Yamashita, M. Metabolomic study of saxitoxin analogues and biosynthetic intermediates in dinoflagellates using (15)N-labelled sodium nitrate as a nitrogen source. Sci. Rep. 2019, 9, 3460. [Google Scholar] [CrossRef] [PubMed]
- Roelke, D.L.; Eldridge, P.M.; Cifuentes, L.A. A Model of Phytoplankton Competition for Limiting and Nonlimiting Nutrients: Implications for Development of Estuarine and Nearshore Management Schemes. Estuaries 1999, 22, 92–104. [Google Scholar] [CrossRef]
- Hii, K.S.; Lim, P.T.; Kon, N.F.; Takata, Y.; Usup, G.; Leaw, C.P. Physiological and transcriptional responses to inorganic nutrition in a tropical Pacific strain of Alexandrium minutum: Implications for the saxitoxin genes and toxin production. Harmful Algae 2016, 56, 9–21. [Google Scholar] [CrossRef] [PubMed]
- Lim, P.T.; Leaw, C.P.; Kobiyama, A.; Ogata, T. Growth and toxin production of tropical Alexandrium minutum Halim (Dinophyceae) under various nitrogen to phosphorus ratios. J. Appl. Phycol. 2010, 22, 203–210. [Google Scholar] [CrossRef]
- Sauer, M.L.A.; Xu, B.; Sutton, F. Metabolic labeling with stable isotope nitrogen ( 15 N) to follow amino acid and protein turnover of three plastid proteins in Chlamydomonas reinhardtii. Proteome Sci. 2014, 12, 1–9. [Google Scholar] [CrossRef]
- Chou, H.N.; Chen, Y.M.; Chen, C.Y. Variety of PSP toxins in four culture strains of Alexandrium minutum collected from southern Taiwan. Toxicon 2004, 43, 337–340. [Google Scholar] [CrossRef]
- Miao, Y.P.; Zhou, H.N.; Wen, R. Isolation and purification of gonyautoxins from Alexandrium mimutum Halim. Acta Pharm. Sin. 2004, 39, 52–55. [Google Scholar] [CrossRef]
- Laycock, M.V.; Thibault, P.; Ayer, S.W.; Walter, J.A. Isolation and purification procedures for the preparation of paralytic shellfish poisoning toxin standards. Neurogastroenterol. Motil. 2010, 2, 175–183. [Google Scholar] [CrossRef]
- AOAC. AOAC Official Method 959.08: Paralytic Shellfish Poison, Biological Method; AOAC: Arlington, VA, USA, 2000. [Google Scholar]
- Gerdts, G.; Hummert, C.; Donner, G.; Luckas, B.; Schütt, C. A fast fluorimetric assay (FFA) for the detection of saxitoxin in natural phytoplankton samples. Mar. Ecol. Prog. 2002, 230, 29–34. [Google Scholar] [CrossRef]
- Van De Riet, J.; Gibbs, R.S.; Muggah, P.M.; Rourke, W.A.; Macneil, J.D.; Quilliam, M.A. Liquid chromatography post-column oxidation (PCOX) method for the determination of paralytic shellfish toxins in mussels, clams, oysters, and scallops: Collaborative study. J. AOAC Int. 2011, 94, 1154–1176. [Google Scholar] [PubMed]
Figure 1.
The effects of 15N/P concentration on cell growth (a) and toxicity (b) in batch culture. (——, −−−−, ∙∙∙∙∙∙∙∙, −∙−·−∙ and −∙∙−∙∙−∙∙: Growth/Sigmoidal. Letters indicate significant differences between conditions).
Figure 1.
The effects of 15N/P concentration on cell growth (a) and toxicity (b) in batch culture. (——, −−−−, ∙∙∙∙∙∙∙∙, −∙−·−∙ and −∙∙−∙∙−∙∙: Growth/Sigmoidal. Letters indicate significant differences between conditions).

Figure 2.
Effects of 15N/P concentration on cell growth (a) and cell toxicity (b) in generation to generation culture.
Figure 2.
Effects of 15N/P concentration on cell growth (a) and cell toxicity (b) in generation to generation culture.

Figure 3.
The effects of 15N/P concentration on A. minutum PST profile.

Figure 4.
Gonyautoxin1-4 purified by column chromatography on the Bio-Gel P-2 (a) and the weak cation exchanger BioRex 70 (b).
Figure 4.
Gonyautoxin1-4 purified by column chromatography on the Bio-Gel P-2 (a) and the weak cation exchanger BioRex 70 (b).

Figure 5.
The molecular structural formula of GTX1-4.

Figure 6.
Mass spectrum of 15N-GTX1 (a), 15N-GTX4 (b), 15N-GTX2 (c) and 15N-GTX3 (d).


Table 1.
15N labeling abundance change of PSTs along with the change of culture time in different cultivation methods.
Table 1.
15N labeling abundance change of PSTs along with the change of culture time in different cultivation methods.
| Culture Method | 1.0 Time of the f/2 Medium Standard 15N/P Concentration | 1.5 Times of the f/2 Medium Standard 15N/P Concentration | |
|---|---|---|---|
| PSTs 15N Abundance (Atom%) | |||
| Batch culture/d | 0 | 0.47 | 0.47 |
| 20 | 26.26 | 26.43 | |
| 30 | 57.16 | 70.26 | |
| Generation to generation culture/generation | 1 | 37.60 | - |
| 2 | 58.32 | - | |
| 3 | 62.46 | - | |
| No. n generation | - | 82.36 | |
Table 2.
Mass spectral data for gonyautoxins (GTX1-4).
| Toxin | Molecular Formula | [M+H]+ | Fragment Ion | Loss of | Fragment Ion after Labeling |
|---|---|---|---|---|---|
| GTX1 | C10H17N7O9S | 412 | 332; 314 | -SO3; -SO3-H2O | 334.3; 318.3; 319.3 |
| GTX4 | C10H17N7O9S | 412 | 332; 314;253 | -SO3; -SO3-H2O; -SO3-H2O-NH3-CO2 | 318.3; 319.3; 338.3 |
| GTX2 | C10H17N7O8S | 396 | 316; 298 | -SO3; -SO3-H2O; | 322.1; 321.1; 305.1 |
| GTX3 | C10H17N7O8S | 396 | 316; 298; 220 | -SO3; -SO3-H2O; -SO3-2H2O-NH3-NHCO | 302.3; 303.3 |
Table 3.
f/2 medium amendments.
| Reagent | Working Solution (mg/L) | Stock Solution (g/L) | |
|---|---|---|---|
| A: | NaNO3 | 75 | 75 |
| B: | NaH2PO4·H2O | 5 | 5 |
| C: | Na2SiO3·9H2O | 20 | 20 |
| D: | Na2EDTA | 4.36 | 4.36 |
| E: | FeCl3·6H2O | 3.16 | 3.16 |
| F: | CuSO4·5H2O | 0.01 | 0.01 |
| ZnSO4·7H2O | 0.023 | 0.023 | |
| CoCL2·6H2O | 0.012 | 0.012 | |
| MnCL2·4H2O | 0.18 | 0.18 | |
| Na2MoO4·2H2O | 0.07 | 0.07 | |
| G: | Vitamin B1 | 0.1 | 0.01 |
| Vitamin B12 | 0.5 × 10⁻³ | 0.5 × 10⁻⁴ | |
| Vitamin H | 0.5 × 10⁻³ | 0.5 × 10⁻⁴ | |
© 2019 by the authors. Licensee MDPI, Basel, Switzerland. This article is an open access article distributed under the terms and conditions of the Creative Commons Attribution (CC BY) license (http://creativecommons.org/licenses/by/4.0/).
Share and Cite
MDPI and ACS Style
Xie, W.; Li, M.; Song, L.; Zhang, R.; Hu, X.; Liang, C.; Yang, X. 15N Stable Isotope Labeling PSTs in Alexandrium minutum for Application of PSTs as Biomarker. Toxins 2019, 11, 211. https://0-doi-org.brum.beds.ac.uk/10.3390/toxins11040211
AMA Style
Xie W, Li M, Song L, Zhang R, Hu X, Liang C, Yang X. 15N Stable Isotope Labeling PSTs in Alexandrium minutum for Application of PSTs as Biomarker. Toxins. 2019; 11(4):211. https://0-doi-org.brum.beds.ac.uk/10.3390/toxins11040211
Chicago/Turabian StyleXie, Wancui, Min Li, Lin Song, Rui Zhang, Xiaoqun Hu, Chengzhu Liang, and Xihong Yang. 2019. "15N Stable Isotope Labeling PSTs in Alexandrium minutum for Application of PSTs as Biomarker" Toxins 11, no. 4: 211. https://0-doi-org.brum.beds.ac.uk/10.3390/toxins11040211
Note that from the first issue of 2016, this journal uses article numbers instead of page numbers. See further details here.