Toxin B Variants from Clostridium difficile Strains VPI 10463 and NAP1/027 Share Similar Substrate Profile and Cellular Intoxication Kinetics but Use Different Host Cell Entry Factors

 , , and
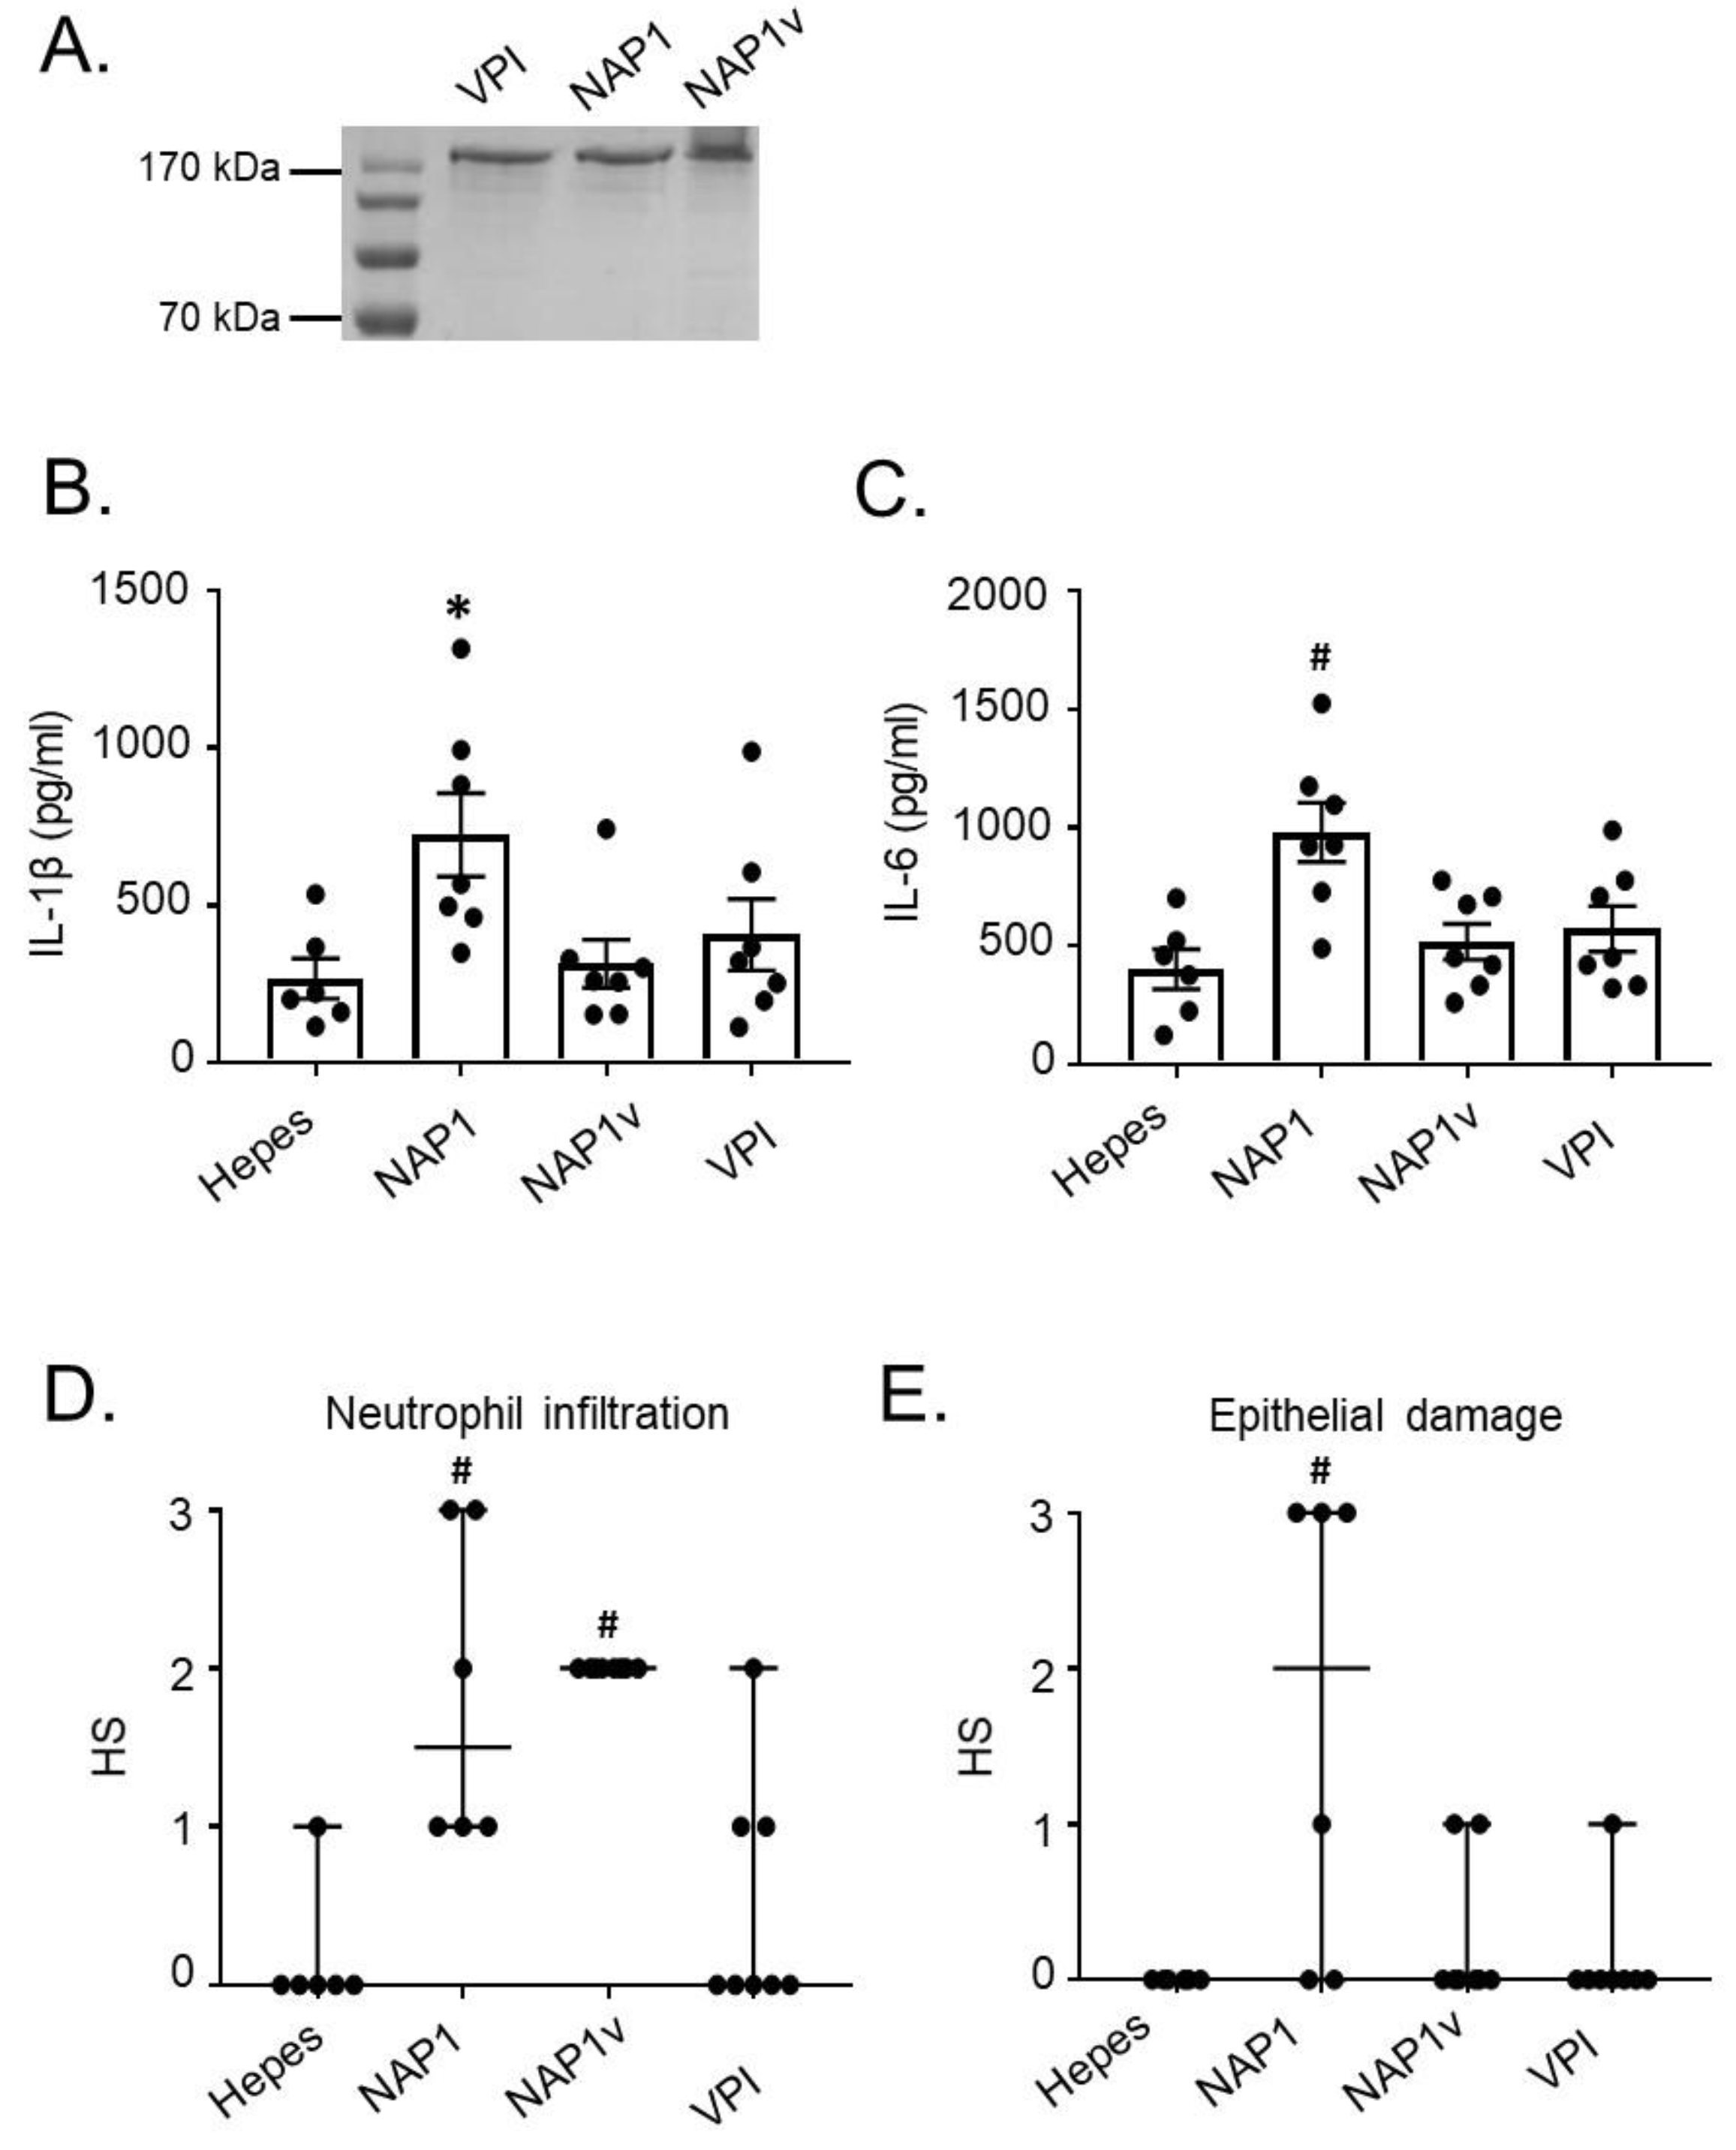
Abstract
:1. Introduction
2. Results
2.1. TcdBNAP1 Has an Increased Biological Activity in the Intestine
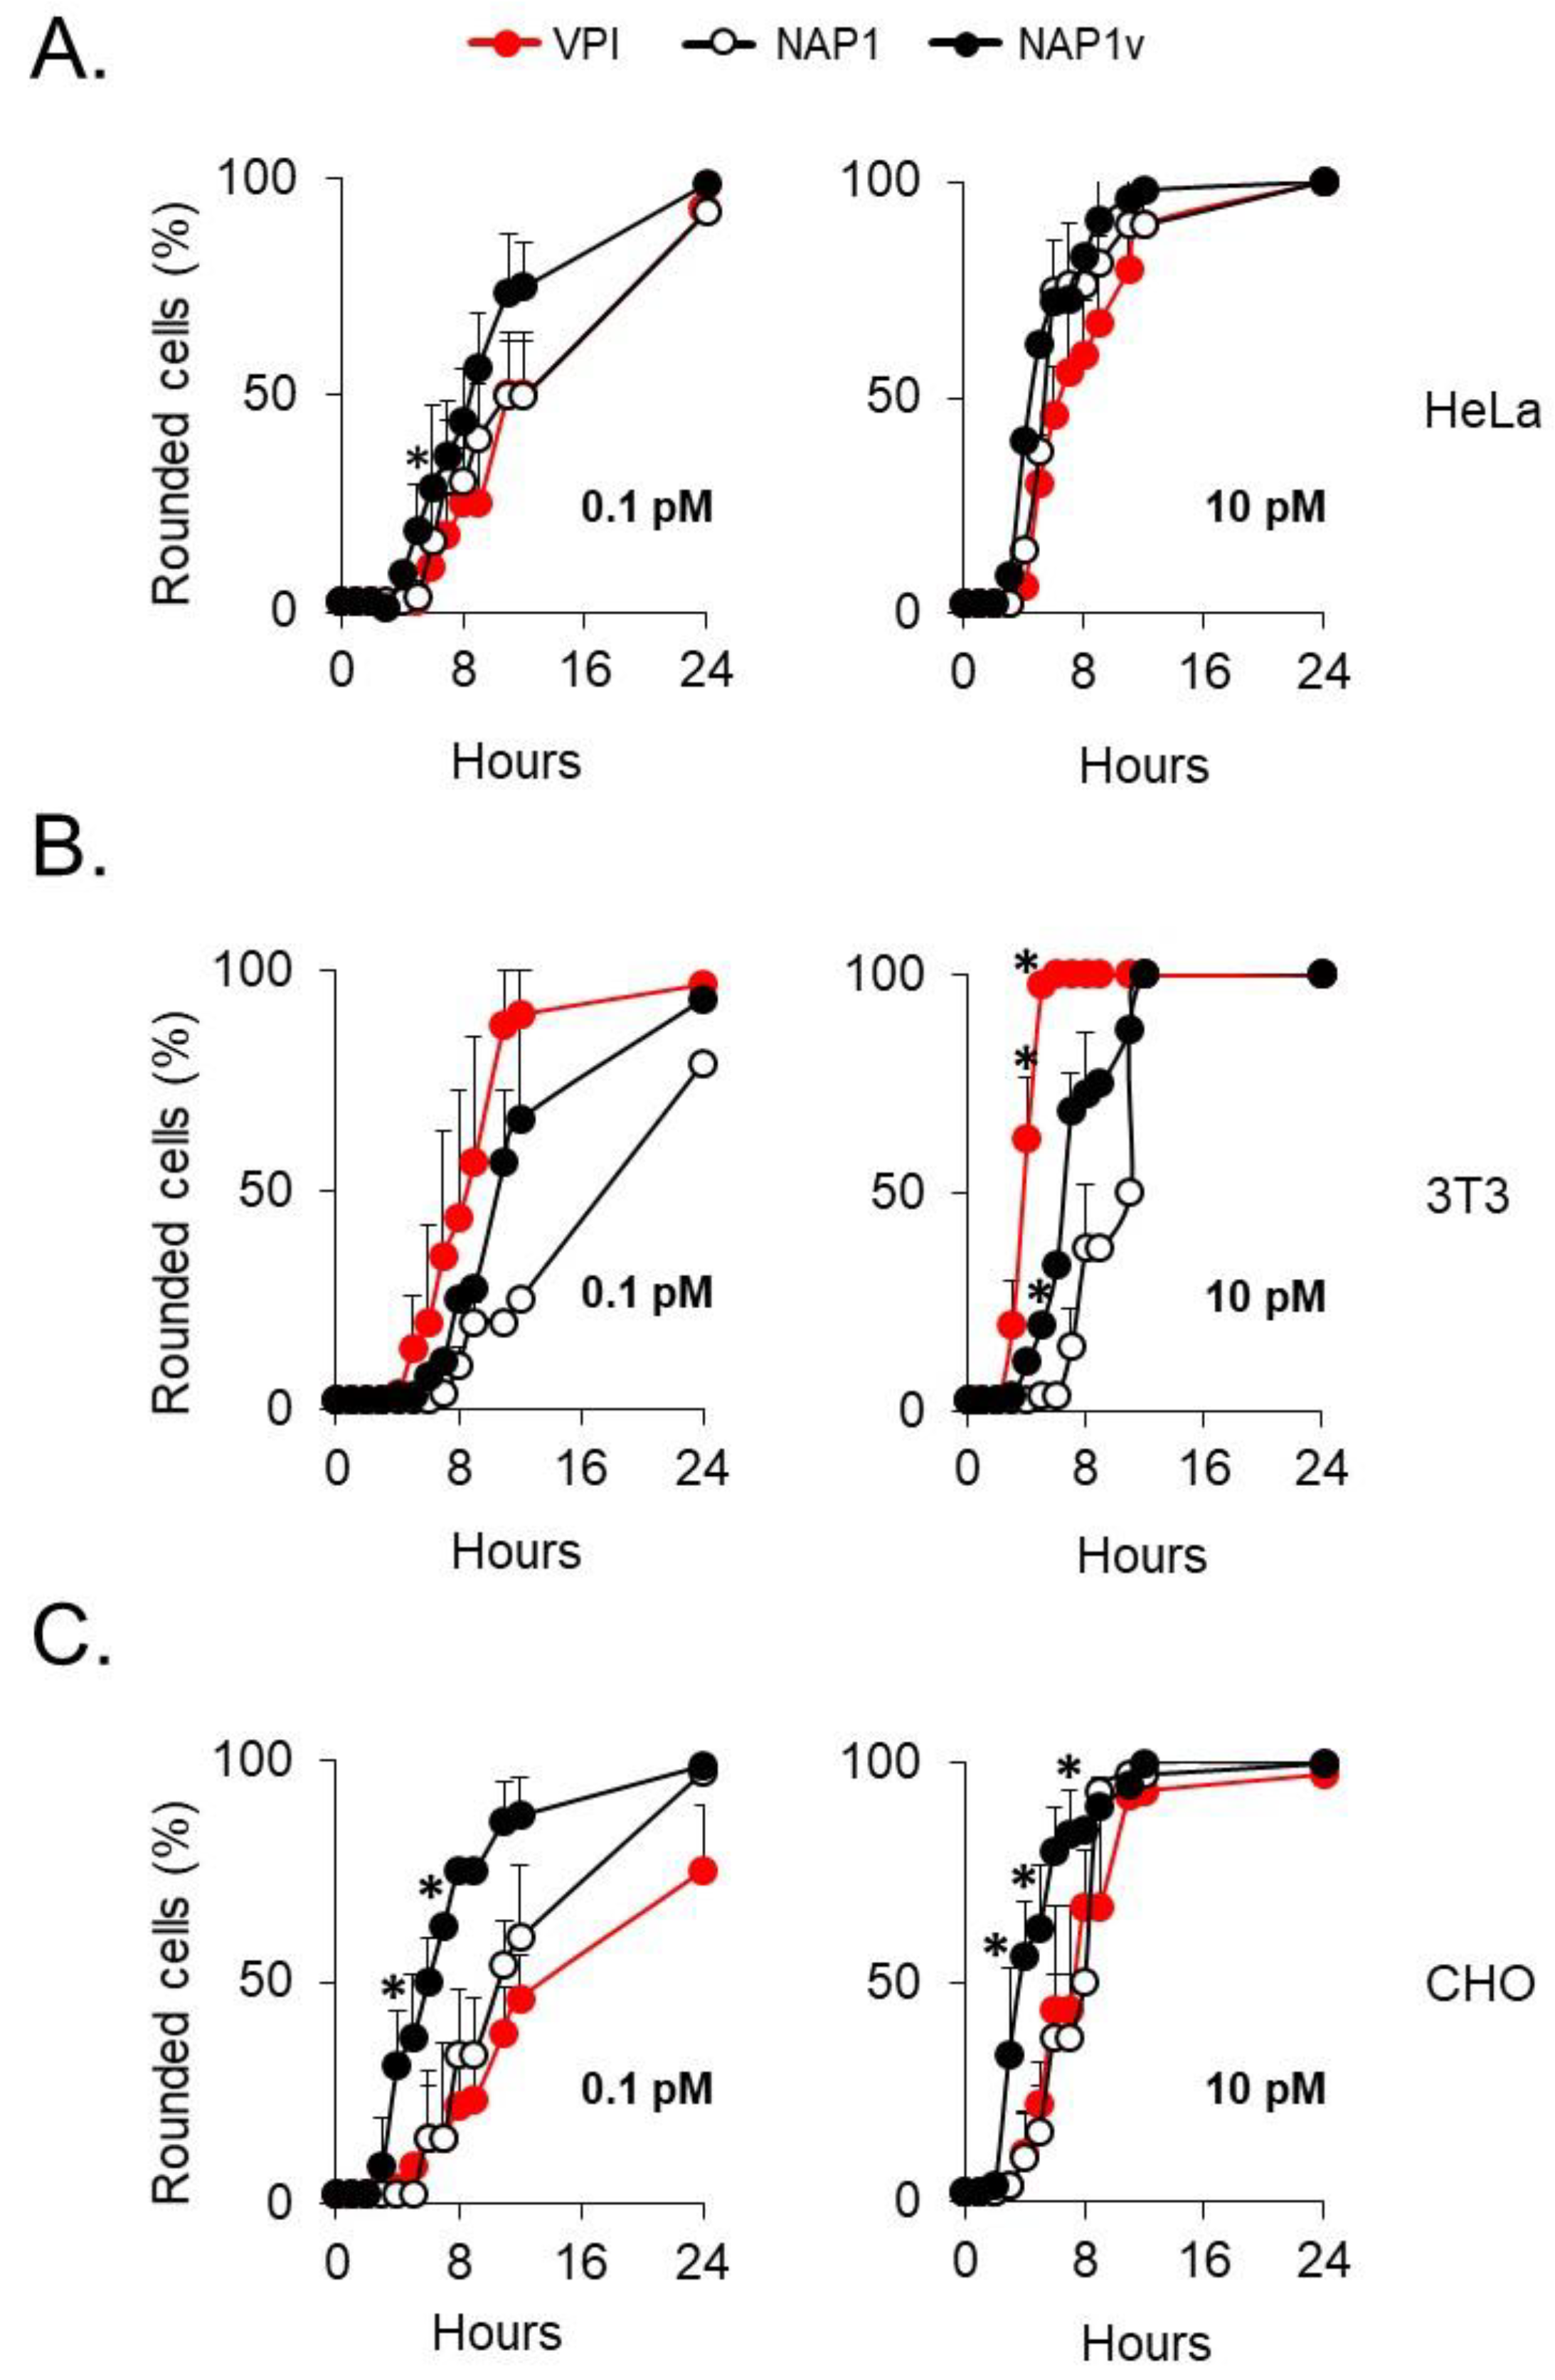
2.2. The Cytotoxic Potency of TcdBNAP1 Depends on the Cell Line Evaluated
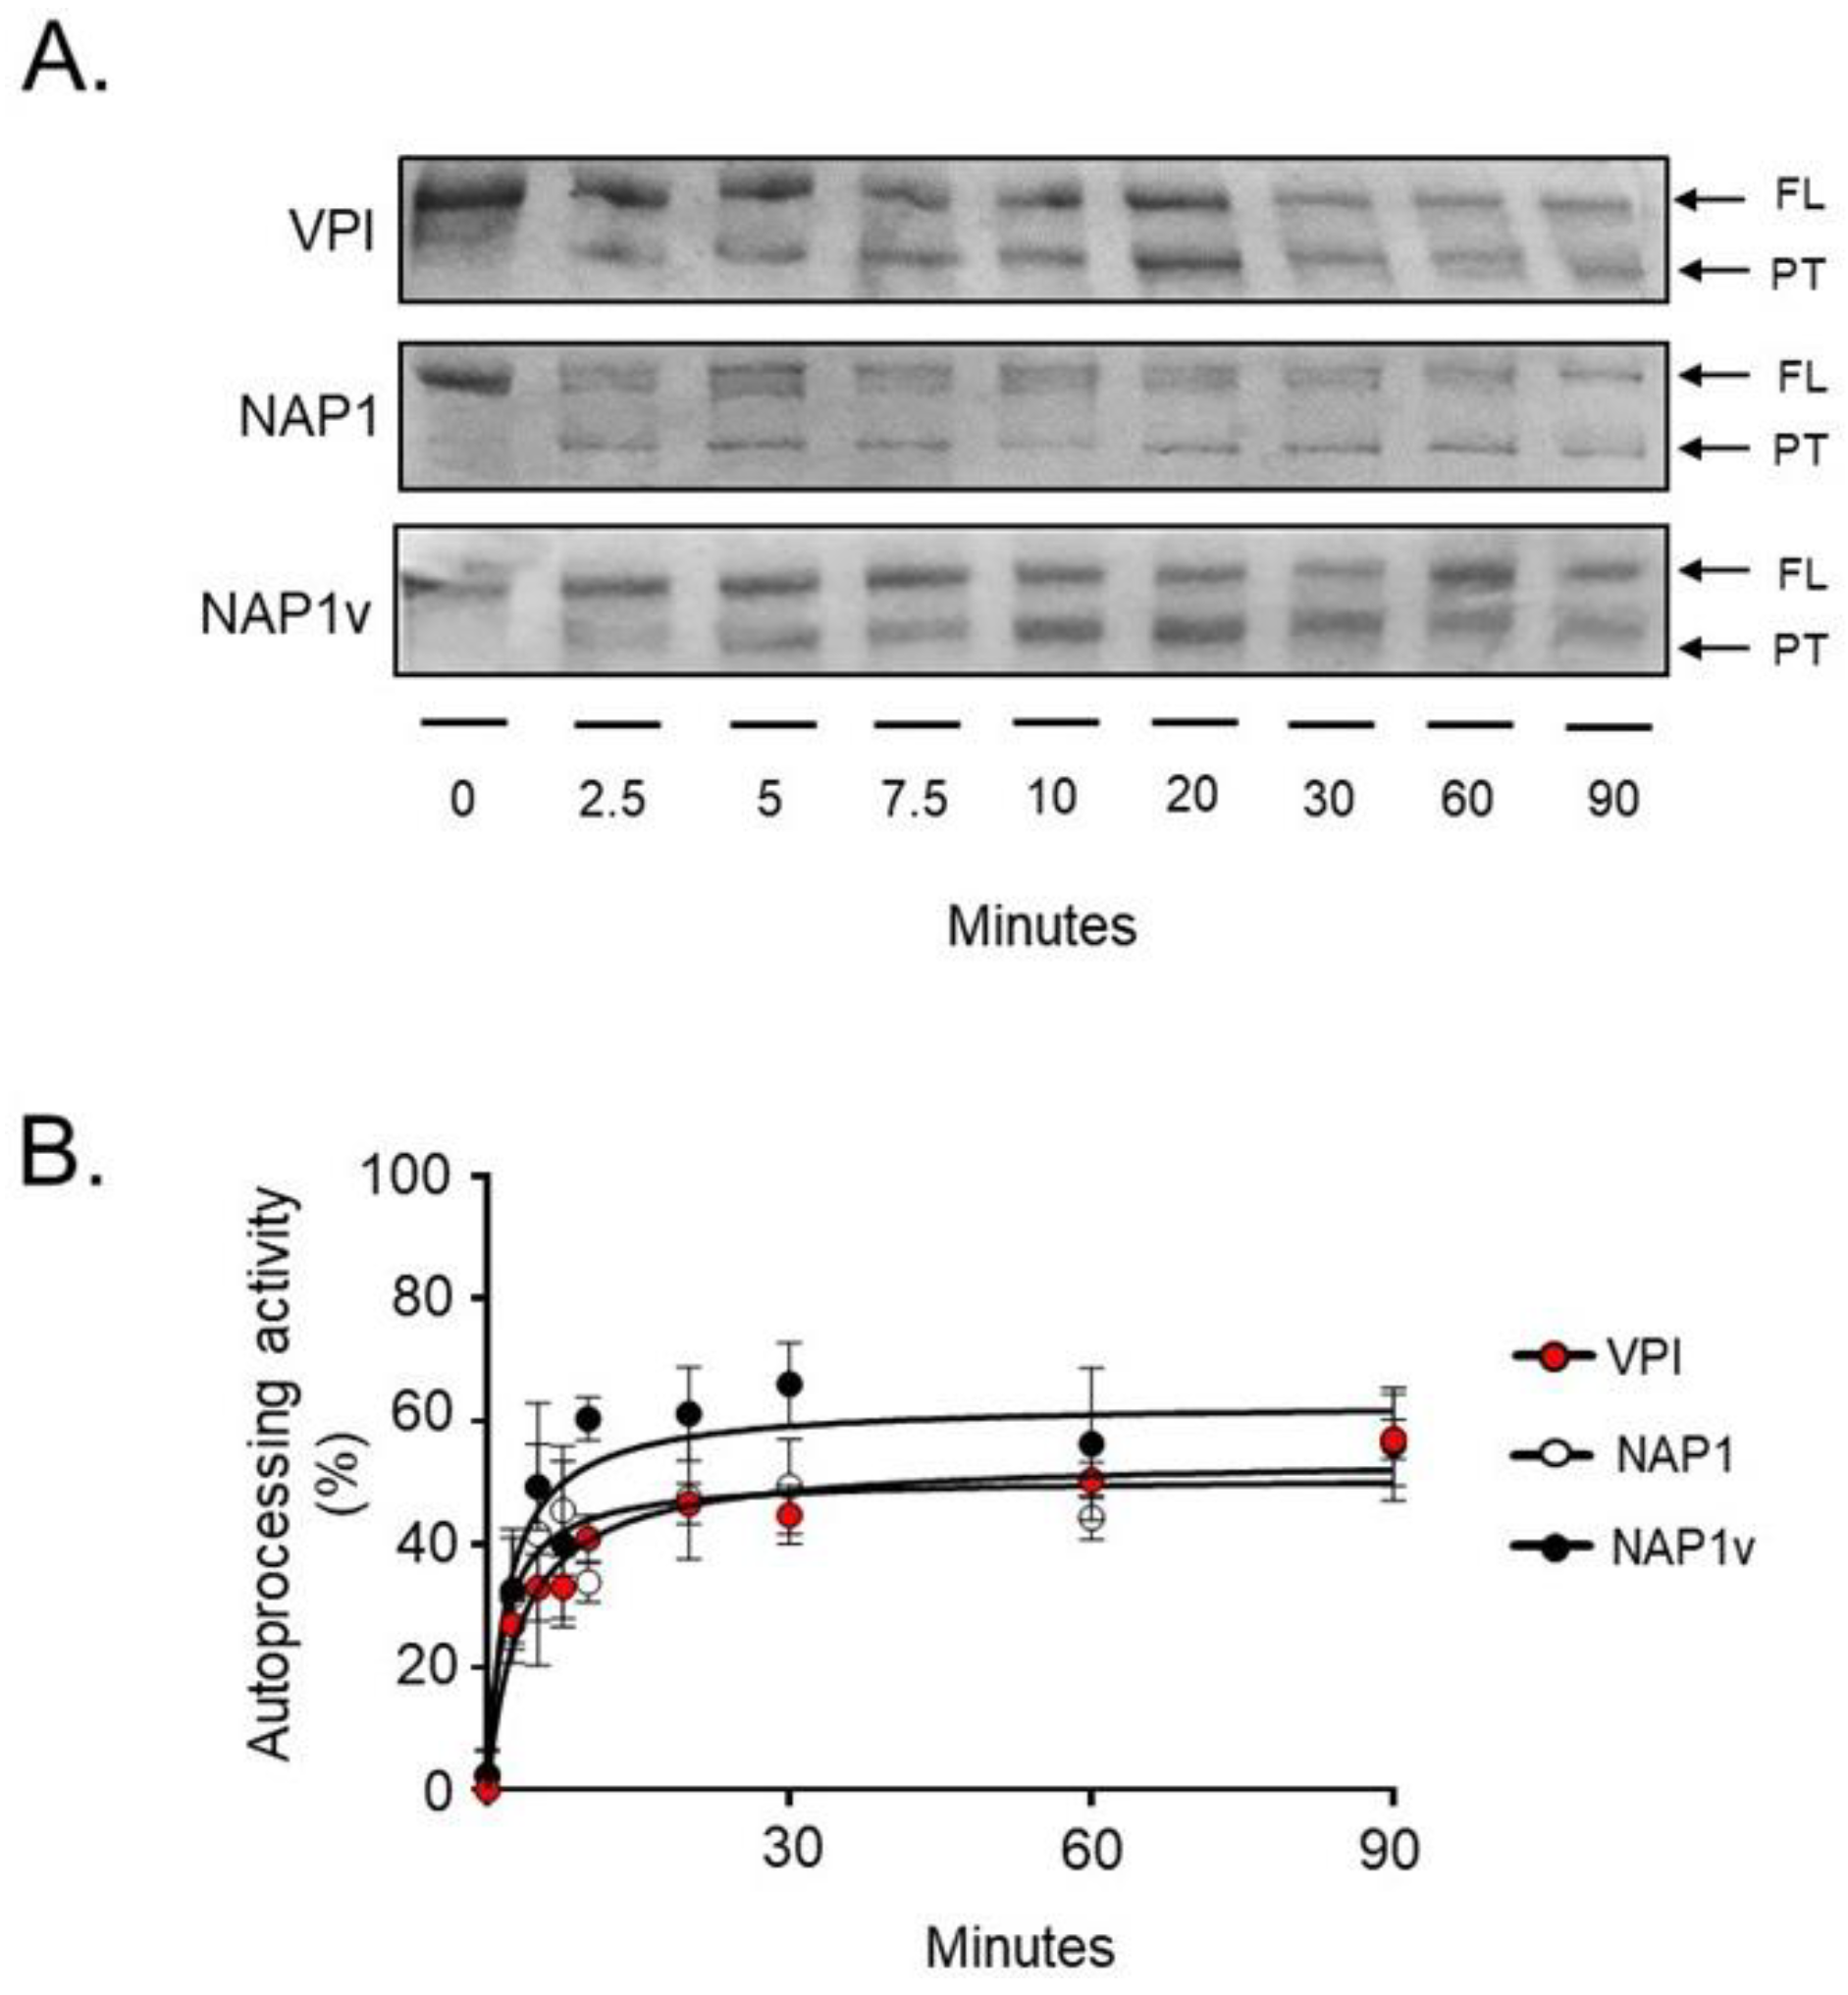
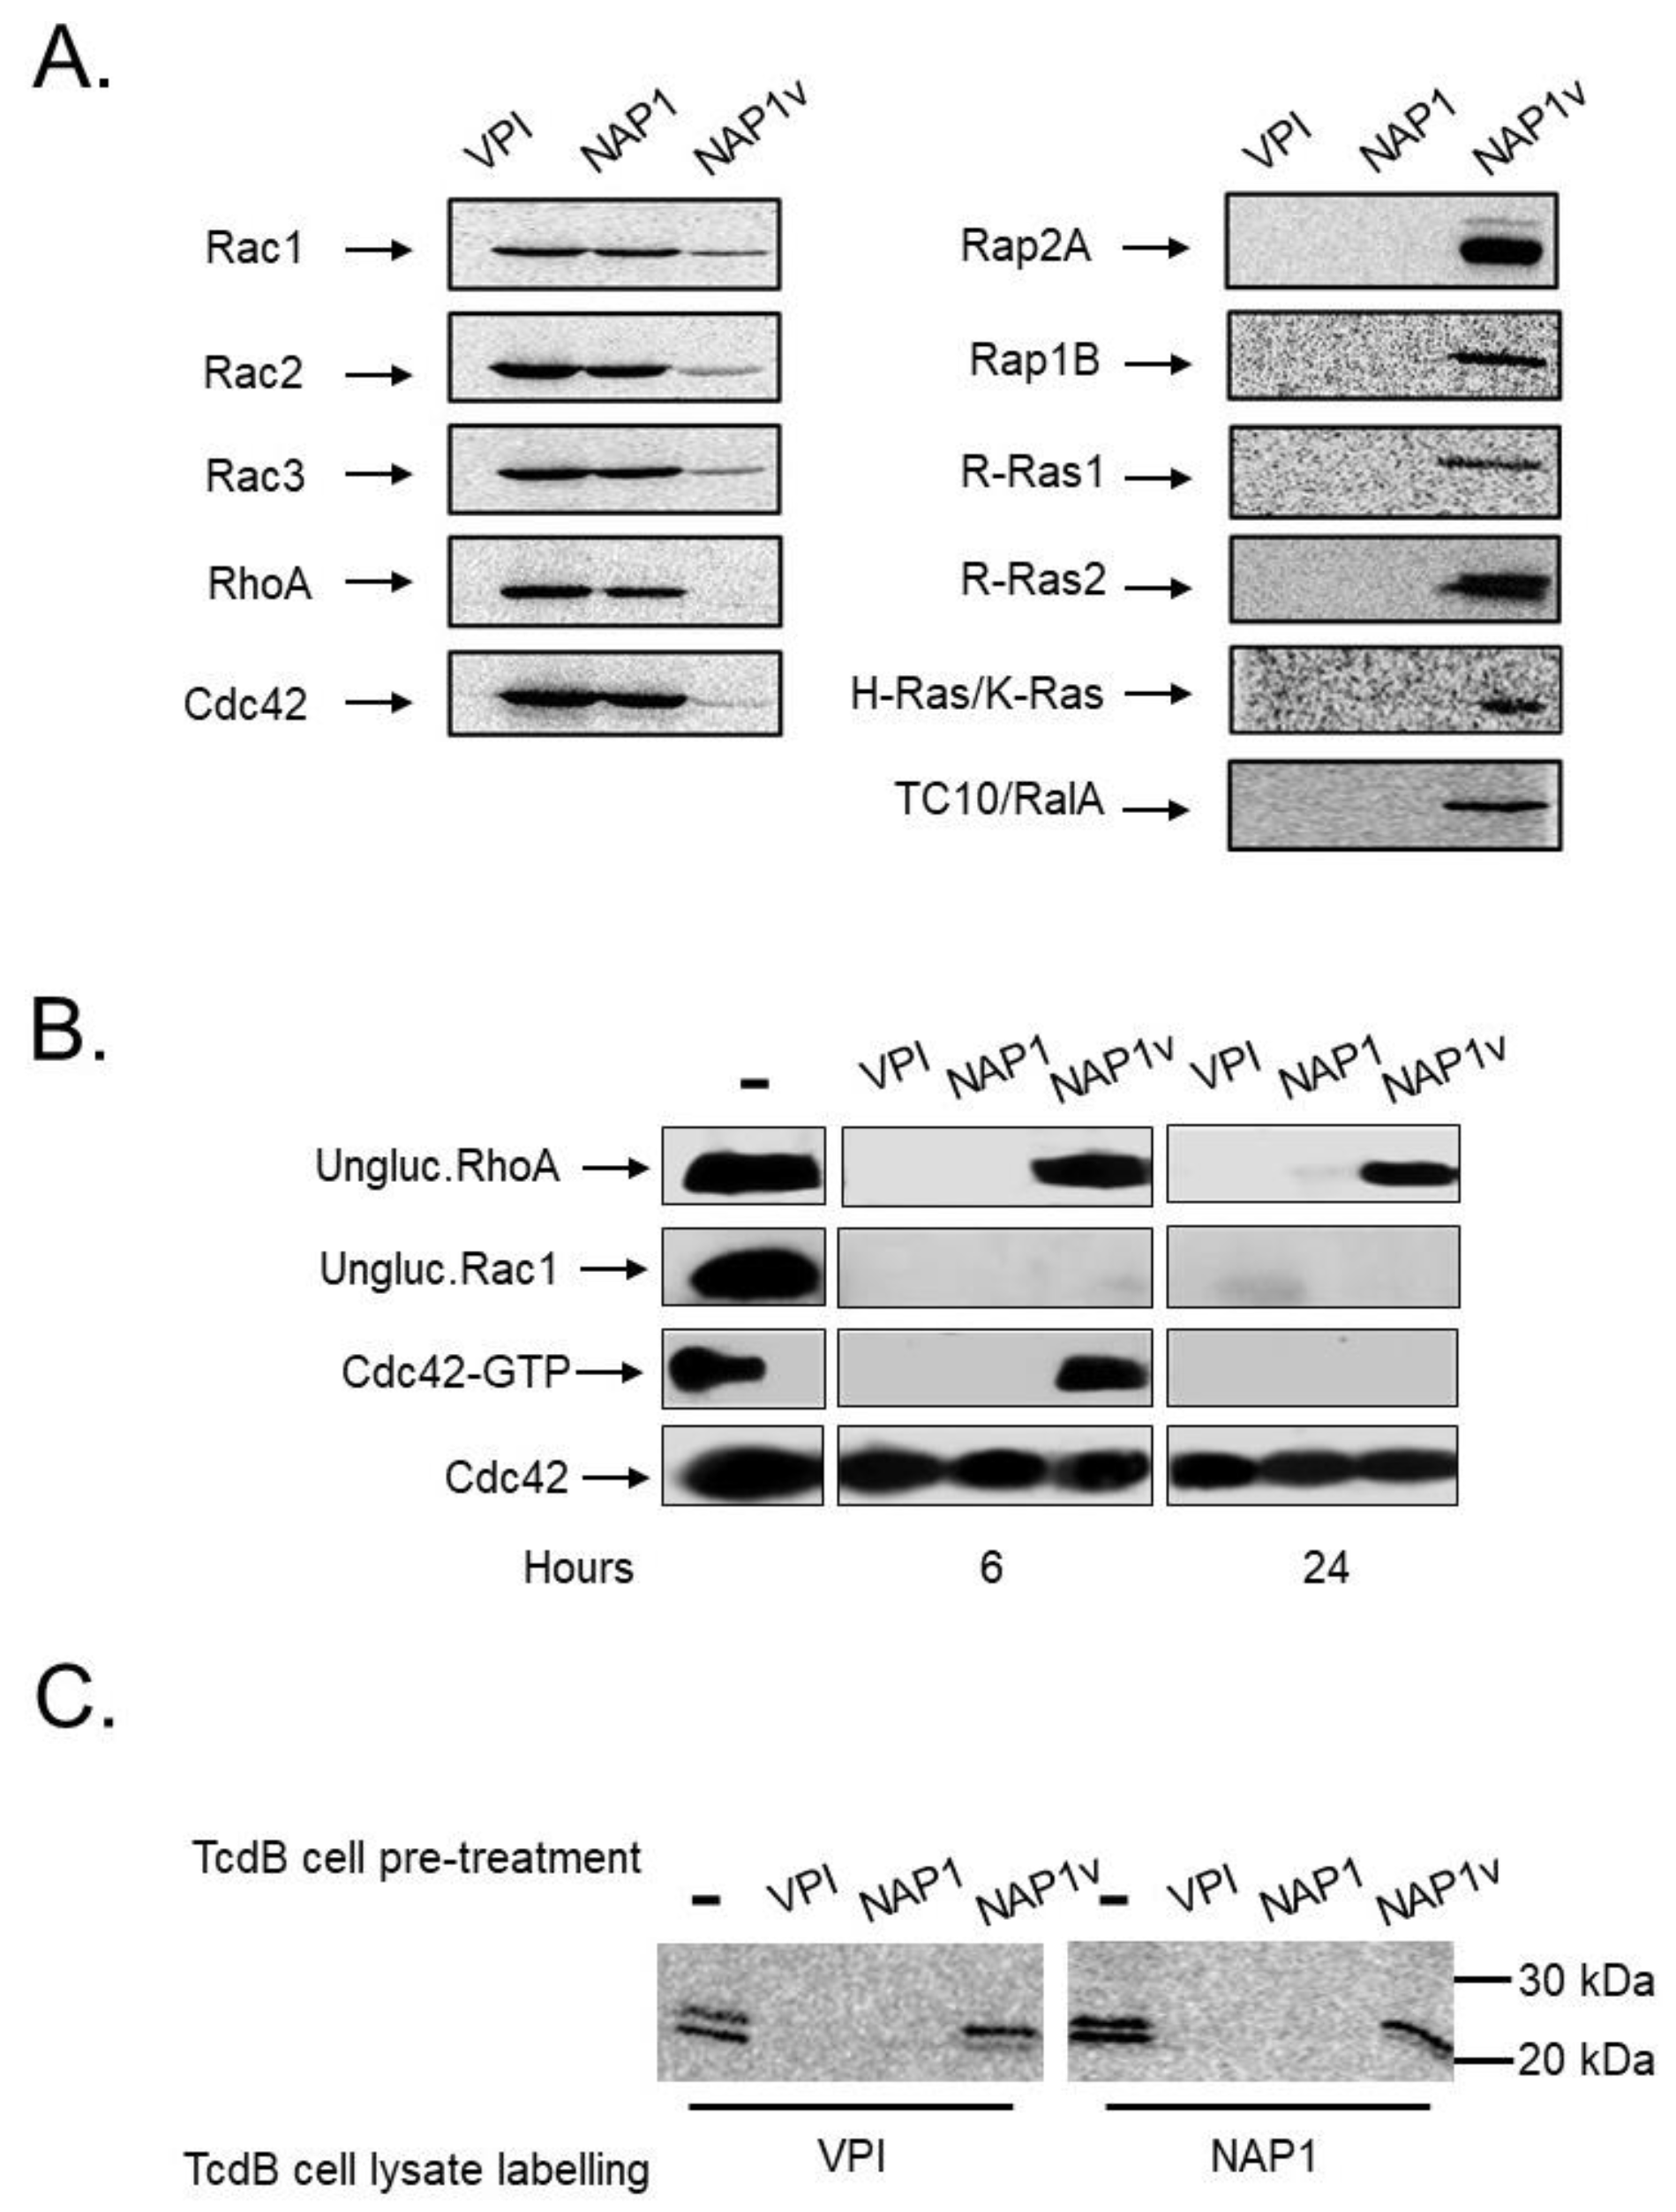
2.3. TcdBNAP1 and TcdBVPI Possess Similar Enzymatic Activities
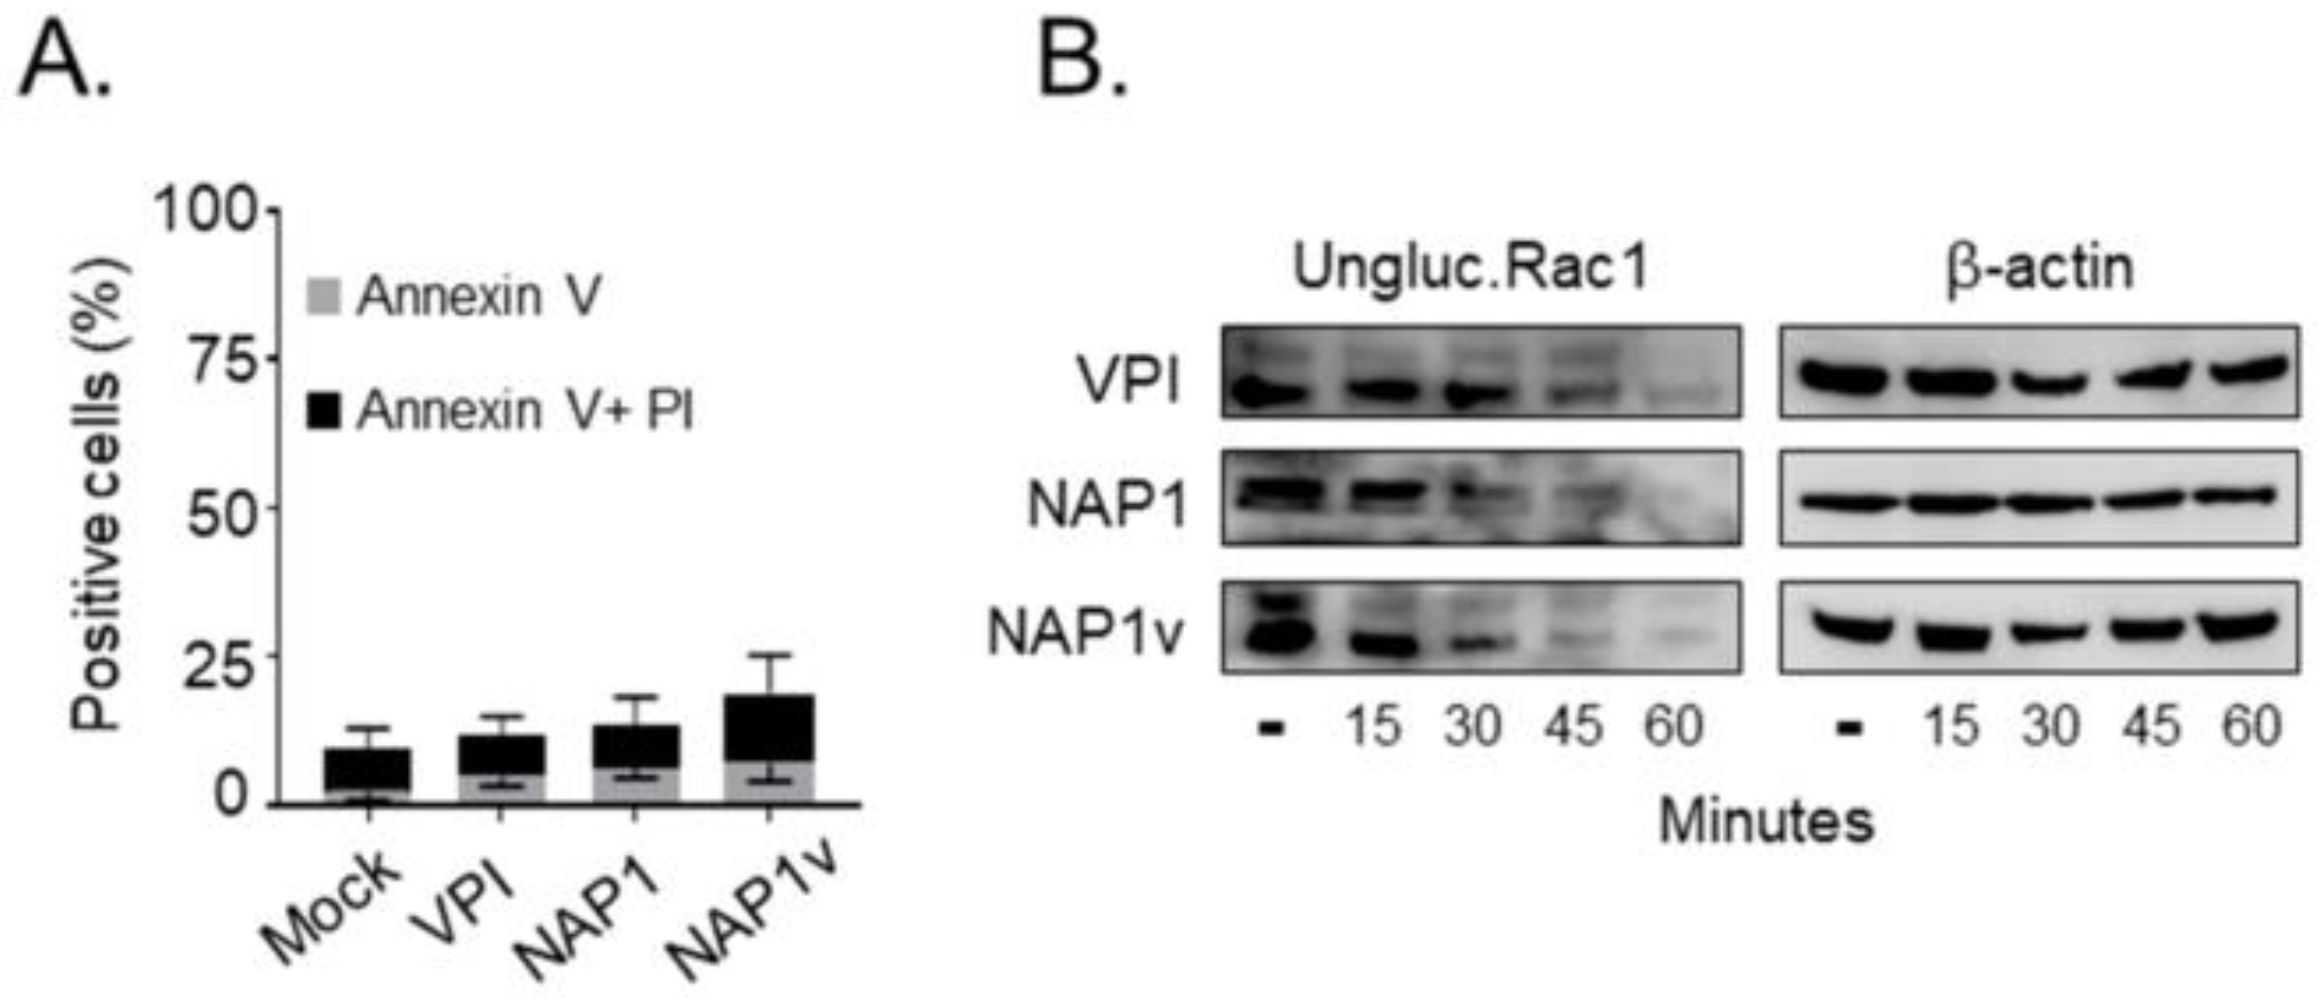
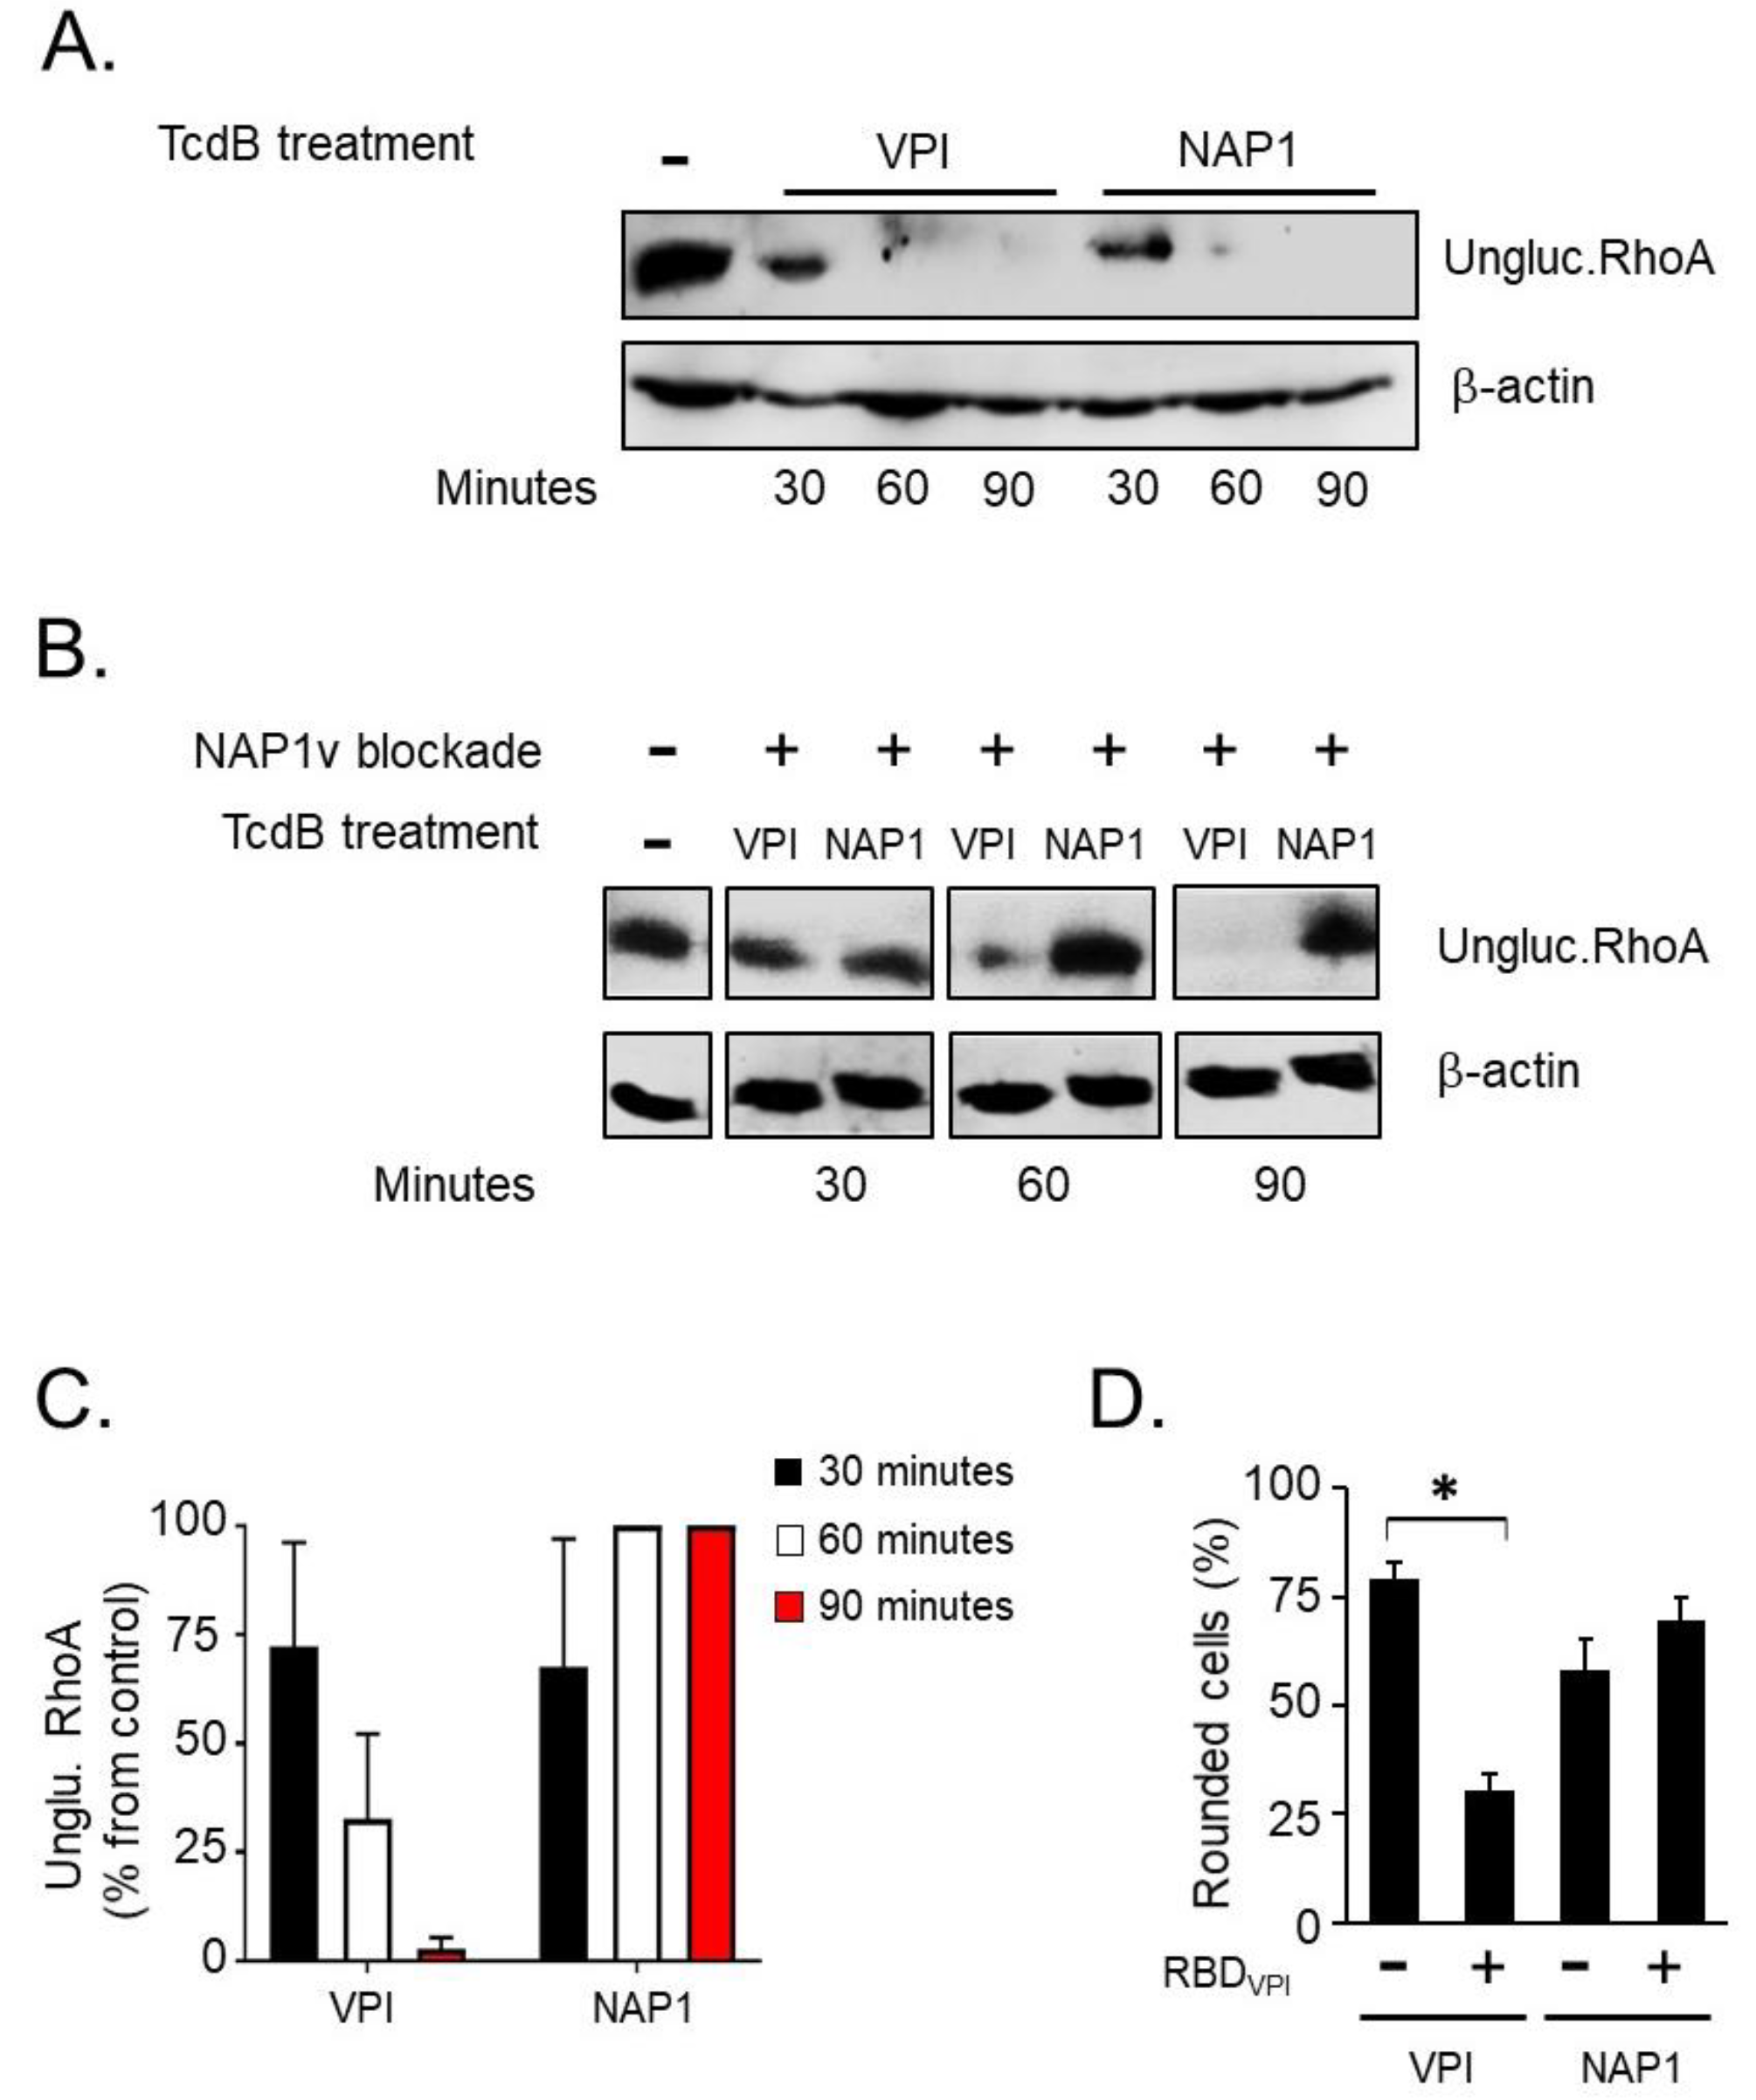
2.4. TcdBNAP1 and TcdBVPI Exploit Different Host Factors for Cell Entry
3. Discussion
4. Materials and Methods
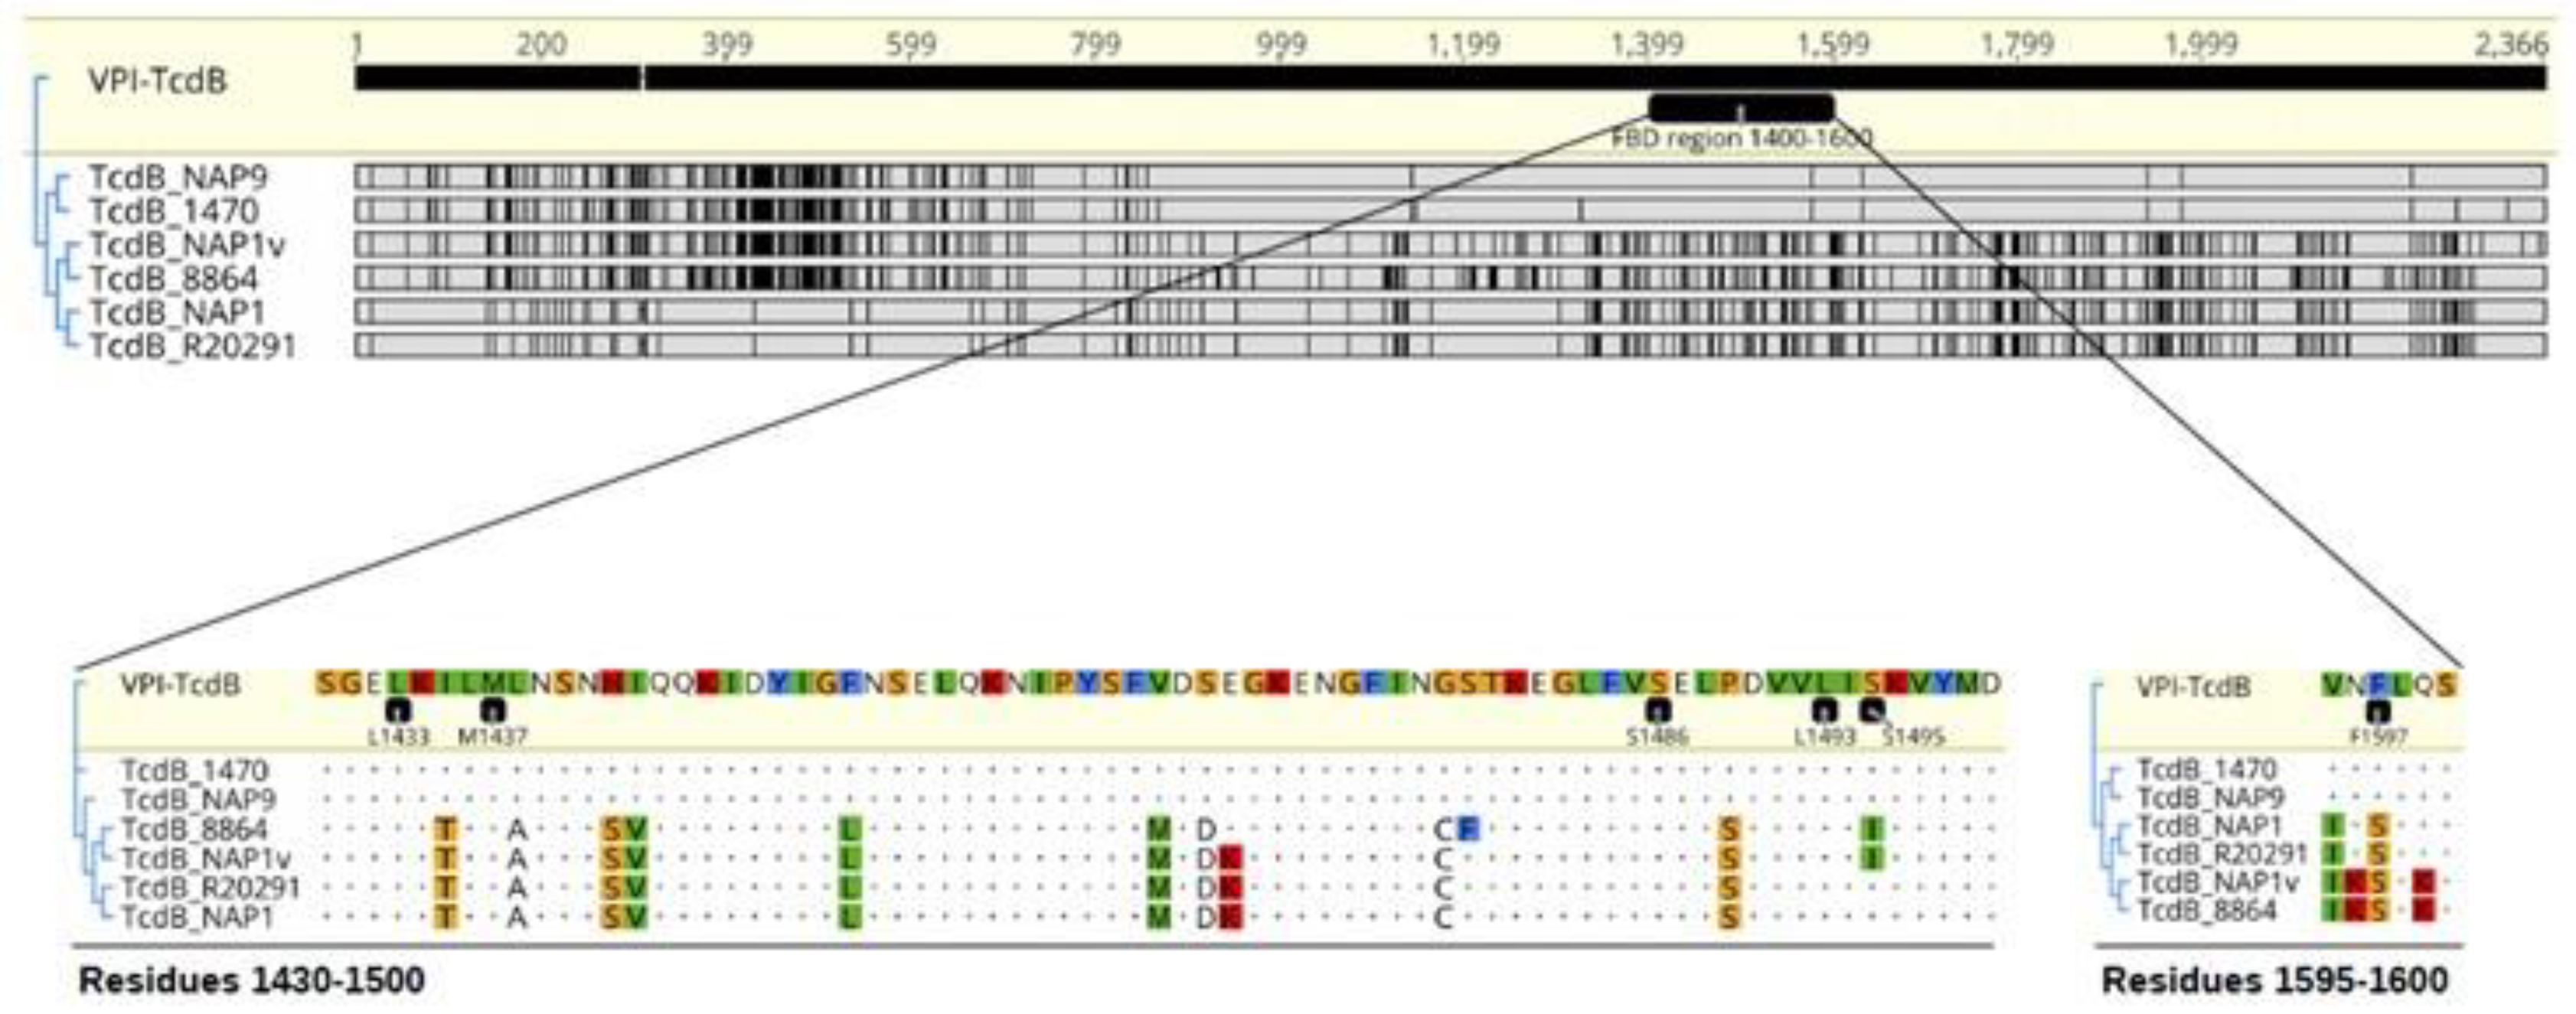
4.1. C. difficile Strains and TcdB Sequence Analysis
4.2. Native TcdB Purification and Recombinant Receptor Binding Domain Purification
4.3. Cultivation of Cells and Preparation of Cell Lysates
4.4. Murine Ileal Loop Model
4.5. Cytotoxicity Assays
4.6. Rac1 and RhoA Glucosylation
4.7. In Vitro Glucosyltranferase Activity of TcdBs
4.8. Ex vivo GTPase Activation Assay
4.9. In Vitro Cleavage Assay
4.10. Uptake Competition Assay
Author Contributions
Funding
Acknowledgments
Conflicts of Interest
References
- Voth, D.E.; Ballard, J.D. Clostridium difficile toxins: Mechanism of action and role in disease. Clin. Microbiol. Rev. 2005, 18, 247–263. [Google Scholar] [CrossRef] [PubMed]
- Carter, G.P.; Chakravorty, A.; Pham Nguyen, T.A.; Mileto, S.; Schreiber, F.; Li, L.; Howarth, P.; Clare, S.; Cunningham, B.; Sambol, S.P.; et al. Defining the roles of TcdA and TcdB in localized gastrointestinal disease, systemic organ damage, and the host response during Clostridium difficile Infections. mBio 2015, 6, e00551-15. [Google Scholar] [CrossRef] [PubMed]
- Lyras, D.; O’Connor, J.R.; Howarth, P.M.; Sambol, S.P.; Carter, G.P.; Phumoonna, T.; Poon, R.; Adams, V.; Vedantam, G.; Johnson, S.; et al. Toxin B is essential for virulence of Clostridium difficile. Nature 2009, 458, 1176–1179. [Google Scholar] [CrossRef] [PubMed]
- Jank, T.; Aktories, K. Structure and mode of action of clostridial glucosylating toxins: The ABCD model. Trends Microbiol. 2008, 16, 222–229. [Google Scholar] [CrossRef] [PubMed]
- LaFrance, M.E.; Farrow, M.A.; Chandrasekaran, R.; Sheng, J.; Rubin, D.H.; Lacy, D.B. Identification of an epithelial cell receptor responsible for Clostridium difficile TcdB-induced cytotoxicity. Proc. Natl. Acad. Sci. USA 2015, 112, 7073–7078. [Google Scholar] [CrossRef] [PubMed]
- Tao, L.; Zhang, J.; Meraner, P.; Tovaglieri, A.; Wu, X.; Gerhard, R.; Zhang, X.; Stallcup, W.B.; Miao, J.; He, X.; et al. Frizzled proteins are colonic epithelial receptors for C. difficile toxin B. Nature 2016, 538, 350–355. [Google Scholar] [CrossRef]
- Yuan, P.; Zhang, H.; Cai, C.; Zhu, S.; Zhou, Y.; Yang, X.; He, R.; Li, C.; Guo, S.; Li, S.; et al. Chondroitin sulfate proteoglycan 4 functions as the cellular receptor for Clostridium difficile toxin B. Cell Res. 2015, 25, 157–168. [Google Scholar] [CrossRef]
- Papatheodorou, P.; Zamboglou, C.; Genisyuerek, S.; Guttenberg, G.; Aktories, K. Clostridial glucosylating toxins enter cells via clathrin-mediated endocytosis. PLoS ONE 2010, 5, e10673. [Google Scholar] [CrossRef]
- Reineke, J.; Tenzer, S.; Rupnik, M.; Koschinski, A.; Hasselmayer, O.; Schrattenholz, A.; Schild, H.; von Eichel-Streiber, C. Autocatalytic cleavage of Clostridium difficile toxin B. Nature 2007, 446, 415–419. [Google Scholar] [CrossRef]
- Jose, S.; Madan, R. Neutrophil-mediated inflammation in the pathogenesis of Clostridium difficile infections. Anaerobe 2016, 41, 85–90. [Google Scholar] [CrossRef]
- Xu, H.; Yang, J.; Gao, W.; Li, L.; Li, P.; Zhang, L.; Gong, Y.-N.; Peng, X.; Xi, J.J.; Chen, S.; et al. Innate immune sensing of bacterial modifications of Rho GTPases by the pyrin inflammasome. Nature 2014, 513, 237–241. [Google Scholar] [CrossRef] [PubMed]
- Dingle, K.E.; Griffiths, D.; Didelot, X.; Evans, J.; Vaughan, A.; Kachrimanidou, M.; Stoesser, N.; Jolley, K.A.; Golubchik, T.; Harding, R.M.; et al. Clinical Clostridium difficile: Clonality and pathogenicity locus diversity. PLoS ONE 2011, 6, e19993. [Google Scholar] [CrossRef] [PubMed]
- Knight, D.R.; Elliott, B.; Chang, B.J.; Perkins, T.T.; Riley, T.V. Diversity and evolution in the genome of Clostridium difficile. Clin. Microbiol. Rev. 2015, 28, 721–741. [Google Scholar] [CrossRef]
- He, M.; Miyajima, F.; Roberts, P.; Ellison, L.; Pickard, D.J.; Martin, M.J.; Connor, T.R.; Harris, S.R.; Fairley, D.; Bamford, K.B.; et al. Emergence and global spread of epidemic healthcare-associated Clostridium difficile. Nat. Genet. 2013, 45, 109–113. [Google Scholar] [CrossRef] [PubMed]
- Lopez-Urena, D.; Quesada-Gomez, C.; Miranda, E.; Fonseca, M.; Rodriguez-Cavallini, E. Spread of epidemic Clostridium difficile NAP1/027 in Latin America: Case reports in Panama. J. Med. Microbiol. 2014, 63, 322–324. [Google Scholar] [CrossRef]
- Sebaihia, M.; Wren, B.W.; Mullany, P.; Fairweather, N.F.; Minton, N.; Stabler, R.; Thomson, N.R.; Roberts, A.P.; Cerdeño-Tárraga, A.M.; Wang, H.; et al. The multidrug-resistant human pathogen Clostridium difficile has a highly mobile, mosaic genome. Nat. Genet. 2006, 38, 779–786. [Google Scholar] [CrossRef]
- Stabler, R.A.; Dawson, L.F.; Phua, L.T.H.; Wren, B.W. Comparative analysis of BI/NAP1/027 hypervirulent strains reveals novel toxin B-encoding gene (tcdB) sequences. J. Med. Microbiol. 2008, 57, 771–775. [Google Scholar] [CrossRef]
- Akerlund, T.; Persson, I.; Unemo, M.; Noren, T.; Svenungsson, B.; Wullt, M.; Burman, L.G. Increased sporulation rate of epidemic Clostridium difficile type 027/NAP1. J. Clin. Microbiol. 2008, 46, 1530–1533. [Google Scholar] [CrossRef]
- Lanis, J.M.; Barua, S.; Ballard, J.D. Variations in TcdB activity and the hypervirulence of emerging strains of Clostridium difficile. PLoS Pathog. 2010, 6, e1001061. [Google Scholar] [CrossRef]
- Matamouros, S.; England, P.; Dupuy, B. Clostridium difficile toxin expression is inhibited by the novel regulator TcdC: TcdC inhibits C. difficile toxin expression. Mol. Microbiol. 2007, 64, 1274–1288. [Google Scholar] [CrossRef]
- Warny, M.; Pepin, J.; Fang, A.; Killgore, G.; Thompson, A.; Brazier, J.; Frost, E.; McDonald, L.C. Toxin production by an emerging strain of Clostridium difficile associated with outbreaks of severe disease in North America and Europe. Lancet 2005, 366, 1079–1084. [Google Scholar] [CrossRef]
- Quesada-Gómez, C.; López-Ureña, D.; Chumbler, N.; Kroh, H.K.; Castro-Peña, C.; Rodríguez, C.; Orozco-Aguilar, J.; González-Camacho, S.; Rucavado, A.; Guzmán-Verri, C.; et al. Analysis of TcdB proteins within the hypervirulent Clade 2 reveals an Impact of RhoA glucosylation on Clostridium difficile proinflammatory activities. Infect. Immun. 2016, 84, 856–865. [Google Scholar] [CrossRef] [PubMed]
- Pruitt, R.N.; Chambers, M.G.; Ng, K.K.-S.; Ohi, M.D.; Lacy, D.B. Structural organization of the functional domains of Clostridium difficile toxins A and B. Proc. Natl. Acad. Sci. USA 2010, 107, 13467–13472. [Google Scholar] [CrossRef] [PubMed]
- Genisyuerek, S.; Papatheodorou, P.; Guttenberg, G.; Schubert, R.; Benz, R.; Aktories, K. Structural determinants for membrane insertion, pore formation and translocation of Clostridium difficile toxin B: Pore formation of C. difficile toxin B. Mol. Microbiol. 2011, 79, 1643–1654. [Google Scholar] [CrossRef]
- Chen, P.; Tao, L.; Wang, T.; Zhang, J.; He, A.; Lam, K.; Liu, Z.; He, X.; Perry, K.; Dong, M.; et al. Structural basis for recognition of frizzled proteins by Clostridium difficile toxin B. Science 2018, 360, 664–669. [Google Scholar] [CrossRef] [PubMed]
- Schorch, B.; Song, S.; van Diemen, F.R.; Bock, H.H.; May, P.; Herz, J.; Brummelkamp, T.R.; Papatheodorou, P.; Aktories, K. LRP1 is a receptor for Clostridium perfringens TpeL toxin indicating a two-receptor model of clostridial glycosylating toxins. Proc. Natl. Acad. Sci. USA 2014, 111, 6431–6436. [Google Scholar] [CrossRef] [PubMed]
- Stabler, R.A.; He, M.; Dawson, L.; Martin, M.; Valiente, E.; Corton, C.; Lawley, T.D.; Sebaihia, M.; Quail, M.A.; Rose, G.; et al. Comparative genome and phenotypic analysis of Clostridium difficile 027 strains provides insight into the evolution of a hypervirulent bacterium. Genome Biol. 2009, 10, R102. [Google Scholar] [CrossRef] [PubMed]
- Lanis, J.M.; Heinlen, L.D.; James, J.A.; Ballard, J.D. Clostridium difficile 027/BI/NAP1 encodes a hypertoxic and antigenically variable form of TcdB. PLoS Pathog. 2013, 9, e1003523. [Google Scholar] [CrossRef] [PubMed]
- Lanis, J.M.; Hightower, L.D.; Shen, A.; Ballard, J.D. TcdB from hypervirulent Clostridium difficile exhibits increased efficiency of autoprocessing: Autoproteolysis of TcdBHIST and TcdBHV. Mol. Microbiol. 2012, 84, 66–76. [Google Scholar] [CrossRef] [PubMed]
- Merrigan, M.; Venugopal, A.; Mallozzi, M.; Roxas, B.; Viswanathan, V.K.; Johnson, S.; Gerding, D.N.; Vedantam, G. Human hypervirulent Clostridium difficile strains exhibit increased sporulation as well as robust toxin production. J. Bacteriol. 2010, 192, 4904–4911. [Google Scholar] [CrossRef]
- Papatheodorou, P.; Song, S.; López-Ureña, D.; Witte, A.; Marques, F.; Ost, G.S.; Schorch, B.; Chaves-Olarte, E.; Aktories, K. Cytotoxicity of Clostridium difficile toxins A and B requires an active and functional SREBP-2 pathway. FASEB J. 2018, 33, 4883–4892. [Google Scholar] [CrossRef] [PubMed]
- Manse, J.S.; Baldwin, M.R. Binding and entry of Clostridium difficile toxin B is mediated by multiple domains. FEBS Lett. 2015, 589, 3945–3951. [Google Scholar] [CrossRef] [PubMed]
- Chung, S.-Y.; Schöttelndreier, D.; Tatge, H.; Fühner, V.; Hust, M.; Beer, L.-A.; Gerhard, R. The conserved Cys-2232 in Clostridioides difficile toxin B modulates receptor binding. Front. Microbiol. 2018, 9, 2314. [Google Scholar] [CrossRef] [PubMed]
- Larabee, J.L.; Krumholz, A.; Hunt, J.J.; Lanis, J.M.; Ballard, J.D. Exposure of neutralizing epitopes in the carboxyl-terminal domain of TcdB Is altered by a proximal hypervariable region. J. Biol. Chem. 2015, 290, 6975–6985. [Google Scholar] [CrossRef] [PubMed]
- Hunt, J.J.; Larabee, J.L.; Ballard, J.D. Amino acid differences in the 1753-to-1851 region of TcdB influence variations in TcdB1 and TcdB2 cell entry. mSphere 2017, 2, e00268-17. [Google Scholar] [CrossRef] [PubMed]
- Larabee, J.L.; Bland, S.J.; Hunt, J.J.; Ballard, J.D. Intrinsic toxin-derived peptides destabilize and inactivate Clostridium difficile TcdB. mBio 2017, 8, e00503-17. [Google Scholar] [CrossRef] [PubMed]
- Quesada-Gomez, C.; Rodriguez, C.; del Mar Gamboa-Coronado, M.; Rodriguez-Cavallini, E.; Du, T.; Mulvey, M.R.; Villalobos-Zuniga, M.; Boza-Cordero, R. Emergence of Clostridium difficile NAP1 in Latin America. J. Clin. Microbiol. 2010, 48, 669–670. [Google Scholar] [CrossRef] [PubMed]
- Quesada-Gómez, C.; López-Ureña, D.; Acuña-Amador, L.; Villalobos-Zúñiga, M.; Du, T.; Freire, R.; Guzmán-Verri, C.; del Mar Gamboa-Coronado, M.; Lawley, T.D.; Moreno, E.; et al. Emergence of an outbreak-associated Clostridium difficile variant with increased virulence. J. Clin. Microbiol. 2015, 53, 1216–1226. [Google Scholar] [CrossRef] [PubMed]


© 2019 by the authors. Licensee MDPI, Basel, Switzerland. This article is an open access article distributed under the terms and conditions of the Creative Commons Attribution (CC BY) license (http://creativecommons.org/licenses/by/4.0/).
Share and Cite
López-Ureña, D.; Orozco-Aguilar, J.; Chaves-Madrigal, Y.; Ramírez-Mata, A.; Villalobos-Jimenez, A.; Ost, S.; Quesada-Gómez, C.; Rodríguez, C.; Papatheodorou, P.; Chaves-Olarte, E. Toxin B Variants from Clostridium difficile Strains VPI 10463 and NAP1/027 Share Similar Substrate Profile and Cellular Intoxication Kinetics but Use Different Host Cell Entry Factors. Toxins 2019, 11, 348. https://0-doi-org.brum.beds.ac.uk/10.3390/toxins11060348
López-Ureña D, Orozco-Aguilar J, Chaves-Madrigal Y, Ramírez-Mata A, Villalobos-Jimenez A, Ost S, Quesada-Gómez C, Rodríguez C, Papatheodorou P, Chaves-Olarte E. Toxin B Variants from Clostridium difficile Strains VPI 10463 and NAP1/027 Share Similar Substrate Profile and Cellular Intoxication Kinetics but Use Different Host Cell Entry Factors. Toxins. 2019; 11(6):348. https://0-doi-org.brum.beds.ac.uk/10.3390/toxins11060348
Chicago/Turabian StyleLópez-Ureña, Diana, Josué Orozco-Aguilar, Yendry Chaves-Madrigal, Andrea Ramírez-Mata, Amanda Villalobos-Jimenez, Stefan Ost, Carlos Quesada-Gómez, César Rodríguez, Panagiotis Papatheodorou, and Esteban Chaves-Olarte. 2019. "Toxin B Variants from Clostridium difficile Strains VPI 10463 and NAP1/027 Share Similar Substrate Profile and Cellular Intoxication Kinetics but Use Different Host Cell Entry Factors" Toxins 11, no. 6: 348. https://0-doi-org.brum.beds.ac.uk/10.3390/toxins11060348