Article

Efficient and Simultaneous Chitosan-Mediated Removal of 11 Mycotoxins from Palm Kernel Cake

by
Atena Abbasi Pirouz
1,2,
Jinap Selamat
1,3,*,
Shahzad Zafar Iqbal
4 and
Nik Iskandar Putra Samsudin
1,3
1
Laboratory of Food Safety and Food Integrity, Institute of Tropical Agriculture and Food Security, Universiti Putra Malaysia, 43400 UPM Serdang, Selangor, Malaysia
2
Faculty of Science, Institute of Biological Science, University of Malaya, 50603 UM Kuala Lumpur, Malaysia
3
Department of Food Science, Faculty of Food Science and Technology, Universiti Putra Malaysia, 43400 UPM Serdang, Selangor, Malaysia
4
Department Applied Chemistry, Faculty of Physical Science, Government College University Faisalabad, 38000 Punjab, Pakistan
*
Author to whom correspondence should be addressed.
Submission received: 19 September 2019 / Revised: 14 October 2019 / Accepted: 29 October 2019 / Published: 12 February 2020
(This article belongs to the Special Issue Mycotoxins Study: Toxicology, Identification and Control)

Abstract

:
Mycotoxins are an important class of pollutants that are toxic and hazardous to animal and human health. Consequently, various methods have been explored to abate their effects, among which adsorbent has found prominent application. Liquid chromatography tandem mass spectrometry (LC–MS/MS) has recently been applied for the concurrent evaluation of multiple mycotoxins. This study investigated the optimization of the simultaneous removal of mycotoxins in palm kernel cake (PKC) using chitosan. The removal of 11 mycotoxins such as aflatoxins (AFB1, AFB2, AFG1 and AFG2), ochratoxin A (OTA), zearalenone (ZEA), fumonisins (FB1 and FB2) and trichothecenes (deoxynivalenol (DON), HT-2 and T-2 toxin) from palm kernel cake (PKC) was studied. The effects of operating parameters such as pH (3–6), temperature (30–50 °C) and time (4–8 h) on the removal of the mycotoxins were investigated using response surface methodology (RSM). Response surface models obtained with R2 values ranging from 0.89–0.98 fitted well with the experimental data, except for the trichothecenes. The optimum point was obtained at pH 4, 8 h and 35 °C. The maximum removal achieved with chitosan for AFB1, AFB2, AFG1, AFG2, OTA, ZEA, FB1 and FB2 under the optimized conditions were 94.35, 45.90, 82.11, 84.29, 90.03, 51.30, 90.53 and 90.18%, respectively.
Key Contribution: This study presents for first time the removal of 11 mycotoxins simultaneously by using chitosan as adsorbent. Chitosan could efficiently adsorb eight mycotoxins simultaneously.

1. Introduction

Mycotoxins constitute a large number of naturally-occurring fungal secondary metabolites with considerable toxic impacts in plant and animal products, especially in developing countries [1]. These fungi usually attack cereals and other crops on the field or in storage, thereby causing significant economic losses and affecting trade globally. Furthermore, the presence of mycotoxins in feed and food commodities is a major health concern as the toxic effects cause serious problems to the health of animals, and ultimately humans. The major toxins of concern include aflatoxins (AFB1, AFB2, AFG1, AFG2), ochratoxinA OTA, fumonisins (FB1, FB2) and trichothecenes (ZEA, HT-2, T-2, and DON), which are placed in group 1, group 2 and group 3, respectively. According to the International Agency of Research on Cancer (IARC), AFB1 has been recognized as a class 1 carcinogen for animals and humans [2]. Animals often show symptoms of mycotoxicosis even when these mycotoxins are present below permitted levels. This is probably a result of the negative effects of the synergistic interactions between various mycotoxins when they occur simultaneously in the same feed [3].
Although palm kernel cake (PKC) has been commonly used in ruminant feed, its use in poultry, swine, and fish diets is limited due to its high fiber content [4]. While PKC is a valuable source of protein and energy, it is susceptible to infection with mycotoxin-producing fungi. It is abundantly produced in mainly in the equatorial tropics, including South East Asia, Africa and South America. The incidence and severity of the growing number of reports concerning the presence of mycotoxins in feed and food highlights the heightened need for practical detoxification procedures [3,5,6]. Numerous strategies involving physical, chemical and biological methods have been explored in order to detoxify mycotoxin-contaminated food and feed materials [7]. The successful removal of mycotoxins from contaminated agricultural commodities using biological and chemical methods is hindered by several issues [8]. Some of these include safety issues, failure to effectively inactivate different mycotoxins simultaneously, limited efficacy, potential loss of nutritional quality and unfavorable cost implications. Adsorption is one of the most effective and attractive physical processes for mycotoxin removal. Its major advantage is that it has minimal to no detrimental effects on the animal and this often does not outweigh the benefits gained from the high removal efficiency. The efficacy of adsorption appears to depend on the chemical structure and interactions between the solvent, adsorbate and adsorbent [9]. Several studies have reported the applicability of some inorganic and organic adsorbents such as activated charcoal, clay, yeast cell wall, hydrated sodium calcium aluminosilicates (HSCAS) and polymers for the binding and removal of mycotoxins [6,10,11,12,13]. In these cases, single adsorbents have been shown to be effective against one or two specific mycotoxins while few adsorbents may be used for various mycotoxins. However, none of them has been effective against all toxins [3,10,14,15]. Amongst numerous adsorbents, chitosan (CTS) is an effective, eco-friendly polymer and low-cost adsorbent which is used for the removal of pollutant effluents even at low concentrations because of its excellent adsorption capability [16].
Chitosan is a polyaminosaccharide that is derived through the deacetylation of chitin and it is predominantly comprised of unbranched chains of β-(1, 4)-linked 2-deoxy-2-amino-d-glucopyranose units. Chitin and CTS are the second most abundant bio- polymers after cellulose. They can be isolated from shells of crustaceans such as crabs, krills, shrimps and cell walls of some fungi [17]. Chitosan appears to be more attractive for use as adsorbent because of its beneficial properties such as hydrophilicity, biodegradability, non-toxic nature and anti-bacterial property. Likewise, CTS is a good scavenger for pollutants binding owing to the presence of amine (–NH2) and hydroxyl (–OH) functional groups in its structure; these function as coordination and reaction sites [18]. In addition, CTS sorbents are conventionally used for adsorption of anionic pollutants from aqueous solutions because of their polycationic nature.
Chitin has very poor solubility in most organic solvents while CTS dissolves readily in dilute acidic solutions [19]. Aqueous acid solutions with pH below 6.0 have been found to be the best solvents for CTS. Such acids include acetic acid, hydrochloric acid, nitric acid and formic acid. However, sulfuric and phosphoric acids are not suitable solvents for CTS as it is insoluble in them [17]. Numerous articles have reviewed the application of chitosan and its derivatives in removing contaminants from water samples, wastewaters, dye compounds and heavy metals [20,21,22,23,24]. However, to date, there is limited number of literature on the successful simultaneous removal of mycotoxin with CTS as adsorbent [9,25,26].
To the best our knowledge, this is the first study on the simultaneous removal of 11 toxic mycotoxins in PKC using CTS.

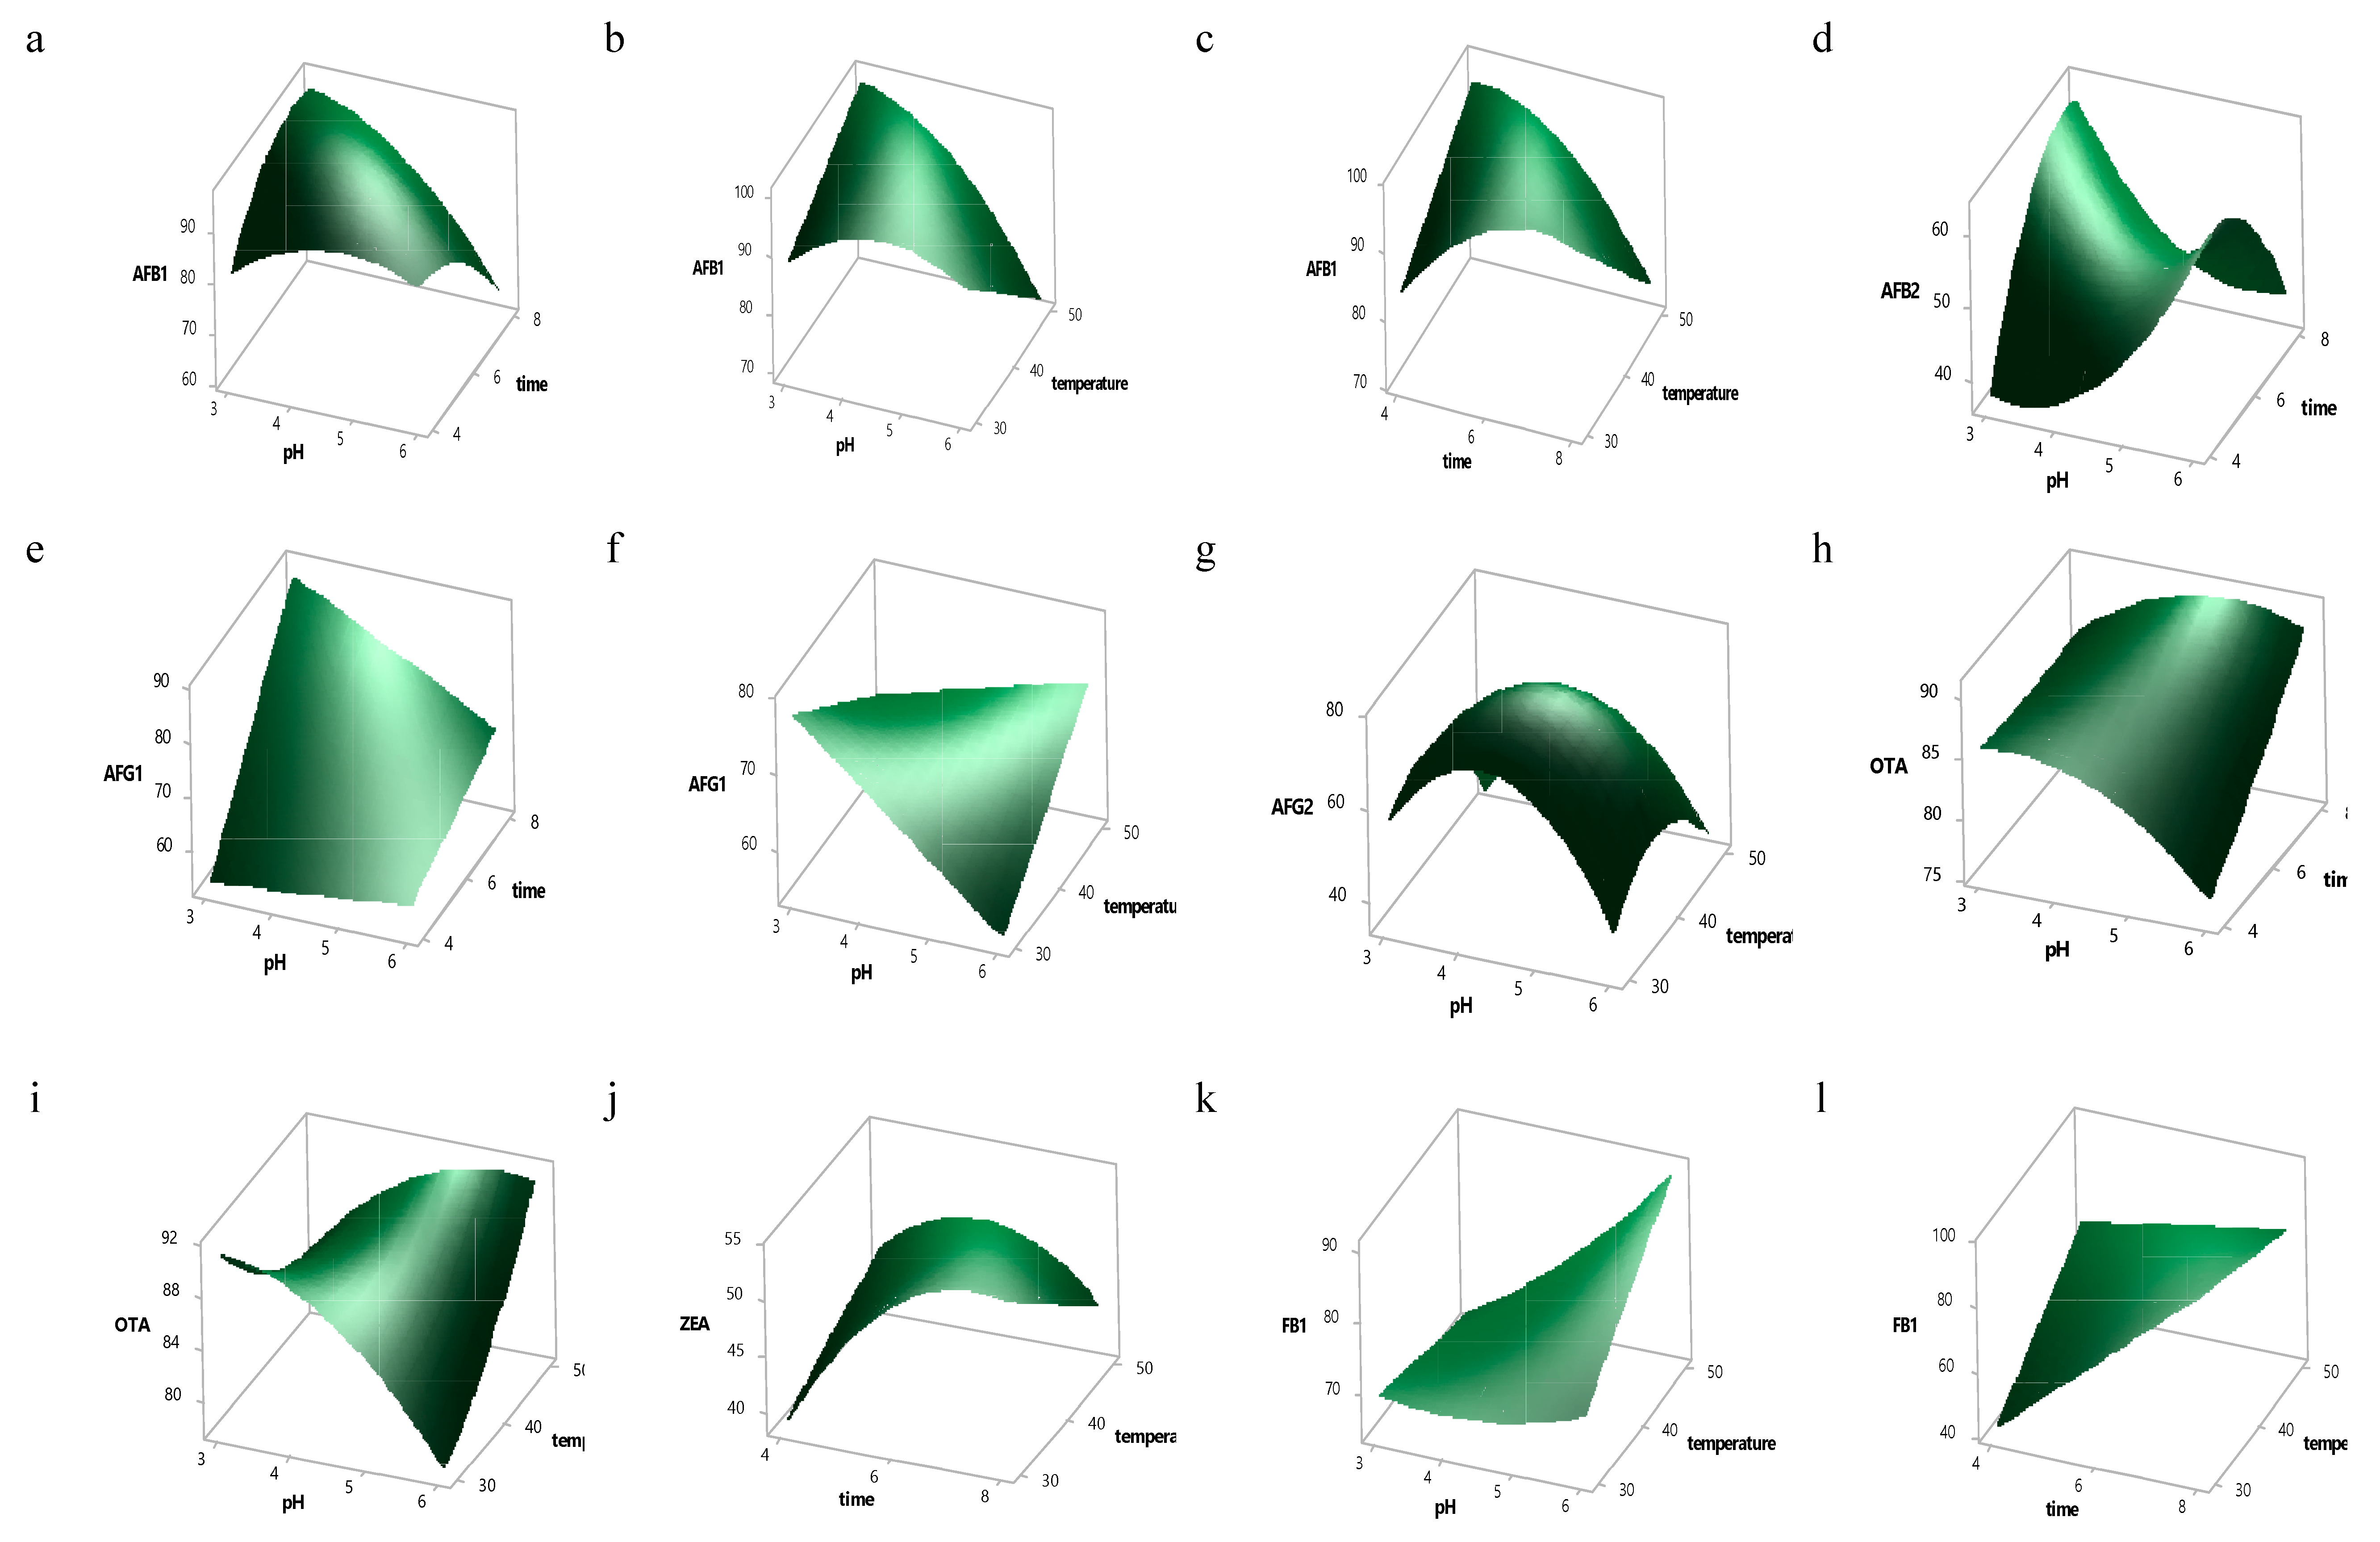
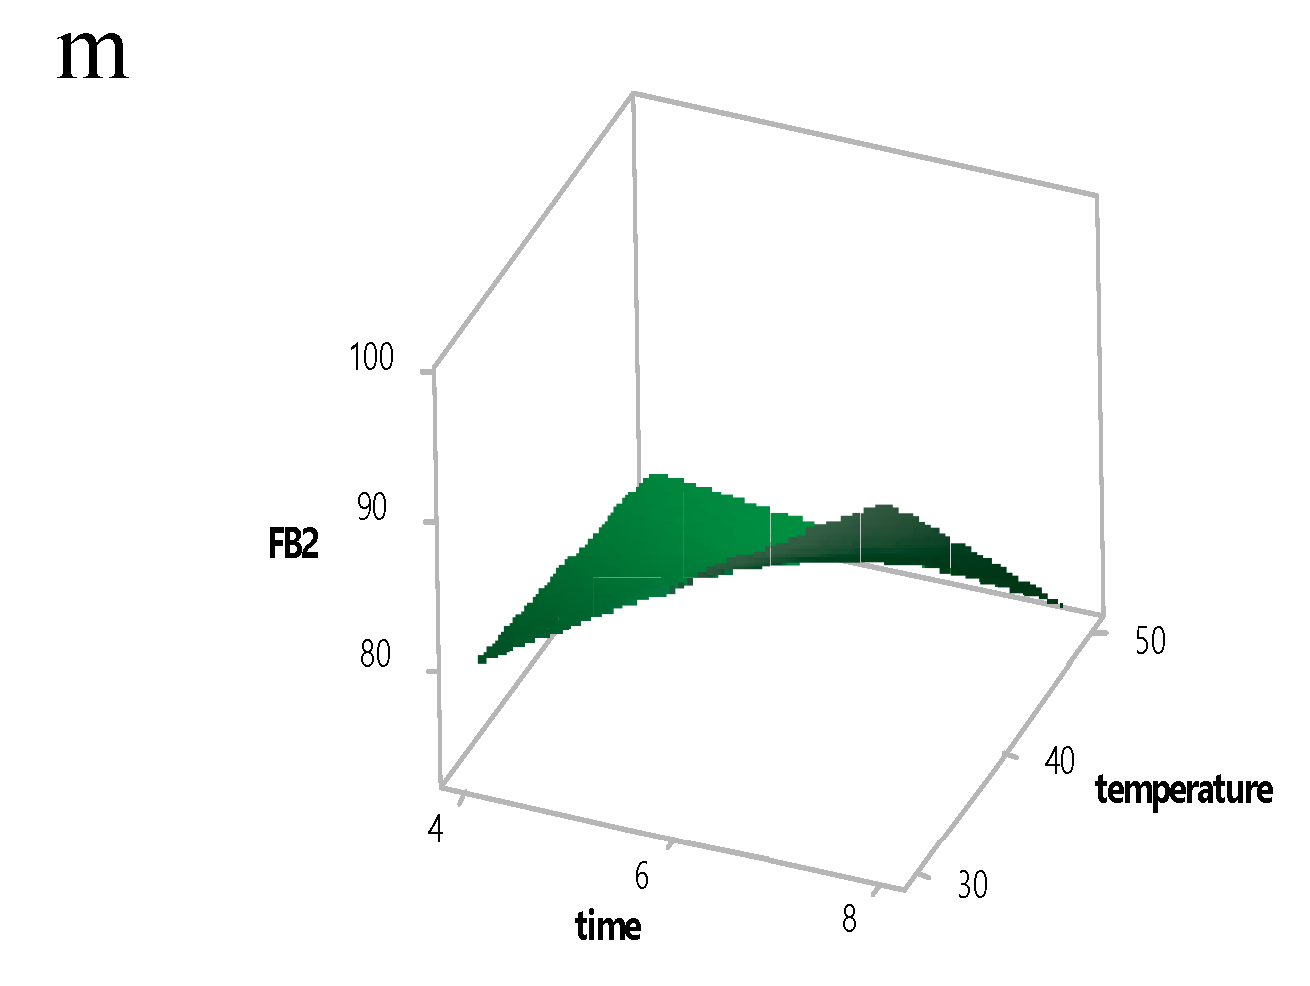
2. Results and Discussion

Data Analysis

Table 1 shows the experimental treatments in the CCD design of RSM applied in optimizing the removal of mycotoxins from PKC using chitosan in Table 2, the estimated regression coefficients and the corresponding R2 values, p-value and model lack of fit are presented. Each response was evaluated as a function of main (linear), quadratic and interaction effects of pH (x1), time (x2) and temperature (x3). As revealed by ANOVA, the coefficients of multiple determination (R2) for the responses ranged between 0.89 and 0.98, thus illustrating that the quadratic polynomial models obtained adequately represented the experimental data (Table 2). The models sufficiently related the studied independent variables to the simultaneous removal of eight mycotoxins by CTS, indicating a perfect fit (p < 0.05) with the second-order response surface equations. A good model fit is indicated by the R2 values being at least 0.80 [27] Apparently, chitosan showed poor adsorption for DON, HT-2 and T-2 as the R2 values for these responses were all less than 0.80 (i.e., 0.62, 0.55 and 0.71 respectively) and their p-values were likewise not significant (p > 0.05). These low R2 values indicate that the predicted responses differed considerably from the experimental values and the models were not adequate. This observation may be due to the fact that trichothecenes, being non-ionizable molecules having a bulky epoxy group, have poor adsorption with plane surfaces. As a consequence, they adsorb on very few adsorbent agents [28].
Judging from the F and p values for the main, quadratic and interaction effects of each independent variable (pH, time and temperature) as seen in Table 3, most of them showed significant effects (p < 0.05) for the removal of mycotoxins. Compared to the quadratic and interaction effects, the main linear effects were more significant (p < 0.05) for mycotoxin removal. As all factors had significant (p < 0.05) effects on the mycotoxin removal (Table 3), they should therefore be retained as critical parameters in the final reduced model for fitting with the experimental data. Furthermore, the interaction effects of all the independent variables were significant (p > 0.05) only in the removal of AFB1. Except in the case of ZEA, the interaction effects of pH with the other two factors was significant (p < 0.05) in the removal of the mycotoxins. The reason may be due to the structure and the differences in the solubility of ZEA, owing to its polarity. The resorcinol moiety of ZEA is fused to a 14-atom macrocyclic lactone ring, with a double bond in the trans isomeric form with ketone and methyl groups [29], and its deprotonated form (ZEN) exists at pH > 7.62 [30,31]. Therefore, at acidic pH, the main binding mechanism will likely be hydrophobic interactions. Therefore, the removal of ZEA depended on temperature during equilibrium time. On the other hand, the results showed that the interaction of pH and temperature was significant (p < 0.05) for response variables, such as AFB1, AFG1, AFG2, OTA and FB1, with the effect being most significant for AFB1 and OTA reduction as their F values were 97.42 and 70.21 respectively. The interaction effect of pH and time was significant (p < 0.05) for removal of AFB1, AFB2, AFG1 and OTA (Table 3). Likewise, the interaction of pH and time had the highest influence on the removal of AFB1 due to its rather high F-value of 127.30. Therefore, it can be observed that pH was more influential for mycotoxin removal than the other variables studied. An acidic pH causes the release of more H+ ions that may react with the adsorbent or adsorbate, thereby affecting results. Being a polycationic polymer, the surface of chitosan would become strongly positively charged under more acidic conditions, due to protonation of amino groups. This would cause increased electrostatic reactions between it and the negatively-charged mycotoxin molecules, leading to better adsorption. However, with gradual increase in pH, the adsorbent (chitosan) surface carries more negative charges, causing repulsion between it and the mycotoxin molecules. This eventually results in reduced adsorption capacity [20].
The interaction effects of the processing variables on mycotoxin removal, shown to be significant from ANOVA results (Table 3), are explained visually with three-dimensional (3-D) response surface plots in Figure 1a–m. It can be seen from Figure 1a–c that the removal of AFB1 was significantly affected (p > 0.05) by the interaction of all the independent variables. The interaction effect x1x3 was also significant (p < 0.05) for almost all the target mycotoxins except ZEA, AFB2 and FB2, thus indicating an overall positive effect on mycotoxin reduction. Maximum removal of AFB1 and AFG2 were seen in the middle of pH (x1) with two other factors (x2, x3) for AFB1 (Figure 1a–c) and pH (x1) and temperature (x3) for AFG2 (Figure 1g). Likewise, maximum removal of ZEA was illustrated in the middle of x2 and x3 in Figure 1j.

3. Statistical Design

Three independent variables, i.e., pH (x1), equilibrium time (x2) and temperature (x3), were evaluated for their effect on the response variables y1y11, denoting the removal of DON, AB1, AB2, AG1, AG2, OTA, ZEA, HT-2, T-2 toxin, FB1 and FB2 respectively. These variables were selected for the study based on findings from literature and preliminary studies. A composite central design (CCD) with 20 experimental runs was employed to study the main and interaction effects of the variables on the mycotoxin removal. The range of values applied on the independent variable ranges studied were: pH 3–6, equilibrium time of 3–8 h and 30–50 °C temperature, all set at three levels for each variable, as illustrated in Table 4. The center point was replicated six times reproducibility [32].

4. Statistical Analysis

Regression analysis as well as analysis of variance (ANOVA) was applied to establish the nature of the relationship between the responses and the three independent variables. To fit the regression models to the experimental data with the objective of achieving the overall optimal region for all response variables studied [33]. For all tests the p-value adopted was less than 0.05. The generalized polynomial model proposed for relating the response to independent variables is given below:
yi = b0+b1x1+b2x2+b3x3+b12x1x2+b13x1x3+b23x2x3+b11x12+b22x22+b33x32
where yi represents the predicted dependent variables; b0 is the offset term (constant); b1, b2 and b3 are the linear effects; b11, b22 and b33 are quadratic effects; and b12, b13, b23, b31 and b32 are the interaction effects. The terms xixj and xi2 (i = 1, 2 or 3) denote the interaction and quadratic terms respectively [34,35]. The adequacy of the model was tested using model analysis, lack of fit test and coefficient of determination (R2) analysis.

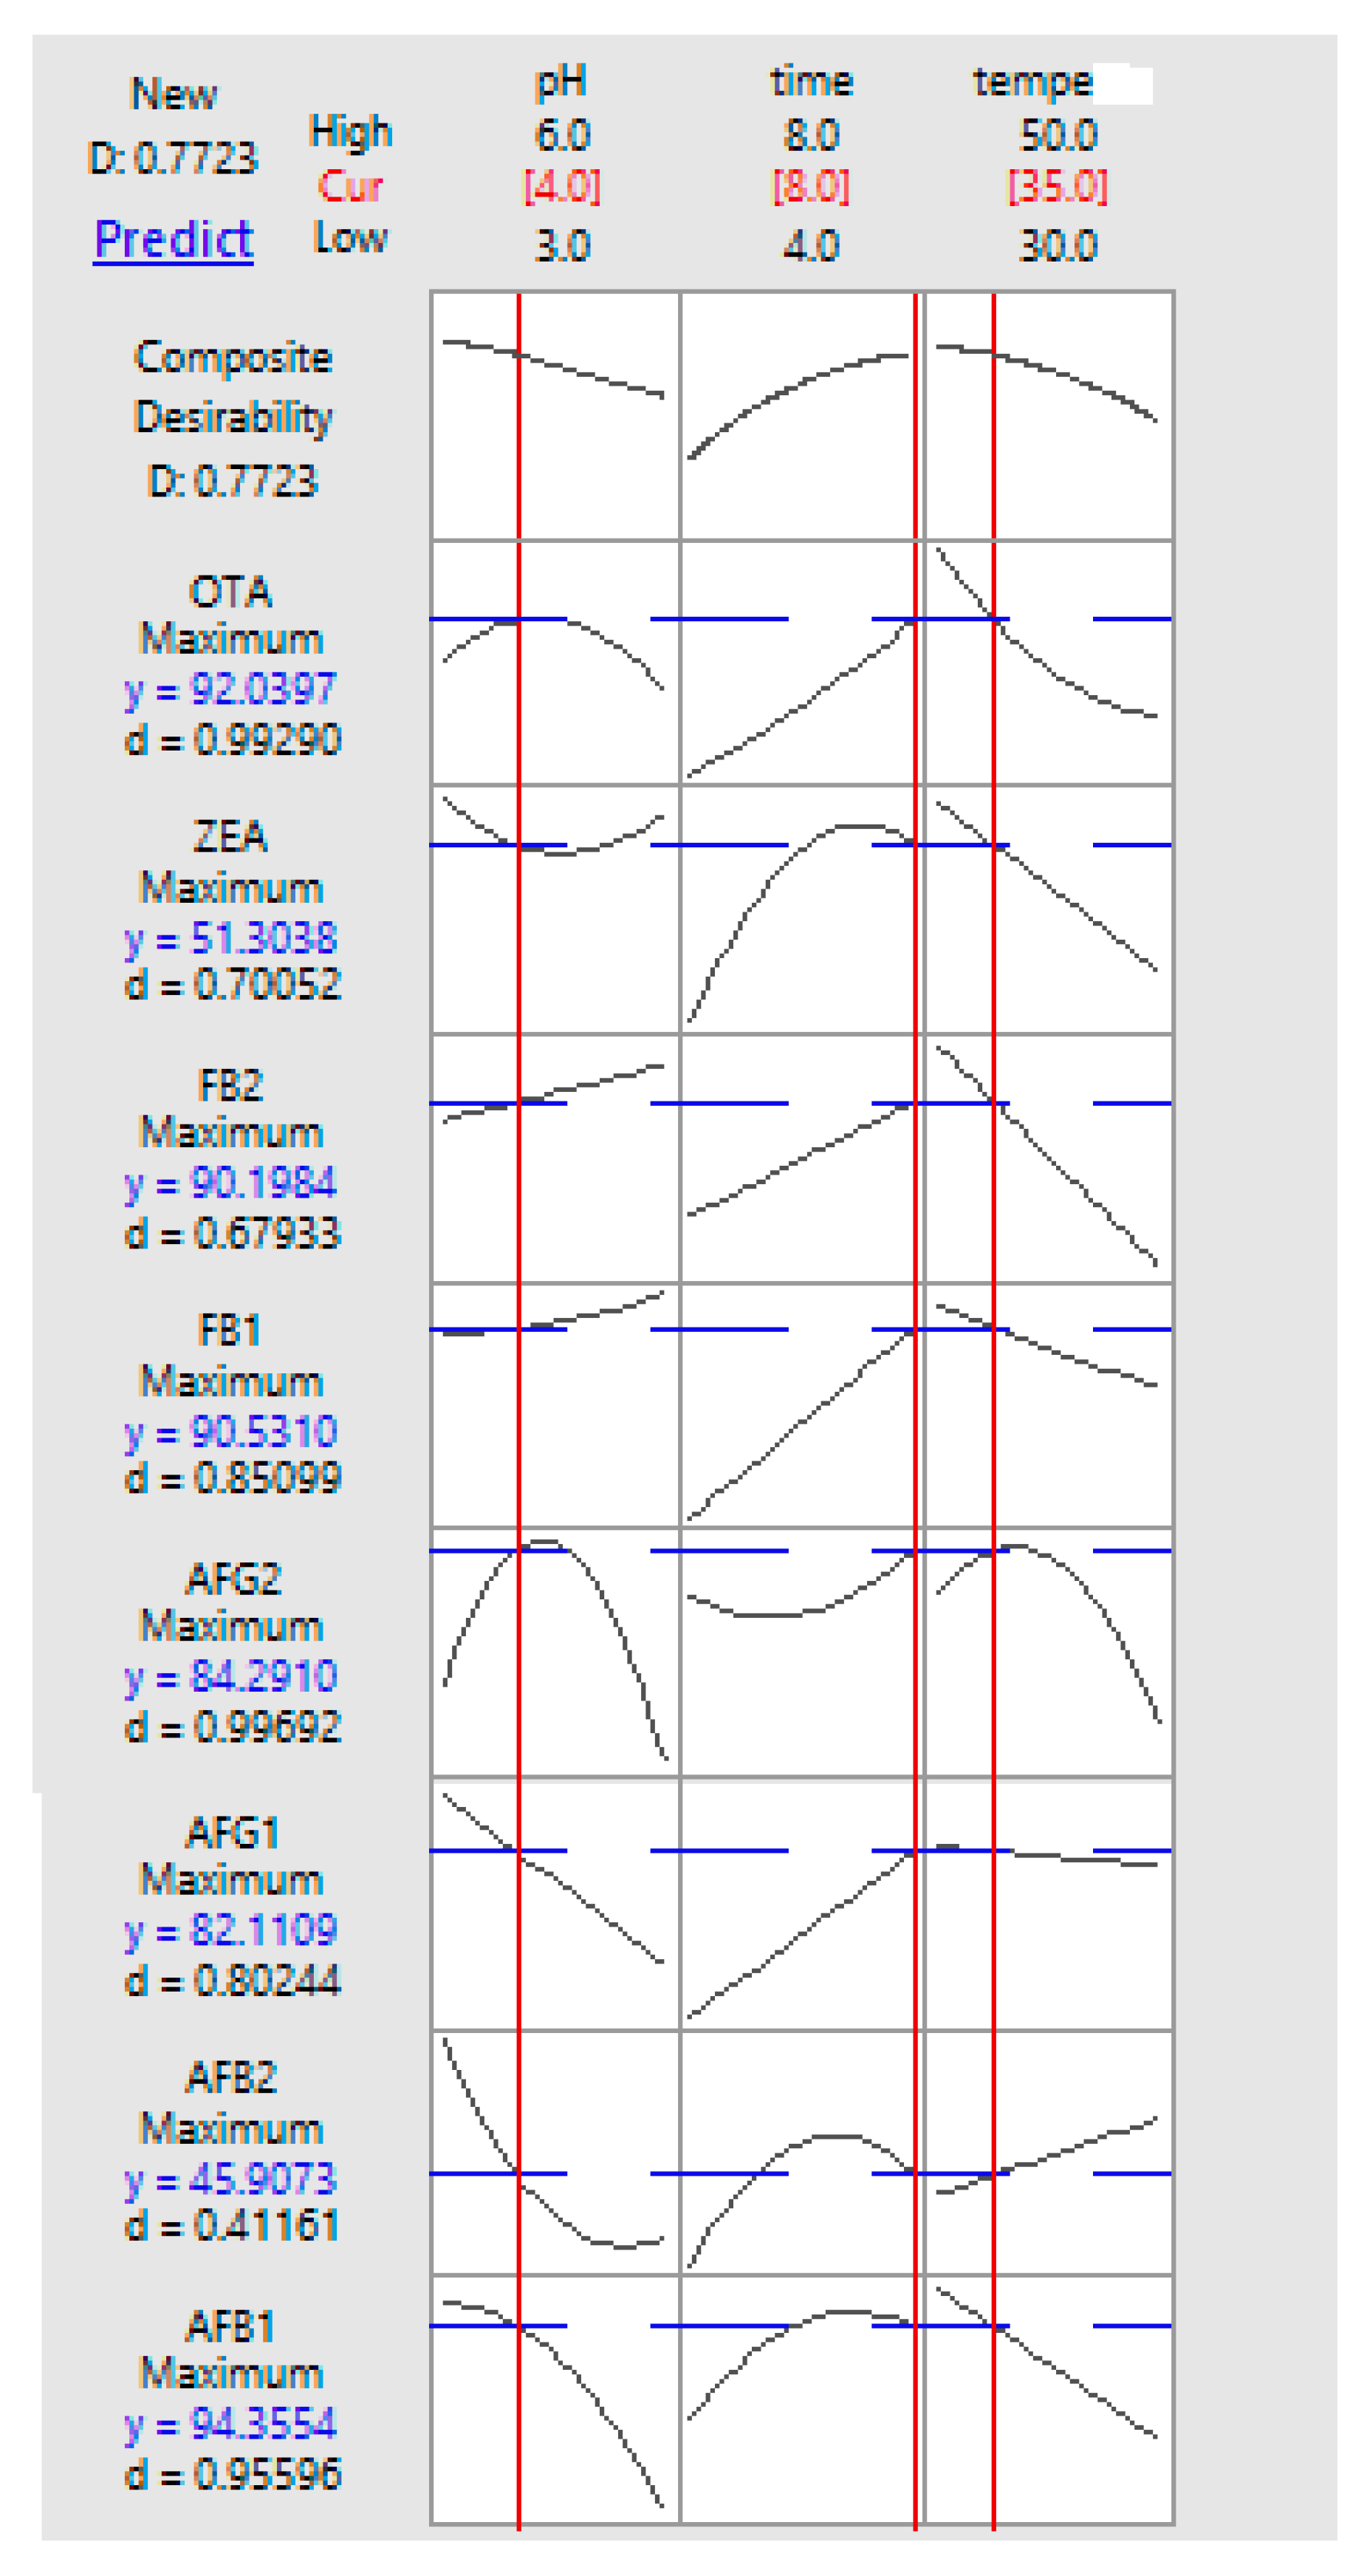
5. Optimization and Validation Procedure

The final reduced models in optimization can be presented as 3-D response surface plots. These can reveal the significant interactive effects of the independent variables on the response [36]. Here, the relationship of each response to the independent variables was expressed with 3-D plots by fixing two variables at the centre point while varying the third within the chosen experimental range. The levels of the independent variables for achieving the optimum goal of the individual and overall responses were determined with the aid of the response optimizer.
The response optimizer allows the attainment of a fair balance in the optimization of several response variables by identifying the best combination of input variable settings that favour maximum value of response(s) [37]. It was thus applied in the current study in order to simultaneously reduce the 11 target mycotoxins. The final reduced models were verified by conducting five replicate experimental runs at the optimal settings and comparing the observed results with the predicted responses. Significant difference between the predicted and experimental results were further confirmed by one sample t-test Experimental design, model generation, prediction and other statistical analysis were done using a statistical package (Minitab 17 software, State College, PA, USA).

6. Adsorption Studies

About 2 kg of fresh representative PKC samples were kept at 4 °C ahead of sample extraction and subsequent analysis. Three different concentrations (5.0, 25.0 and 100.0 ng/g) of AFB1, AFB2, AFG1, AFG2, OTA, ZEA, DON, HT-2, T-2, FB1 and FB2 standards were mixed with approximately 5 g of PKC, each in triplicate solvent evaporation was allowed to occur in the spiked samples by storing them overnight in the dark. Preliminary studies conducted within the range of 0.005 to 0.04 g of CTS revealed that decrease in mycotoxins was not observed beyond 0.035 g. Therefore, this amount was utilized in the adsorption experiments. In the sorption experiments, 350 mg of CTS adsorbent was added to 5 g of mycotoxin-contaminated PKC samples in 50 mL flasks. A 20 mL volume of solvent (acetonitrile/water/formic acid at 70:29:1, v/v/v) was added to the flask and the pH (3–6) was adjusted as needed using 0.01 M HCl. Adsorption was then carried out at controlled temperatures (30–50 °C) and at desired equilibrium times (4–8 h) under constant shaking (300 rpm). The mixture of solution was centrifuged at 3000 rpm for 10 min and 1 mL of the final solution was mixed with 3 mL of water for dilution [38]. The purpose of sample dilution during the sample preparation procedure was to reduce the possible matrix effect [39]. The extract obtained was then filtered with nylon syringe filter (0.22 μm). At the end of this process, residual mycotoxins present were measured using LC/MS-MS [40]. Adsorption was estimated based on the initial and final amounts of mycotoxins present in the aqueous, as presented in the following Equation (2) [41]:
E= (C0−Ce)/C0/100
In Equation (2), C0 is the concentration (ng/mL) of the mycotoxin in the blank control and Ce is its concentration (ng/mL) in the supernatant.

7. Optimization for Maximum Mycotoxin Removal

To identify the optimum settings of the independent variables for the desired goal of mycotoxin removal, multiple response optimizations (numerical and visual) were conducted. Two stages may be considered in optimization: (a) visualize the significant interaction effects of independent variables on the response variables and (b) the actual optimization, where the factors are further examined in order to determine the best applicable conditions. Presented in Figure 2 are the respective response plots for simultaneous removal of eight mycotoxins obtained with different settings of the studied variables. Maximum removal of all mycotoxins was predicted to occur at the optimal condition of pH 4, time 8 h and temperature 35 °C (Figure 2).

8. Reduced Response Model Validation

Adequacy of the response-regression equations was evaluated using t-test. The corresponding experimental responses were compared with predicted values and the results are presented in Table 5. In the validation process, there must be no significant difference (p > 0.05) between the predicted and actual experimental values; this implies good agreement between the two values. This observation verifies adequate fitness of the response equations by RSM. Applying the optimum conditions predicted by the reduced models in this study, reduction for AFB1, AFB2, AFG1, AFG2, OTA, ZEA, FB1 and FB2 were 94.35, 45.90, 82.11, 84.29, 90.03, 51.30, 90.53 and 90.18% respectively. The total desirability was 0.77 as shown in Table 5. Hence, the final reduced models fitted by RSM were adequate.
Results of the recovery all the experimental response values showed that this method is acceptable to be used for mycotoxin removal with chitosan in PKC. Recovery values ranged from 81% to 112% for all mycotoxins as reported [38,42].
Results from this study have shown that CTS is promising as an adsorbent for removal of various types of mycotoxins. Its application for the removal of OTA in contaminated drinks has been previously demonstrated [9,43]. Dietary supplementation in poultry for removal of AFB1 and ZEA [44], demonstrated the effectiveness of CTS in reducing the levels of one or two mycotoxins. In this study, CTS showed a moderate to high adsorbent capacity against eight of the eleven mycotoxins evaluated simultaneously, though it showed poor adsorption against HT2, T-2 and DON. These findings indicate better performance against a wider range of mycotoxins than was achieved in a similar study [45] and with cross-linked chitosan [30]. This study further suggests that CTS can remarkably bind all eight of the mycotoxins assessed simultaneously.

9. Conclusions

We report for the first time, the simultaneous CTS adsorption of 11 mycotoxins in PKC as an ingredient of animal feed. Statistical optimization using RSM (CCD) was a valuable tool for maximizing the effects and interactions of pH, time and temperature for removal of mycotoxins. The optimum condition for the removal of mycotoxins was at pH 4 for 8 h and at temperature of 35 °C, with high overall desirability (D 0.77). The overall coefficient of determination values for the regression models were high (0.89 < R2 < 0.98), as revealed by ANOVA. Results from the current study revealed the removal of eight target mycotoxins using Chitosan. Mycotoxin removal efficiency was 45.90% and 94.35% for AFB2 and AFB1 respectively. In increasing order, removal efficiency generally followed this trend: AFB1 > FB1 > FB2 > OTA > AFG2 > AFG1 > ZEA and AFB2. The present method offers clear advantages in terms of simplicity, speed, cost-effectiveness and ensuring low concentration of adverse mycotoxins in the sample. This finding is important as the mycotoxins were diminished to a greater extent than was reported using other adsorbents. The results clearly showed that pH is an important primary factor to be considered in the removal of mycotoxins with CTS. Lastly, CTS is relatively inexpensive and is thus a good candidate for practical applications involving simultaneous removal of mycotoxins in animal feed.

10. Materials and Methods

Palm kernel cake (PKC) samples were collected from local mills across different regions in Malaysia (Shah Alam and Kelantan in Selangor and Kelantan state respectively). Representative samples of the PKC were prepared as described previously [46]. Analytical pure standards of the aflatoxins (AFB1, AFB2, AFG1, and AFG2), ochratoxin A (OTA) zearalenone (ZEA), trichothecenes (deoxynivalenol (DON), HT-2 and T-2 toxin) and fumonisins (FB1-FB2), were purchased from VICAM (Watertown, MA, USA). Chitosan (CTS > 85% deacetylation) was sourced from Sigma-Aldrich (St. Louis, MO, USA). Deionized water was prepared with a water purifier (Elga Classic UV MK2; Elga, Marlow, UK). HPLC-grade solvents (acetonitrile, methanol and formic acid) were from Merck (Darmstadt, Germany). Filtration of all eluents was done using 0.22-μm Whatman membrane filters (Whatman, 110 Maidstone, UK).

Mycotoxins Analysis by LC–MS/MS

The mass spectrometer used for the analyses was an Agilent 1290 Infinity UHPLC module LC/MS-MS with a Triple Quad LC/MS (Agilent 6410, Agilent technologies, Palo Alto, CA, USA). This system consisted of an auto sampler, a degasser and column oven. Separation was performed using a Zorbax Eclipse plus C18 column (2 × 150 mm, 3 μm) at column temperature of 30 °C manufactured by Agilent Technologies (Palo Alto, CA, USA). The analysis was operated in positive and negative modes with electrospray interface (ESI±) with the following parameters: capillary voltage of 4 kV, nitrogen as spray gas and desolvation temperature 40 °C. Mycotoxins were analyzed in multi reaction monitoring (MRM) mode while matrix-matched standard calibration was used for quantification. As shown in Table 6, the mobile phase consisted of a gradient of 2 solvents: mobile phase A (methanol) slightly acidified with mobile phase B (0.1% formic acid in water), at a flow-rate of 0.2 mL/min. Validation of the LC-MS/MS method was carried out by investigating the basic performance characteristics included linearity, limit of detection, limit of quantification and recovery in accordance with the European Commission regulation for the performance of analytical methods (EC 657/2002).

Author Contributions

A.A.P. carried out the entire experiments and wrote the manuscripts with support from J.S., A.A.P., J.S., S.Z.I. and N.I.P.S. designed the experiments. J.S. supervised the project. A.A.P., J.S., N.I.P.S. and S.Z.I. discussed the results and contributed to the final manuscript. All authors approved the final manuscripts. All authors have read and agreed to the published version of the manuscript.

Funding

This research was funded by Ministry of Education Malaysia [grant number 6369114] and HICOE environment set at the Institute of Tropical Agriculture and Food Security.

Acknowledgments

The authors would like to acknowledge the contribution of the Ministry of Education Malaysia [grant number 6369114] and HICOE environment set at the Institute of Tropical Agriculture and Food Security.

Conflicts of Interest

The authors declare no conflict of interest.

References

  1. Signorini, M.; Gaggiotti, M.; Molineri, A.; Chiericatti, C.; de Basílico, M.Z.; Basilico, J.; Pisani, M. Exposure assessment of mycotoxins in cow’s milk in Argentina. Food Chem. Toxicol. 2012, 50, 250–257. [Google Scholar] [CrossRef] [PubMed]
  2. da Rocha, M.E.B.; Freire, F.D.C.O.; Maia, F.E.F.; Guedes, M.I.F.; Rondina, D.J.F.C. Mycotoxins and their effects on human and animal health. Food Control 2014, 36, 159–165. [Google Scholar] [CrossRef]
  3. Vila-Donat, P.; Marin, S.; Sanchis, V.; Ramos, A. A review of the mycotoxin adsorbing agents, with an emphasis on their multi-binding capacity, for animal feed decontamination. Food Chem. Toxicol. 2018, 114, 246–259. [Google Scholar] [CrossRef] [PubMed] [Green Version]
  4. Sharmila, A.; Alimon, A.; Azhar, K.; Noor, H.; Samsudin, A. Improving nutritional values of Palm Kernel Cake (PKC) as poultry feeds: A review. Malays. J. Anim. Sci. 2014, 17, 1–18. [Google Scholar]
  5. Peng, W.-X.; Marchal, J.; van der Poel, A. Strategies to prevent and reduce mycotoxins for compound feed manufacturing. Anim. Feed Sci. Technol. 2018, 237, 129–153. [Google Scholar] [CrossRef]
  6. Jard, G.; Liboz, T.; Mathieu, F.; Guyonvarc’h, A.; Lebrihi, A. Review of mycotoxin reduction in food and feed: from prevention in the field to detoxification by adsorption or transformation. Food Addit. Contam. 2011, 28, 1590–1609. [Google Scholar] [CrossRef]
  7. Jans, D.; Pedrosa, K.; Schatzmayr, D.; Bertin, G.; Grenier, B. Mycotoxin Reduction in Animal Diets. In Mycotoxin Reduction in Grain Chains; Wiley: Hoboken, NJ, USA, 2014; Chapter 8; pp. 101–110. [Google Scholar]
  8. Smith, T.; Girish, C. Prevention and control of animal feed contamination by mycotoxins and reduction of their adverse effects in livestock. In Animal Feed Contamination; Elsevier: Guelph, ON, Canada, 2012; pp. 326–351. [Google Scholar]
  9. Mine Kurtbay, H.; Bekçi, Z.; Merdivan, M.; Yurdakoç, K. Reduction of ochratoxin A levels in red wine by bentonite, modified bentonites, and chitosan. J. Agric. Food Chem. 2008, 56, 2541–2545. [Google Scholar] [CrossRef]
  10. Avantaggiato, G.; Havenaar, R.; Visconti, A. Assessment of the multi-mycotoxin-binding efficacy of a carbon/aluminosilicate-based product in an in vitro gastrointestinal model. J. Agric. Food Chem. 2007, 55, 4810–4819. [Google Scholar] [CrossRef]
  11. Phillips, T.; Afriyie-Gyawu, E.; Williams, J.; Huebner, H.; Ankrah, N.-A.; Ofori-Adjei, D.; Jolly, P.; Johnson, N.; Taylor, J. Marroquin-Cardona, A. Reducing human exposure to aflatoxin through the use of clay: A review. Food Addit. Contam. 2008, 25, 134–145. [Google Scholar] [CrossRef]
  12. Kong, C.; Shin, S.Y.; Kim, B.G. Evaluation of mycotoxin sequestering agents for aflatoxin and deoxynivalenol: An in vitro approach. SpringerPlus 2014, 3, 346. [Google Scholar] [CrossRef] [Green Version]
  13. Wielogórska, E.; MacDonald, S.; Elliott, C. A review of the efficacy of mycotoxin detoxifying agents used in feed in light of changing global environment and legislation. World Mycotoxin J. 2016, 9, 419–433. [Google Scholar] [CrossRef]
  14. Kabak, B. Prevention and management of mycotoxins in food and feed. In Mycotoxins in Food, Feed and Bioweapons; Springer: Corum, Turkey, 2009; pp. 201–227. [Google Scholar]
  15. Di Gregorio, M.C.; Neeff, D.V.D.; Jager, A.V.; Corassin, C.H.; Carão, Á.C.D.P.; Albuquerque, R.D.; Azevedo, A.C.D.; Oliveira, C.A.F. Mineral adsorbents for prevention of mycotoxins in animal feeds. Toxin Rev. 2014, 33, 125–135. [Google Scholar] [CrossRef]
  16. Azlan, K.; Saime, W.N.W.; Liew, L. Chitosan and chemically modified chitosan beads for acid dyes sorption. J. Environ. Sci. 2009, 21, 296–302. [Google Scholar] [CrossRef]
  17. Yeul, V.S.; Rayalu, S.S. Unprecedented chitin and chitosan: A chemical overview. J. Polym. Environ. 2013, 21, 606–614. [Google Scholar] [CrossRef]
  18. Yen, M.-T.; Yang, J.-H.; Mau, J.-L. Antioxidant properties of chitosan from crab shells. Carbohydr. Polym. 2008, 74, 840–844. [Google Scholar] [CrossRef]
  19. Pillai, C.; Paul, W.; Sharma, C.P. Chitin and chitosan polymers: Chemistry, solubility and fiber formation. Prog. Polym. Sci. 2009, 34, 641–678. [Google Scholar] [CrossRef]
  20. Ngah, W.W.; Teong, L.; Hanafiah, M.A.K.M. Adsorption of dyes and heavy metal ions by chitosan composites: A review. Carbohydr. Polym. 2011, 83, 1446–1456. [Google Scholar] [CrossRef]
  21. Chatterjee, S.; Chatterjee, T.; Lim, S.R.; Woo, S.H. Adsorption of a cationic dye, methylene blue, on to chitosan hydrogel beads generated by anionic surfactant gelation. Environ. Technol. 2011, 32, 1503–1514. [Google Scholar] [CrossRef]
  22. Chatterjee, S.; Lee, M.W.; Woo, S.H. Adsorption of congo red by chitosan hydrogel beads impregnated with carbon nanotubes. Bioresour. Technol. 2010, 101, 1800–1806. [Google Scholar] [CrossRef]
  23. Kyzas, G.Z.; Lazaridis, N.K.; Kostoglou, M. Adsorption/desorption of a dye by a chitosan derivative: Experiments and phenomenological modeling. Chem. Eng. J. 2014, 248, 327–336. [Google Scholar] [CrossRef]
  24. Ren, Y.; Abbood, H.A.; He, F.; Peng, H.; Huang, K. Magnetic EDTA-modified chitosan/SiO2/Fe3O4 adsorbent: Preparation, characterization, and application in heavy metal adsorption. Chem. Eng. J. 2013, 226, 300–311. [Google Scholar] [CrossRef]
  25. Peng, X.; Liu, B.; Chen, W.; Li, X.; Wang, Q.; Meng, X.; Wang, D. Effective biosorption of patulin from apple juice by cross-linked xanthated chitosan resin. Food Control 2016, 63, 140–146. [Google Scholar] [CrossRef]
  26. Kaushik, A.; Solanki, P.R.; Ansari, A.A.; Ahmad, S.; Malhotra, B.D. Chitosan–iron oxide nanobiocomposite based immunosensor for ochratoxin-A. Electrochem. Commun. 2008, 10, 1364–1368. [Google Scholar] [CrossRef]
  27. Pirouz, A.; Selamat, J.; Iqbal, S.; Mirhosseini, H.; Karjiban, R.A.; Bakar, F.A. The use of innovative and efficient nanocomposite (magnetic graphene oxide) for the reduction on of Fusarium mycotoxins in palm kernel cake. Sci. Rep. 2017, 7, 12453. [Google Scholar] [CrossRef] [PubMed]
  28. Afsah-Hejri, L.; Jinap, S.; Arzandeh, S.; Mirhosseini, H. Optimization of HPLC conditions for quantitative analysis of aflatoxins in contaminated peanut. Food Control 2011, 22, 381–388. [Google Scholar] [CrossRef]
  29. Ko, W.-C.; Chang, C.-K.; Wang, H.-J.; Wang, S.-J.; Hsieh, C.-W. Process optimization of microencapsulation of curcumin in γ-polyglutamic acid using response surface methodology. Food Chem. 2015, 172, 497–503. [Google Scholar] [CrossRef]
  30. Liu, D.; Xu, H.; Tian, B.; Yuan, K.; Pan, H.; Ma, S.; Yang, X.; Pan, W. Fabrication of carvedilol nanosuspensions through the anti-solvent precipitation–ultrasonication method for the improvement of dissolution rate and oral bioavailability. Aaps Pharmscitech 2012, 13, 295–304. [Google Scholar] [CrossRef] [Green Version]
  31. Huang, Y.; Yuan, Y.; Zhou, Z.; Liang, J.; Chen, Z.; Li, G. Optimization and evaluation of chelerythrine nanoparticles composed of magnetic multiwalled carbon nanotubes by response surface methodology. Appl. Surf. Sci. 2014, 292, 378–386. [Google Scholar] [CrossRef]
  32. Mirhosseini, H.; Tan, C.P.; Taherian, A.R.; Boo, H.C. Modeling the physicochemical properties of orange beverage emulsion as function of main emulsion components using response surface methodology. Carbohydr. Polym. 2009, 75, 512–520. [Google Scholar] [CrossRef]
  33. Mehrnoush, A.; Tan, C.P.; Hamed, M.; Aziz, N.A.; Ling, T.C. Optimisation of freeze drying conditions for purified serine protease from mango (Mangifera indicaCv. Chokanan) peel. Food Chem. 2011, 128, 158–164. [Google Scholar] [CrossRef]
  34. Yibadatihan, S.; Jinap, S.; Mahyudin, N.J.F.A. Simultaneous determination of multi-mycotoxins in palm kernel cake (PKC) using liquid chromatography-tandem mass spectrometry (LC-MS/MS). Food Addit. Contam. Part A 2014, 31, 2071–2079. [Google Scholar] [CrossRef] [PubMed]
  35. Patel, D.; Sciences, B. Matrix effect in a view of LC-MS/MS: An overview. Int. J. Pharma Biol. Sci. 2011, 2, 559–564. [Google Scholar]
  36. Rubert, J.; Soler, C.; Mañes, J.J.F.C. Application of an HPLC–MS/MS method for mycotoxin analysis in commercial baby foods. Food Chem. 2012, 133, 176–183. [Google Scholar] [CrossRef]
  37. Fan, L.; Luo, C.; Sun, M.; Li, X.; Lu, F.; Qiu, H. Preparation of novel magnetic chitosan/graphene oxide composite as effective adsorbents toward methylene blue. Bioresour. Technol. 2012, 114, 703–706. [Google Scholar] [CrossRef] [PubMed]
  38. Kathiravan, T.; Nadanasabapathi, S.; Kumar, R. Pigments and antioxidant activity of optimized Ready-to-Drink (RTD) Beetroot (Beta vulgaris L.)-passion fruit (Passiflora edulis var. flavicarpa) juice blend. Croat. J. Food Sci. Technol. 2015, 7, 9–21. [Google Scholar] [CrossRef]
  39. Boudergue, C.; Burel, C.; Dragacci, S.; Favrot, M.-C.; Fremy, J.-M.; Massimi, C.; Pringent, P.; Debongnie, P.; Pussemier, L.; Boudra, H. Review of mycotoxin-detoxifying agents used as feed additives: Mode of action, efficacy and feed/food safety. EFSA Support. Publ. 2009, 6, 22E. [Google Scholar] [CrossRef]
  40. Gromadzka, K.; Waskiewicz, A.; Chelkowski, J.; Golinski, P. Zearalenone and its metabolites: Occurrence, detection, toxicity and guidelines. World Mycotoxin J. 2008, 1, 209–220. [Google Scholar] [CrossRef]
  41. Zhao, Z.; Liu, N.; Yang, L.; Wang, J.; Song, S.; Nie, D.; Yang, X.; Hou, J.; Wu, A. Cross-linked chitosan polymers as generic adsorbents for simultaneous adsorption of multiple mycotoxins. Food Control 2015, 57, 362–369. [Google Scholar] [CrossRef]
  42. Faucet-Marquis, V.; Joannis-Cassan, C.; Hadjeba-Medjdoub, K.; Ballet, N.; Pfohl-Leszkowicz, A. Development of an in vitro method for the prediction of mycotoxin binding on yeast-based products: Case of aflatoxin B 1, zearalenone and ochratoxin A. Appl. Microbiol. Biotechnol. 2014, 98, 7583–7596. [Google Scholar] [CrossRef] [Green Version]
  43. Soleimany, F.; Jinap, S.; Abas, F.J.F.C. Determination of mycotoxins in cereals by liquid chromatography tandem mass spectrometry. Food Chem. 2012, 130, 1055–1060. [Google Scholar] [CrossRef]
  44. Bornet, A.; Teissedre, P. Chitosan, chitin-glucan and chitin effects on minerals (iron, lead, cadmium) and organic (ochratoxin A) contaminants in wines. Eur. Food Res. Technol. 2008, 226, 681–689. [Google Scholar] [CrossRef]
  45. Khajarern, J.; Khajarern, S.; Moon, T.; Lee, J. Effects of dietary supplementation of fermented chitin-chitosan (fermkit) on toxicity of mycotoxin in ducks. Asian-Australas. J. Anim. Sci. 2003, 16, 706–713. [Google Scholar] [CrossRef]
  46. Solís-Cruz, B.; Hernández-Patlán, D.; Beyssac, E.; Latorre, J.; Hernandez-Velasco, X.; Merino-Guzman, R.; Tellez, G.; López-Arellano, R. Evaluation of chitosan and cellulosic polymers as binding adsorbent materials to prevent aflatoxin B1, fumonisin B1, ochratoxin, trichothecene, deoxynivalenol, and zearalenone mycotoxicoses through an in vitro gastrointestinal model for poultry. Polymers 2017, 9, 529. [Google Scholar] [CrossRef] [PubMed]
Figure 1. Response surface plots showing the interaction effect of independent variables on the reduction of 8 mycotoxins (ac) AFB1, (d) AFB2, (ef) AFG1, (g) AFG2, (hi) OTA), (j) ZEA), (kl) FB1, (m) FB2.
Toxins 12 00115 g001aToxins 12 00115 g001b
Figure 2. Response optimization, parameters, predicted response (y) and desirability of multi-mycotoxin by CTS.
Toxins 12 00115 g002
Table 1. Experimental design (coded) of the central composite design (CCD).
Std OrderBlockRun OrderPt TypepHTime (h)Temperature (°C)
201034.5640
162−134.5840
173−134.5630
184−134.5650
195034.5640
136−133.0640
147−136.0640
158−134.5440
109126.0850
910123.0450
1111024.5640
1212024.5640
813123.0830
714126.0430
215116.0830
416113.0850
517014.5640
118113.0430
619014.5640
320116.0450
Table 2. Regression coefficient, R2, p-value and lack of fit test for the reduced response surface models.
Regression CoefficientDONAFB1AFB2AFG1AFG2OTAZEAHT-2T-2FB1FB2
b0-93.450.767.076.486.6850.37−53.0-72.281.8
b1-−6.61.1−3.9−3.3−0.20−0.2512.4-7.22.9
b2-−2.50.8822.12.71.93.3- 15.83.5
b3-−0.53.92.07−7.00.23−1.1--3.1−6.7
b12-−6.88.00-−21.8−1.71.9−31.9-2.2-
b22-−1.4−5.8-5.31.6−4.3-----
b32-−6.72--−12.23.14--- -
b12-−9.5−11.2−11.9-−0.7-----
b13-−8.3-15.73.31.4---5.5-
b230.9−9.2----−3.9--−10.5−5.0
R20.720.980.970.960.980.980.890.610.710.980.92
R2 (adj.)0.530.960.950.940.970.960.820.470.380.970.89
Regression (p-value)0.10 *0.000.000.000.010.000.000.1 *0.3 *0.000.00
Lack of fit (F-value)1.785.525.5127.843.460.796.051.570.026.080.7
Lack of fit (p-value)0.33 *0.09 *0.09 *0.1 *0.16 *0.63 *0.08 *0.39 *1.0 *0.08 *0.60 *
* Non-Significant (p > 0.05).
Table 3. Significant Probability (p-value and F-value) of the independent variable effects in the reduced response surface models.
Variablesp and F ValueLinear EffectsQuadratic EffectsInteraction Effects
x1x2x3x12x22x32x1x2x1x3x2x3
AFB1(y1)p-value0.000.0090.0110.0020.002-0.000.0000.00
F-value79.6611.210.8219.4418.47-127.3097.42120.34
AFB2(y2)p-value0.08a0.15a0.000.0000.00-0.000--
F-value3.722.4046.5759.3759.84-304.58--
AFG1(y3)p-value0.0010.0000.26a---0.000.00-
F-value25.90203.651.94---45.9674.78-
AFG2(y4)p-value0.0010.0040.000.000.000.00-0.002-
F-value−3.332.72−7.00−21.945.09−12.38-14.60-
OTA(y5)p-value0.21a0.000.15a0.000.000.000.0020.00-
F-value1.90a180.222.44a33.6432.26119.9318.8479.21-
ZEA(y6)p-value0.66a0.000.060.030.001---0.003
F-value0.234.044.106.2019.61---33.46
FB1(y7)p-value0.000.000.001----0.000.00
F-value98.15483.1219.42----45.99171.58
FB2(y8)p-value0.0000.0050.007-----0.00
F-value13.6920.6974.65-----40.01
a Non-Significant (p > 0.05).
Table 4. Levels of experimental variables established in accordance with central composite design (CCD).
Independent Variable Independent Variable Level
LowCenterHigh
pH356
Time (h)458
Temperature (°C)304050
Table 5. Comparison between predicted and experimental values based on the final reduced model.
ResponsepHTimeTemperaturey0yiy0yiDesirability
AFB1483594.35 ± 1.9492.95 ± 2.11.40.95
AFB2483545.90 ± 0.00346.58 ± 0.05−0.680.41
AFG1483582.11 ± 0.8479.48 ± 0.08−2.630.81
AFG2483584.29 ± 0.3183.11 ± 0.43−1.180.99
OTA483590.03 ± 0.587.96 ± 0.27−2.070.99
ZEA483551.30 ± 0.2152.61 ± 0.052.310.70
FB1483590.53 ± 0.4389.85 ± 0.52−0.680.85
FB2483590.18 ± 2.388.73 ± 0.12−1.450.68
y0: predicted value, yi: experimental value, y0yi: residue.
Table 6. Gradient elution program of the LC/MS-MS.
StepTime (min)Solvent A%Solvent B%Flow Rate (mL/min)
10–810900.4
28–1090100.4
310–1701000.4
417–2090100.4

