Multi-Mycotoxin Occurrence and Exposure Assessment Approach in Foodstuffs from Algeria

 , ,
, ,
Abstract
:1. Introduction
2. Results
2.1. Method Validation
2.2. Mycotoxins Occurrence Data
2.2.1. Occurrence of Trichothecenes
2.2.2. Occurrence of Zearalenone
2.2.3. Occurrence of Fumonisins
2.2.4. Occurrence of Citrinin
2.2.5. Occurrence of Emerging Mycotoxins
2.2.6. Co-Occurrence of Mycotoxins in Analysed Samples
2.3. Exposure Estimates
3. Conclusions
4. Materials and Methods
4.1. Reagents and Materials
4.2. Instruments and Equipment
4.3. Samples
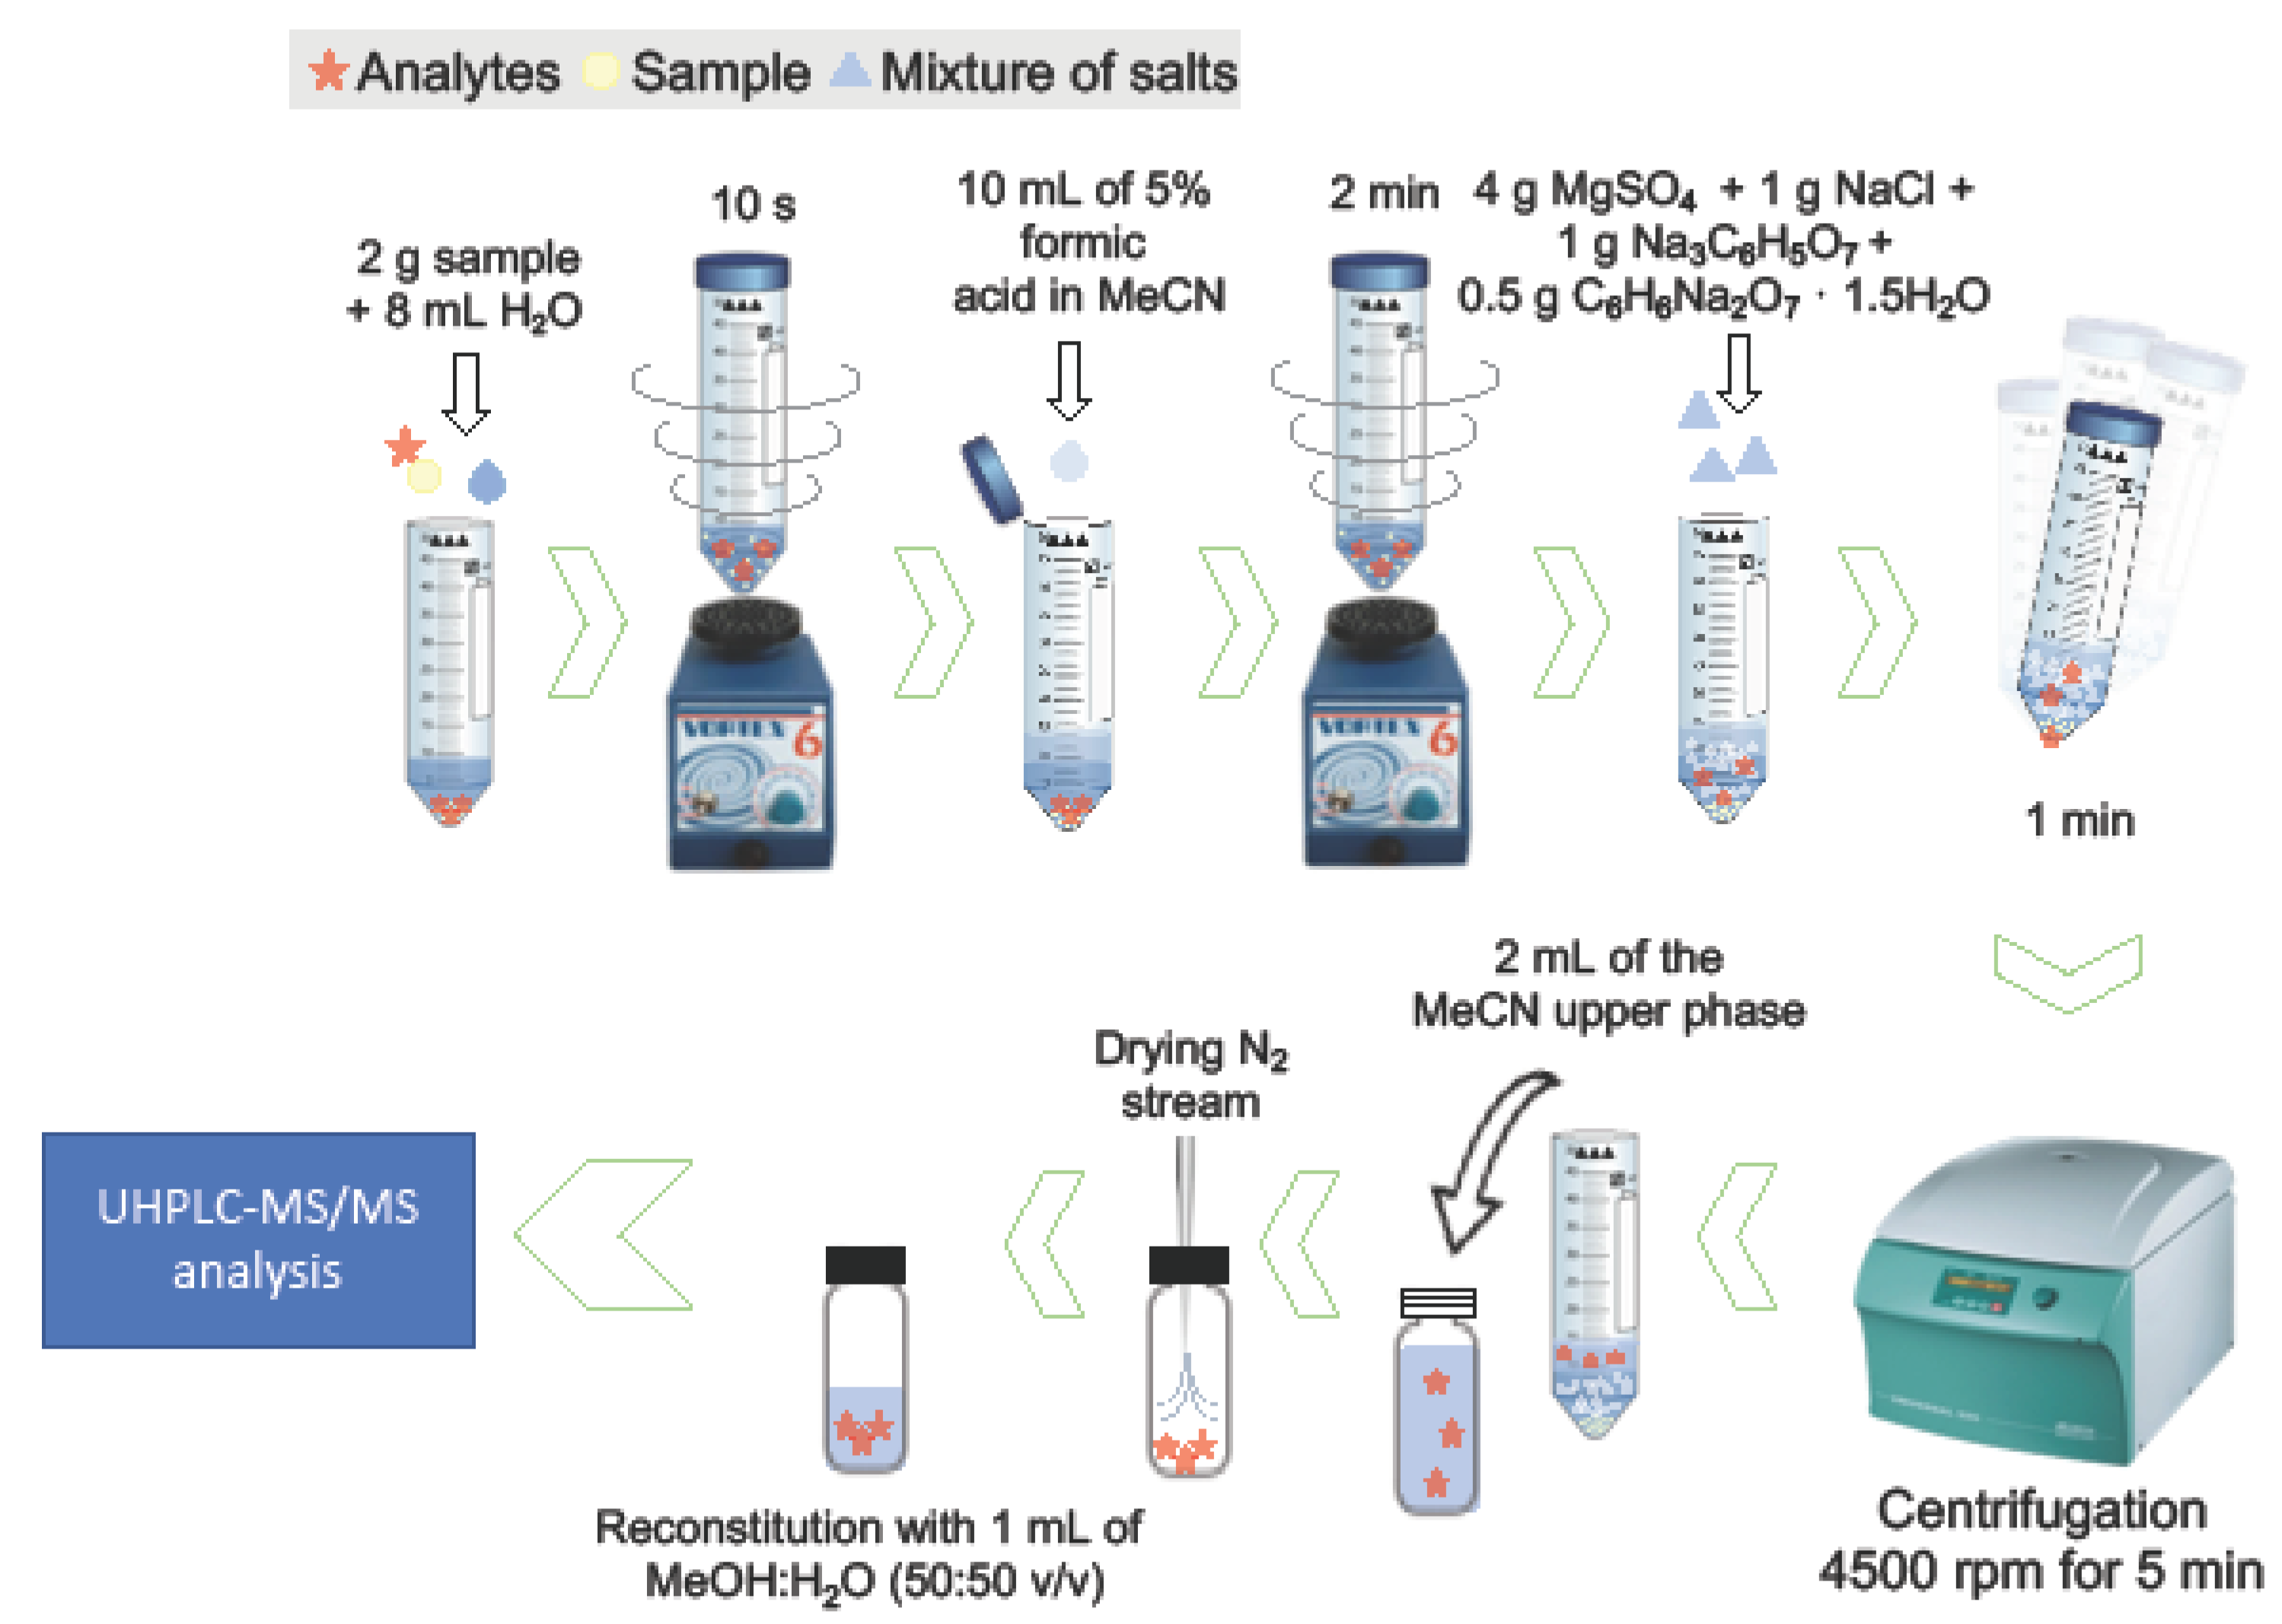
4.4. Mycotoxins Extraction Procedure
4.5. Ultra-High Performance Liquid Chromatography Coupled to Tandem Mass Spectrometry (UHPLC-MS/MS) Analysis
Supplementary Materials
Author Contributions
Funding
Conflicts of Interest
References
- Ostry, V.; Malir, F.; Toman, J.; Grosse, Y. Mycotoxins as human carcinogens—The IARC Monographs classification. Mycotoxin Res. 2017, 33, 65–73. [Google Scholar] [CrossRef] [PubMed]
- Zain, M.E. Impact of mycotoxins on humans and animals. J. Saudi Chem. Soc. 2011, 15, 129–144. [Google Scholar] [CrossRef] [Green Version]
- De Boevre, M.; Diana Di Mavungu, J.; Landschoot, S.; Audenaert, K.; Eeckhoutn, M.; Maene, P.; Haesaert, G.; De Saeger, S. Natural occurrence of mycotoxins and their masked forms in food and feed products. World Mycotoxin J. 2012, 5, 207–219. [Google Scholar] [CrossRef]
- Otto, K.; Santini, A.; Oancea, S. Recent aflatoxin survey data in milk and milk products: A review. Int. J. Dairy Technol. 2017, 70, 1–12. [Google Scholar] [CrossRef]
- Mikušová, P.; Šrobárová, A.; Sulyok, M.; Santini, A. Fusarium fungi and associated metabolites presence on grapes from Slovakia. Mycotoxin Res. 2013, 29, 97–102. [Google Scholar] [CrossRef] [Green Version]
- Gruber-Dorninger, C.; Novak, B.; Nagl, V.; Berthiller, F. Emerging mycotoxins: Beyond traditionally determined food contaminants. J. Agric. Food Chem. 2017, 65, 7052–7070. [Google Scholar] [CrossRef]
- Jajić, I.; Dudaš, T.; Krstovic, S.; Krska, R.; Sulyok, M.; Bagi, F.; Savić, Z. Emerging Fusarium mycotoxins fusaproliferin, beauvericin, enniatins, and moniliformin in Serbian maize. Toxins 2019, 11, 357. [Google Scholar] [CrossRef] [Green Version]
- Mahnine, N.; Meca, G.; Elabidi, A.; Fekhaoui, M.; Saoiabi, A.; Font, G.; Mañes, J.; Zinedine, A. Further data on the levels of emerging Fusarium mycotoxins enniatins (A, A1, B, B1), beauvericin and fusaproliferin in breakfast and infant cereals from Morocco. Food Chem. 2011, 124, 481–485. [Google Scholar] [CrossRef]
- Grenier, B.; Oswald, I.P. Mycotoxin co-contamination of food and feed: Meta-analysis of publications describing toxicological interactions. World Mycotoxin J. 2011, 4, 285–313. [Google Scholar] [CrossRef]
- Lee, H.J.; Ryu, D. Worldwide occurrence of mycotoxins in cereals and cereal-derived food products: Public health perspectives of their co-occurrence. J. Agric. Food Chem. 2017, 65, 7034–7051. [Google Scholar] [CrossRef]
- Assunção, R.; Silva, M.J.; Alvito, P. Challenges in risk assessment of multiple mycotoxins in food. World Mycotoxin J. 2016, 9, 791–811. [Google Scholar] [CrossRef] [Green Version]
- Alassane-Kpembi, I.; Schatzmayr, G.; Taranu, I.; Marin, D.; Puel, O.; Oswald, I.P. Mycotoxins co-contamination: Methodological aspects and biological relevance of combined toxicity studies. Crit. Rev. Food Sci. Nutr. 2017, 57, 3489–3507. [Google Scholar] [CrossRef] [PubMed]
- De Ruyck, K.; De Boevre, M.; Huybrechts, I.; De Saeger, S. Dietary mycotoxins, co-exposure, and carcinogenesis in humans: Short review. Mutat. Res. Rev. Mutat. Res. 2015, 766, 32–41. [Google Scholar] [CrossRef] [PubMed] [Green Version]
- Smith, M.C.; Madec, S.; Coton, E.; Hymery, N. Natural co-occurrence of mycotoxins in foods and feeds and their in vitro combined toxicological effects. Toxins 2016, 8, 94. [Google Scholar] [CrossRef] [PubMed]
- Tavares, A.M.; Alvito, P.; Loureiro, S.; Louro, H.; Silva, M.J. Multi-mycotoxin determination in baby foods and in vitro combined cytotoxic effects of aflatoxin M1 and ochratoxin A. World Mycotoxin J. 2013, 6, 375–388. [Google Scholar] [CrossRef]
- Wan, L.Y.; Turner, P.C.; El-Nezami, H. Individual and combined cytotoxic effects of Fusarium toxins (deoxynivalenol, nivalenol, zearalenone and fumonisins B1) on swine jejunal epithelial cells. Food Chem. Toxicol. 2013, 57, 276–283. [Google Scholar] [CrossRef]
- European Commission (EC). Commission recomendations of 27 March 2013 on the presence of T-2 and HT-2 toxin in cereals and cereal products. Off. J. Eur. Union. L 2013, 91, 12–15. [Google Scholar]
- European Commission (EC). Commission regulation (EC) No 1881/2006 of 19 December 2006 setting maximum levels for certain contaminants in foodstuffs. Off. J. Eur. Union. 2006, 364, 5–24. [Google Scholar]
- JEFCA. Joint FAO/WHO Standards Programme Codex Committee on Contaminants in Food. Working Document for Information and Use in Discussions Related to Contaminants and Toxins in the GSCTFF. 2018. Available online: http//www.fao.org/fao-who-codexalimentarius/sh-proxy/en/?lnk=1&url=https%253A%252F%252Fworkspace.fao.org%252Fsites%252Fcodex%252FMeetings%252FCX-735-12%252FWD%252Fcf12_INF01x.pdf (accessed on 6 December 2019).
- JEFCA. Joint FAO/WHO Expert Committee on Food Additives. Summary and Conclusion of Eighty-Third Meeting of the JEFCA. 2016. Available online: http://www.fao.org/3/BQ821E/bq821e.pdf (accessed on 6 December 2019).
- U.S. Food and Drug Administration. Compliance Policy Guide Sec. 555.400 Foods—Adulteration with Aflatoxin. Available online: https://www.fda.gov/Food/GuidanceRegulation/GuidanceDocumentsRegulatoryInformation/ChemicalContaminantsMetalsNaturalToxinsPesticides/default.htm (accessed on 20 February 2020).
- U.S. Food and Drug Administration. Guidance for Industry. Fumonisin Levels in Human Foods and Animal Feeds. Available online: https://www.fda.gov/Food/GuidanceRegulation/GuidanceDocumentsRegulatoryInformation/ChemicalContaminantsMetalsNaturalToxinsPesticides/default.htm (accessed on 20 February 2020).
- Canadian Food Inspection Agency. RG-8 Regulatory Guidance. Contaminants in Feed (Formerly RG-1, Chapter 7), Section 1: Mycotoxins in Livestock Feed. Available online: http://www.inspection.gc.ca/animals/feeds/regulatory-guidance/rg8/eng/1347383943203/1347384015909 (accessed on 20 February 2020).
- Food and Agricultural Materials Inspection Centre (FAMIC). Aflatoxin. Available online: http://www.famic.go.jp/ffis/oie/obj/hc_aflatoxin.pdf (accessed on 20 February 2020).
- Food and Agricultural Materials Inspection Centre (FAMIC). Regulation Value of Pesticides, Heavy Metals and Mycotoxins (Administrative Guideline). Available online: http://www.famic.go.jp/ffis/feed/r_safety/r_feeds_safety22.html (accessed on 20 February 2020).
- China Food Safety National Standard. Maximum Levels of Mycotoxins in Food, Released 17 March 2017, Implemented 17 September 2017. Available online: https://www.fas.usda.gov/data/china-china-releases-standard-maximum-levels-mycotoxins-foods (accessed on 20 February 2020).
- Bulletin Officiel. Arrêté Conjoint du Ministre de L’agriculture et de la Pêche Maritime et du Ministre de la Santé n° 1643-16 du 23 Chaabane 1437 (30 Mai 2016) Fixant les Limites Maximales Autorisées des Contaminants dans les Produits Primaires et les Produits Alimentaires. Available online: http://www.onssa.gov.ma/fr/images/reglementation/transversale/ARR.1643-16.FR.pdf (accessed on 20 February 2020).
- Santini, A.; Meca, G.; Ritieni, A. Fusaproliferin, beauvericin, and enniatins: Occurrence in food—A review. World Mycotoxin J. 2012, 5, 71–81. [Google Scholar] [CrossRef]
- Santini, A.; Raiola, A.; Meca, G.; Ritieni, A. Aflatoxins, ochratoxins, trichothecenes, patulin, fumonisins and beauvericin in finished products for human consumption. J. Clin. Toxicol. 2015, 5, 265. [Google Scholar] [CrossRef] [Green Version]
- Eskola, M.; Kos, G.; Elliott, C.T.; Hajšlová, J.; Mayar, S.; Krska, R. Worldwide contamination of food-crops with mycotoxins: Validity of the widely cited ‘FAO estimate’ of 25%. Crit. Rev. Food Sci. Nutr. 2019, 3, 1–17. [Google Scholar] [CrossRef] [PubMed]
- Tantaoui-Elaraki, A.; Riba, A.; Oueslati, S.; Zinedine, A. Toxigenic fungi and mycotoxin occurrence and prevention in food and feed in northern Africa–A review. World Mycotoxin J. 2018, 11, 385–400. [Google Scholar] [CrossRef]
- Van Egmond, H.P.; Schothorst, R.C.; Jonker, M.A. Regulations relating to mycotoxins in food. Anal. Bioanal. Chem. 2007, 389, 147–157. [Google Scholar] [CrossRef] [PubMed] [Green Version]
- Berthiller, F.; Cramer, B.; Iha, M.H.; Krska, R.; Lattanzio, V.M.T.; MacDonald, S.; Malone, R.J.; Maragos, C.; Solfrizzo, M.; Stranska-Zachariasova, M.; et al. Developments in mycotoxin analysis: An update for 2016–2017. World Mycotoxin J. 2018, 11, 5–31. [Google Scholar] [CrossRef] [Green Version]
- Santini, A.; Ferracane, R.; Meca, G.; Ritieni, A. Overview of analytical methods for beauvericin and fusaproliferin in food matrices. Anal. Bioanal. Chem. 2009, 395, 1253–1260. [Google Scholar] [CrossRef] [Green Version]
- Santini, A.; Ferracane, R.; Somma, M.C.; Somma, A.; Aragon, A.; Ritieni, A. Multitoxin extraction and detection of thricotecenes in cereals: An improved LC-MS/MS approach. J. Sci. Food Agric. 2009, 89, 1145–1153. [Google Scholar] [CrossRef]
- Arroyo-Manzanares, N.; Huertas-Pérez, J.F.; García-Campaña, A.M.; Gámiz-Gracia, L. Review of sample treatments and the state-of-the-art of analytical techniques for mycotoxins in food. In Analysis of Food Toxins and Toxicants; Wong, Y.-C., Lewis, R.J., Eds.; John Wiley & Sons Ltd.: New York, NY, USA, 2017; pp. 51–102. [Google Scholar] [CrossRef]
- European Commission (EC). Commission regulation (EC) No 401/2006 of 23 February 2006 laying down the methods of sampling and analysis for the official control of the levels of mycotoxins in foodstuffs. Off. J. Eur. Union. 2006, L70, 12–34. [Google Scholar]
- Bouafifssa, Y.; Manyes, L.; Rahouti, M.; Mañes, J.; Berrada, H.; Zinedine, A.; Fernández-Franzón, M. Multi-occurrence of twenty mycotoxins in pasta and a risk assessment in the Moroccan population. Toxins 2018, 10, 432. [Google Scholar] [CrossRef] [Green Version]
- Pleadin, J.; Vahčić, N.; Perši, N.; Ševelj, D.; Markov, K.; Frece, J. Fusarium mycotoxins’ occurrence in cereals harvested from Croatian fields. Food Control 2013, 32, 49–54. [Google Scholar] [CrossRef]
- Juan, C.; Ritieni, A.; Mañes, J. Occurrence of Fusarium mycotoxins in Italian cereal and cereal products from organic farming. Food Chem. 2013, 141, 1747–1755. [Google Scholar] [CrossRef]
- Zaied, C.; Zouaoui, N.; Bacha, H.; Abid, S. Natural occurrence of zearalenone in Tunisian wheat grains. Food Control 2012, 25, 773–777. [Google Scholar] [CrossRef]
- Savi, G.D.; Piacentini, K.C.; Rocha, L.O.; Carnielli-Queiroz, L.; Furtado, B.G.; Scussel, R.; Zanoni, E.T.; Machado de Ávila, R.A.; Corrêa, B.; Angioletto, E. Incidence of toxigenic fungi and zearalenone in rice grains from Brazil. Int. J. Food Microbiol. 2018, 270, 5–13. [Google Scholar] [CrossRef] [PubMed]
- Chilaka, C.A.; De Boevre, M.; Atanda, O.O.; De Saeger, S. Occurrence of Fusarium mycotoxins in cereal crops and processed products (Ogi) from Nigeria. Toxins 2016, 8, 342. [Google Scholar] [CrossRef] [PubMed] [Green Version]
- De Boevre, M.; Landschoot, S.; Audenaert, K.; Maene, P.; Diana Di Mavungu, J.; Eeckhout, M.; Haesaert, G.; De Saeger, S. Occurrence and within field variability of Fusarium mycotoxins and their masked forms in maize crops in Belgium. World Mycotoxin J. 2014, 7, 91–102. [Google Scholar] [CrossRef]
- Zinedine, A.; Brera, C.; Elakhdari, S.; Catano, C.; Debegnach, F.; Angelini, S.; De Santis, B.; Faid, M.; Benlemlih, M.; Minardi, V.; et al. Natural occurrence of mycotoxins in cereals and spices commercialized in Morocco. Food Control 2006, 17, 868–874. [Google Scholar] [CrossRef]
- Ghali, R.; Ghorbel, H.; Hedilli, A. Fumonisin determination in Tunisian foods and feeds. ELISA and HPLC methods comparison. J. Agric. Food Chem. 2009, 57, 3955–3960. [Google Scholar] [CrossRef]
- Bryła, M.; Waśkiewicz, A.; Podolska, G.; Szymczyk, K.; Jędrzejczak, R.; Damaziak, K.; Sułek, A. Occurrence of 26 mycotoxins in the grain of cereals cultivated in Poland. Toxins 2016, 8, 160. [Google Scholar] [CrossRef] [Green Version]
- Phoku, J.Z.; Dutton, M.F.; Njobeh, P.B.; Mwanza, M.; Egbuta, M.A.; Chilaka, C.A. Fusarium infection of maize and maize-based products and exposure of a rural population to fumonisin B1 in Limpopo Province, South Africa. Food Addit. Contam. Part A 2012, 29, 1743–1751. [Google Scholar] [CrossRef]
- Tsehaye, H.; Brurberg, M.B.; Sundheim, L.; Assefa, D.; Tronsmo, A.; Tronsmo, A.M. Natural occurrence of Fusarium species and fumonisin on maize grains in Ethiopia. Eur. J. Plant Pathol. 2017, 147, 141–155. [Google Scholar] [CrossRef]
- Houbraken, J.; De Vries, R.P.; Samson, R.A. Modern taxonomy of biotechnologically important Aspergillus and Penicillium species. Adv. Appl. Microbiol. 2014, 86, 199–249. [Google Scholar] [CrossRef]
- Meca, G.; Zinedine, A.; Blesa, J.; Font, G.; Mañes, J. Further data on the presence of Fusarium emerging mycotoxins enniatins, fusaproliferin and beauvericin in cereals available on the Spanish markets. Food Chem. Toxicol. 2010, 48, 1412–1416. [Google Scholar] [CrossRef] [PubMed]
- Oueslati, S.; Romero-González, R.; Lasram, S.; Garrido-Frenich, A.; Martínez-Vidal, J.L. Multi-mycotoxin determination in cereals and derived products marketed in Tunisia using ultra-high performance liquid chromatography coupled to triple quadrupole mass spectrometry. Food Chem. Toxicol. 2012, 50, 2376–2381. [Google Scholar] [CrossRef] [PubMed]
- Blesa, J.; Moltó, J.C.; El Akhdari, S.; Mañes, J.; Zinedine, A. Simultaneous determination of Fusarium mycotoxins in wheat grain from Morocco by liquid chromatography coupled to triple quadrupole mass spectrometry. Food Control 2014, 46, 1–5. [Google Scholar] [CrossRef]
- Rodríguez-Carrasco, Y.; Ruiz, M.J.; Font, G.; Berrada, H. Exposure estimates to Fusarium mycotoxins through cereals intake. Chemosphere 2013, 93, 2297–2303. [Google Scholar] [CrossRef] [PubMed]
- International Programme on Chemical Safety (IPCS). Principles and Methods for the Risk Assessment of Chemicals in Food. In Environmental Health Criteria 240; WHO: Stuttgart, Germany, 2009; Available online: https://www.who.int/foodsafety/publications/chemical-food/en/ (accessed on 6 December 2019).
- FAO Statistics Division (FAOSTAT). Food and Agricultural Commodities Production. Available online: http://faostat.fao.org/site/339/default.aspx (accessed on 10 January 2019).
- Kimanya, M.; De Meulenaer, B.; Tiisekwa, B.; Ndomondo-Sigonda, M.; Kolsteren, P. Human exposure to fumonisins from home grown maize in Tanzania. World Mycotoxin J. 2008, 1, 307–313. [Google Scholar] [CrossRef]
- Adetunji, M.C.; Atanda, O.O.; Ezekiel, C.N. Risk assessment of mycotoxins in stored maize grains consumed by infants and young children in Nigeria. Children 2017, 4, 58. [Google Scholar] [CrossRef]
- Arroyo-Manzanares, N.; Huertas-Pérez, J.F.; García-Campaña, A.M.; Gámiz-Gracia, L. Simple methodology for the determination of mycotoxins in pseudocereals, spelt and rice. Food Control 2014, 36, 94–101. [Google Scholar] [CrossRef]


| Mycotoxin | Commodity | Maximum Level (µg/kg) |
|---|---|---|
| European Union [17,18] | ||
| Aflatoxin B1 | Cereals and cereal products | 2 |
| Aflatoxins a | Cereals and cereal products | 4 |
| Maize | 10 | |
| Ochratoxin A | Unprocessed cereals | 5 |
| Zearalenone | Unprocessed maize | 350 |
| Unprocessed cereals other than maize | 100 | |
| Fumonisins B1 + B2 | Unprocessed maize | 4000 |
| Deoxynivalenol | Unprocessed cereals other than durum wheat, oats, maize | 1250 |
| Unprocessed durum wheat, oats and maize | 1750 | |
| T-2 + HT-2 | Unprocessed barley and maize | 200 |
| Unprocessed oats | 1000 | |
| Unprocessed wheat, rye and other cereals | 100 | |
| United States of Americ [21,22] | ||
| Aflatoxin B1 | All food crops | 15 |
| Fumonisins B1 + B2 + B3 | Unprocessed maize | 4000 |
| Canada [23] | ||
| Deoxynivalenol | Unprocessed wheat | 2000 |
| Japan [24,25] | ||
| Aflatoxin B1 | All food crops | 10 |
| Deoxynivalenol | Unprocessed wheat | 1100 b |
| China [26] | ||
| Aflatoxin B1 | Unprocessed maize | 20 |
| Rice (brown rice) | 10 | |
| Unprocessed wheat barley, other cereals | 5 | |
| Deoxynivalenol | Maize, barley, wheat, other cereals | 1000 |
| Ochratoxin A | Unprocessed cereals | 5 |
| Zearalenone | Unprocessed wheat and maize | 60 |
| Morocco [27] | ||
| Aflatoxin B1 | Cereals and cereal products | 2 |
| Aflatoxins a | Cereals and cereal products | 4 |
| Ochratoxin A | Unprocessed cereals | 5 |
| Deoxynivalenol | Unprocessed durum wheat, oats and maize | 1750 |
| Zearalenone | Unprocessed maize | 200 |
| Barley (n = 30) | Maize (n = 30) | Rice (n = 30) | Wheat (n = 30) | |||||||||||||
|---|---|---|---|---|---|---|---|---|---|---|---|---|---|---|---|---|
| I (%) a | Mean b | LOD-LOQ c | Range d | I (%) a | Mean b | LOD-LOQ c | Range d | I (%) a | Mean b | LOD-LOQ c | Range d | I (%) a | Mean b | LOD-LOQ c | Range d | |
| Analytes | (µg/kg) | (µg/kg) | (µg/kg) | (µg/kg) | ||||||||||||
| FB1 | nd | nd | – | – | 29 (96.6) | 14,812 | 289–42,143 | nd | nd | – | – | nd | nd | – | – | |
| FB2 | nd | nd | – | – | 27 (90) | 2789 | – | 27.5–8603 | nd | nd | – | – | nd | nd | – | – |
| HT-2 | nd | nd | 9 | – | nd | nd | – | – | nd | nd | – | – | 7 (23) | 18.1 | 3 | 8.4–36.7 |
| T-2 | nd | nd | – | – | 30 (100) | 24.9 | – | 24.6–25.7 | nd | nd | – | – | 30 (100) | 21.8 | – | 16.6–47.2 |
| DON | nd | nd | – | – | 13 (43) | 632 | – | 47.6–2055 | nd | nd | – | – | 27 (90) | 588 | 1 | 68.3–1363 |
| ZEN | nd | nd | 2 | – | 7 (23.3) | 109 | – | 20.4–579 | 6 (20) | 9.9 | 17 | 8.6–15.5 | 19 (63.3) | 102 | 9 | 9.6–295 |
| F-X | 3 (10) | 190 | 2 | 142–284 | 24 (80) | 281 | 1 | 177–477 | nd | nd | – | – | 3 (10) | 152 | 7 | 139–159 |
| OTA | nd | nd | – | – | nd | nd | – | – | nd | nd | – | – | nd | nd | – | – |
| CIT | 9 (30) | 26.2 | 2 | 10.9–52.0 | 25 (83.3) | 32.7 | – | 8.6–273 | nd | nd | 23 | – | 15 (50) | 16.8 | 14 | 9.8–32.3 |
| STE | nd | nd | – | – | nd | nd | – | – | nd | nd | – | – | nd | nd | – | – |
| BEA | nd | nd | – | – | 25 (83.3) | 3.8 | 4 | 0.85–31.4 | nd | nd | – | – | 21 (70) | 155.4 | – | 2.8–486 |
| ENNA | nd | nd | – | – | nd | nd | – | – | nd | nd | – | – | 7 (23.3) | 28.3 | – | 8.4–87.6 |
| ENNA1 | nd | nd | – | – | 3 (10) | 56.4 | – | 11.5–103 | nd | nd | – | – | 14 (46.7) | 107 | 3 | 4.0–395 |
| ENNB | nd | nd | – | – | nd | nd | – | – | nd | nd | – | – | 18 (60) | 1668 | – | 1.2–5288 |
| ENNB1 | nd | nd | – | – | 2 (6) | 60.9 | – | 15.0–107 | nd | nd | – | – | 21 (70) | 469 | – | 19.5–4569 |
| Total | 12 (40) | 30 (100) | 6 (20) | 30 (100) | ||||||||||||
| Barley (n = 30) | Maize (n = 30) | Rice (n = 30) | Wheat (n = 30) | Analytical Method | LOQ (µg/kg) | Ref. | |||||||||
| I (%) a | Range c (μg/kg) | Mean b (μg/kg) | I (%) a | Range c (μg/kg) | Mean b (μg/kg) | I (%) a | Range c (μg/kg) | Mean (μg/kg) | I (%) a | Range c (μg/kg) | Mean b (μg/kg) | ||||
| FB1 | nd | – | nd | 29 (96.6) | 289–42,143 | 14812 | nd | – | nd | nd | – | nd | Ultra-high performance liquid chromatography coupled to tandem mass spectrometry (UHPLC-MS/MS) | 2.6–4.8 | This work |
| FB2 | nd | – | nd | 27 (90) | 27.5–8603 | 2789 | nd | – | nd | nd | – | nd | 2.2–10 | ||
| HT–2 | nd | – | nd | nd | – | nd | nd | – | nd | 7 (23) | 8.4–36.7 | 18.1 | 2.8–9.9 | ||
| T–2 | nd | – | nd | 30 (100) | 24.6–25.7 | 24.9 | nd | – | nd | 30 (100) | 16.6–47.2 | 21.8 | 2.3–4.4 | ||
| DON | nd | – | nd | 13 (43) | 47.6–2055 | 632 | nd | – | nd | 27 (90) | 68.3–1363 | 588 | 4.2–4.8 | ||
| ZEN | nd | – | nd | 7 (23.3) | 20.4–579 | 109 | 6 (20) | 8.6–15.5 | 9.9 | 19 (63.3) | 9.6–295 | 102 | 4.3–9.7 | ||
| F–X | 3 (10) | 142–284 | 190 | 24 (80) | 177–477 | 281 | nd | – | nd | 3 (10) | 139–159 | 152 | 90–174 | ||
| OTA | nd | – | nd | nd | – | nd | nd | – | nd | nd | – | nd | 20–92 | ||
| CIT | 9 (30) | 10.9–52.0 | 26.2 | 25 (83.3) | 8.6–273 | 32.7 | nd | – | nd | 15 (50) | 9.8–32.3 | 16.8 | 8.4–23 | ||
| STE | nd | – | nd | nd | – | nd | nd | – | nd | nd | – | nd | 0.6–1.3 | ||
| BEA | nd | – | nd | 25 (83.3) | 0.85–31.4 | 3.8 | nd | – | nd | 21 (70) | 2.8–486 | 155.4 | 0.6–1.3 | ||
| ENNA | nd | – | nd | nd | – | nd | nd | – | nd | 7 (23.3) | 8.4–87.6 | 28.3 | 0.5–1.2 | ||
| ENNA1 | nd | – | nd | 3 (10) | 11.5–103 | 56.4 | nd | – | nd | 14 (46.7) | 4.0–395 | 107 | 1.4–2.7 | ||
| ENNB | nd | – | nd | nd | – | nd | nd | – | nd | 18 (60) | 1.2–5288 | 1668 | 1.2–3.8 | ||
| ENNB1 | nd | – | nd | 2 (6) | 15.0–107 | 60.9 | nd | – | nd | 21 (70) | 19.5–4569 | 469 | 2.6–4.4 | ||
| Barley (n = 9) | Oat (n = 7) | Rye (n = 11) | Wheat (n = 57) | Analytical Method | LOQ (µg/kg) | Ref. | |||||||||
| I (%) a | Range c (μg/kg) | Mean b (μg/kg) | I (%) a | Range c (μg/kg) | Mean b (μg/kg) | I (%) a | Range c (μg/kg) | Mean (μg/kg) | I (%) a | Range c (μg/kg) | Mean b (μg/kg) | ||||
| DON | 1 (11) | up to 35.5 | 4 (57) | 10.3–83 | 29.9 | 5 (45.5) | 16.5–79.6 | 23.23 | 16 (28) | 9.6–99.6 | 10.96 | LC– MS/MS | 10 | [40] | |
| 3–AcDON | nd | – | nd | 1 (14.2) | 5.23 | 5.24 | nd | – | nd | nd | – | nd | 15 | ||
| 15–AcDON | nd | – | nd | nd | – | nd | nd | – | nd | 2 (3.5) | 10.8–29.13 | 0.64 | 15 | ||
| FUS–X | 4 (44) | 27.5–47.3 | 18.43 | 3 (42.8) | 26–75 | 23 | 5 (45.5) | 42.4–70.2 | 28.52 | 14 (24) | 12.50–102 | 18.44 | 15 | ||
| NIV | 3 (33) | 21.7–106 | 25.15 | 4 (57) | 45.5–50.4 | 27.13 | 2 (18) | 33.9–34.4 | 56.9 | 11 (19) | 12–106 | 8.86 | 15 | ||
| DAS | nd | – | nd | nd | – | nd | nd | – | nd | nd | – | nd | 10 | ||
| NEO | nd | – | nd | nd | – | nd | nd | – | nd | nd | – | nd | 5 | ||
| HT–2 | nd | – | nd | nd | – | nd | 3 (27.2) | 6.98–50.3 | 5.34 | 3 (5.2) | 6.78–60.10 | 4.44 | 10 | ||
| T–2 | nd | – | nd | nd | – | nd | nd | – | nd | 2 (3.5) | 7.14–17.8 | 0.39 | 5 | ||
| ZEN | 2 (22) | 11.15 | 11.16 | nd | – | nd | nd | – | nd | 5 (8.7) | 2.35–27.15 | 12.17 | 5 | ||
| α –ZEN | nd | – | nd | nd | – | nd | nd | – | nd | nd | – | nd | 5 | ||
| β –ZEN | nd | – | nd | nd | – | nd | nd | – | nd | nd | – | nd | 5 | ||
| BEA | nd | – | nd | 4 (57) | 7.2–41 | 8.8 | 5 (45.5) | 8.9–16.5 | 2.72 | 5 (8.7) | 9.6–35 | 12.8 | 15 | ||
| ENNB | nd | – | nd | 3 (42.8) | 5.5–97 | 2.8 | 6 (54.4) | 6.7–45 | 5.8 | 16 (28) | 5.5–97 | 20.2 | 15 | ||
| ENNB1 | 2 (22) | 5.5–7.3 | 1.4 | nd | – | nd | nd | – | nd | 2 (3.5) | 5.47–33.1 | 0.43 | 15 | ||
| ENNB4 | 8 (88.9) | 6.6–60 | 15.7 | 4 (57) | 20–284.2 | 50.7 | 4 (36.3) | 23.4–74 | 13.8 | 18 (31) | 5.7–110.2 | 38.44 | 15 | ||
| ENNA | nd | – | nd | nd | – | nd | 4 (36.3) | 7.8–9.8 | 7.1 | 6 (10) | 8.4–29.8 | 1.56 | 10 | ||
| ENNA1 | nd | – | nd | 2 (28.5) | 9–45.5 | 8.7 | nd | – | nd | 11 (19) | 5.3–55 | 0.74 | 15 | ||
| Barley (n = 5) | Sorghum (n = 3) | Processed cereals (n = 13) | Wheat (n = 34) | Analytical Method | LOQ (µg/kg) | Ref. | |||||||||
| I (%) a | Range c (μg/kg) | Mean b (μg/kg) | I (%) a | Range c (μg/kg) | Mean b (μg/kg) | I (%) a | Range c (μg/kg) | Mean (μg/kg) | I (%) a | Range c (μg/kg) | Mean b (μg/kg) | ||||
| AFB1 | nd | – | nd | 66.6 | 14.4–79.9 | 46.7 | nd | – | nd | nd | – | nd | UHPLC–MS/MS | 1 | [52] |
| AFG2 | 4 (80) | 23.1–52.4 | 35.5 | 3 (100) | 13–36.8 | 24.6 | nd | – | nd | 4 (11) | 5.2–8.7 | 6.6 | 1 | ||
| HT–2 | 3 (60) | 4.9–11 | 7.6 | nd | – | nd | nd | – | nd | 4 (11) | 5.3–7.1 | 5.8 | 5 | ||
| FB1 | 1 (20) | up to 63.1 | na | 2 (66.6) | 6.4–120 | na | nd | – | nd | nd | – | nd | 5 | ||
| FB2 | nd | – | nd | 1 (33.3) | 61.5 | 61.5 | 1 (7.6) | 6.4 | 6.4 | 1 (3) | 8.7 | 8.7 | 5 | ||
| OTA | nd | – | nd | nd | – | nd | 1 (7.6) | 5 | 5 | nd | – | nd | 5 | ||
| Barley (n = 4) | Maize (n = 28) | Rice (n = 1) | Wheat (n = 21) | Analytical Method | LOQ (µg/kg) | Ref. | |||||||||
| I (%) a | Range c (μg/kg) | Mean b (μg/kg) | I (%) a | Range c (μg/kg) | Mean b (μg/kg) | I (%) a | Range c (μg/kg) | Mean (μg/kg) | I (%) a | Range c (μg/kg) | Mean b (μg/kg) | ||||
| ENNA | nd | – | nd | nd | – | nd | I (%)a | Rangeb (μg/kg) | Meanc (μg/kg) | nd | – | nd | LC–DAD | 6 | [51] |
| ENNA1 | na | up to 361,570 | 148,160 | na | up to 813,010 | 167,700 | nd | – | nd | na | up to 634,850 | 225370 | 4 | ||
| ENNB | 1 (25) | up to 21,370 | 21370 | na | up to 6310 | 4470 | 1(100) | up to 814,410 | 814420 | nd | – | nd | 4 | ||
| ENNB1 | 1 (25) | up to 4340 | 4340 | na | up to 21,370 | 21370 | 1(100) | up to 7950 | 7950 | nd | – | nd | 5 | ||
| BEA | 2 (50) | up to 6940 | 4870 | 6 (21.4) | up to 9310 | 5720 | nd | – | nd | 9 (42) | up to 3500 | 2300 | 5 | ||
| FUS | nd | – | nd | na | up to 2470 | 2470 | 1(100) | up to 11780 | 11780 | na | up to 6630 | 3120 | 6 | ||
| Maize (n =136) | Sorghum (n =110) | Millet (n = 87) | Ogi (n = 30) | Analytical Method | LOQ (µg/kg) | Ref. | |||||||||
| I (%) a | Range c (μg/kg) | Mean b (μg/kg) | I (%) a | Range c (μg/kg) | Mean b (μg/kg) | I (%) a | Range c (μg/kg) | Mean (μg/kg) | I (%) a | Range c (μg/kg) | Mean b (μg/kg) | ||||
| FB1 | (65) | up to 8222 | 541 | (8) | up to 78 | 64 | (9) | up to 18.172 | 2333 | (93) | up to 1903 | 590 | LC–MS/MS | 16.4–20 | [43] |
| FB2 | (54) | up to 2885 | 376 | (2) | up to 55 | 48 | (13) | up to 3892 | 609 | (87) | up to 1283 | 472 | 22.6–24.2 | ||
| FB3 | (43) | up to 445 | 117 | (2) | up to 46 | 38 | nd | – | nd | (77) | up to 371 | 121 | 28 | ||
| DON | (16) | up to 225 | 99 | (3) | up to 119 | 100 | (13) | up to 543 | 151 | (13) | up to 74 | 61 | 14–24 | ||
| 15–AcDON | nd | – | nd | (2) | up to 44 | 39 | (1) | up to 11 | 11 | nd | – | nd | 8.8–14 | ||
| DON–3G | nd | – | nd | (23) | up to 63 | 24 | nd | – | nd | (17) | up to 44 | 30 | 7.54–30.6 | ||
| ZEN | (1) | up to 65 | 65 | (1) | up to 38 | 38 | (14) | up to 1399 | 419 | (3) | up to 39 | 39 | 6.5–7.7 | ||
| ZEN–14G | (9) | up to 24 | 21 | (3) | up to 22 | 19 | (6) | up to 34 | 23 | (3) | up to 31 | 31 | 9.2–10.2 | ||
| α –ZEN | (1) | up to 20 | 20 | (3) | up to 33 | 33 | nd | – | nd | (7) | up to 22 | 20 | 10–14 | ||
| β–ZEN | (2) | up to 21 | 20 | (1) | up to 21 | 21 | (1) | up to 39 | 39 | (10) | up to 20 | 19 | 14.4–16 | ||
| HT–2 | (1) | up to 20 | 20 | (8) | up to 31 | 20 | (5) | up to 36 | 36 | (3) | up to 13 | 13 | 13 | ||
| NIV | (2) | up to 271 | 206 | nd | – | nd | nd | – | nd | (7) | up to 160 | 148 | 175–162.6 | ||
| FUS–X | (1) | up to 154 | 154 | nd | – | nd | nd | – | nd | (7) | up to 133 | 137 | 41.2–147.2 | ||
| DAS | (13) | up to 8 | 3 | (18) | up to 16 | 5 | (29) | up to 25 | 5 | nd | – | nd | 0.64–1 | ||
| Barley (n = 34) | Maize (n = 63) | Oats (n = 33) | Wheat (n = 51) | Analytical Method | LOQ (µg/kg) | Ref. | |||||||||
| I (%) a | Range c (μg/kg) | Mean b (μg/kg) | I (%) a | Range c (μg/kg) | Mean b (μg/kg) | I (%) a | Range c (μg/kg) | Mean (μg/kg) | I (%) a | Range c (μg/kg) | Mean b (μg/kg) | ||||
| DON | (53) | 74–228 | 342 | (71) | 215–2942 | 1565 | (21) | 34–201 | 145 | (65) | 115–278 | 223 | ELISA–UV | 20.5 | [39] |
| ZEN | (9) | 5 –68 | 32 | (78) | 10–611 | 187 | (6) | 4–43 | 17 | (69) | 7–107 | 56 | 2.1 | ||
| FUS–X | (15) | 25–121 | 44 | (90) | 37–4434 | 1756 | (6) | 25–31 | 28 | (39) | 28–203 | 66 | 24.5 | ||
| T–2 | (32) | 5– 26 | 13 | (57) | 5–42 | 24 | (18) | 5–10 | 7 | (25) | 6–18 | 9 | 4.1 | ||
| Barley (n = 20) | Maize (n = 20) | Wheat (n =20) | Analytical Method | LOQ (µg/kg) | Ref. | ||||||||||
| I (%) a | Range c (μg/kg) | Mean b (μg/kg) | I (%) a | Range c (μg/kg) | Mean b (μg/kg) | I (%) a | Range c (μg/kg) | Mean (μg/kg) | |||||||
| OTA | 8(40) | up to 0.8 | 0.17 | 8 (40) | up to 7.2 | 1.08 | 8 (40) | up to 1.73 | 0.42 | HPLC–FLD | 0.02 | [45] | |||
| ZEN | na | – | na | 3 (15) | up to 17 | 14 | na | – | na | 10 | |||||
| FB1 | na | – | na | 10 (50) | up to 5960 | 1930 | na | – | na | 60 | |||||
| Maize based products (n = 17) | Rice based products (n = 9) | Wheat based products (n =7) | Analytical Method | LOQ (µg/kg) | Ref. | ||||||||||
| I (%) a | Range c (μg/kg) | Mean b (μg/kg) | I (%) a | Range c (μg/kg) | Mean b (μg/kg) | I (%) a | Range c (μg/kg) | Mean (μg/kg) | |||||||
| ENNA | nd | – | nd | nd | – | nd | nd | – | nd | LC–DAD | 6 | [8] | |||
| ENNA1 | na | 423,600 | 113,000 | na | 61,400 | 55,100 | 1 (14) | up to 46,900 | 46,900 | 4 | |||||
| ENNB | nd | – | nd | 1 (11) | 1050 | 1050 | nd | – | nd | 4 | |||||
| ENNB1 | 1 (5.8) | 20,100 | 20100 | 1 (11) | 600 | 600 | na | up to 79500 | 79500 | 5 | |||||
| BEA | nd | – | nd | nd | – | nd | nd | – | nd | 5 | |||||
| FUS | nd | – | nd | 1 (11) | 3900 | 3900 | nd | – | nd | 6 | |||||
| Analytes | TDI (µg/kg bw/day) | Barley (n = 30) | Maize (n = 30) | Rice (n = 30) | Wheat (n = 3) | ||||
|---|---|---|---|---|---|---|---|---|---|
| PDI (µg/kg bw/day) | % TDI | PDI (µg/kg bw/day) | % TDI | PDI (µg/kg bw/day) | % TDI | PDI (µg/kg bw/day) | % | ||
| TDI | |||||||||
| FB1 | 0 | 10.86 | 0 | 0 | |||||
| FB2 | 0 | 2.05 | 0 | 0 | |||||
| SumFBs | 2 | 0 | 0 | 12.91 | 645.4 | 0 | 0 | 0 | 0 |
| HT-2 | 0 | 0 | 0 | 0.15 | |||||
| T-2 | 0 | 0.02 | 0 | 0.18 | |||||
| SumHT2-T2 | 0.1 | 0 | 0 | 0.02 | 18.26 | 0 | 0 | 0.33 | 333.8 |
| DON | 1 | 0 | 0 | 0.46 | 46.35 | 0 | 0 | 4.92 | 491.9 |
| ZEN | 0.25 | 0 | 0 | 0.08 | 31.97 | 1.3·10−3 | 0.53 | 0.85 | 341.4 |
| F-X | 0.11 | 0.21 | 0 | 1.27 | |||||
| CIT | 0.02 | 0.02 | 0 | 0.14 | |||||
| BEA | 0 | 2.8·10−3 | 0 | 1.30 | |||||
| ENNA | 0 | 0 | 0 | 0.24 | |||||
| ENNA1 | 0 | 0.04 | 0 | 0.90 | |||||
| ENNB | 0 | 0 | 0 | 13.96 | |||||
| ENNB1 | 0 | 0.04 | 0 | 3.92 |
| Sample Type | Selected Areas | No. of Markets | No. of Samples | Origin |
|---|---|---|---|---|
| Barley | Aint Temouchent | 5 | 10 | |
| Oran | 7 | 10 | OAIC | |
| Tiaret | 8 | 10 | ||
| Total = 30 | ||||
| Maize | Aint Temouchent | 7 | 10 | |
| Oran | 6 | 10 | Imported | |
| Tiaret | 8 | 10 | ||
| Total = 30 | ||||
| Rice | Aint Temouchent | 10 | 10 | |
| Oran | 7 | 10 | Imported | |
| Tiaret | 10 | 10 | ||
| Total = 30 | ||||
| Wheat | Aint Temouchent | 6 | 10 | |
| Oran | 9 | 10 | NG | |
| Tiaret | 8 | 10 | ||
| Total = 30 |
© 2020 by the authors. Licensee MDPI, Basel, Switzerland. This article is an open access article distributed under the terms and conditions of the Creative Commons Attribution (CC BY) license (http://creativecommons.org/licenses/by/4.0/).
Share and Cite
Mahdjoubi, C.K.; Arroyo-Manzanares, N.; Hamini-Kadar, N.; García-Campaña, A.M.; Mebrouk, K.; Gámiz-Gracia, L. Multi-Mycotoxin Occurrence and Exposure Assessment Approach in Foodstuffs from Algeria. Toxins 2020, 12, 194. https://0-doi-org.brum.beds.ac.uk/10.3390/toxins12030194
Mahdjoubi CK, Arroyo-Manzanares N, Hamini-Kadar N, García-Campaña AM, Mebrouk K, Gámiz-Gracia L. Multi-Mycotoxin Occurrence and Exposure Assessment Approach in Foodstuffs from Algeria. Toxins. 2020; 12(3):194. https://0-doi-org.brum.beds.ac.uk/10.3390/toxins12030194
Chicago/Turabian StyleMahdjoubi, Choukri Khelifa, Natalia Arroyo-Manzanares, Nisserine Hamini-Kadar, Ana M. García-Campaña, Kihel Mebrouk, and Laura Gámiz-Gracia. 2020. "Multi-Mycotoxin Occurrence and Exposure Assessment Approach in Foodstuffs from Algeria" Toxins 12, no. 3: 194. https://0-doi-org.brum.beds.ac.uk/10.3390/toxins12030194