Intra-Specific Venom Variation in the Australian Coastal Taipan Oxyuranus scutellatus

 , ,
, ,
Abstract
:
1. Introduction
2. Results
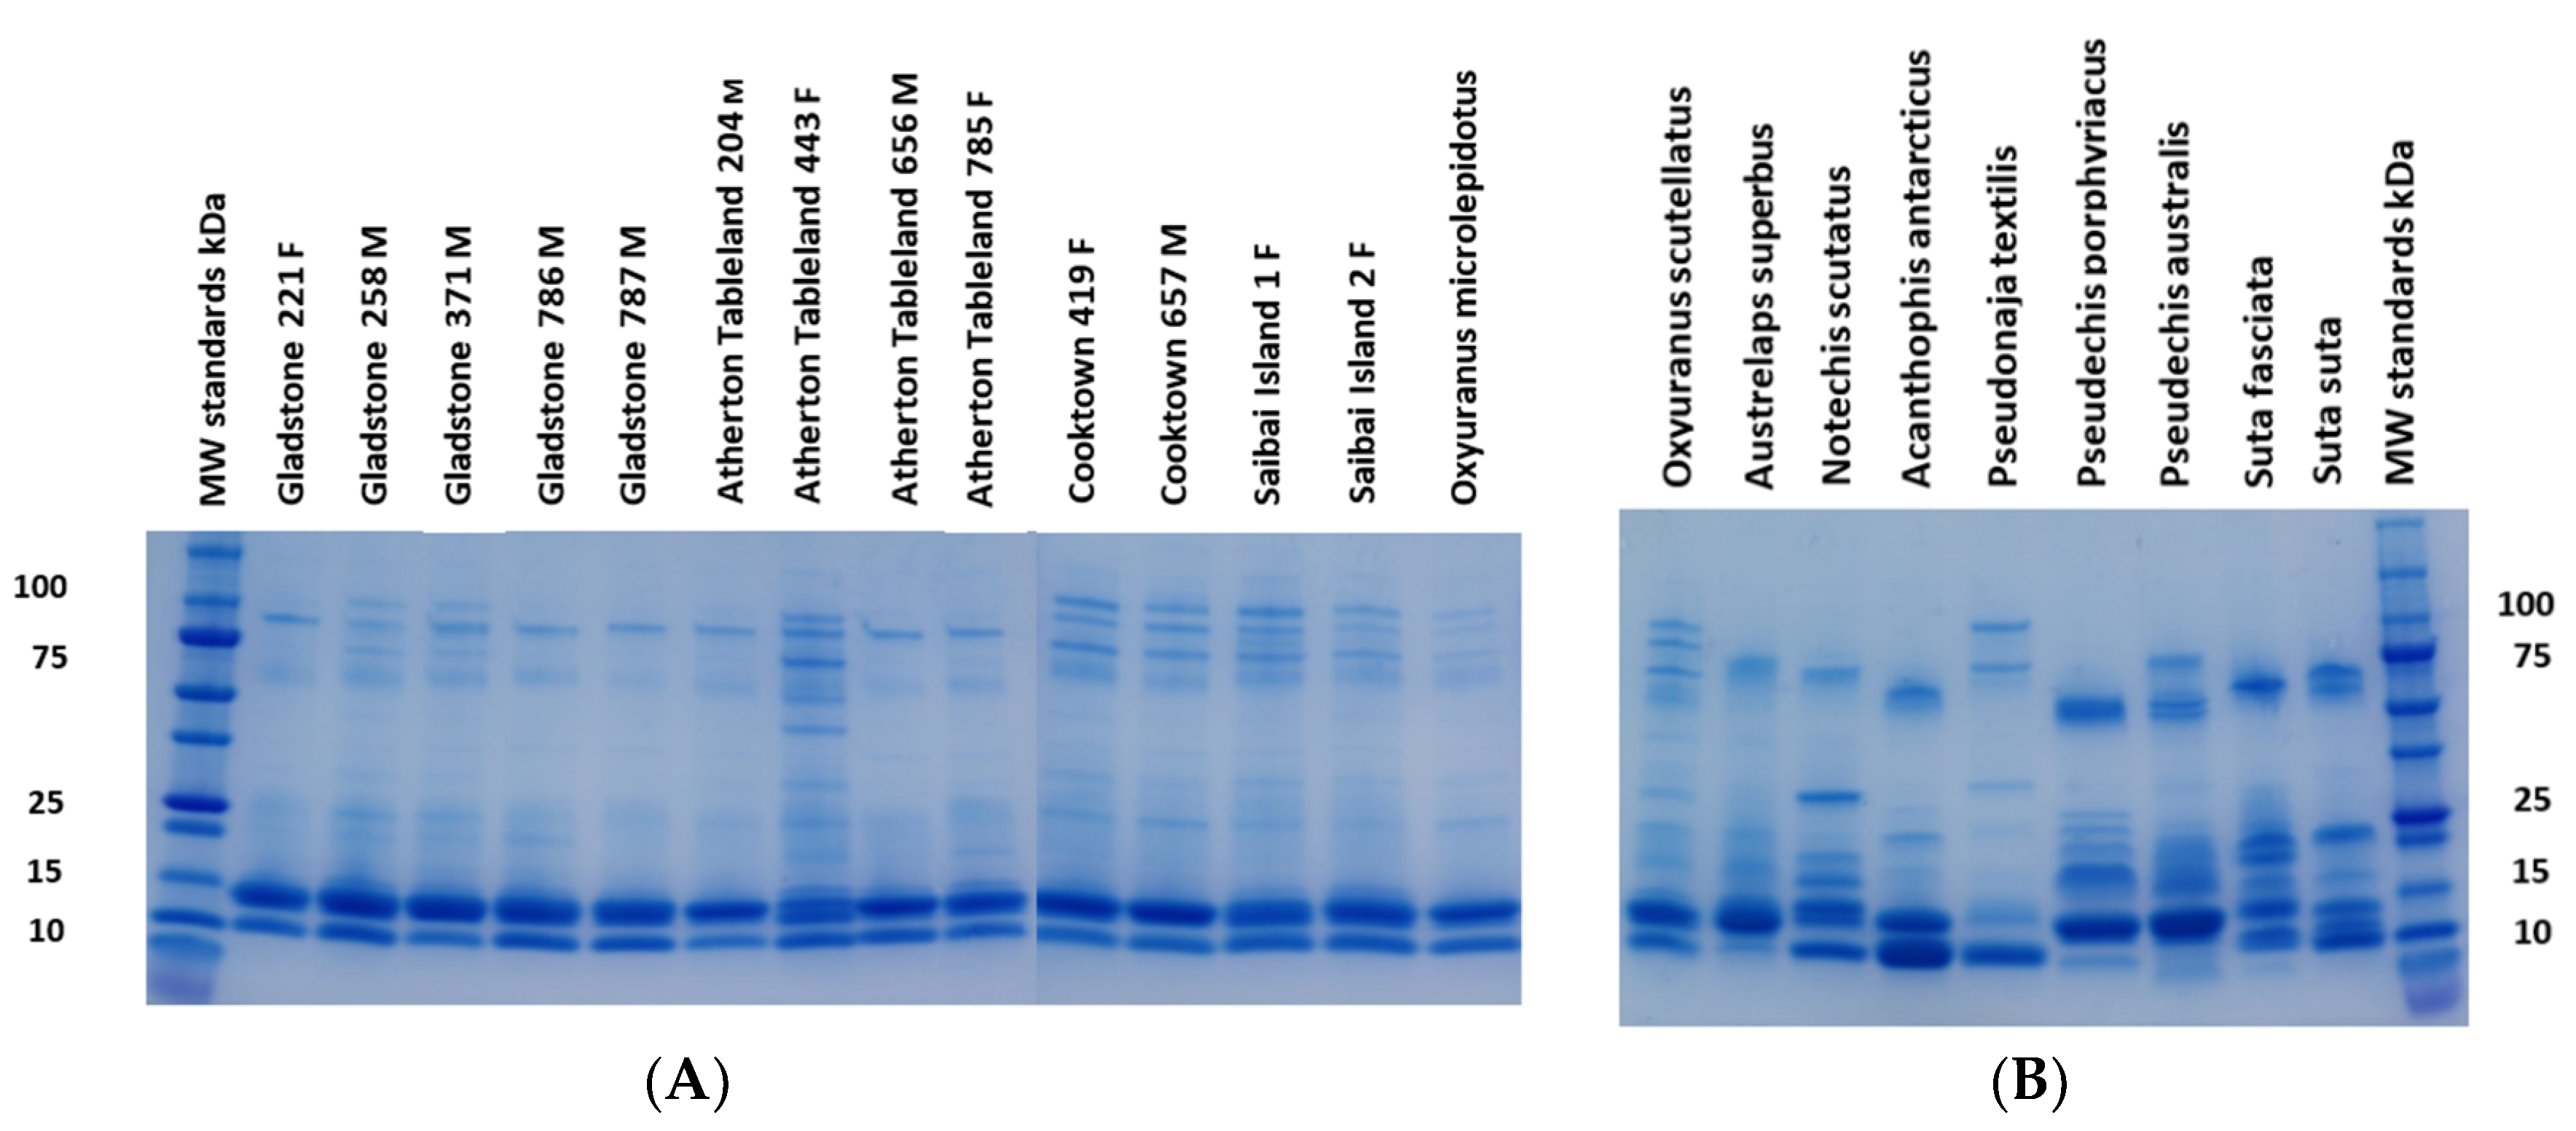
2.1. Electrophoresis
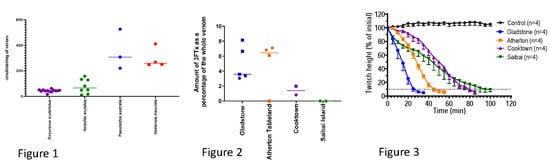
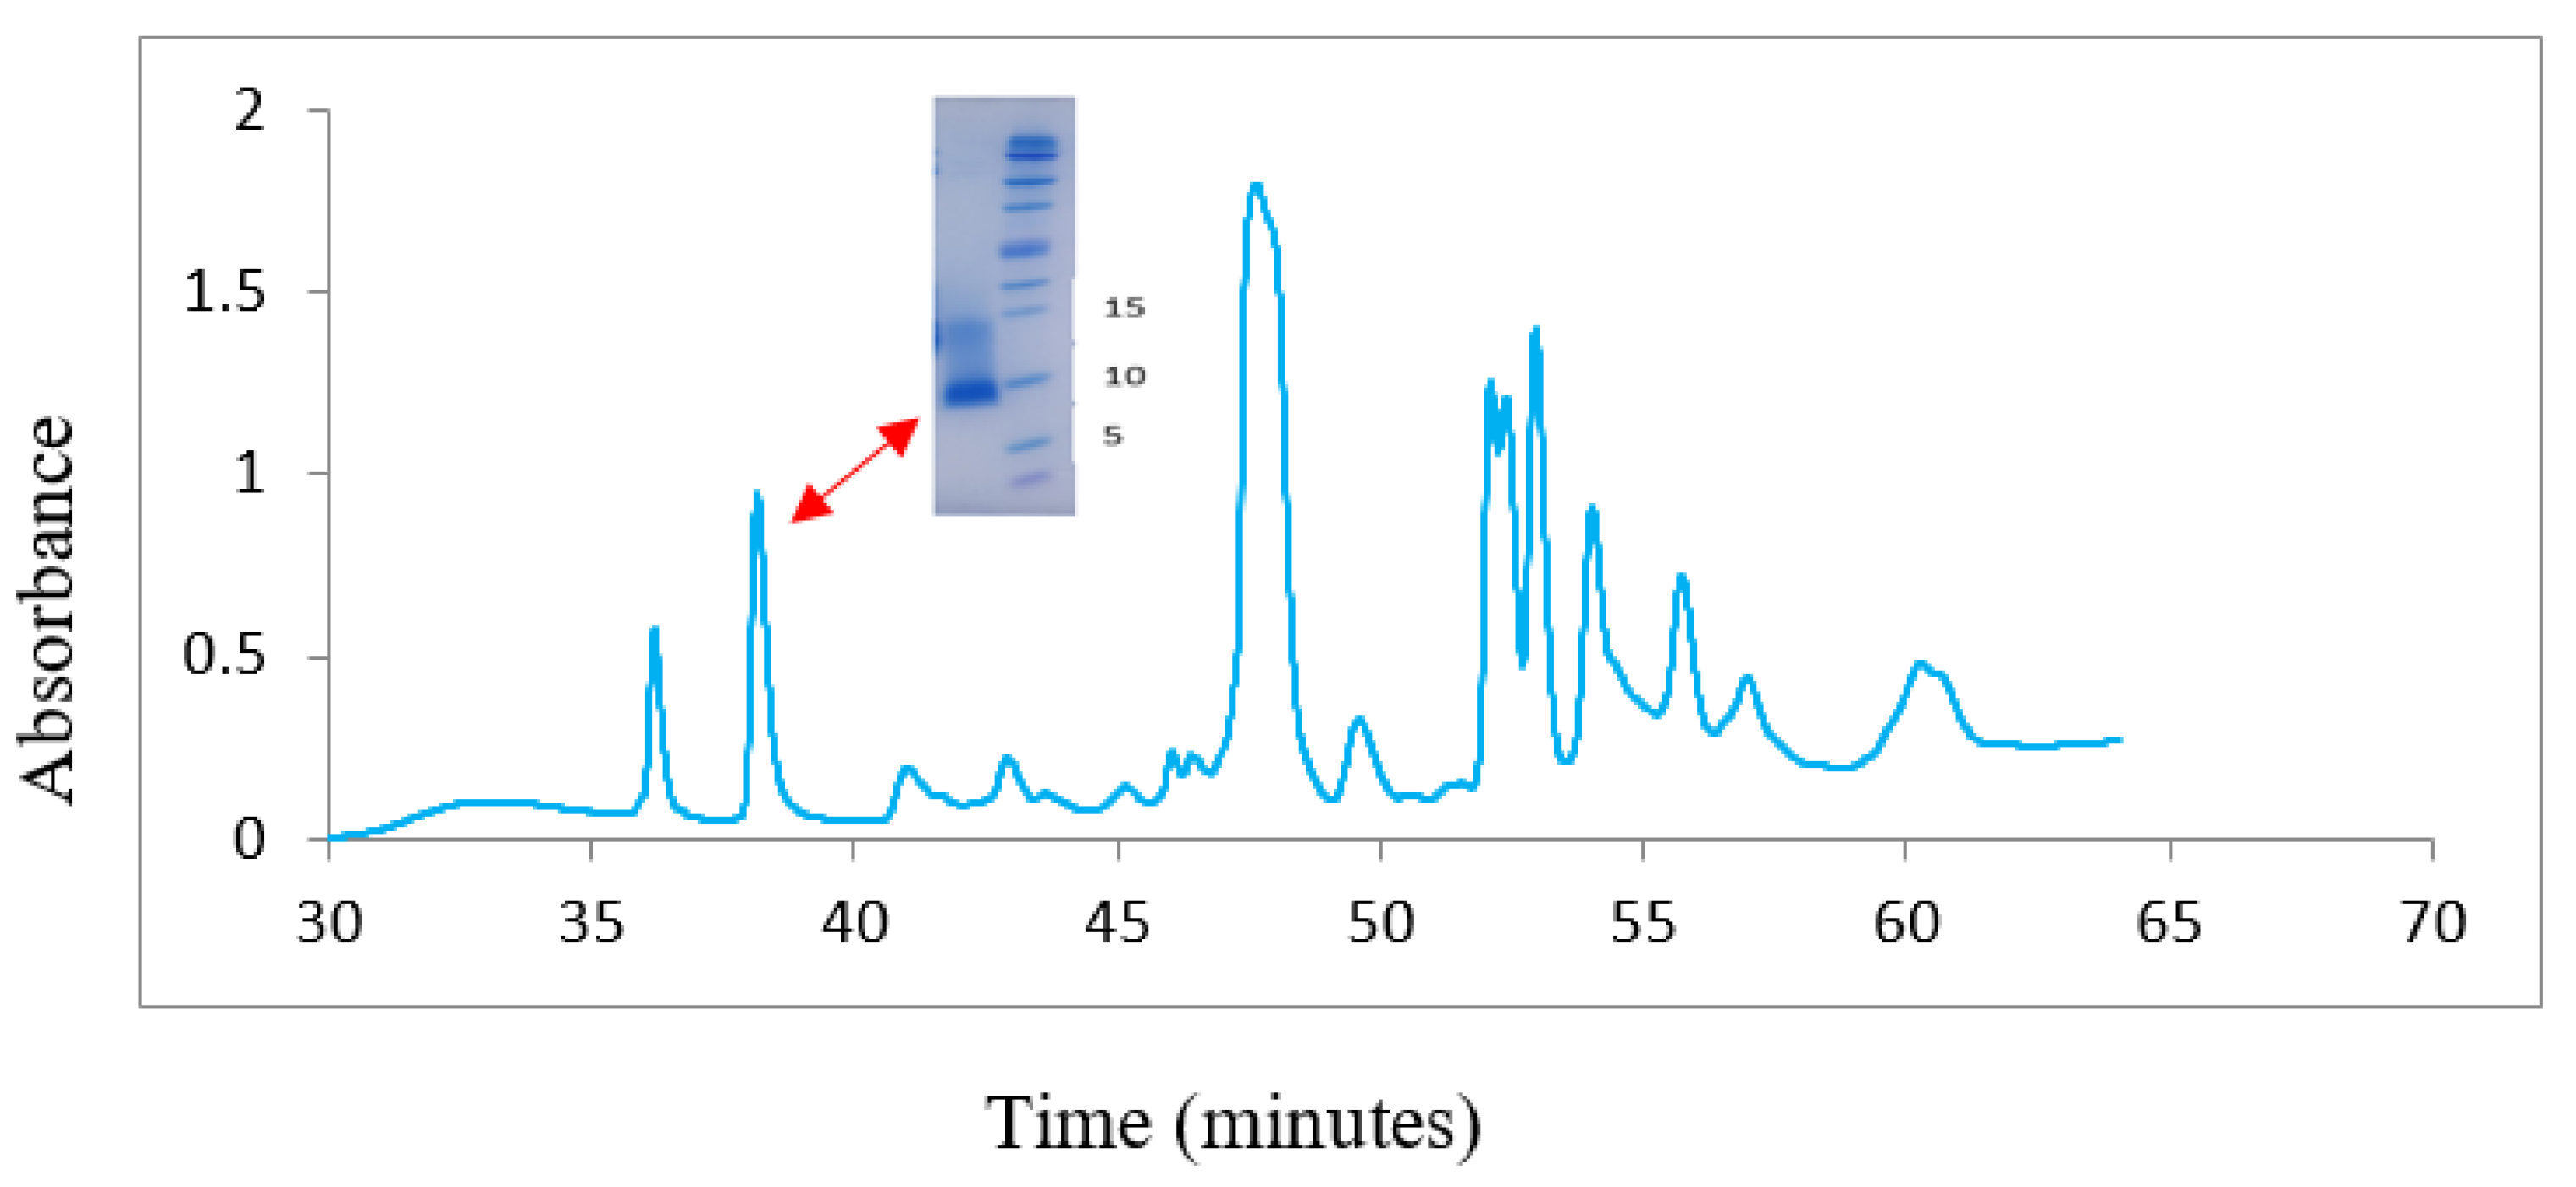
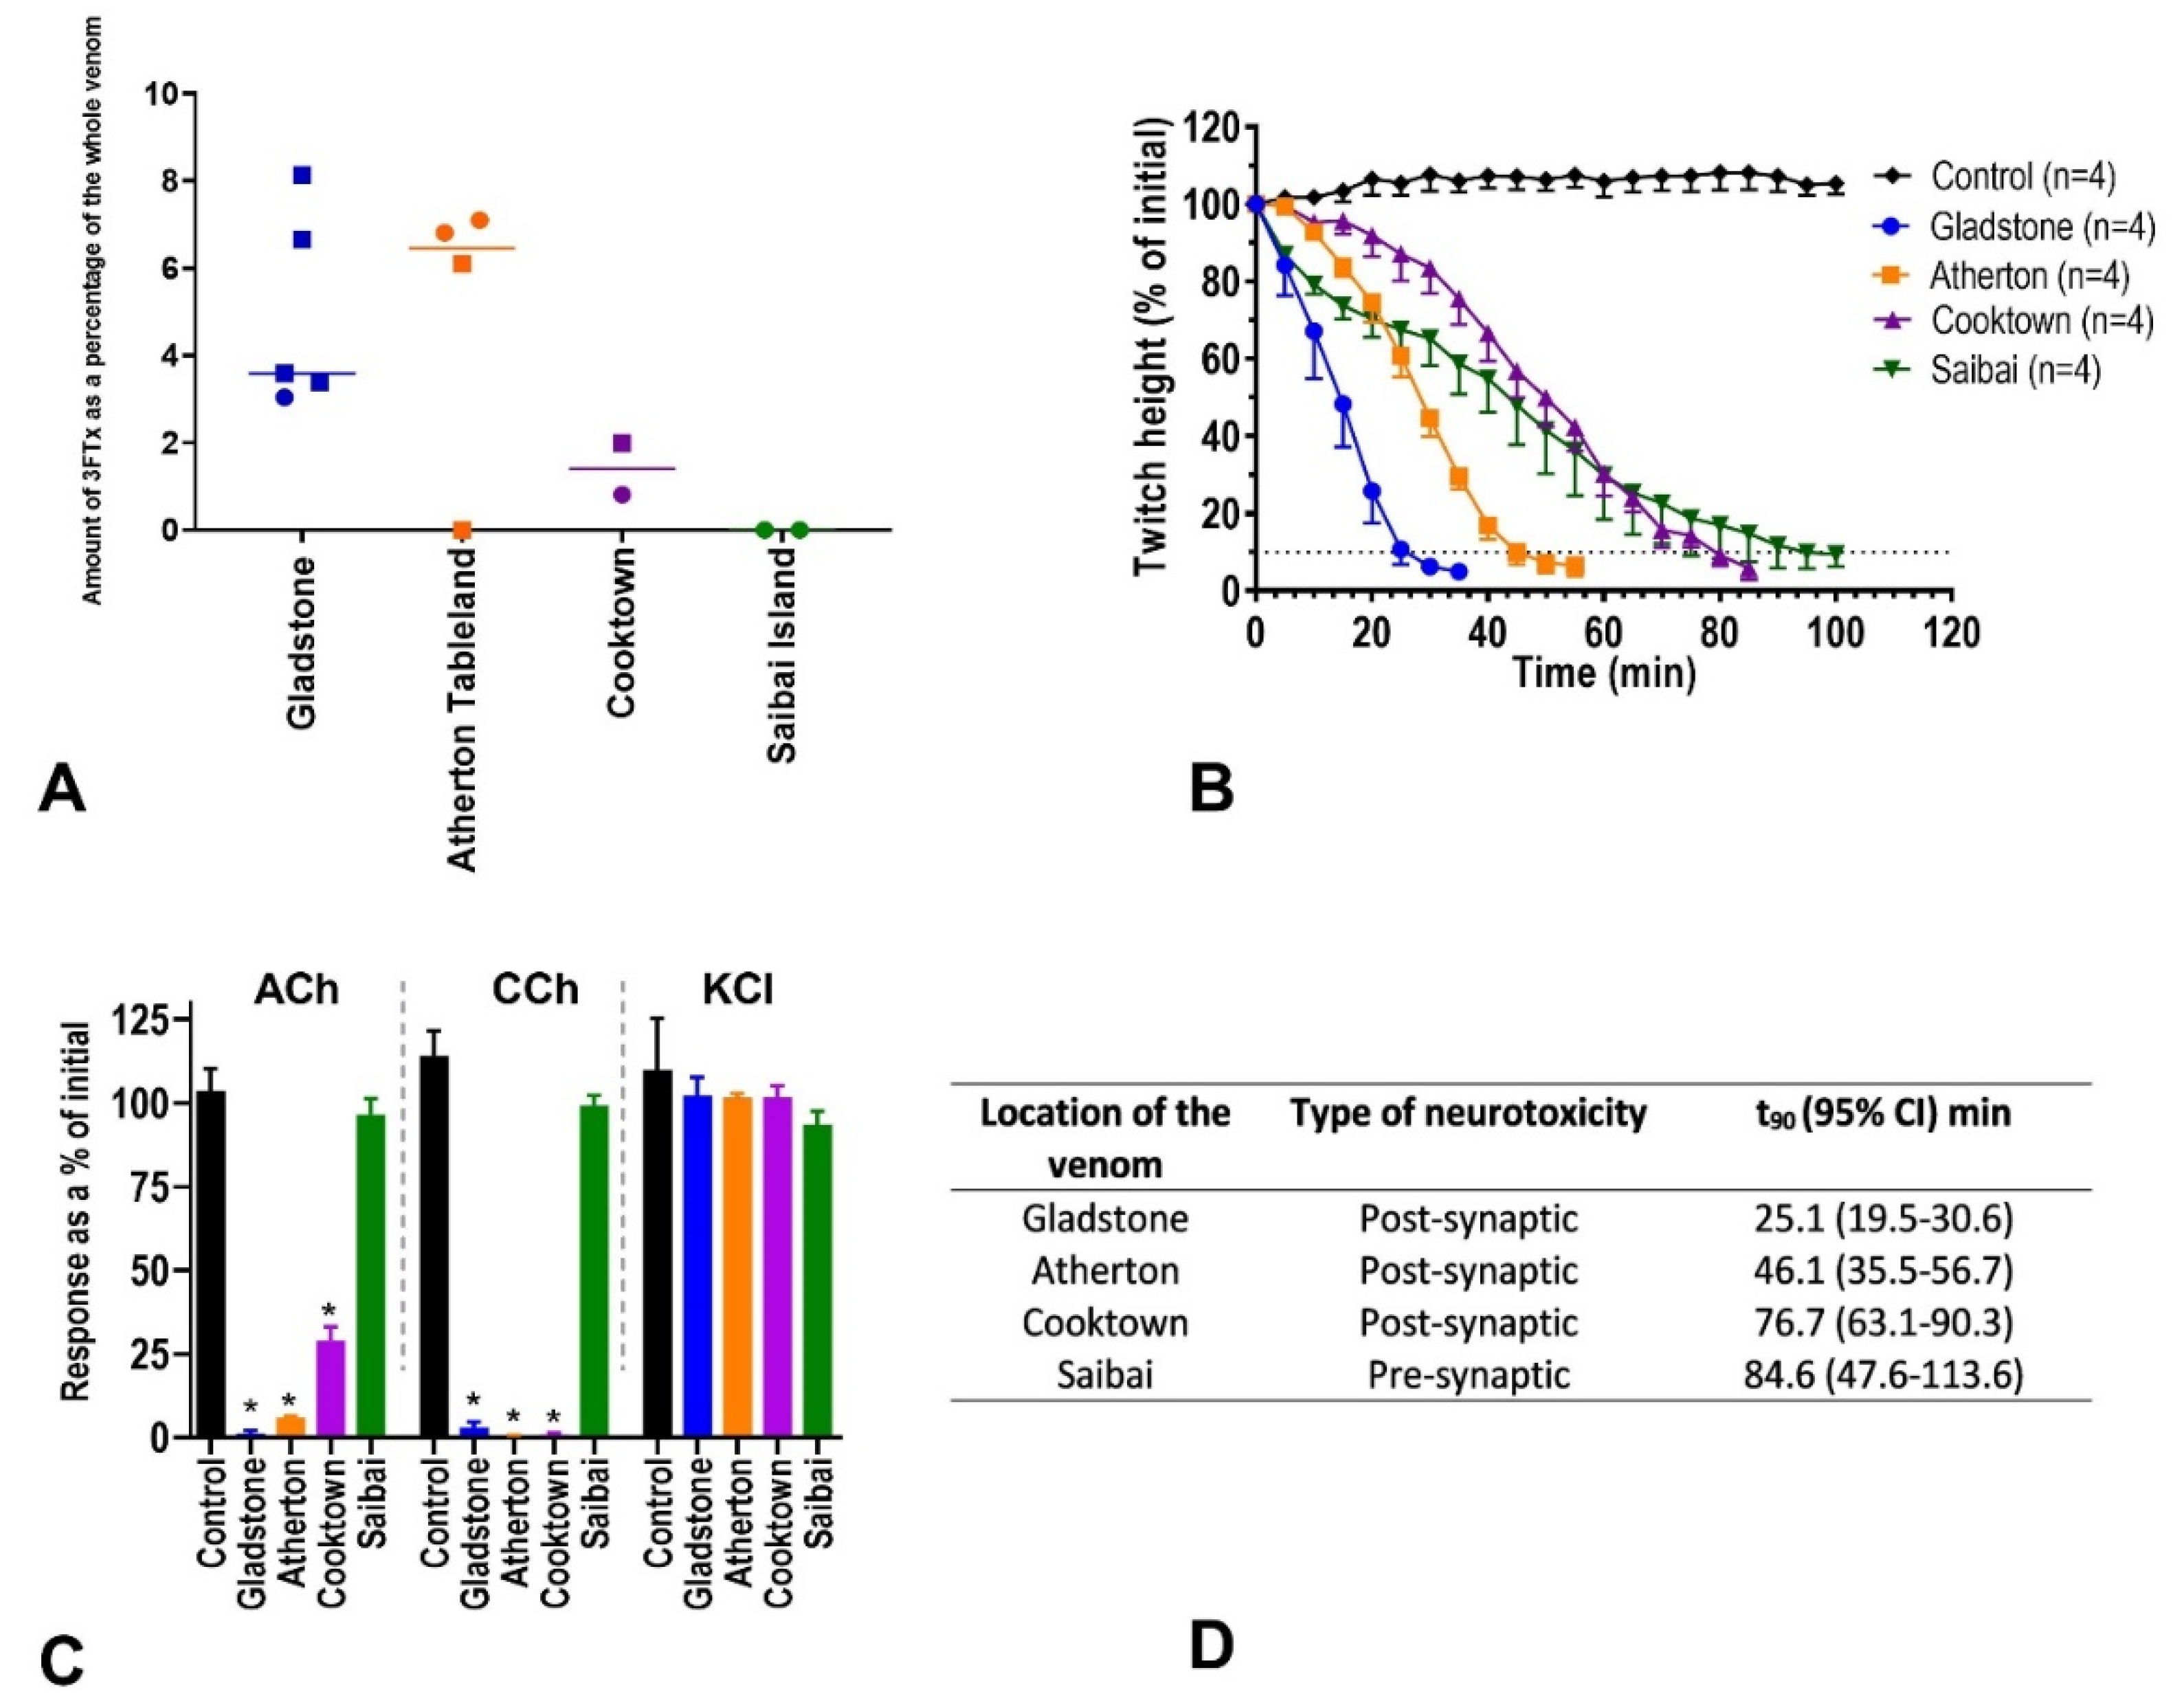
2.2. Three-Finger Toxins (Post-Synaptic Neurotoxin)
2.3. In-Vitro Neurotoxicity
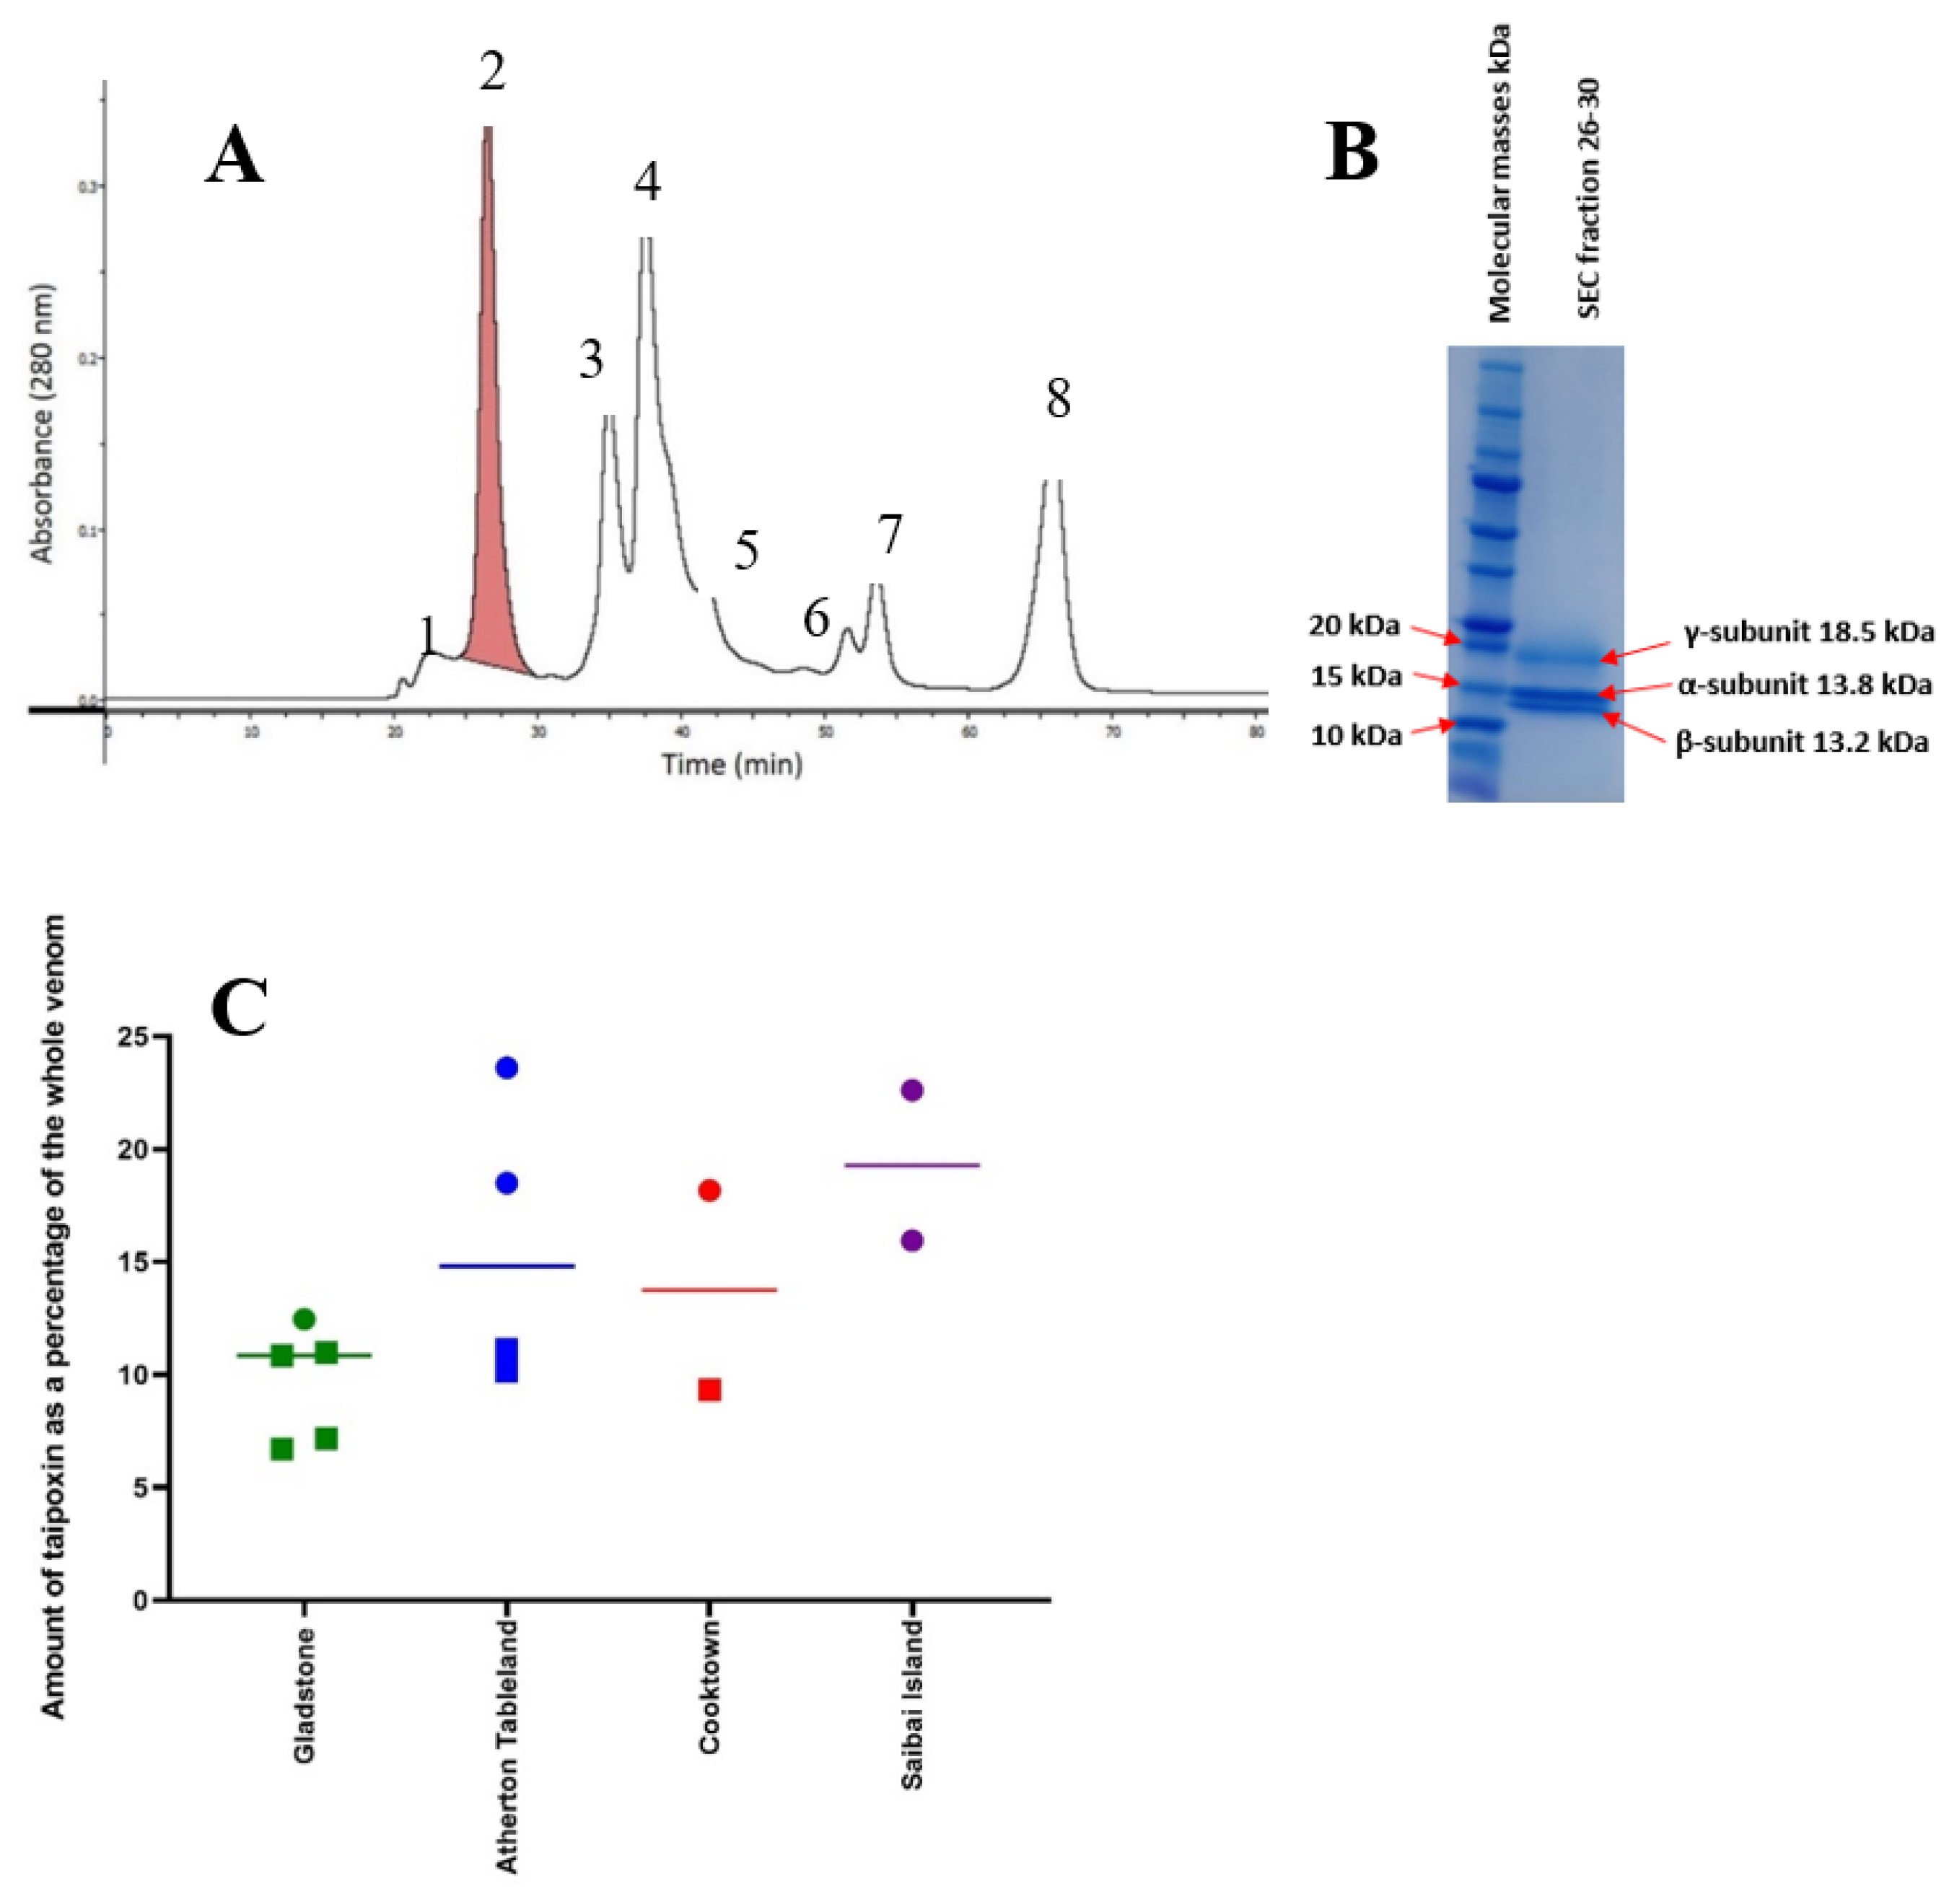
2.4. Taipoxin (Pre-Synaptic Neurotoxin)
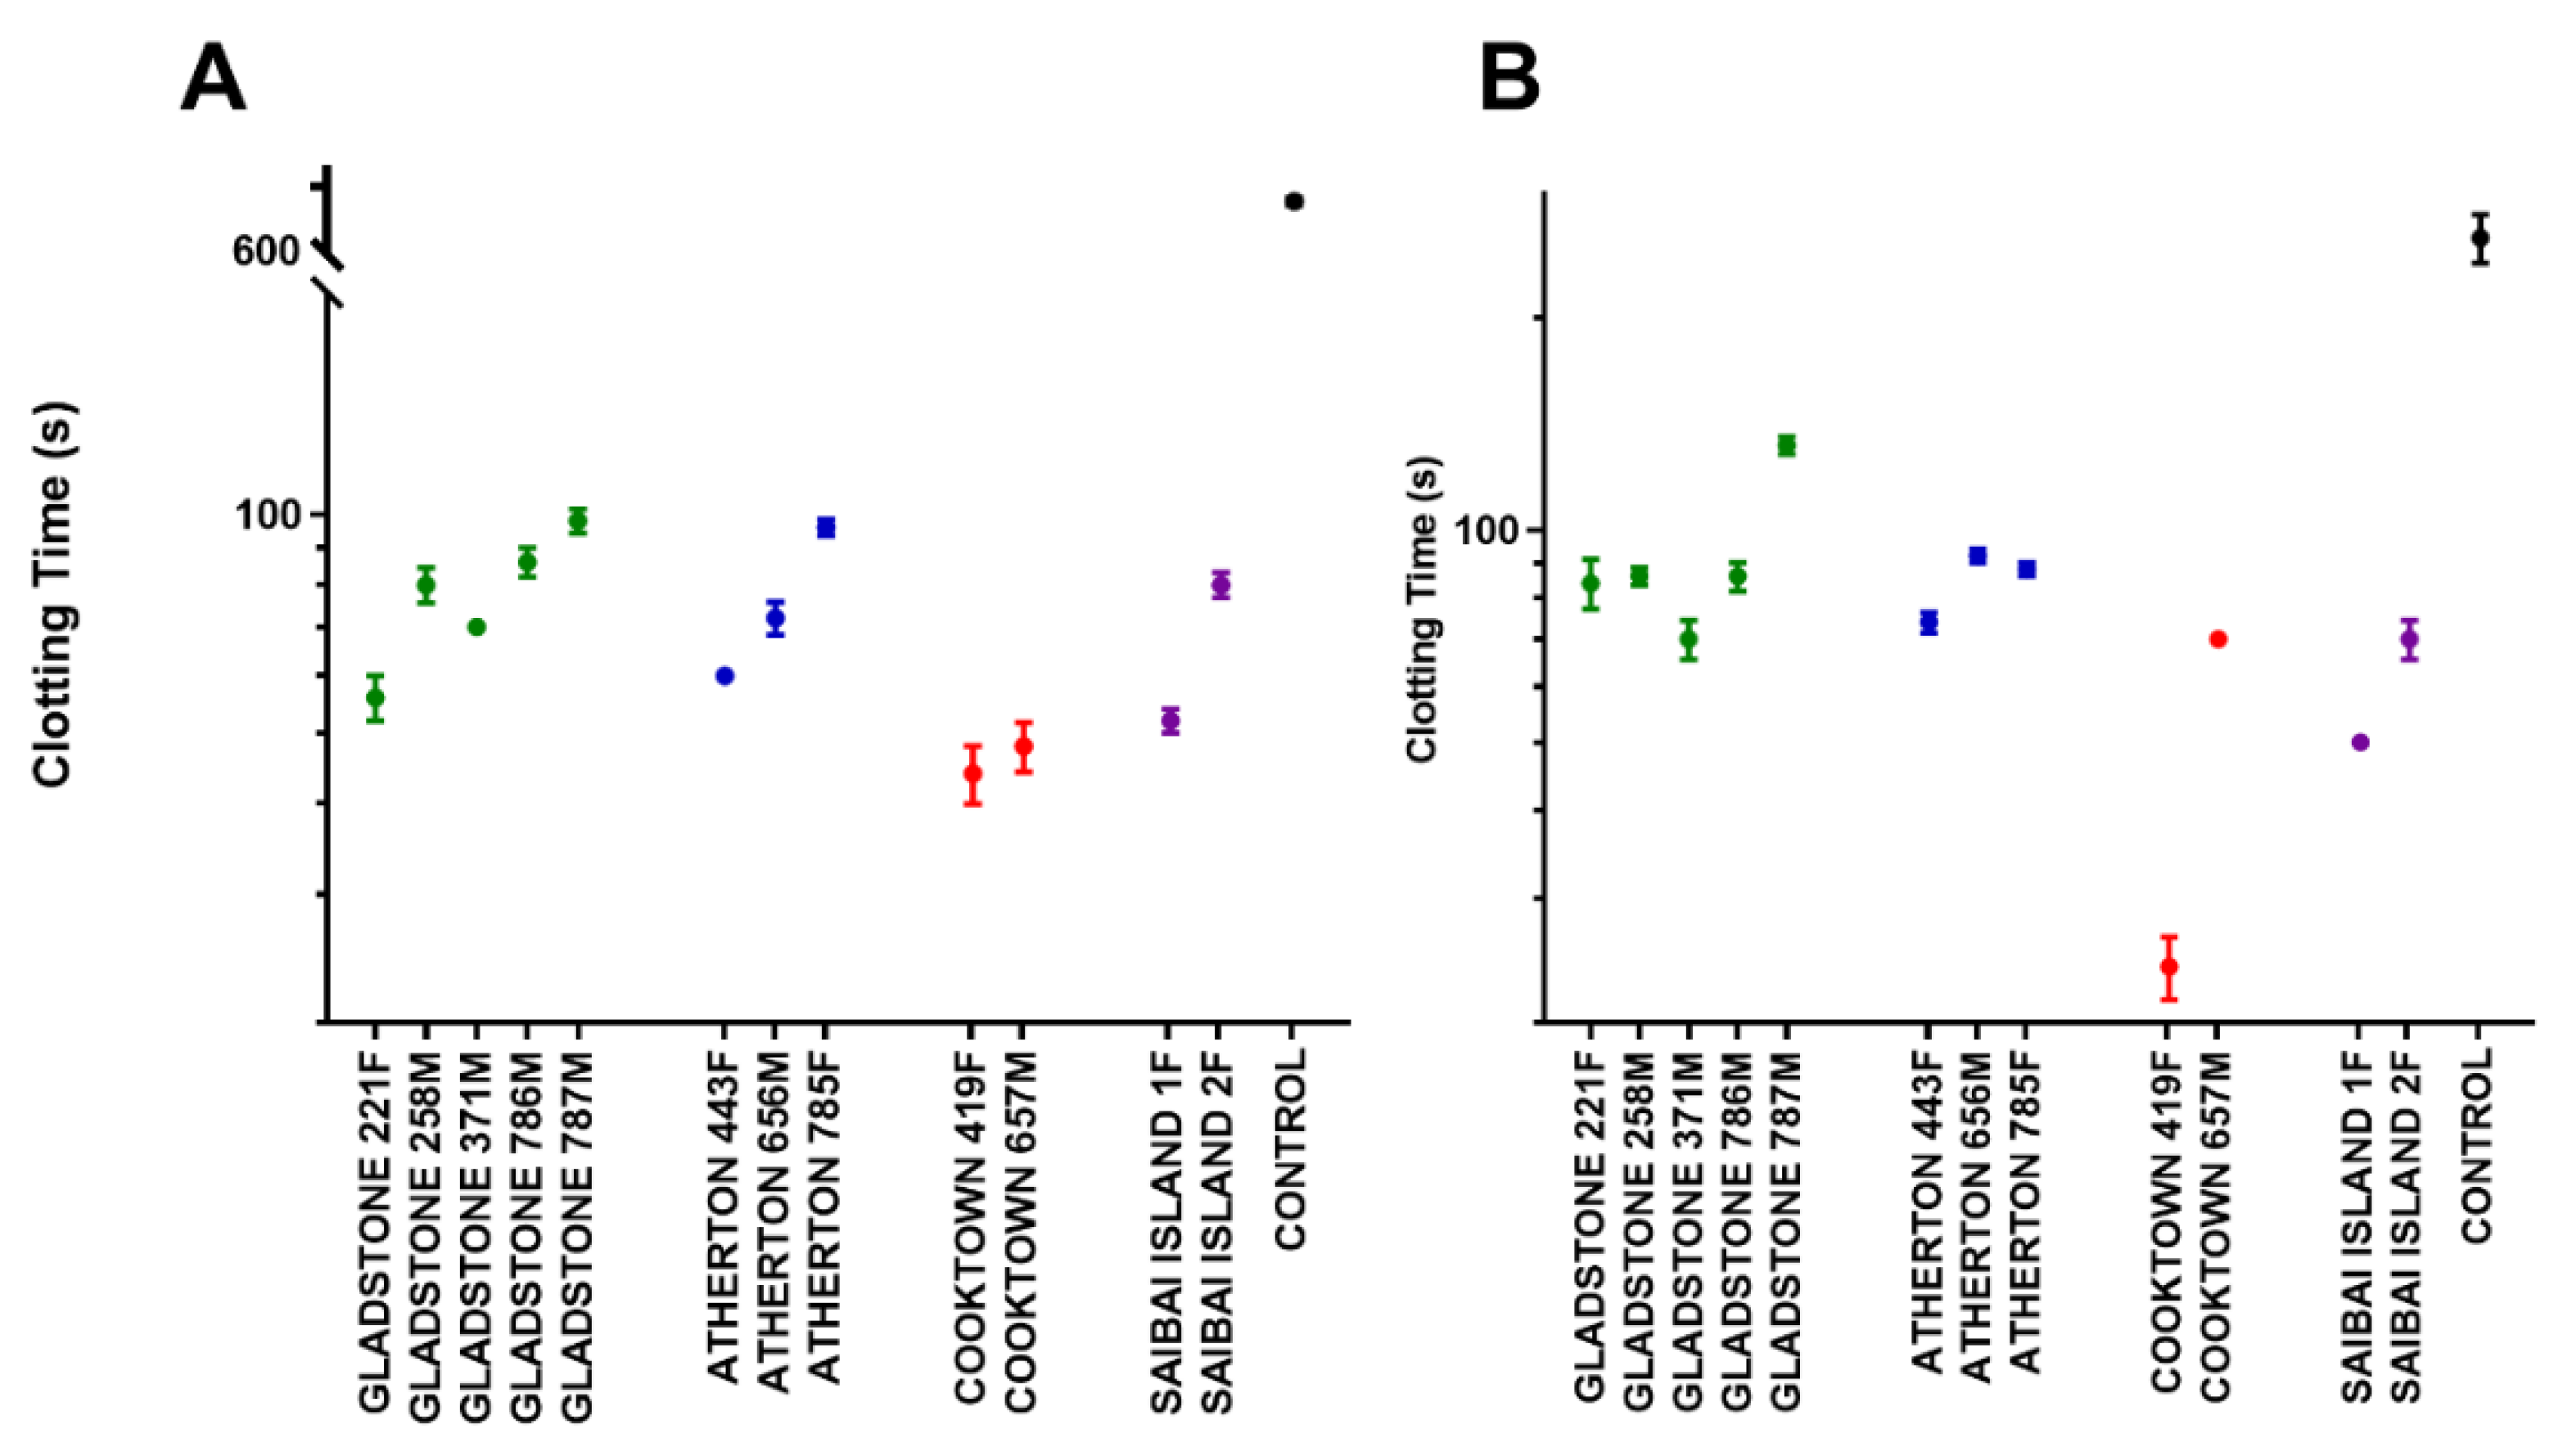
2.5. Coagulation Assay
2.5.1. Human Plasma
2.5.2. Rat Plasma
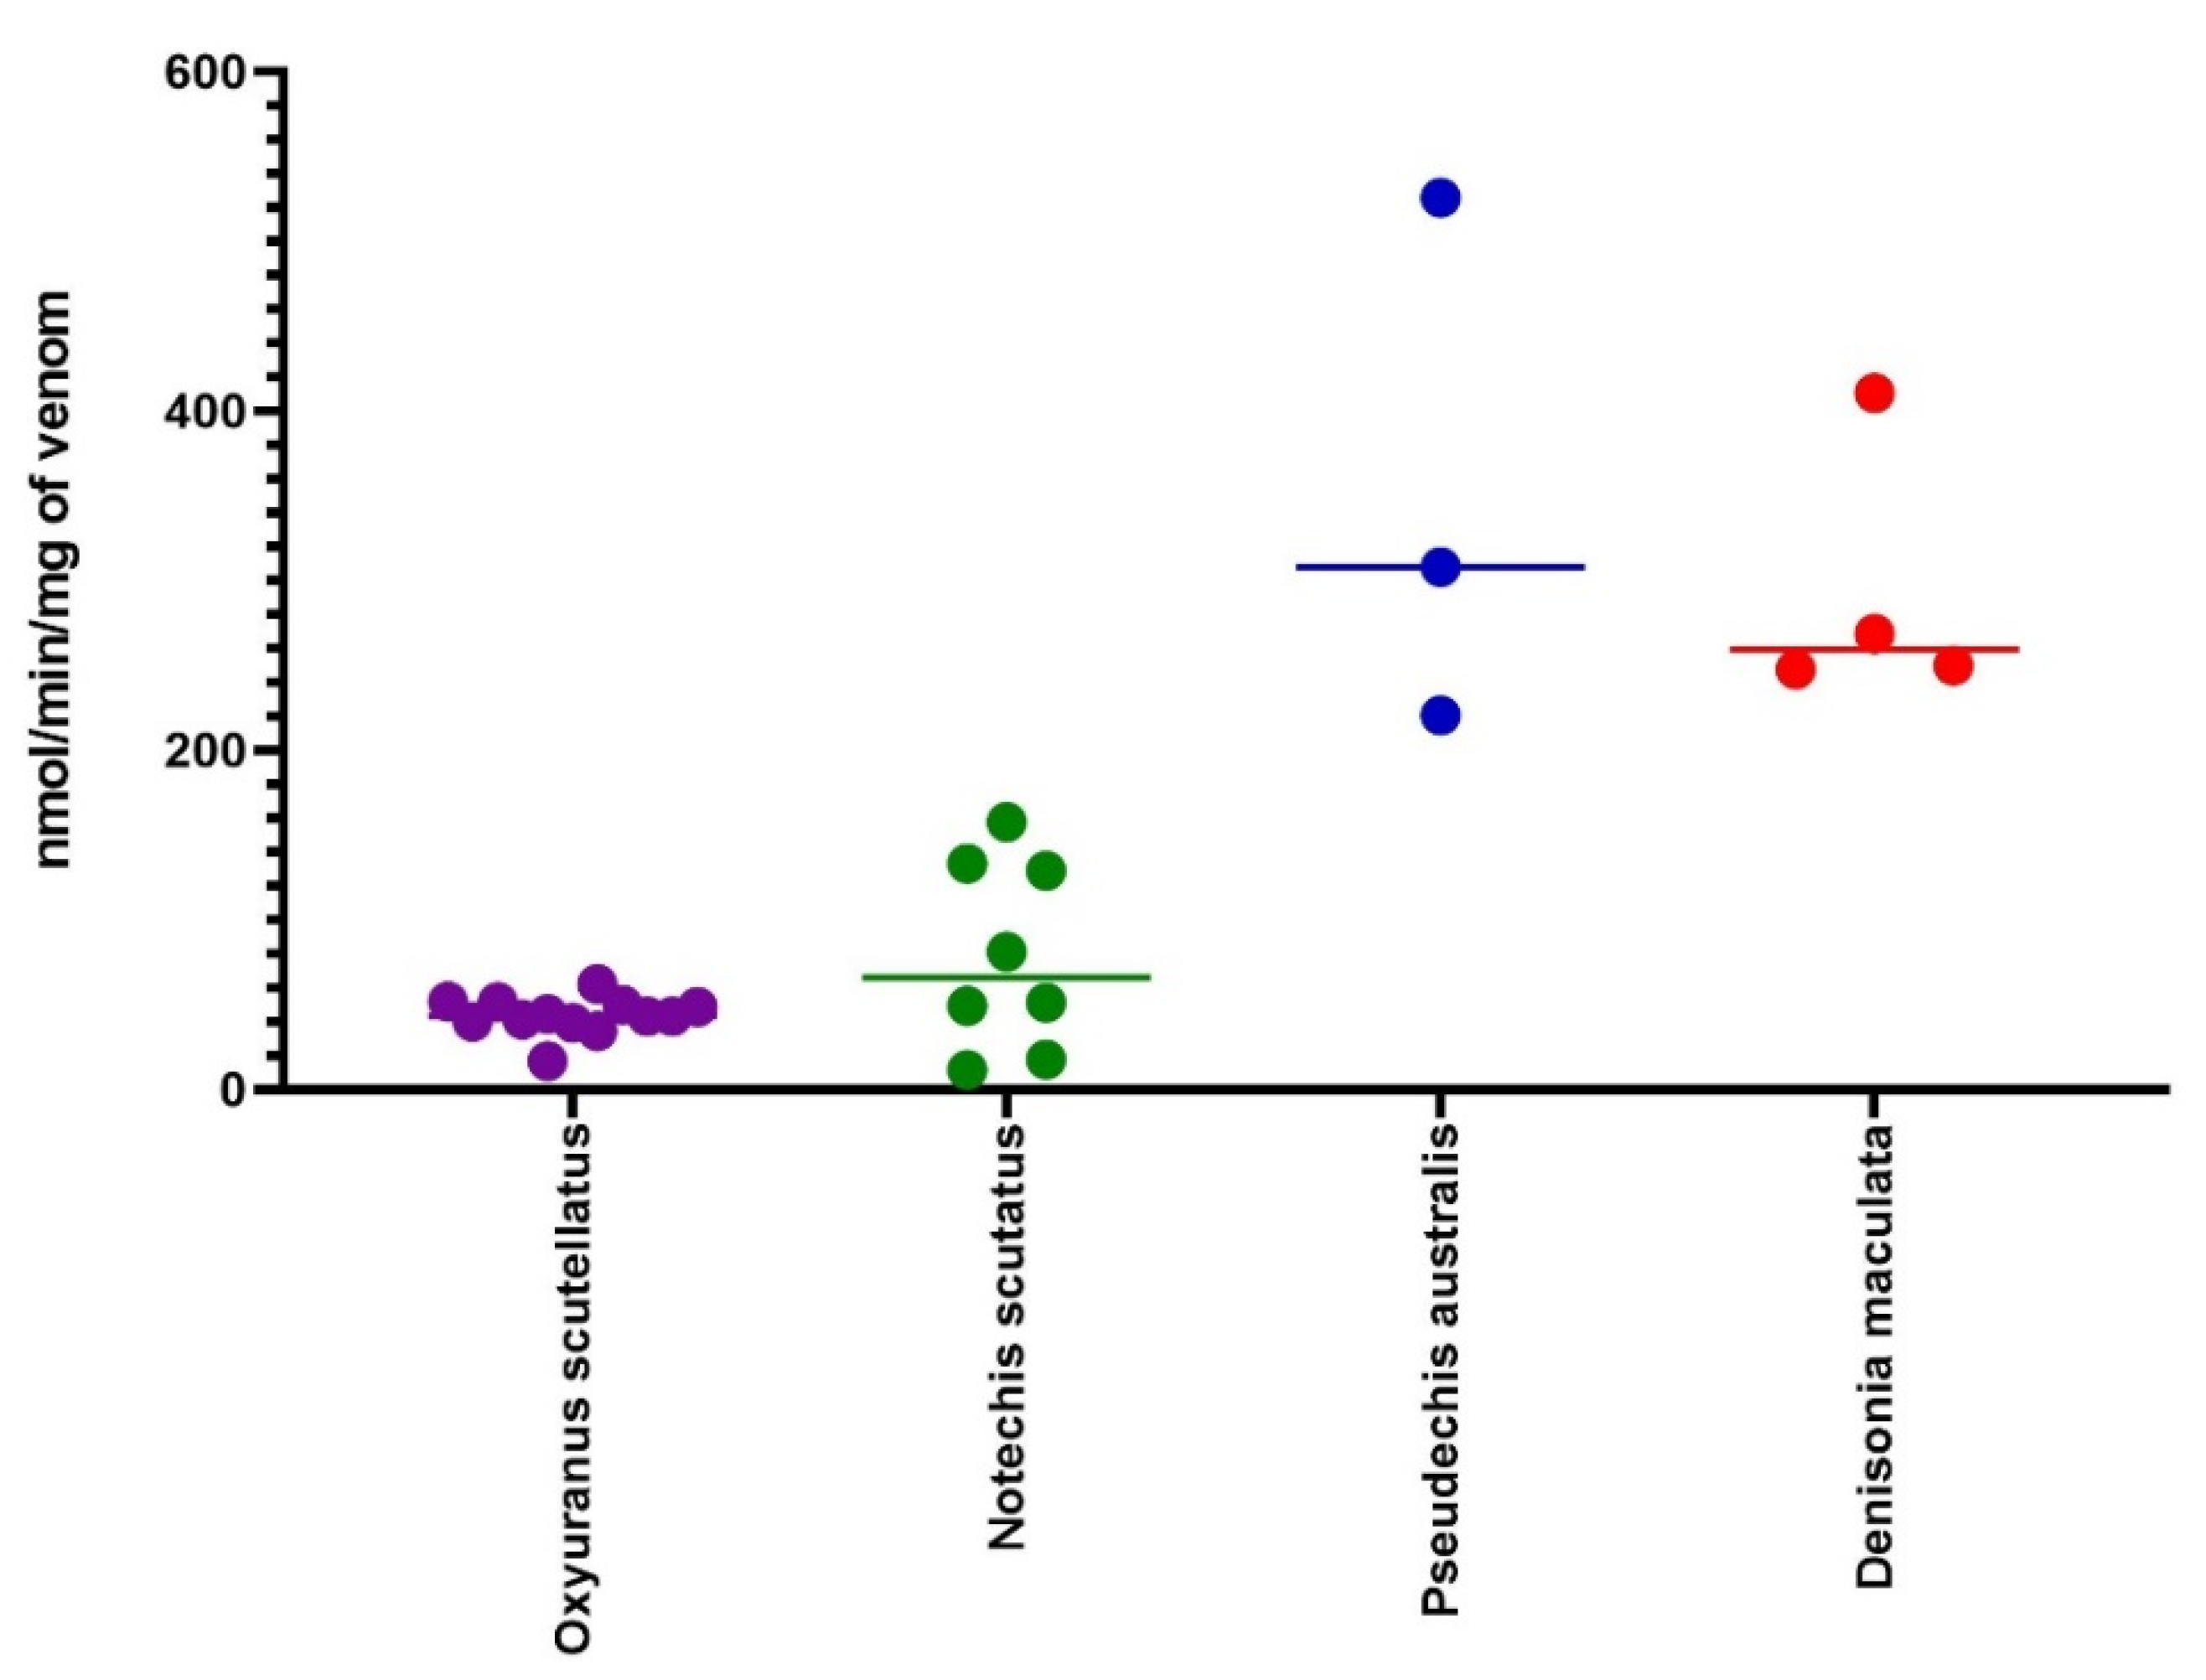
2.6. PLA2 Assay
2.7. L-Amino Acid Oxidase Assay
3. Discussion
Limitations and Further Research
4. Materials and Methods
4.1. Materials
4.2. Sodium Dodecyl Sulfate Polyacrylamide Gel Electrophoresis (SDS-PAGE)
4.3. Reverse-Phase High Performance Liquid Chromatography (RP-HPLC)
4.4. Size-Exclusion Chromatography (SEC)
4.5. Isolated Chick Biventer Cervicis Nerve-Muscle Preparation
4.6. Intact Mass Spectrometry
4.7. Mass Spectrometry (LC-MS/MS)
4.8. Procoagulant Assay
4.9. PLA2 Assay
4.10. L-amino Acid Oxidase Assay
Supplementary Materials
Author Contributions
Funding
Acknowledgments
Conflicts of Interest
References
- Cogger, H. Reptiles and Amphibians of Australia; CSIRO Publishing: Clayton, Australia, 2014. [Google Scholar]
- O’Shea, M. A Guide to the Snakes of Papua New Guinea; Independent Group Pty Ltd.: Singapore, 1996. [Google Scholar]
- Shine, R.; Covacevich, J. Ecology of Highly Venomous Snakes: The Australian Genus Oxyuranus (Elapidae). S. Am. J. Herpetol. 1983, 17, 60–69. [Google Scholar] [CrossRef] [Green Version]
- Herrera, M.; Fernandez, J.; Vargas, M.; Villalta, M.; Segura, A.; León, G.; Angulo, Y.; Paiva, O.; Matainaho, T.; Jensen, S.D.; et al. Comparative proteomic analysis of the venom of the taipan snake, Oxyuranus scutellatus, from Papua New Guinea and Australia: Role of neurotoxic and procoagulant effects in venom toxicity. J. Proteom. 2012, 75, 2128–2140. [Google Scholar] [CrossRef] [PubMed]
- Johnston, C.; Ryan, N.M.; A O’Leary, M.; Brown, S.; Isbister, G.K. Australian taipan (Oxyuranus spp.) envenoming: Clinical effects and potential benefits of early antivenom therapy—Australian Snakebite Project (ASP-25). Clin. Toxicol. 2016, 55, 115–122. [Google Scholar] [CrossRef] [PubMed]
- Folhman, J.; Eaker, D.; Karlsson, E.; Thesleff, S. Taipoxin, an extremely potent presynaptic neurotoxin from the venom of the Australian snake Taipan (Oxyuranus s. scutellatus). Eur. J. Biochem. 1976, 68, 457–469. [Google Scholar] [CrossRef]
- Cendron, L.; Mičetić, I.; De Laureto, P.P.; Paoli, M. Structural analysis of trimeric phospholipase A 2 neurotoxin from the Australian taipan snake venom. FEBS J. 2012, 279, 3121–3135. [Google Scholar] [CrossRef]
- Zamudio, F.; Wolf, K.M.; Martin, B.M.; Possani, L.D.; Chiappinelli, V.A. Two Novel α-Neurotoxins Isolated from the Taipan Snake, Oxyuranus scutellatus, Exhibit Reduced Affinity for Nicotinic Acetylcholine Receptors in Brain and Skeletal Muscle. Biochemistry 1996, 35, 7910–7916. [Google Scholar] [CrossRef]
- Kornhauser, R.; Hart, A.J.; Reeve, S.; Smith, A.I.; Fry, B.G.; Hodgson, W.C. Variations in the pharmacological profile of post-synaptic neurotoxins isolated from the venoms of the Papuan (Oxyuranus scutellatus canni) and coastal (Oxyuranus scutellatus scutellatus) taipans. NeuroToxicology 2010, 31, 239–243. [Google Scholar] [CrossRef]
- Speijer, H.; Govers-Riemslag, J.W.; Zwaal, R.F.; Rosing, J. Prothrombin activation by an activator from the venom of Oxyuranus scutellatus (Taipan snake). J. Boil. Chem. 1986, 261, 13258–13267. [Google Scholar]
- Tasoulis, T.; Lee, M.S.Y.; Ziajko, M.; Dunstan, N.; Sumner, J.; Isbister, G.K. Activity of two key toxin groups in Australian elapid venoms show a strong correlation to phylogeny but not to diet. BMC Evol. Boil. 2020, 20, 9. [Google Scholar] [CrossRef] [Green Version]
- Saviola, A.J.; Gandara, A.J.; Bryson, R.W.; Mackessy, S.P. Venom phenotypes of the Rock Rattlesnake (Crotalus lepidus) and the Ridge-nosed Rattlesnake (Crotalus willardi) from México and the United States. Toxicon 2017, 138, 119–129. [Google Scholar] [CrossRef]
- Alape-Giron, A.; Sanz, L.; Escolano, J.; Flores-Díaz, M.; Madrigal, M.; Sasa-Marín, M.; Calvete, J.J. Snake Venomics of the Lancehead PitviperBothrops asper: Geographic, Individual, and Ontogenetic Variations. J. Proteome Res. 2008, 7, 3556–3571. [Google Scholar] [CrossRef]
- Dias, G.S.; Kitano, E.; Pagotto, A.H.; Sant’Anna, S.; Rocha, M.M.T.; Zelanis, A.; Serrano, S.M.T. Individual Variability in the Venom Proteome of Juvenile Bothrops jararaca Specimens. J. Proteome Res. 2013, 12, 4585–4598. [Google Scholar] [CrossRef] [PubMed]
- Margres, M.J.; Wray, K.P.; Seavy, M.; McGivern, J.J.; Sanader, D.; Rokyta, D.R. Phenotypic integration in the feeding system of the eastern diamondback rattlesnake (Crotalus adamanteus). Mol. Ecol. 2015, 24, 3405–3420. [Google Scholar] [CrossRef] [PubMed]
- Neri-Castro, E.; Lomonte, B.; Gutierrez, M.D.C.; Alagon, A.; Gutiérrez, J.M. Intraspecies variation in the venom of the rattlesnake Crotalus simus from Mexico: Different expression of crotoxin results in highly variable toxicity in the venoms of three subspecies. J. Proteom. 2013, 87, 103–121. [Google Scholar] [CrossRef] [PubMed]
- Youngman, N.J.; Debono, J.; Dobson, J.S.; Zdenek, C.N.; Harris, R.J.; Brouw, B.O.D.; Coimbra, F.C.P.; Naude, A.; Coster, K.; Sundman, E.; et al. Venomous Landmines: Clinical Implications of Extreme Coagulotoxic Diversification and Differential Neutralization by Antivenom of Venoms within the Viperid Snake Genus Bitis. Toxins 2019, 11, 422. [Google Scholar] [CrossRef] [PubMed] [Green Version]
- De Sousa, L.; Zdenek, C.N.; Dobson, J.S.; Brouw, B.O.D.; Coimbra, F.C.P.; Gillett, A.; Del-Rei, T.H.M.; Chalkidis, H.D.M.; Sant’Anna, S.; Teixeira-Da-Rocha, M.M.; et al. Coagulotoxicity of Bothrops (Lancehead Pit-Vipers) Venoms from Brazil: Differential Biochemistry and Antivenom Efficacy Resulting from Prey-Driven Venom Variation. Toxins 2018, 10, 411. [Google Scholar] [CrossRef] [PubMed] [Green Version]
- Lister, C.; Arbuckle, K.; Jackson, T.N.; Debono, J.; Zdenek, C.N.; Dashevsky, D.; Dunstan, N.; Allen, L.; Hay, C.; Bush, B.; et al. Catch a tiger snake by its tail: Differential toxicity, co-factor dependence and antivenom efficacy in a procoagulant clade of Australian venomous snakes. Comp. Biochem. Physiol. Part C Toxicol. Pharmacol. 2017, 202, 39–54. [Google Scholar] [CrossRef] [Green Version]
- Menezes, M.C.; Furtado, M.F.; Travaglia-Cardoso, S.R.; Camargo, A.C.; Serrano, S.M. Sex-based individual variation of snake venom proteome among eighteen Bothrops jararaca siblings. Toxicon 2006, 47, 304–312. [Google Scholar] [CrossRef]
- Daltry, J.C.; Ponnudurai, G.; Shin, C.K.; Tan, N.-H.; Thorpe, R.S.; Wolfgang, W. Electrophoretic profiles and biological activities: Intraspecific variation in the venom of the malayan pit viper (Calloselasma rhodostoma). Toxicon 1996, 34, 67–79. [Google Scholar] [CrossRef]
- McCleary, R.J.R.; Sridharan, S.; Dunstan, N.; Mirtschin, P.J.; Kini, R.M. Proteomic comparisons of venoms of long-term captive and recently wild-caught Eastern brown snakes (Pseudonaja textilis) indicate venom does not change due to captivity. J. Proteom. 2016, 144, 51–62. [Google Scholar] [CrossRef]
- Mackessy, S.P.; Sixberry, N.M.; Heyborne, W.H.; Fritts, T. Venom of the Brown Treesnake, Boiga irregularis: Ontogenetic shifts and taxa-specific toxicity. Toxicon 2006, 47, 537–548. [Google Scholar] [CrossRef] [PubMed]
- Cipriani, V.; Debono, J.; Goldenberg, J.; Jackson, T.; Arbuckle, K.; Dobson, J.; Koludarov, I.; Li, B.; Hay, C.; Dunstan, N.; et al. Correlation between ontogenetic dietary shifts and venom variation in Australian brown snakes (Pseudonaja). Comp. Biochem. Physiol. Part C Toxicol. Pharmacol. 2017, 197, 53–60. [Google Scholar] [CrossRef] [PubMed] [Green Version]
- Mackessy, S.P. Venom Ontogeny in the Pacific Rattlesnakes Crotalus viridis helleri and C. v. oreganus. Copeia 1988, 1988, 92–101. [Google Scholar] [CrossRef]
- Gonçalves-Machado, L.; Pla, D.; Sanz, L.; Jorge, R.J.B.; Leitão-De-Araújo, M.; Alves, M.L.M.; Alvares, D.J.; De Miranda, J.; Nowatzki, J.; De Morais-Zani, K.; et al. Combined venomics, venom gland transcriptomics, bioactivities, and antivenomics of two Bothrops jararaca populations from geographic isolated regions within the Brazilian Atlantic rainforest. J. Proteom. 2016, 135, 73–89. [Google Scholar] [CrossRef] [PubMed]
- Barber, C.M.; Madaras, F.; Turnbull, R.K.; Morley, T.; Dunstan, N.; Allen, L.; Kuchel, T.; Mirtschin, P.; Hodgson, W.C. Comparative Studies of the Venom of a New Taipan Species, Oxyuranus temporalis, with Other Members of Its Genus. Toxins 2014, 6, 1979–1995. [Google Scholar] [CrossRef] [PubMed] [Green Version]
- Harrison, J.A.; Aquilina, J.A. Mass spectrometry data and size exclusion chromatography profiles of Australian taipan venom toxins. Data Brief 2016, 9, 501–507. [Google Scholar] [CrossRef] [Green Version]
- Maduwage, K.P.; Scorgie, F.E.; Lincz, L.F.; O’Leary, M.A.; Isbister, G.K. Procoagulant snake venoms have differential effects in animal plasmas: Implications for antivenom testing in animal models. Thromb. Res. 2016, 137, 174–177. [Google Scholar] [CrossRef]
- Hendrick, P.W. The Genetics of Populations; Science Books International: Portola Valley, CA, USA, 1983. [Google Scholar]
- Furtado, M.F.; Travaglia-Cardoso, S.; Rocha, M. Sexual dimorphism in venom of Bothrops jararaca(Serpentes: Viperidae). Toxicon 2006, 48, 401–410. [Google Scholar] [CrossRef]
- Augusto-De-Oliveira, C.; Stuginski, D.R.; Kitano, E.; Andrade-Silva, D.; Liberato, T.; Fukushima, I.; Serrano, S.M.T.; Zelanis, A. Dynamic Rearrangement in Snake Venom Gland Proteome: Insights intoBothrops jararacaIntraspecific Venom Variation. J. Proteome Res. 2016, 15, 3752–3762. [Google Scholar] [CrossRef]
- Modahl, C.M.; Mukherjee, A.K.; Mackessy, S.P. An analysis of venom ontogeny and prey-specific toxicity in the Monocled Cobra (Naja kaouthia). Toxicon 2016, 119, 8–20. [Google Scholar] [CrossRef]
- Del-Rei, T.H.M.; De Sousa, L.; Rocha, M.M.; Freitas-De-Sousa, L.A.; Travaglia-Cardoso, S.R.; Grego, K.; Sant’Anna, S.S.; Chalkidis, H.M.; Moura-Da-Silva, A.M. Functional variability of Bothrops atrox venoms from three distinct areas across the Brazilian Amazon and consequences for human envenomings. Toxicon 2019, 164, 61–70. [Google Scholar] [CrossRef] [PubMed]
- Sunagar, K.; Undheim, E.A.B.; Scheib, H.; Gren, E.C.; Cochran, C.; Person, C.E.; Koludarov, I.; Kelln, W.; Hayes, W.; King, G.F.; et al. Intraspecific venom variation in the medically significant Southern Pacific Rattlesnake (Crotalus oreganus helleri): Biodiscovery, clinical and evolutionary implications. J. Proteom. 2014, 99, 68–83. [Google Scholar] [CrossRef] [PubMed]
- Williams, V.; White, J.; Schwaner, T.D.; Sparrow, A. Variation in venom proteins from isolated populations of tiger snakes (Notechis ater niger, N. scutatus) in South Australia. Toxicon 1988, 26, 1067–1075. [Google Scholar] [CrossRef]
- Huang, H.-W.; Liu, B.-S.; Chien, K.-Y.; Chiang, L.-C.; Huang, S.-Y.; Sung, W.-C.; Wu, W.-G. Cobra venom proteome and glycome determined from individual snakes of Naja atra reveal medically important dynamic range and systematic geographic variation. J. Proteom. 2015, 128, 92–104. [Google Scholar] [CrossRef] [PubMed]
- Borja, M.; Lazcano, D.; Martínez-Romero, G.; Morlett-Chavez, J.A.; Sánchez, E.; Cepeda-Nieto, A.C.; Garza-García, Y.; Zugasti-Cruz, A. Intra-specific Variation in the Protein Composition and Proteolytic Activity of Venom of Crotalus lepidus morulus from the Northeast of Mexico. Copeia 2013, 2013, 707–716. [Google Scholar] [CrossRef]
- Currier, R.B.; Harrison, R.A.; Rowley, P.D.; Laing, G.D.; Wagstaff, S.C. Intra-specific variation in venom of the African Puff Adder (Bitis arietans): Differential expression and activity of snake venom metalloproteinases (SVMPs). Toxicon 2010, 55, 864–873. [Google Scholar] [CrossRef]
- Modahl, C.M.; Roointan, A.; Rogers, J.; Currier, K.; Mackessy, S.P. Interspecific and intraspecific venom enzymatic variation among cobras (Naja sp. and Ophiophagus hannah). Comp. Biochem. Physiol. Part C Toxicol. Pharmacol. 2020, 232, 108743. [Google Scholar] [CrossRef]
- Zdenek, C.N.; Hay, C.; Arbuckle, K.; Jackson, T.N.; Bos, M.H.; Brouw, B.O.D.; Debono, J.; Allen, L.; Dunstan, N.; Morley, T.; et al. Coagulotoxic effects by brown snake (Pseudonaja) and taipan (Oxyuranus) venoms, and the efficacy of a new antivenom. Toxicol. In Vitro 2019, 58, 97–109. [Google Scholar] [CrossRef] [Green Version]
- Allendorf, F.W.; Luikart, G.; Aitken, S.N. Conservation and the Genetics of Populations; Wiley & Sons: New York, NY, USA, 2013. [Google Scholar]
- O’Leary, M.A.; Isbister, G.K. A turbidimetric assay for the measurement of clotting times of procoagulant venoms in plasma. J. Pharmacol. Toxicol. Methods 2010, 61, 27–31. [Google Scholar] [CrossRef]


© 2020 by the authors. Licensee MDPI, Basel, Switzerland. This article is an open access article distributed under the terms and conditions of the Creative Commons Attribution (CC BY) license (http://creativecommons.org/licenses/by/4.0/).
Share and Cite
Tasoulis, T.; Silva, A.; Veerati, P.C.; Baker, M.; Hodgson, W.C.; Dunstan, N.; Isbister, G.K. Intra-Specific Venom Variation in the Australian Coastal Taipan Oxyuranus scutellatus. Toxins 2020, 12, 485. https://0-doi-org.brum.beds.ac.uk/10.3390/toxins12080485
Tasoulis T, Silva A, Veerati PC, Baker M, Hodgson WC, Dunstan N, Isbister GK. Intra-Specific Venom Variation in the Australian Coastal Taipan Oxyuranus scutellatus. Toxins. 2020; 12(8):485. https://0-doi-org.brum.beds.ac.uk/10.3390/toxins12080485
Chicago/Turabian StyleTasoulis, Theo, Anjana Silva, Punnam Chander Veerati, Mark Baker, Wayne C. Hodgson, Nathan Dunstan, and Geoffrey K. Isbister. 2020. "Intra-Specific Venom Variation in the Australian Coastal Taipan Oxyuranus scutellatus" Toxins 12, no. 8: 485. https://0-doi-org.brum.beds.ac.uk/10.3390/toxins12080485