Ochratoxin A Levels in Tissues of Wild Boars (Sus scrofa) from Northern Italy


 , ,
, ,
Abstract
:1. Introduction
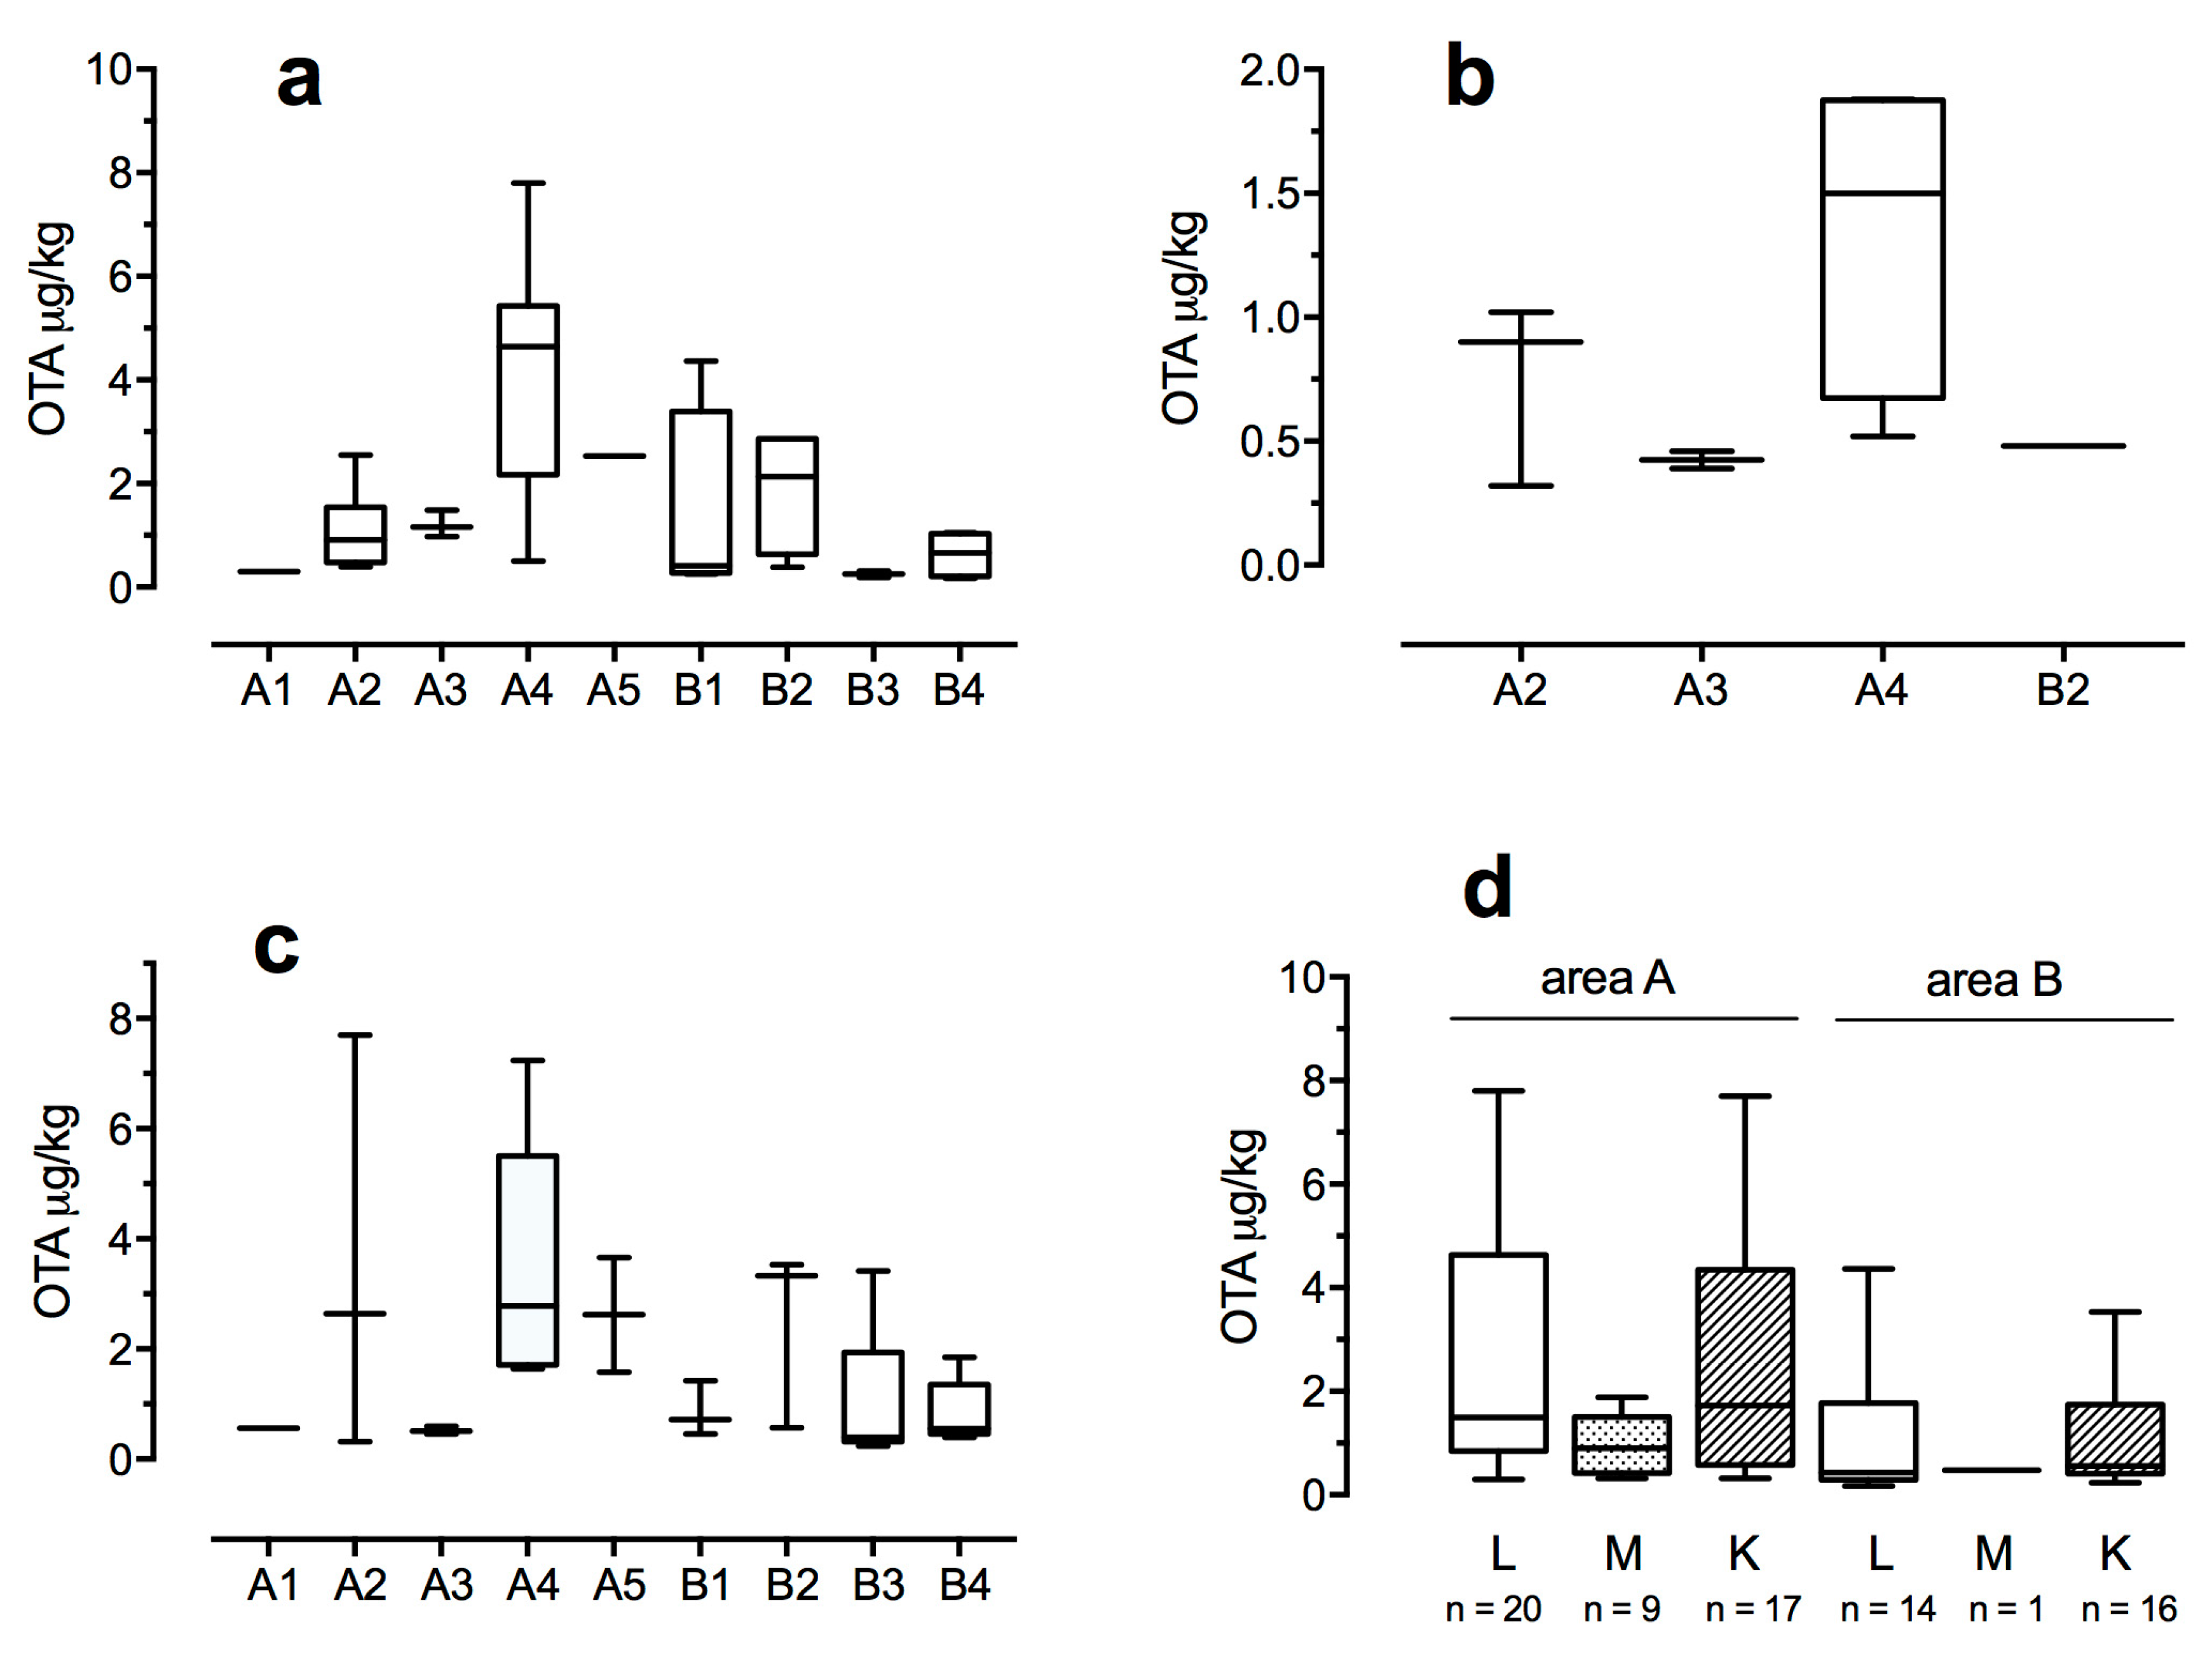
2. Results
3. Discussion
4. Conclusions
5. Materials and Methods
5.1. Samples
5.2. Reagents
5.3. Chromatographic Method
5.4. Samples Preparation
5.5. Spiked Samples
5.6. Method Validation
5.7. Statistical Analysis
Author Contributions
Funding
Acknowledgments
Conflicts of Interest
References
- Romani, S.; Sacchetti, G.; Lopez, C.C.; Pinnavaia, G.G.; Rosa, M.D. Screening on the occurrence of ochratoxin A in green coffee beans of different origins and types. J. Agric. Food Chem. 2000, 48, 3616–3619. [Google Scholar] [CrossRef]
- Galtier, P. Pharmacokinetics of ochratoxin A in animals. IARC Sci. Publ. 1991, 115, 187–200. [Google Scholar]
- Milićević, D.R.; Jurić, V.B.; Vuković, D.Z.; Mandić, M.M.; Baltić, T.M. Residue of ochratoxin a in swine tissues—Risk assessment. Arch. Oncol. 2009, 17, 56–60. [Google Scholar] [CrossRef] [Green Version]
- Petzinger, E.; Ziegler, K. Ochratoxin A from a toxicological perspective. J. Vet. Pharmacol. Ther. 2000, 23, 91–98. [Google Scholar] [CrossRef] [PubMed]
- Di Paolo, N.; Guarnieri, A.; Loi, F.; Sacchi, G.; Mangiarotti, A.M.; Di Paolo, M. Acute renal failure from inhalation of mycotoxins. Nephron 1993, 64, 621–625. [Google Scholar] [CrossRef] [PubMed]
- Malir, F.; Ostry, V.; Pfohl-Leszkowicz, A.; Malir, J.; Toman, J. Ochratoxin A: 50 years of research. Toxins 2016, 8, 191. [Google Scholar] [CrossRef] [Green Version]
- Krogh, P.; Hald, B.; Plestina, R.; Ceovic, S. Balkan (endemic) nephropathy and foodborn ochratoxin A: Preliminary results of a survey of foodstuffs. Acta Pathol. Microbiol. Scand. Sect. B Microbiol. Immunol. 1977, 85, 238–240. [Google Scholar] [CrossRef]
- Reddy, L.; Bhoola, K. Ochratoxins-food contaminants: Impact on human health. Toxins 2010, 2, 771–779. [Google Scholar] [CrossRef] [Green Version]
- Stoev, S.D. The role of ochratoxin A as a possible cause of Balkan endemic nephropathy and its risk evaluation. Vet. Hum. Toxicol. 1998, 53, 481–487. [Google Scholar]
- Walker, R.; Christian Larsen, J. Ochratoxin A: Previous risk assessments and issues arising. Food Addit. Contam. 2005, 22, 6–9. [Google Scholar] [CrossRef]
- Stoev, S.D.; Paskalev, M.; MacDonald, S.; Mantle, P.G. Experimental one year ochratoxin a toxicosis in pigs. Exp. Toxicol. Pathol. 2002, 53, 481–487. [Google Scholar] [CrossRef]
- Pfohl-Leszkowicz, A.; Petkova-Bocharova, T.; Chernozemsky, I.N.; Castegnaro, M. Balkan endemic nephropathy and associated urinary tract tumours: A review on aetiological causes and the potential role of mycotoxins. Food Addit. Contam. 2002, 19, 282–302. [Google Scholar] [CrossRef]
- Fuchs, R.; Peraica, M. Ochratoxin A in human kidney diseases. Food Addit. Contam. 2005, 22, 53–57. [Google Scholar] [CrossRef] [PubMed] [Green Version]
- Wafa, E.W.; Yahya, R.S.; Sobh, M.A.; Eraky, I.; El-Baz, M.; El-Gayar, H.A.M.; Betbeder, A.M.; Creppy, E.E. Human ochratoxicosis and nephropathy in Egypt: A preliminary study. Hum. Exp. Toxicol. 1998, 17, 124–129. [Google Scholar] [CrossRef] [PubMed]
- Higginson, J.; DeVita, V.T. IARC monographs on the evaluation of carcinogenic risk of chemicals to humans. Am. Ind. Hyg. Assoc. J. 1980, 41, A26, A28, A30 passim. [Google Scholar]
- Dönmez-Altuntaş, H.; Hamurcu, Z.; Imamoǧlu, N.; Liman, B.C. Effects of ochratoxin a on micronucleus frequency in human lymphocytes. Nahrung Food 2003, 47, 33–35. [Google Scholar] [CrossRef]
- European Food Safety Authority (EFSA). Opinion of the Scientific Panel on contaminants in the food chain [CONTAM] related to ochratoxin a in food. EFSA J. 2006, 365, 1–56. [Google Scholar]
- Hagelberg, S.; Hult, K.; Fuchs, R. Toxicokinetics of ochratoxin A in several species and its plasma-binding properties. J. Appl. Toxicol. 1989, 9, 91–96. [Google Scholar] [CrossRef]
- Kuiper-Goodman, T.; Hilts, C.; Billiard, S.M.; Kiparissis, Y.; Richard, I.D.K.; Hayward, S. Health risk assessment of ochratoxin a for all age-sex strata in a market economy. Food Addit. Contam. Part A Chem. Anal. Control. Expo. Risk Assess. 2010, 27, 212–240. [Google Scholar] [CrossRef] [Green Version]
- Duarte, S.C.; Lino, C.M.; Pena, A. Ochratoxin A in feed of food-producing animals: An undesirable mycotoxin with health and performance effects. Vet. Microbiol. 2011, 154, 1–13. [Google Scholar] [CrossRef] [PubMed]
- Ostry, V.; Malir, F.; Dofkova, M.; Skarkova, J.; Pfohl-Leszkowicz, A.; Ruprich, J. Ochratoxin a dietary exposure of ten population groups in the czech republic: Comparison with data over the world. Toxins 2015, 7, 3608–3635. [Google Scholar] [CrossRef] [Green Version]
- Pleadin, J.; Perši, N.; Kovačević, D.; Vulić, A.; Frece, J.; Markov, K. Ochratoxin A reduction in meat sausages using processing methods practiced in households. Food Addit. Contam. Part B Surveill. 2014, 7, 239–246. [Google Scholar] [CrossRef]
- Health, I.M.O. Direttiva in materia di controllo ufficiale sui prodotti alimentari: Valori massimi ammissibili di micotossine nelle derrate alimentari di origine nazionale, comunitaria e Paesi terzi. Gazz. Uff. 1999, 135, 10. [Google Scholar]
- Luci, G.; Intorre, L.; Ferruzzi, G.; Mani, D.; Giuliotti, L.; Pretti, C.; Tognetti, R.; Bertini, S.; Meucci, V. Determination of ochratoxin A in tissues of wild boar (Sus scrofa L.) by enzymatic digestion (ED) coupled to high-performance liquid chromatography with a fluorescence detector (HPLC-FLD). Mycotoxin Res. 2018, 34, 1–8. [Google Scholar] [CrossRef]
- Bozzo, G.; Ceci, E.; Bonerba, E.; Di Pinto, A.; Tantillo, G.; De Giglio, E. Occurrence of ochratoxin a in the wild boar (Sus scrofa): Chemical and histological analysis. Toxins 2012, 4, 1440–1450. [Google Scholar] [CrossRef]
- Markov, K.; Pleadin, J.; Bevardi, M.; Vahčić, N.; Sokolić-Mihalak, D.; Frece, J. Natural occurrence of aflatoxin B1, ochratoxin A and citrinin in Croatian fermented meat products. Food Control 2013, 34, 312–317. [Google Scholar] [CrossRef]
- Ozbey, F.; Kabak, B. Natural co-occurrence of aflatoxins and ochratoxin A in spices. Food Control 2012, 28, 354–361. [Google Scholar] [CrossRef]
- Wu, Q.; Dohnal, V.; Huang, L.; Kuca, K.; Wang, X.; Chen, G.; Yuan, Z. Metabolic Pathways of Ochratoxin A. Curr. Drug Metab. 2011, 12, 1–10. [Google Scholar] [CrossRef] [PubMed]
- Gonyou, H.W. The social behaviour of pigs. In Social Behaviour in Farm Animals; Cabi International: Wallingford, UK, 2009; pp. 147–176. [Google Scholar]
- Grajewski, J.; Twarużek, M.; Kosicki, R. High levels of ochratoxin A in blood serum and kidneys of wild boars Sus scrofa in Poland. Wildlife Biol. 2012, 18, 272–279. [Google Scholar] [CrossRef]
- Boitani, L.; Mattei, L.; Nonis, D.; Corsi, F. Spatial and Activity Patterns of Wild Boars in Tuscany, Italy. J. Mammal. 1994, 75, 600–612. [Google Scholar] [CrossRef]
- Graves, H.B. Behavior and Ecology of Wild and Feral Swine (Sus Scrofa). J. Anim. Sci. 1984, 58, 482–492. [Google Scholar] [CrossRef]
- European-Commission Commission. Regulation (EC) No 853/2004 of 29 April 2004 laying down specific hygiene rules for food of animal origin. Off. J. Eur. Union 2004, L269, 1–15. [Google Scholar]
- Monaci, L.; Tantillo, G.; Palmisano, F. Determination of ochratoxin a in pig tissues by liquid-liquid extraction and clean-up and high-performance liquid chromatography. Anal. Bioanal. Chem. 2004, 378, 1777–1782. [Google Scholar] [CrossRef] [PubMed]
- The Commission of The European Communities Commission. Decision 2002/657/EC of 12 August 2002 implementing Council Directive 96/23/EC concerning the performance of analytical methods and the interpretation of results. Off. J. Eur. Communities 2002, 50, 8–36. [Google Scholar]


| Parameters | Muscle | Liver | Kidney | |
|---|---|---|---|---|
| LOD (μg/kg) | 0.01 | 0.01 | 0.01 | |
| LOQ (μg/kg) | 0.05 | 0.05 | 0.05 | |
| r2 | 0.998 | 0.999 | 0.995 | |
| Repeatability | ||||
| 0.1 μg/kg (n = 3) | Mean concentration ± SD RSD (%) | 0.092 ± 0.006 6.20 | 0.088 ± 0.003 3.64 | 0.086 ± 0.005 6.15 |
| 1.0 μg/kg (n = 3) | Mean concentration ± SD RSD (%) | 0.83 ±0.04 4.82 | 0.92 ± 0.11 11.80 | 0.88 ± 0.08 9.10 |
| 5.0 μg/kg (n = 3) | Mean concentration ± SD RSD (%) | 5.03 ± 0.15 3.03 | 4.86± 0.35 7.22 | 4.73 ± 0.11 2.33 |
| Reproducibility | ||||
| 0.1 μg/kg (n = 15) | Mean concentration ± SD RSD (%) | 0.091 ± 0.007 8.01 | 0.088 ± 0.008 8.65 | 0.086 ± 0.005 6.17 |
| 1.0 μg/kg (n = 15) | Mean concentration ± SD RSD (%) | 0.92 ± 0.12 13.3 | 0.96 ± 0.13 14.03 | 0.84± 0.08 9.50 |
| 5.0 μg/kg (n = 15) | Mean concentration ± SD RSD (%) | 4.87 ± 0.17 3.45 | 4.76 ± 0.21 4.48 | 4.75 ± 0.11 2.42 |
| OTA Recovery % | ||||
| 0.1 μg/kg (n = 15) | 90.78 ± 7.27 | 88.44 ± 7.65 | 86.89 ± 5.30 | |
| 1.0 μg/kg (n = 15) | 91.67 ± 12.3 | 96.33 ± 13.5 | 86.44 ± 8.00 | |
| 5.0 μg/kg (n = 15) | 97.40 ± 3.36 | 95.18 ± 1.42 | 95.02 ± 2.31 | |
| OTB Recovery % | ||||
| 20.0 μg/kg (n = 15) | 95.30 ± 4.56 | 91.00 ± 3.21 | 91.24 ± 5.10 | |
| Sex | n | Liver | Muscle | Kidney |
|---|---|---|---|---|
| Males | 23 | 0.50 (<LOD–5.75) | <LOD (<LOD–1.88) | 0.45 (<LOD–7.70) |
| Females | 41 | <LOD (<LOD–7.80) | <LOD (<LOD–1.14) | <LOD (<LOD–5.66) |
| Total | 64 | 0.22 (<LOD–7.80) * | <LOD (<LOD–1.88) | 0.28 (<LOD–7.70) * |
| Age Class | n | Liver | Muscle | Kidney |
|---|---|---|---|---|
| Young | 22 | 0.34 (<LOD–5.75) | <LOD (<LOD–1.86) | 0.39 (<LOD–3.66) |
| Adult | 42 | 0.09 (<LOD–7.80) | <LOD (<LOD–1.88) | 0.12 (<LOD–7.70) |
| Total | 64 | 0.22 (<LOD–7.80) * | <LOD (<LOD–1.88) | 0.28 (<LOD–7.70) * |
| Sampling Area | Liver | Muscle | Kidney |
|---|---|---|---|
| A1 (n = 2) | 0.15 (<LOD–0.30) | <LOD (<LOD–<LOD) | 0.28 (<LOD–0.56) |
| A2 (n = 7) | 0.80 (<LOD–2.55) | <LOD (<LOD–1.02) | <LOD (<LOD–7.70) |
| A3 (n = 4) | 1.07 (<LOD–1.49) | 0.20 (<LOD–0.46) | 0.49 (<LOD–0.60) |
| A4 (n = 10) | 4.63 (<LOD–7.80) a,b | <LOD (<LOD–1.88) | 2.13 (<LOD–7.24) c,d |
| A5 (n = 3) | <LOD (<LOD–2.53) | <LOD (<LOD–<LOD) | 1.58 (<LOD–3.66) |
| Area A (n = 26) | 1.09 (<LOD–7.80) *,§ | <LOD (<LOD–1.88) § | 0.58 (<LOD–7.70) *,§ |
| B1 (n = 10) | <LOD (<LOD–4.37) | <LOD (<LOD–<LOD) | <LOD (<LOD–1.42) |
| B2 (n = 5) | 1.41 (<LOD–2.87) | <LOD (<LOD–0.48) | 0.57 (<LOD–3.53) |
| B3 (n = 10) | <LOD (<LOD–0.31) | <LOD (<LOD–<LOD) | 0.12 (<LOD–3.42) |
| B4 (n = 13) | <LOD (<LOD–1.05) | <LOD (<LOD–<LOD) | <LOD (<LOD–1.85) |
| Area B (n = 38) | <LOD (<LOD–4.37) | <LOD (<LOD–0.48) | <LOD (<LOD–3.53) |
| Total (area A + B) (n = 64) | 0.22 (<LOD–7.80) * | <LOD (<LOD–1.88) | 0.28 (<LOD–7.70) * |
Publisher’s Note: MDPI stays neutral with regard to jurisdictional claims in published maps and institutional affiliations. |
© 2020 by the authors. Licensee MDPI, Basel, Switzerland. This article is an open access article distributed under the terms and conditions of the Creative Commons Attribution (CC BY) license (http://creativecommons.org/licenses/by/4.0/).
Share and Cite
Iemmi, T.; Menozzi, A.; Meucci, V.; Magnini, I.; Battaglia, F.; Severino, L.; Ariano, A.; Bertini, S. Ochratoxin A Levels in Tissues of Wild Boars (Sus scrofa) from Northern Italy. Toxins 2020, 12, 706. https://0-doi-org.brum.beds.ac.uk/10.3390/toxins12110706
Iemmi T, Menozzi A, Meucci V, Magnini I, Battaglia F, Severino L, Ariano A, Bertini S. Ochratoxin A Levels in Tissues of Wild Boars (Sus scrofa) from Northern Italy. Toxins. 2020; 12(11):706. https://0-doi-org.brum.beds.ac.uk/10.3390/toxins12110706
Chicago/Turabian StyleIemmi, Tiziano, Alessandro Menozzi, Valentina Meucci, Irene Magnini, Federica Battaglia, Lorella Severino, Andrea Ariano, and Simone Bertini. 2020. "Ochratoxin A Levels in Tissues of Wild Boars (Sus scrofa) from Northern Italy" Toxins 12, no. 11: 706. https://0-doi-org.brum.beds.ac.uk/10.3390/toxins12110706