Silver-109/Silver/Gold Nanoparticle-Enhanced Target Surface-Assisted Laser Desorption/Ionisation Mass Spectrometry—The New Methods for an Assessment of Mycotoxin Concentration on Building Materials


Abstract
:1. Introduction
2. Results
3. Conclusions
4. Materials and Methods
4.1. Preparation of 109AgNPET Target
4.2. Preparation of AgNPET
4.3. Preparation of AuNPET
4.4. Moulds Mycotoxins Standards Analysis
4.5. Analysis of Mycotoxin Standards on Plasterboards
4.6. LDI Mass Spectrometry
Author Contributions
Funding
Institutional Review Board Statement
Informed Consent Statement
Data Availability Statement
Conflicts of Interest
References
- Sulyok, M.; Berthiller, F.; Krska, R.; Schuhmacher, R. Development and validation of a liquid chromatography/tandem mass spectrometric method for the determination of 39 mycotoxins in wheat and maize. Rapid Commun. Mass Spectrom. 2006, 20, 2649–2659. [Google Scholar] [CrossRef] [PubMed]
- Capriotti, A.L.; Caruso, G.; Cavaliere, C.; Foglia, P.; Samperi, R.; Laganà, A. Multiclass mycotoxin analysis in food, environmental and biological matrices with chromatography/mass spectrometry. Mass Spectrom. Rev. 2012, 31, 466–503. [Google Scholar] [CrossRef] [PubMed]
- Zöllner, P.; Mayer-Helm, B. Trace mycotoxin analysis in complex biological and food matrices by liquid chromatography–atmospheric pressure ionisation mass spectrometry. J. Chromatogr. A 2006, 1136, 123–169. [Google Scholar] [CrossRef] [PubMed]
- Anfossi, L.; Giovannoli, C.; Baggiani, C. Mycotoxin detection. Curr. Opin. Biotechnol. 2016, 201637, 120–126. [Google Scholar] [CrossRef]
- Brewer, J.H.; Thrasher, J.D.; Straus, D.C.; Madison, R.A.; Hooper, D. Detection of mycotoxins in patients with chronic fatigue syndrome. Toxins 2013, 5, 605–617. [Google Scholar] [CrossRef] [Green Version]
- Andersen, B.; Frisvad, J.C.; Søndergaard, I.; Rasmussen, I.S.; Larsen, L.S. Associations between fungal species and water-damaged building materials. Appl. Environ. Microbiol. 2011, 77, 4180–4188. [Google Scholar] [CrossRef] [Green Version]
- Szulc, J.; Ruman, T.; Gutarowska, B. Metabolome profiles of moulds on carton-gypsum board and malt extract agar medium obtained using an AuNPET SALDI-ToF-MS method. Int. Biodeterior. Biodegr. 2017, 125, 13–23. [Google Scholar] [CrossRef]
- Hyvärinen, A.; Meklin, T.; Vepsäläinen, A.; Nevalainen, A. Fungi and actinobacteria in moisture-damaged building materials—Concentrations and diversity. Int. Biodeterior. Biodegr. 2002, 49, 27–37. [Google Scholar] [CrossRef]
- Gutarowska, B.; Piotrowska, M. Methods of mycological analysis in buildings. Build. Environ. 2007, 42, 1843–1850. [Google Scholar] [CrossRef]
- Gutarowska, B. Metabolic activity of moulds as a factor of building materials biodegradation. Pol. J. Microbiol. 2010, 59, 119–124. [Google Scholar] [CrossRef]
- Nielsen, K.F. Mycotoxin production by indoor molds. Fungal Genet. Biol. 2003, 39, 103–117. [Google Scholar] [CrossRef]
- Straus, D.C. Molds, mycotoxins, and sick building syndrome. Toxicol. Ind. Health 2009, 25, 617–635. [Google Scholar] [CrossRef] [PubMed]
- Tuuminen, T.; Lohi, J. Dampness and mold hypersensitivity syndrome is a Biotoxicosis that should be diagnosed promptly. Adv. Clin. Toxicol. 2019, 4, 000144. [Google Scholar] [CrossRef]
- Hyvönen, S.; Lohi, J.; Tuuminen, T. Moist and mold exposure is associated with high prevalence of neurological symptoms and MCS in a finnish hospital workers cohort. Saf. Health Work. 2020, 11, 173–177. [Google Scholar] [CrossRef]
- Soroka, P.M.; Cyprowski, M.; Szadkowska-Stańczyk, I. Occupational exposure to mycotoxins in various branches of industry. Med. Pr. 2008, 59, 333–345. (In Polish) [Google Scholar]
- Nieminen, S.M.; Karki, R.; Auriola, S.; Toivola, M.; Laatsch, H.; Laatikainen, R.; Hyvarinen, A.; Von Wright, A. Isolation and identification of Aspergillus fumigatus mycotoxins on growth medium and some building materials. Appl. Environ. Microbiol. 2002, 68, 4871–4875. [Google Scholar] [CrossRef] [Green Version]
- Engelhart, S.; Loock, A.; Skutlarek, D.; Sagunski, H.; Lommel, A.; Färber, H.; Exner, M. Occurrence of toxigenic Aspergillus versicolor isolates and sterigmatocystin in carpet dust from damp indoor environments. Appl. Environ. Microbiol. 2002, 68, 3886–3890. [Google Scholar] [CrossRef] [Green Version]
- Johanning, E.; Gareis, M.; Nielsen, K.F.; Dietrich, R.; Märtlbauer, E. Airborne Mycotoxin Sampling and Screening Analysis. In Indoor Air 2002 Proceedings of the 9th International Conference on Indoor Air Quality and Climate, 30 June–5 July 2002, Monterey, CA, USA; Levin, H., Bendy, G., Cordell, J., Eds.; The International Academy of Indoor Air Sciences: Santa Cruz, CA, USA, 2002; Volume 5, pp. 1–6. [Google Scholar]
- Jarvis, B.B.; Miller, J.D. Mycotoxins as harmful indoor air contaminants. Appl. Microbiol. Biotechnol. 2005, 66, 367–372. [Google Scholar] [CrossRef]
- Frisvad, J.C.; Thrane, U.; Filtenborg, O. Role and use of secondary metabolites in fungal taxonomy. In Chemical Fungal Taxonomy; Frisvad, J.C., Bridge, P.D., Arora, D.K., Eds.; Marcel Dekker: New York, NY, USA, 1998; pp. 289–319. [Google Scholar]
- Adan, O.C.G.; Samson, R.A. Fundamentals of Mold Growth in Indoor Environments and Strategies for Healthy Living; Wageningen Academic Publishers: Wageningen, The Netherlands,, 2011. [Google Scholar] [CrossRef]
- Frisvad, J.C.; Nielsen, K.F.; Samson, R.A. Recommendations concerning the chronic problem of misidentification of mycotoxinogenic fungi associated with foods and feeds. Adv. Exp. Med. Biol. 2006, 571, 33–46. [Google Scholar]
- Stoev, S.D.; Daskalov, H.; Radic, B.; Domijan, A.M.; Peraica, M. Spontaneous mycotoxic nephropathy in Bulgarian chickens with unclarified mycotoxin aetiology. Vet. Res. 2002, 33, 83–93. [Google Scholar] [CrossRef] [Green Version]
- Shanakhat, H.; Sorrentino, A.; Raiola, A.; Romano, A.; Masi, P.; Cavella, S. Current methods for mycotoxins analysis and innovative strategies for their reduction in cereals: An overview. J. Sci Food Agric. 2018, 98, 4003–4013. [Google Scholar] [CrossRef] [PubMed]
- Sulyok, M.; Krska, R.; Schuhmacher, R. A liquid chromatography/tandem mass spectrometric multi-mycotoxin method for the quantification of 87 analytes and its application to semi-quantitative screening of moldy food samples. Anal. Bioanal. Chem. 2007, 389, 1505–1523. [Google Scholar] [CrossRef] [PubMed]
- Malachová, A.; Sulyok, M.; Beltrán, E.; Berthiller, F.; Krska, R. Optimization and validation of a quantitative liquid chromatography-tandem mass spectrometric method covering 295 bacterial and fungal metabolites including all regulated mycotoxins in four model food matrices. J. Chromatogr. A 2014, 1362, 145–156. [Google Scholar] [CrossRef] [PubMed] [Green Version]
- Lacina, O.; Zachariasova, M.; Urbanova, J.; Vaclavikova, M.; Cajka, T.; Hajslova, J. Critical assessment of extraction methods for the simultaneous determination of pesticide residues and mycotoxins in fruits, cereals, spices and oil seeds employing ultra-high performance liquid chromatography-tandem mass spectrometry. J. Chromatogr. A 2012, 1262, 8–18. [Google Scholar] [CrossRef] [PubMed]
- Beltrán, E.; Ibáñez, M.; Portolés, T.; Ripollés, C.; Sancho, V.; Marín, S.; Yusà, V.; Hernández, F. Development of sensitive and rapid analytical methodology for food analysis of 18 mycotoxins included in a total diet study. Anal. Chim. Acta 2013, 783, 39–48. [Google Scholar] [CrossRef]
- Nielsen, K.F. Mould Growth on Building Materials. Secondary Metabolites, Mycotoxins and Biomarkers. Ph.D. Thesis, Technical University of Denmark, Kgs. Lyngby, Denmark, 2002. [Google Scholar]
- Cassagne, C.; Ranque, S.; Normand, A.C.; Fourquet, P.; Thiebault, S.; Planard, C.; Hendrickx, M.; Piarroux, R. Mould routine identification in the clinical laboratory by matrix-assisted laser desorption ionization time-of-flight mass spectrometry. PLoS ONE 2011, 6, e28425. [Google Scholar] [CrossRef]
- Ulrich, S.; Biermaier, B.; Bader, O.; Wolf, G.; Straubinger, R.K.; Didier, A.; Sperner, B.; Schwaiger, K.; Gareis, M.; Gottschalk, C. Identification of Stachybotrys spp. by MALDI-TOF mass spectrometry. Anal. Bioanal. Chem. 2016, 408, 7565–7581. [Google Scholar] [CrossRef]
- Nizioł, J.; Rode, W.; Laskowska, B.; Ruman, T. Novel monoisotopic 109AgNPET for laser desorption/ionization mass spectrometry. Anal. Chem. 2013, 85, 1926–1931. [Google Scholar] [CrossRef]
- Nizioł, J.; Ossoliński, K.; Ossolińnski, T.; Ossolińska, A.; Bonifay, V.; Sekuła, J.; Dobrowolski, Z.; Sunner, J.; Beech, I.; Ruman, T. Surface-transfer mass spectrometry imaging of renal tissue on gold nanoparticle enhanced target. Anal. Chem. 2016, 88, 7365–7371. [Google Scholar] [CrossRef]
- Kuo, T.; Chen, Y.; Wang, C.; Shen, T.; Wang, H.; Pan, X.; Wang, D.; Liou, C.C.; Chang, Y.; Chen, Y.; et al. Highly oriented Langmuir–Blodgett film of silver cuboctahedra as an effective matrix-free sample plate for surface-assisted laser desorption/ionization mass spectrometry. Nanoscale 2017, 9, 11119–11125. [Google Scholar] [CrossRef]
- Sekuła, J.; Nizioł, J.; Misiorek, M.; Dec, P.; Wrona, A.; Arendowski, A.; Ruman, T. Gold nanoparticle-enhanced target for MS analysis and imaging of harmful compounds in plant, animal tissue and on fingerprint. Anal. Chim. Acta 2015, 895, 45–53. [Google Scholar] [CrossRef] [PubMed]
- Sekuła, J.; Nizioł, J.; Rode, W.; Ruman, T. Gold nanoparticle-enhanced target (AuNPET) as universal solution for laser desorption/mass spectrometry analysis and imaging of low molecular weight compounds. Anal. Chim. Acta 2015, 875, 61–72. [Google Scholar] [CrossRef] [PubMed]
- Liu, Y.-C.; Chang, Y.-H.; Lin, Y.-H.; Liou, C.-C.; Kuo, T.-R. High-Performance Sample Substrate of Gold Nanoparticle Multilayers for Surface-Assisted Laser Desorption/Ionization Mass Spectrometry. Nanomaterials 2019, 9, 1078. [Google Scholar] [CrossRef] [PubMed] [Green Version]
- Pan, X.Y.; Chen, C.H.; Chang, Y.H.; Wang, D.Y.; Lee, Y.C.; Liou, C.C.; Wang, Y.X.; Hu, C.C.; Kuo, T.R. Osteoporosis risk assessment using multilayered gold-nanoparticle thin film via SALDI-MS measurement. Anal. Bioanal. Chem. 2019, 411, 2793–2802. [Google Scholar] [CrossRef]
- Szulc, J.; Otlewska, A.; Ruman, T.; Kubiak, K.; Karbowska-Berent, J.; Kozielec, T.; Gutarowska, B. Analysis of paper foxing by newly available omics techniques. Int. Biodeter. Biodegr. 2018, 132, 157–165. [Google Scholar] [CrossRef]
- Szulc, J.; Ruman, T.; Karbowska-Berent, J.; Kozielec, T.; Gutarowska, B. Analyses of microorganisms and metabolites diversity on historic photographs using innovative methods. Analyses of microorganisms and metabolites diversity on historic photographs using innovative methods. J. Cult. Herit. 2020, 45, 101–113. [Google Scholar] [CrossRef]
- Szulc, J.; Jabłonskaja, I.; Jabłońska, E.M.; Ruman, T.; Karbowska-Berent, J.; Gutarowska, B. Metabolomics and metagenomics characteristic of historic beeswax seals. Int. Biodeter. Biodegr. 2020, 152, 105012. [Google Scholar] [CrossRef]
- Tuomi, T.; Reijula, K.; Johnsson, T.; Hemminki, K.; Hintikka, E.L.; Lindroos, O.; Kalso, S.; Koukila-Kähkölä, P.; Mussalo-Rauhamaa, H.; Haahtela, T. Mycotoxins in crude building materials from water-damaged buildings. Appl. Environ. Microbiol. 2000, 66, 1899–1904. [Google Scholar] [CrossRef] [Green Version]
- Nizioł, J.; Rode, W.; Zieliński, Z.; Ruman, T. Matrix-free laser desorption–ionization with silver nanoparticle-enhanced steel targets. Matrix-free laser desorption-ionization with silver nanoparticle enhanced steel targets. Int. J. Mass Spectrom. 2013, 335, 22–32. [Google Scholar] [CrossRef]
- Nizioł, J.; Ruman, T. Surface-transfer mass spectrometry imaging on monoisotopic silver nanoparticle enhanced target. Anal. Chem. 2013, 85, 12070–12076. [Google Scholar] [CrossRef]


| Toxin | 109AgNPs | AgNPs | AuNPs | MALDI | ||||
|---|---|---|---|---|---|---|---|---|
| LOD a (ng/mL) (µM) | LLOQ b (ng/mL) | LOD a (ng/mL) (µM) | LLOQ b (ng/mL) | LOD a (ng/mL) (µM) | LLOQ b (ng/mL) | LOD a (ng/mL) (µM) | LLOQ b (ng/mL) | |
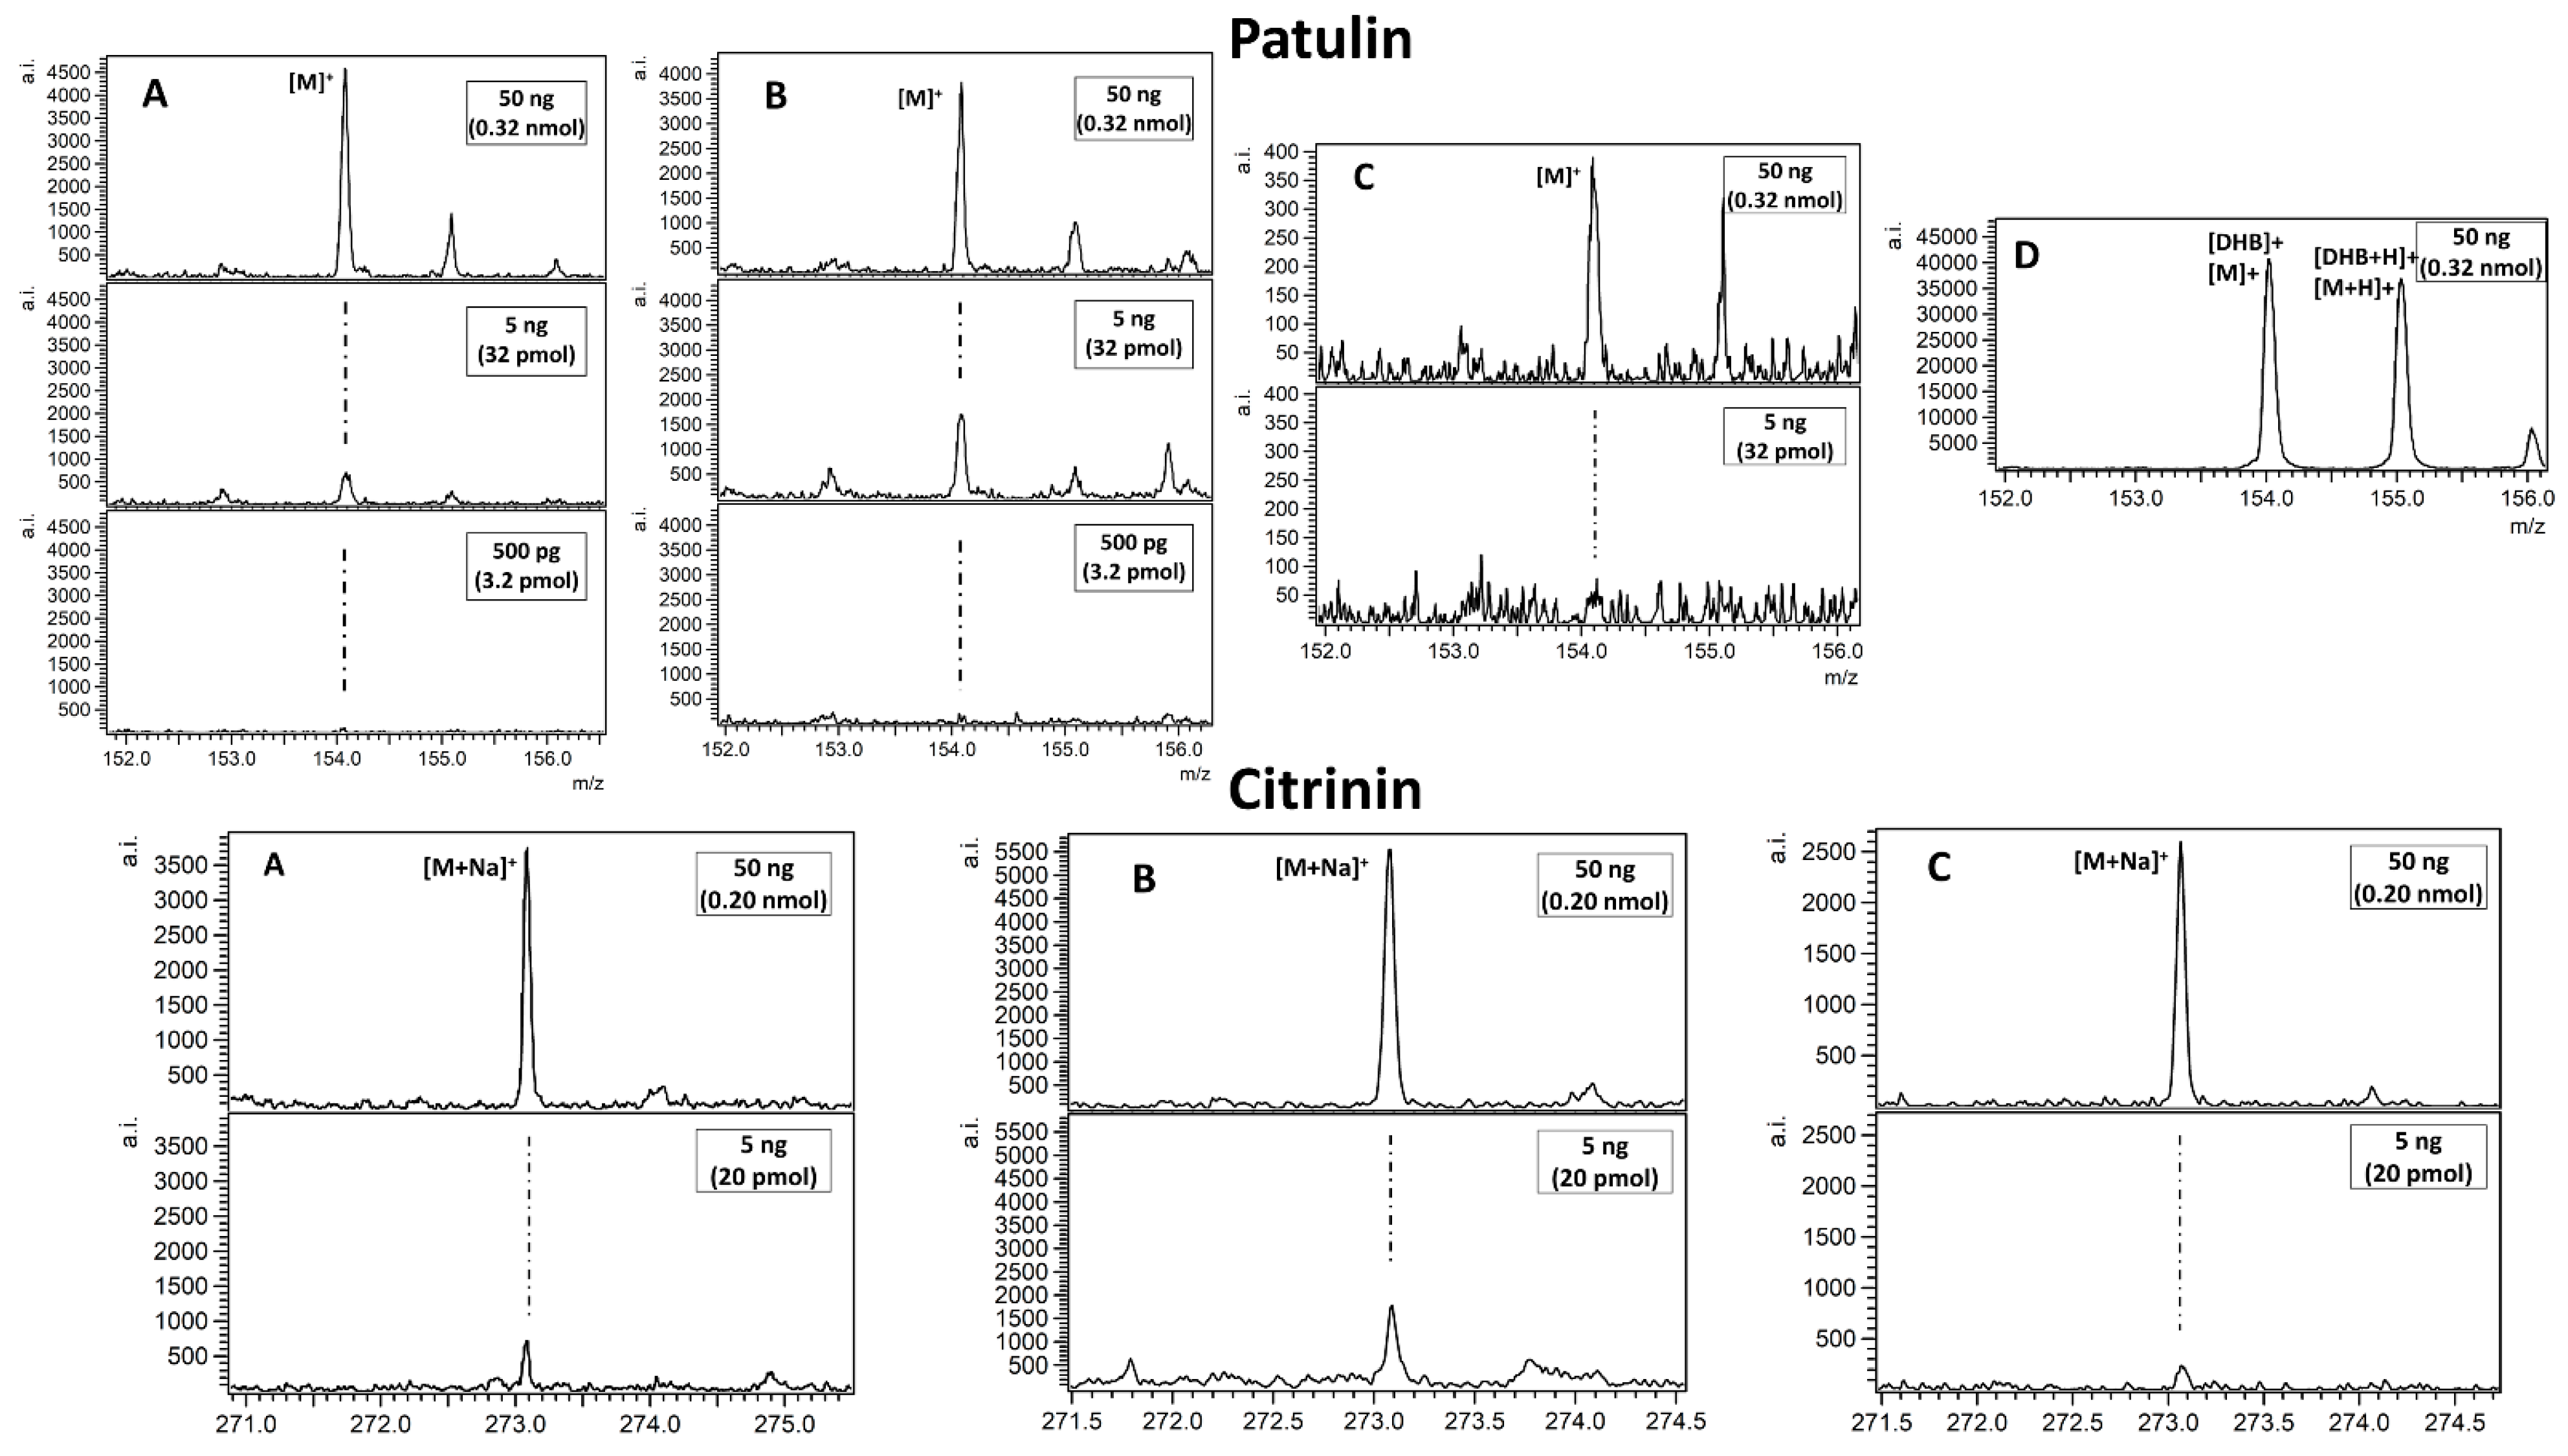
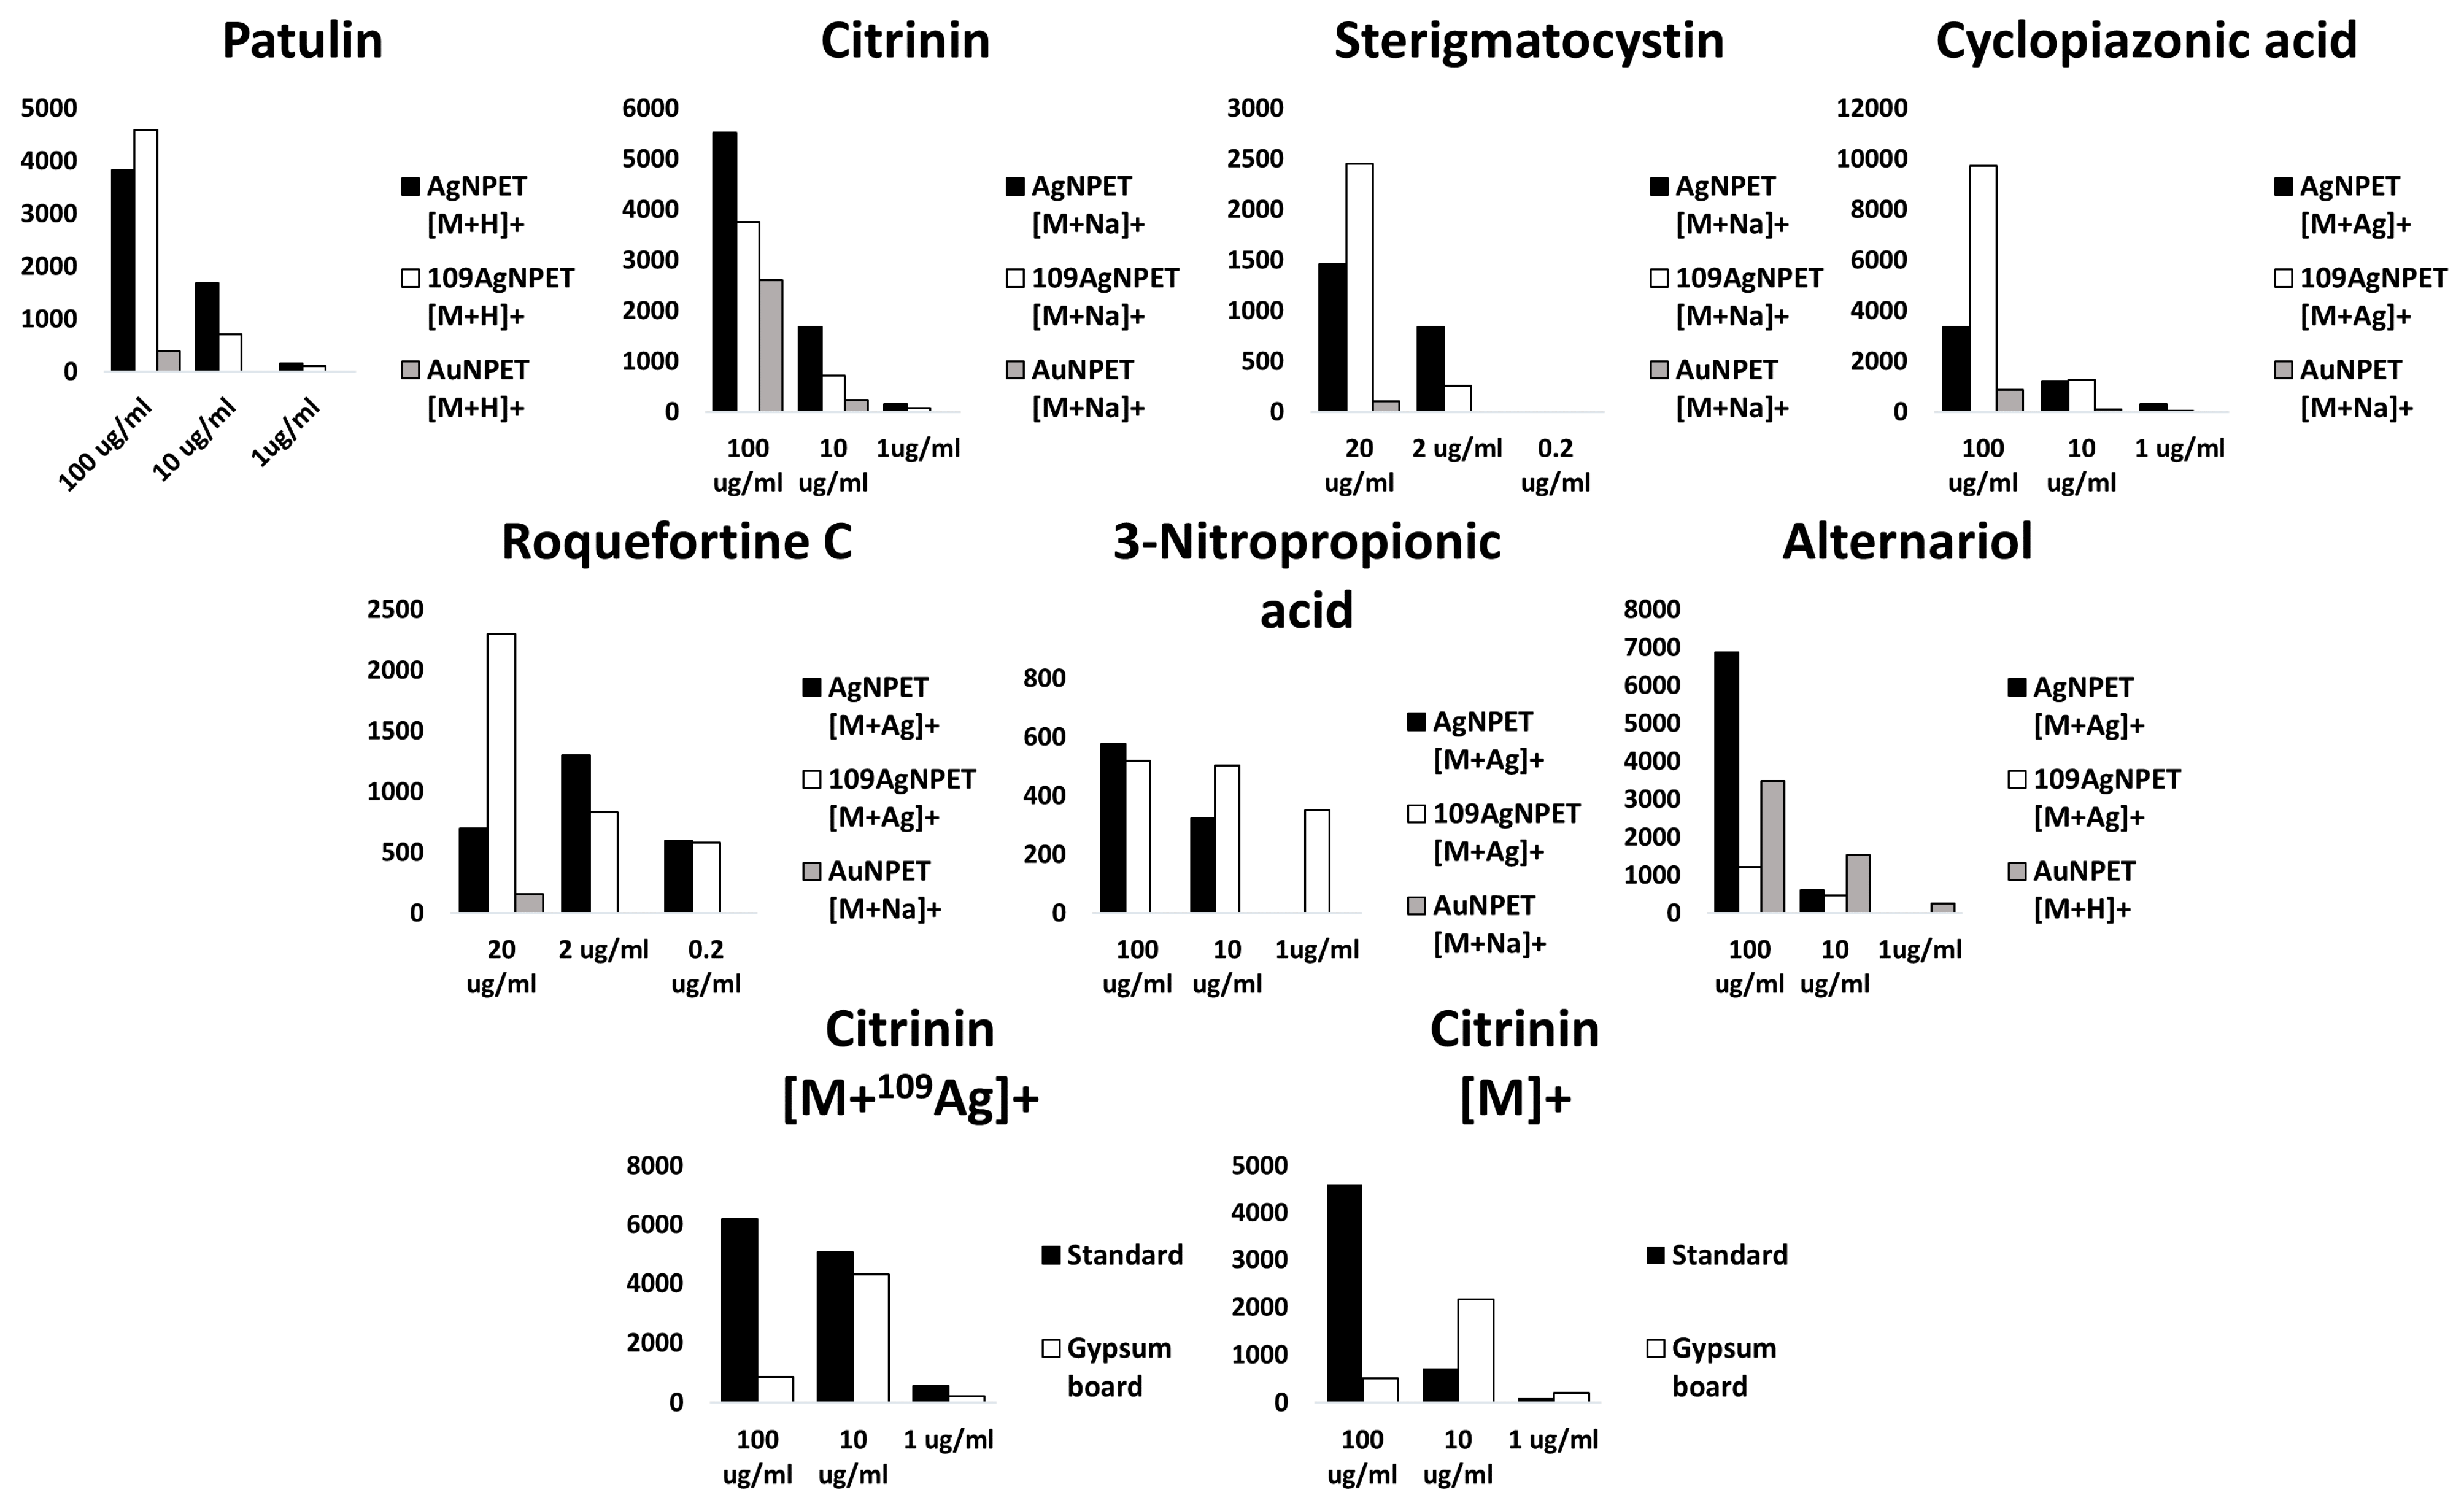
| Patulin | 4271 27.7 | 7118 | 5565 36.1 | 9276 | 30,000 194.7 | 50,000 | nd | nd |
| Citrinin | 6830 27.3 | 11,384 | 6905 27.6 | 11,508 | 5405 21.6 | 9009 | nd | nd |
| Citrinin (Cation Radical Adduct) Extracted from Plasterboards | 561 2.24 | 935 | nd | nd | 96,774 248.5 | 161,290 | nd | nd |
| Citrinin (109Ag Adduct) Extracted from PlasterBoards | 396 1.58 | 660 | 58,824 151.0 | 98,039 | nd | nd | nd | nd |
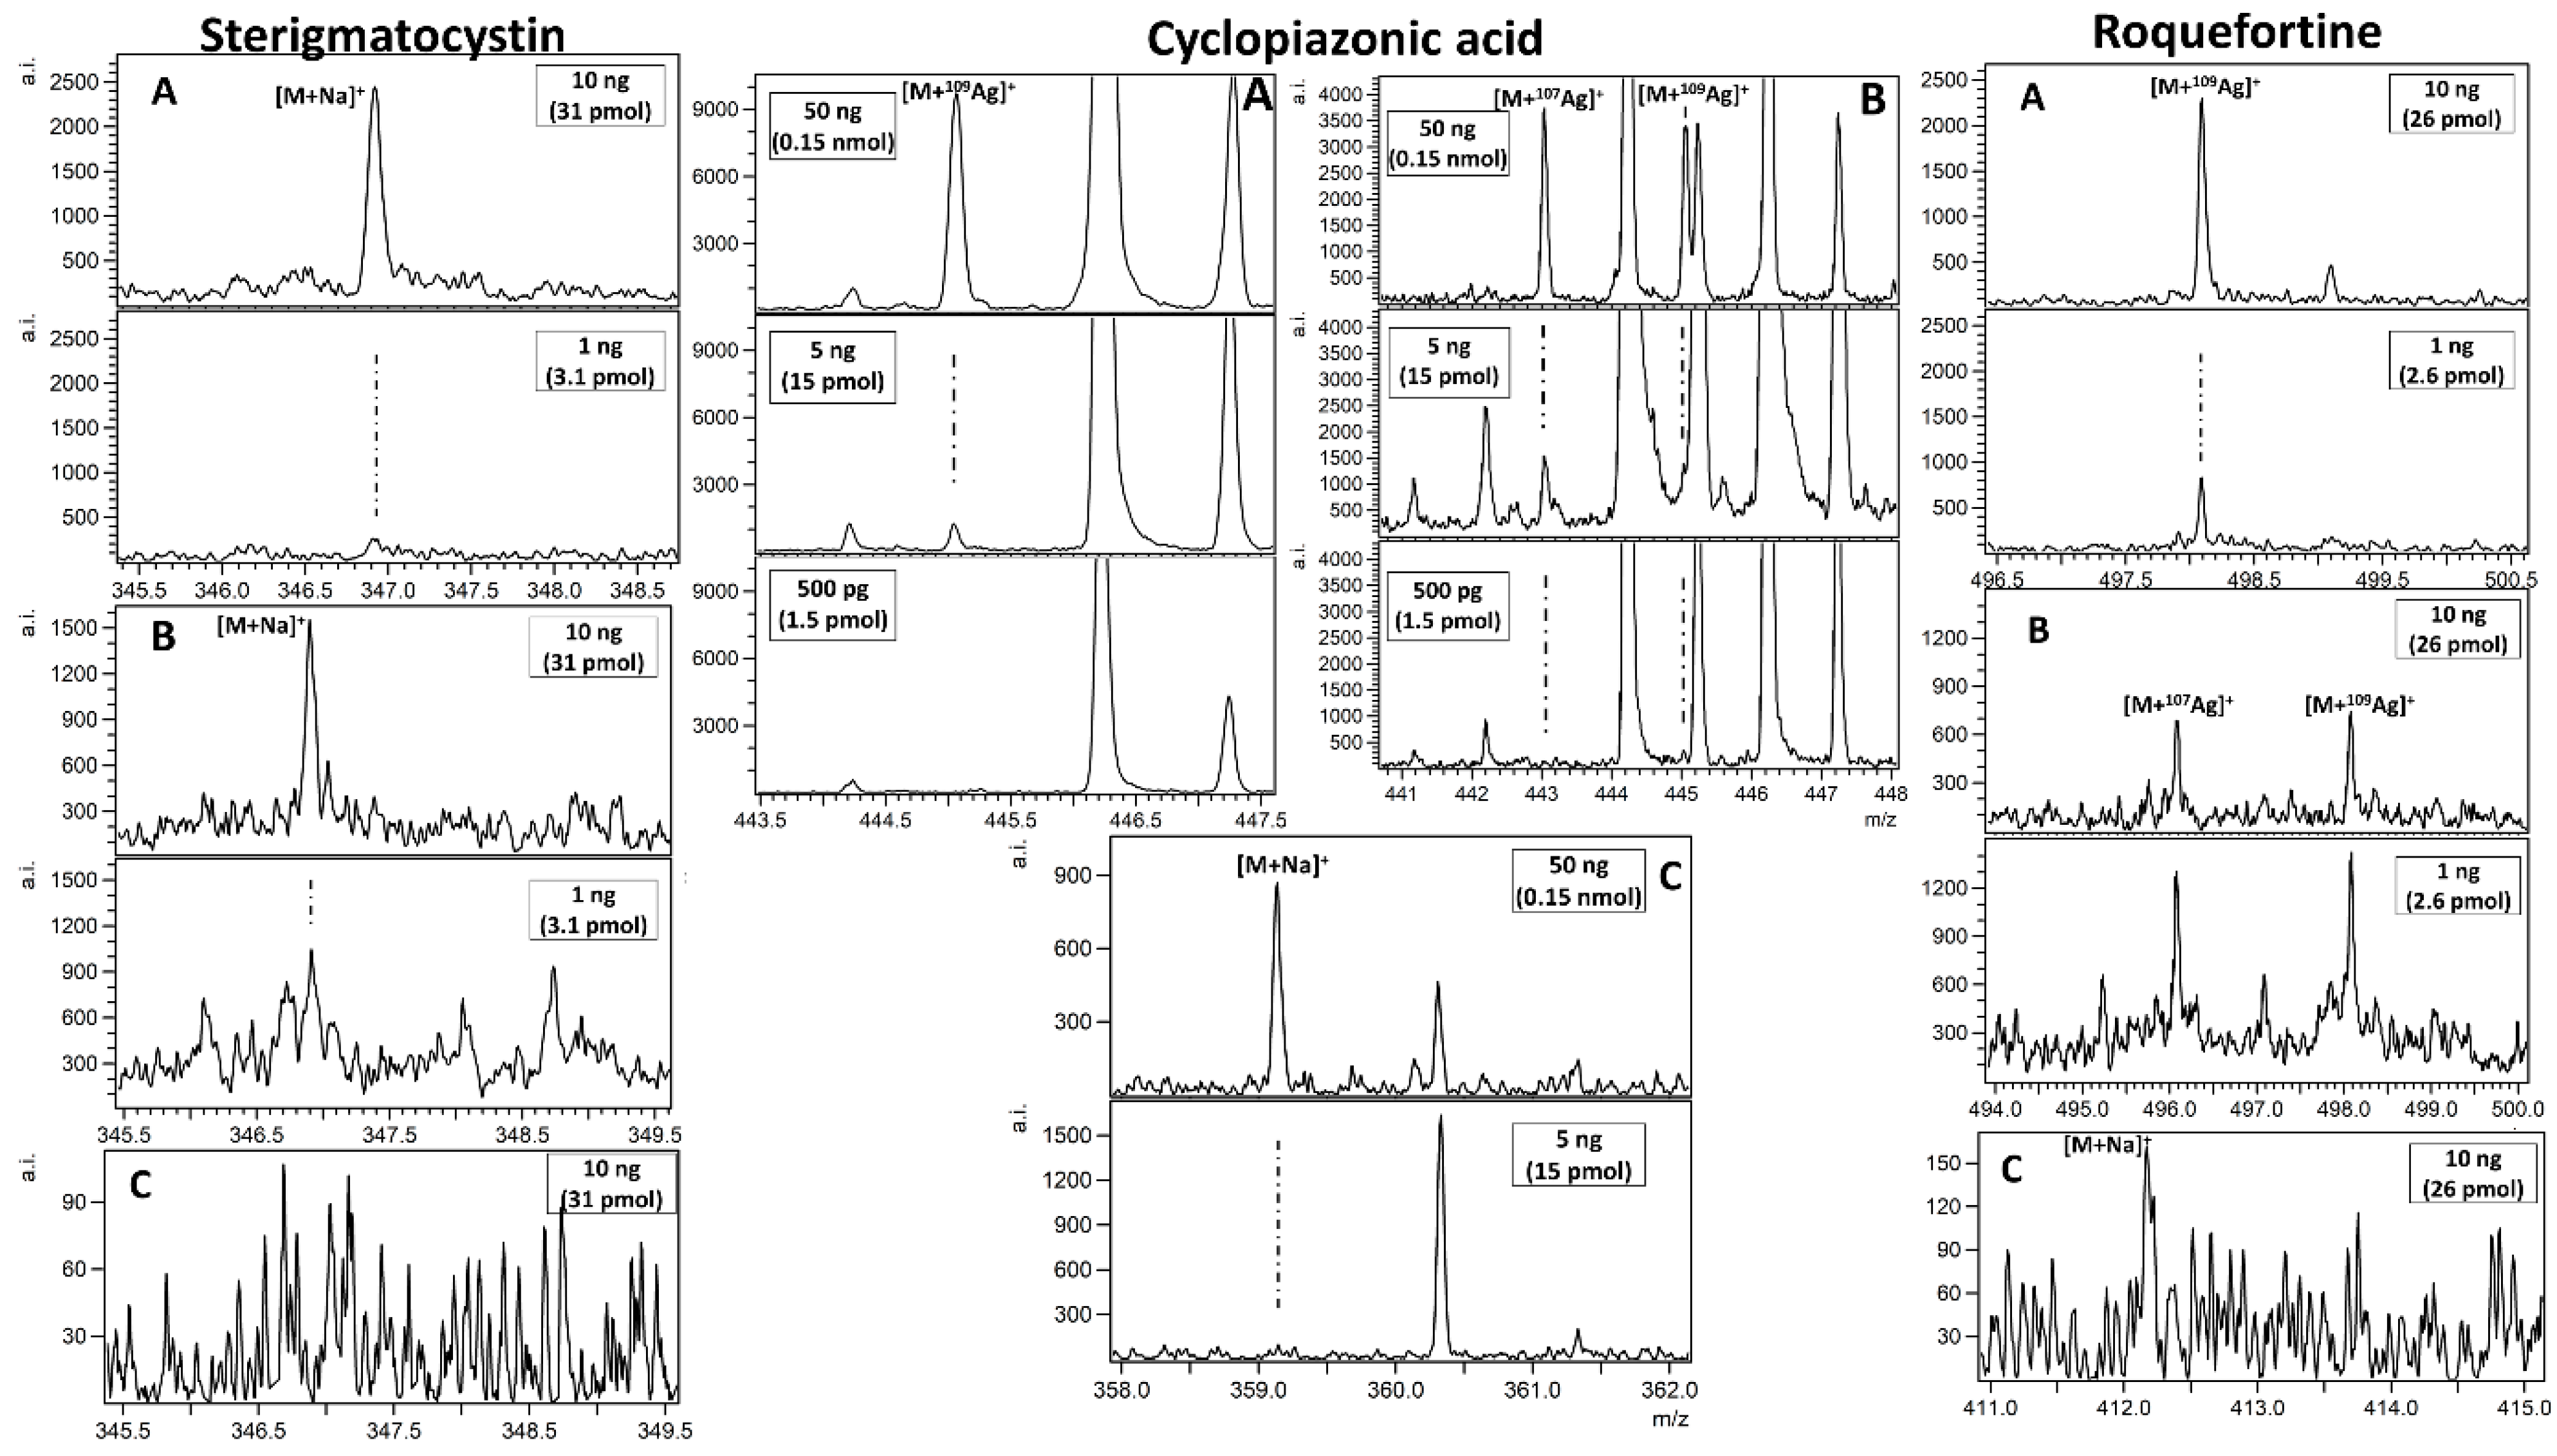
| Sterigmatocystin | 15,272 47.1 | 25,453 | 19,990 61.6 | 33,317 | nd | nd | nd | nd |
| Cyclopiazonic Acid | 2756 8.19 | 4594 | 17,298 51.4 | 28,830 | 17,143 51.0 | 28,571 | nd | nd |
| Roquefortine C | 7935 20.4 | 13,225 | 27,883 71.6 | 46,471 | 93,750 240.7 | 156,250 | nd | nd |
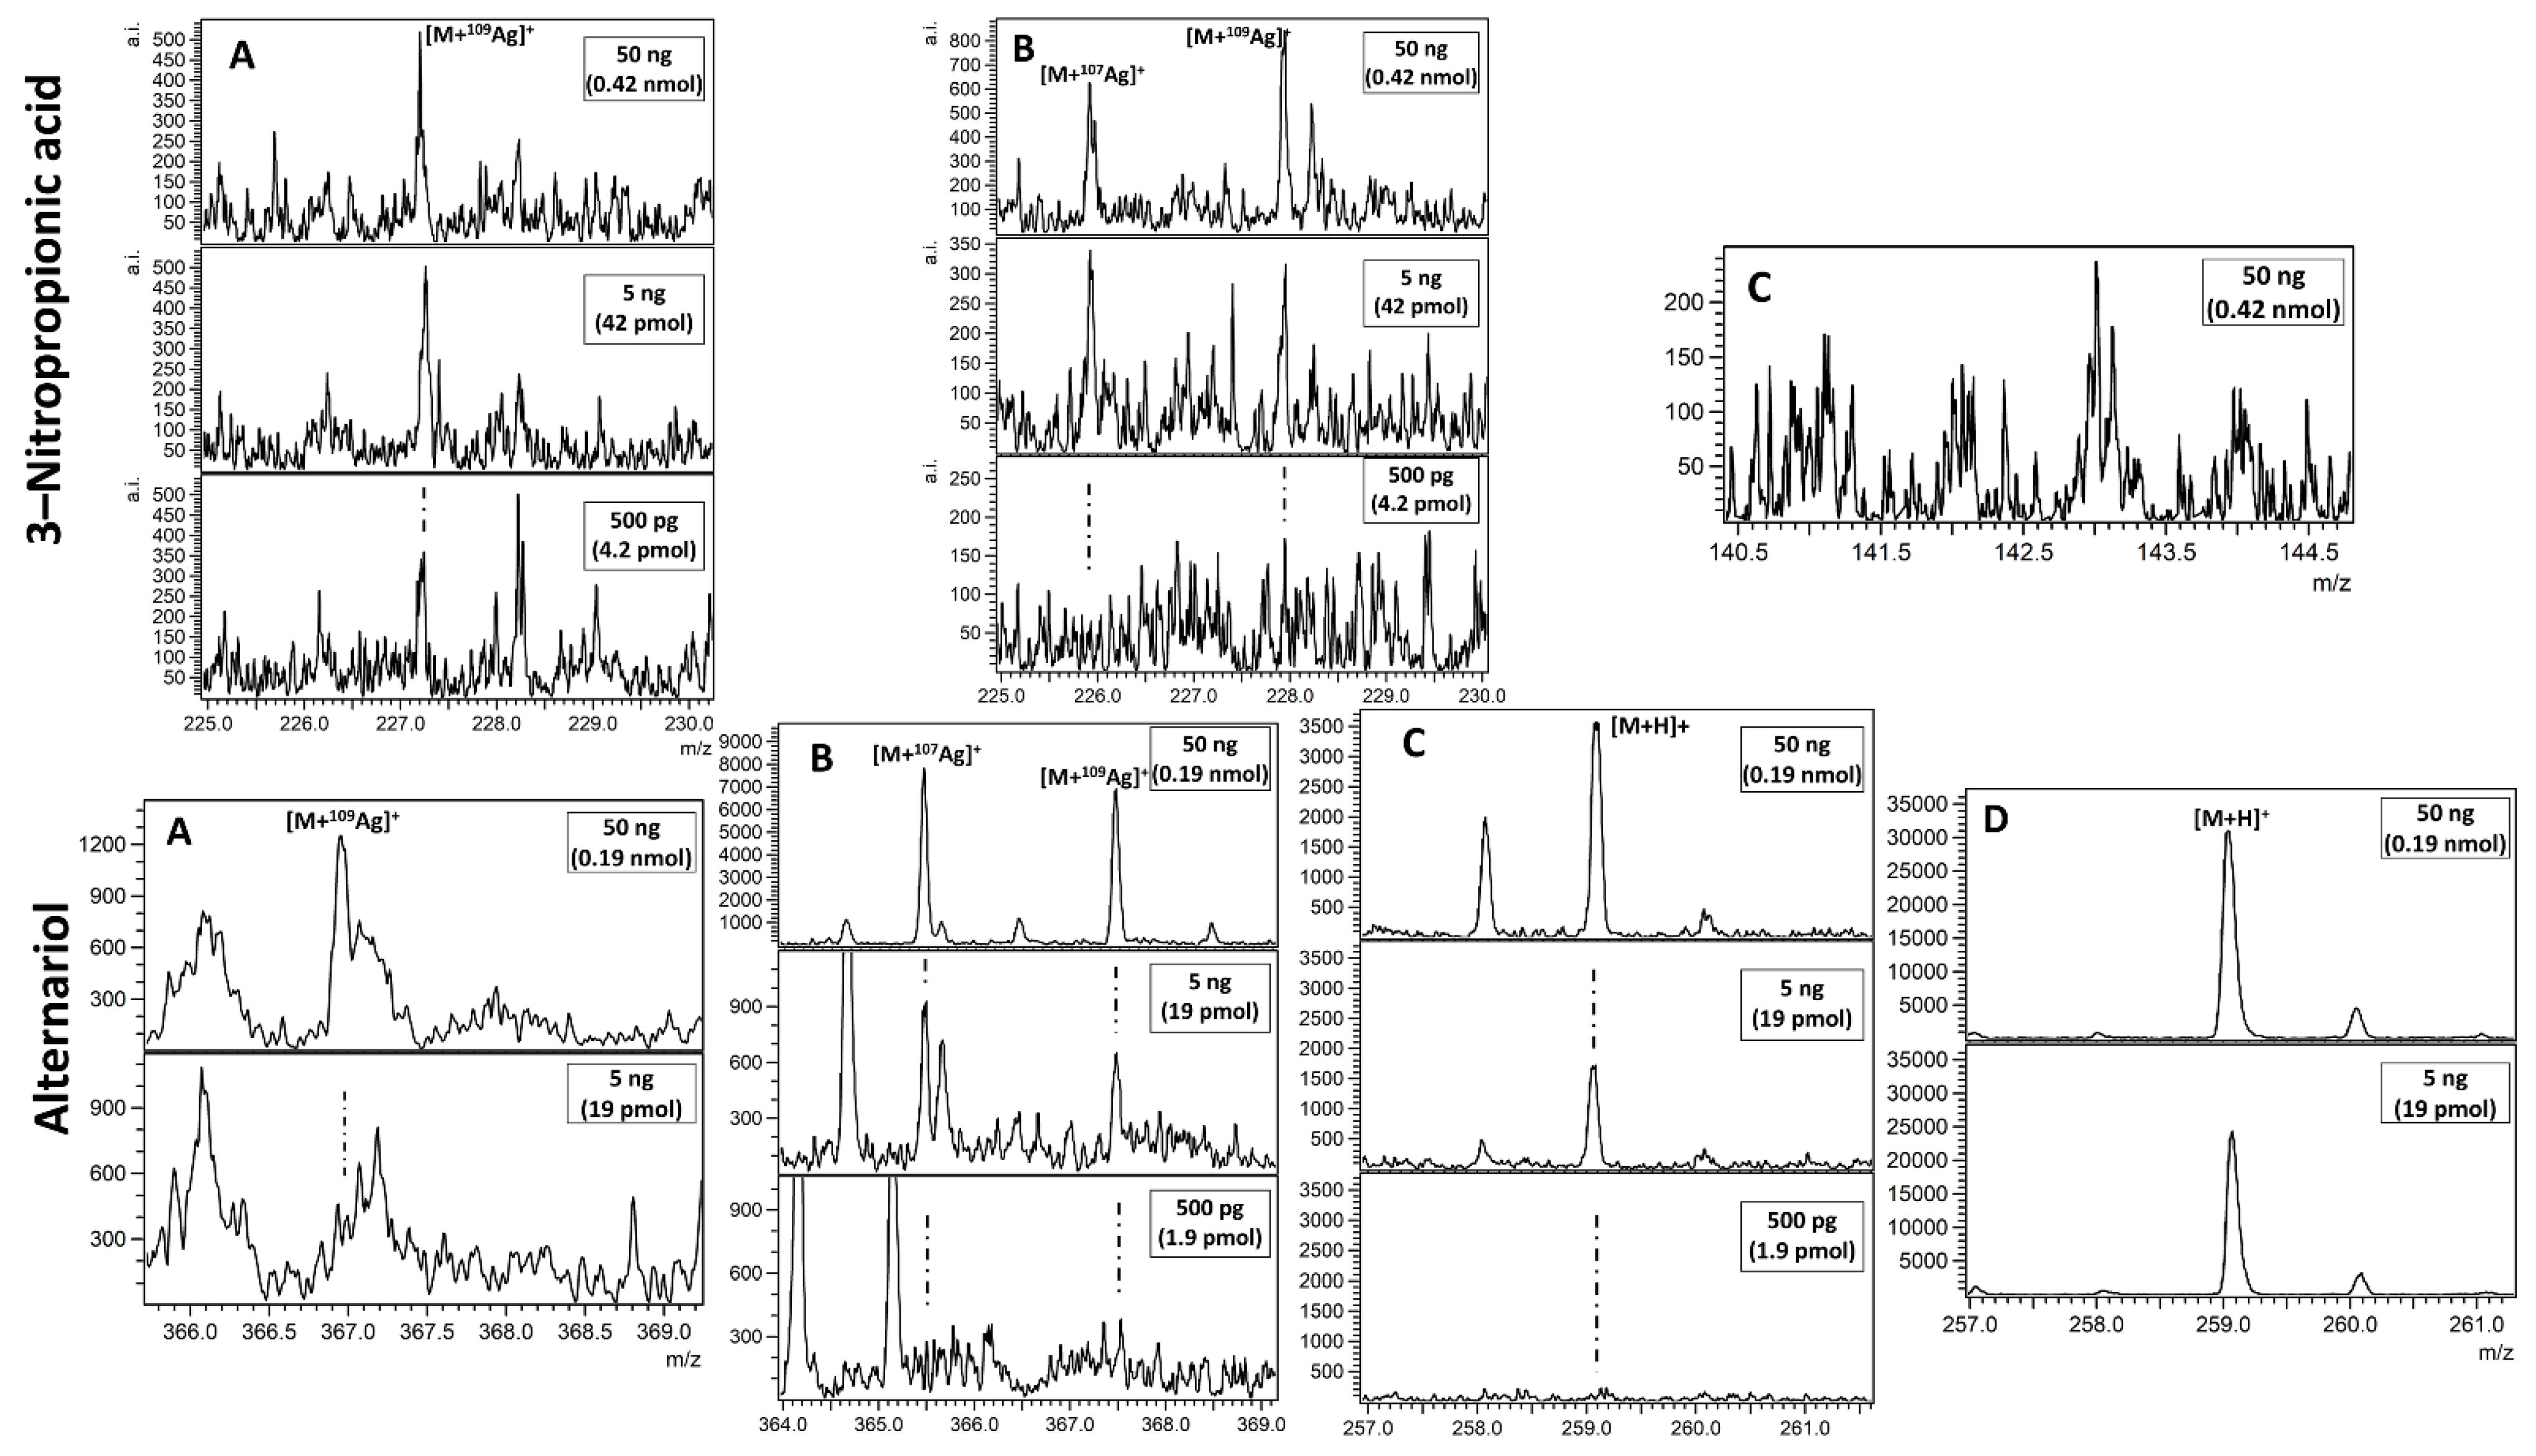
| Alternariol | 8092 31.3 | 13,487 | 5367 13.8 | 8945 | 3834 14.8 | 6390 | 1939 4.98 | 3232 |
| 3-Nitropropionic Acid | 4088 34.3 | 6814 | 62,500 160.5 | 104,167 | nd | nd | nd | nd |
Publisher’s Note: MDPI stays neutral with regard to jurisdictional claims in published maps and institutional affiliations. |
© 2021 by the authors. Licensee MDPI, Basel, Switzerland. This article is an open access article distributed under the terms and conditions of the Creative Commons Attribution (CC BY) license (http://creativecommons.org/licenses/by/4.0/).
Share and Cite
Szulc, J.; Kołodziej, A.; Ruman, T. Silver-109/Silver/Gold Nanoparticle-Enhanced Target Surface-Assisted Laser Desorption/Ionisation Mass Spectrometry—The New Methods for an Assessment of Mycotoxin Concentration on Building Materials. Toxins 2021, 13, 45. https://0-doi-org.brum.beds.ac.uk/10.3390/toxins13010045
Szulc J, Kołodziej A, Ruman T. Silver-109/Silver/Gold Nanoparticle-Enhanced Target Surface-Assisted Laser Desorption/Ionisation Mass Spectrometry—The New Methods for an Assessment of Mycotoxin Concentration on Building Materials. Toxins. 2021; 13(1):45. https://0-doi-org.brum.beds.ac.uk/10.3390/toxins13010045
Chicago/Turabian StyleSzulc, Justyna, Artur Kołodziej, and Tomasz Ruman. 2021. "Silver-109/Silver/Gold Nanoparticle-Enhanced Target Surface-Assisted Laser Desorption/Ionisation Mass Spectrometry—The New Methods for an Assessment of Mycotoxin Concentration on Building Materials" Toxins 13, no. 1: 45. https://0-doi-org.brum.beds.ac.uk/10.3390/toxins13010045