Article

Monitoring Lipophilic Toxins in Seawater Using Dispersive Liquid—Liquid Microextraction and Liquid Chromatography with Triple Quadrupole Mass Spectrometry

by
Ainhoa Oller-Ruiz
1,2,
Natalia Campillo
1,
Manuel Hernández-Córdoba
1,
Javier Gilabert
2 and
Pilar Viñas
1,*
1
Department of Analytical Chemistry, Faculty of Chemistry, Regional Campus of International Excellence “Campus Mare Nostrum”, University of Murcia, E-30100 Murcia, Spain
2
Department of Chemical and Environmental Engineering, Regional Campus of International Excellence “Campus Mare Nostrum”, Polytechnic University of Cartagena, E-30203 Cartagena, Spain
*
Author to whom correspondence should be addressed.
Submission received: 25 November 2020 / Revised: 7 January 2021 / Accepted: 9 January 2021 / Published: 13 January 2021

Abstract

:
The use of dispersive liquid–liquid microextraction (DLLME) is proposed for the preconcentration of thirteen lipophilic marine toxins in seawater samples. For this purpose, 0.5 mL of methanol and 440 µL of chloroform were injected into 12 mL of sample. The enriched organic phase, once evaporated and reconstituted in methanol, was analyzed by reversed-phase liquid chromatography with triple-quadrupole tandem mass spectrometry. A central composite design multivariate method was used to optimize the interrelated parameters affecting DLLME efficiency. The absence of any matrix effect in the samples allowed them to be quantified against aqueous standards. The optimized procedure was validated by recovery studies, which provided values in the 82–123% range. The detection limits varied between 0.2 and 5.7 ng L−1, depending on the analyte, and the intraday precision values were in the 0.1–7.5% range in terms of relative standard deviation. Ten water samples taken from different points of the Mar Menor lagoon were analyzed and were found to be free of the studied toxins.
Key Contribution: Sensitive and selective analysis is provided by DLLME preconcentration and LC with QqQ-MS/MS combination for the determination of thirteen lipophilic marine toxins in seawaters.

Graphical Abstract

1. Introduction

The importance of the role of photosynthetic microorganisms in the functioning of aquatic ecosystems is indisputable; however, their ability to produce toxins means that these ecosystems must be monitored, with the ultimate aim of preserving animal and human health [1]. Aquatic toxins can appear in both fresh and saltwater systems. Marine toxins are secondary metabolites generated by various phytoplankton species subjected to adverse climatic and environmental conditions and are also called phycotoxins. Since phytoplankton serves as food for many aquatic organisms, biomagnification phenomena may occur if toxins enter the food chain, causing serious health problems in humans [2]. Filter feeder organisms, which may filter large volumes of water during their lives, are the species in which the greatest bioaccumulation of marine toxins has been detected.
When the episodes of phytoplankton blooms occur in areas where shellfish are cultured or areas for fisheries, or even in bathing waters, they can lead to environmental, health, and economic problems. In recent years, there have been several cases of phytoplankton proliferation along the coasts of Europe [3], particularly in intensive shellfish culture areas, including Spain (e.g., Andalusia [4], Galicia [5], the Valencia Community [6], and Murcia [7]). The increase in water temperature, changes in salinity, and water dissolved nutrients stoichiometry in coastal waters, mainly due to agricultural run-off or urban wastewater discharges, are some of the factors suggested for an increase in the proliferation of potentially toxic phytoplankton, thus increasing the concentration of toxins in aquatic environments [8]. Changes in these variables have been crucial for setting up the problems detected in recent years in the waters of the Mar Menor lagoon, especially in the summer of 2016, as a result of a severe eutrophication process. Since then, monitoring programs, including toxins, were activated. The lagoon is located in the Southwestern Mediterranean Sea and is the largest hypersaline in Europe with 135 Km2 and 4 m average depth on the Southeast coast of Spain.
Depending on their polarity, marine toxins can be classified as hydrophilic, lipophilic, or amphiphilic [9]. The main compounds included in the lipophilic group are okadaic acid (OA) and dinophysitoxins (DTXs), pectenotoxins, yessotoxins, azaspiracids (AZAs), and cyclic imines, the last mentioned including spirolides (SPXs), pinnatoxins, pteriatoxins, and gymnodimins. According to the symptoms observed in animal studies or human poisoning, aquatic toxins can be classified into those that cause paralytic, amnesic, diarrhetic, neurotoxic shellfish poisoning, and ciguatera fish poisoning. Although additional syndromes are increasingly appearing, each type of poisoning is associated with a specific group of biotoxins [10].
The reference analytical methods for the European Union are laid down in the 2019 Regulation (No. 2019/627) [11] with liquid chromatography and tandem mass spectrometry (LC-MS/MS) for controlling lipophilic toxins. Thus, the literature describes different methodologies for the separation, identification, and quantitation of marine toxins, with LC being the most widely used, especially in combination with a fluorescence detector (FLD) [12,13] and diode array detector (DAD) [14] for the analysis of shellfish and fish, or a mass spectrometer (MS) [2,14,15,16,17,18,19,20,21,22,23,24,25,26,27,28,29,30,31,32,33,34,35,36,37,38] to check compliance with the maximum permitted levels in shellfish and fish, or sediments [2,14,15,16,17,18,19,20,21,22,23,24,25,26,27,28,29,30,31,32,33,34,35,36,37,38] and waters [22,23,24,26,27,28,29,31]. In fact, the high sensitivity and selectivity of LC with MS/MS makes this technique the best choice for the simultaneous evaluation of different lipophilic biotoxins [39].
While high levels of these toxins may be found in bivalves due to their continuous filtration of water, trace levels can be expected in seawater. Therefore, a preconcentration step is required before any instrumental analytical measurement. The conventional solid phase extraction (SPE) technique has been widely applied for the analysis of water [22,26,27,28] and seafood after a solid–liquid extraction step [14,15,19]. SPE provides the simultaneous cleanup of the sample and has demonstrated high levels of robustness and reliability; however, SPE entails long analysis times and a high consumption of both organic solvents and samples. Despite the proven advantages of miniaturized methods, very few applications can be found in the literature for the lipophilic toxins studied here. Dispersive micro solid phase extraction (DMSPE) [23] and magnetic solid phase microextraction (MSPE) [30] have been applied for analyzing seawater and shellfish, respectively. A miniaturized procedure based on ionic liquid dispersive liquid–liquid microextraction (IL-DLLME) [31] has been used to preconcentrate three cyanotoxins (microcystin RR, microcystin LR, and nodularin) and two phycotoxins (domoic acid and OA) from algae-based food supplements, OA being the only common analyte with the presented method here. Moreover, a DLLME procedure based on conventional solvents is presented. As regards the detection system, MS/MS based on triple quadrupole (QqQ) is used here, while the hybridation of simple quadrupole and time of flight was coupled to the LC for the determination of cyano- and phycotoxins [31].
The present work describes a novel method based on DLLME for the determination of thirteen lipophilic toxins, which chemical structures are shown in Figure 1, gymnodimine (GYM), 13,19-didesmethyl spirolide C (13,19-didesM), 13-desmethyl spirolide C (13-desM), 20-spirolide G (SPX20G), OA, dinophysitoxin 1 (DTX1), dinophysitoxin 2 (DTX2), pectenotoxin 2 (PTX2), azaspiracid 1 (AZA1), AZA2, AZA3, AZA4, and AZA5 in seawater. The preconcentrated extracts are analyzed by LC-MS/MS with QqQ mass analyzer.

2. Results and Discussion

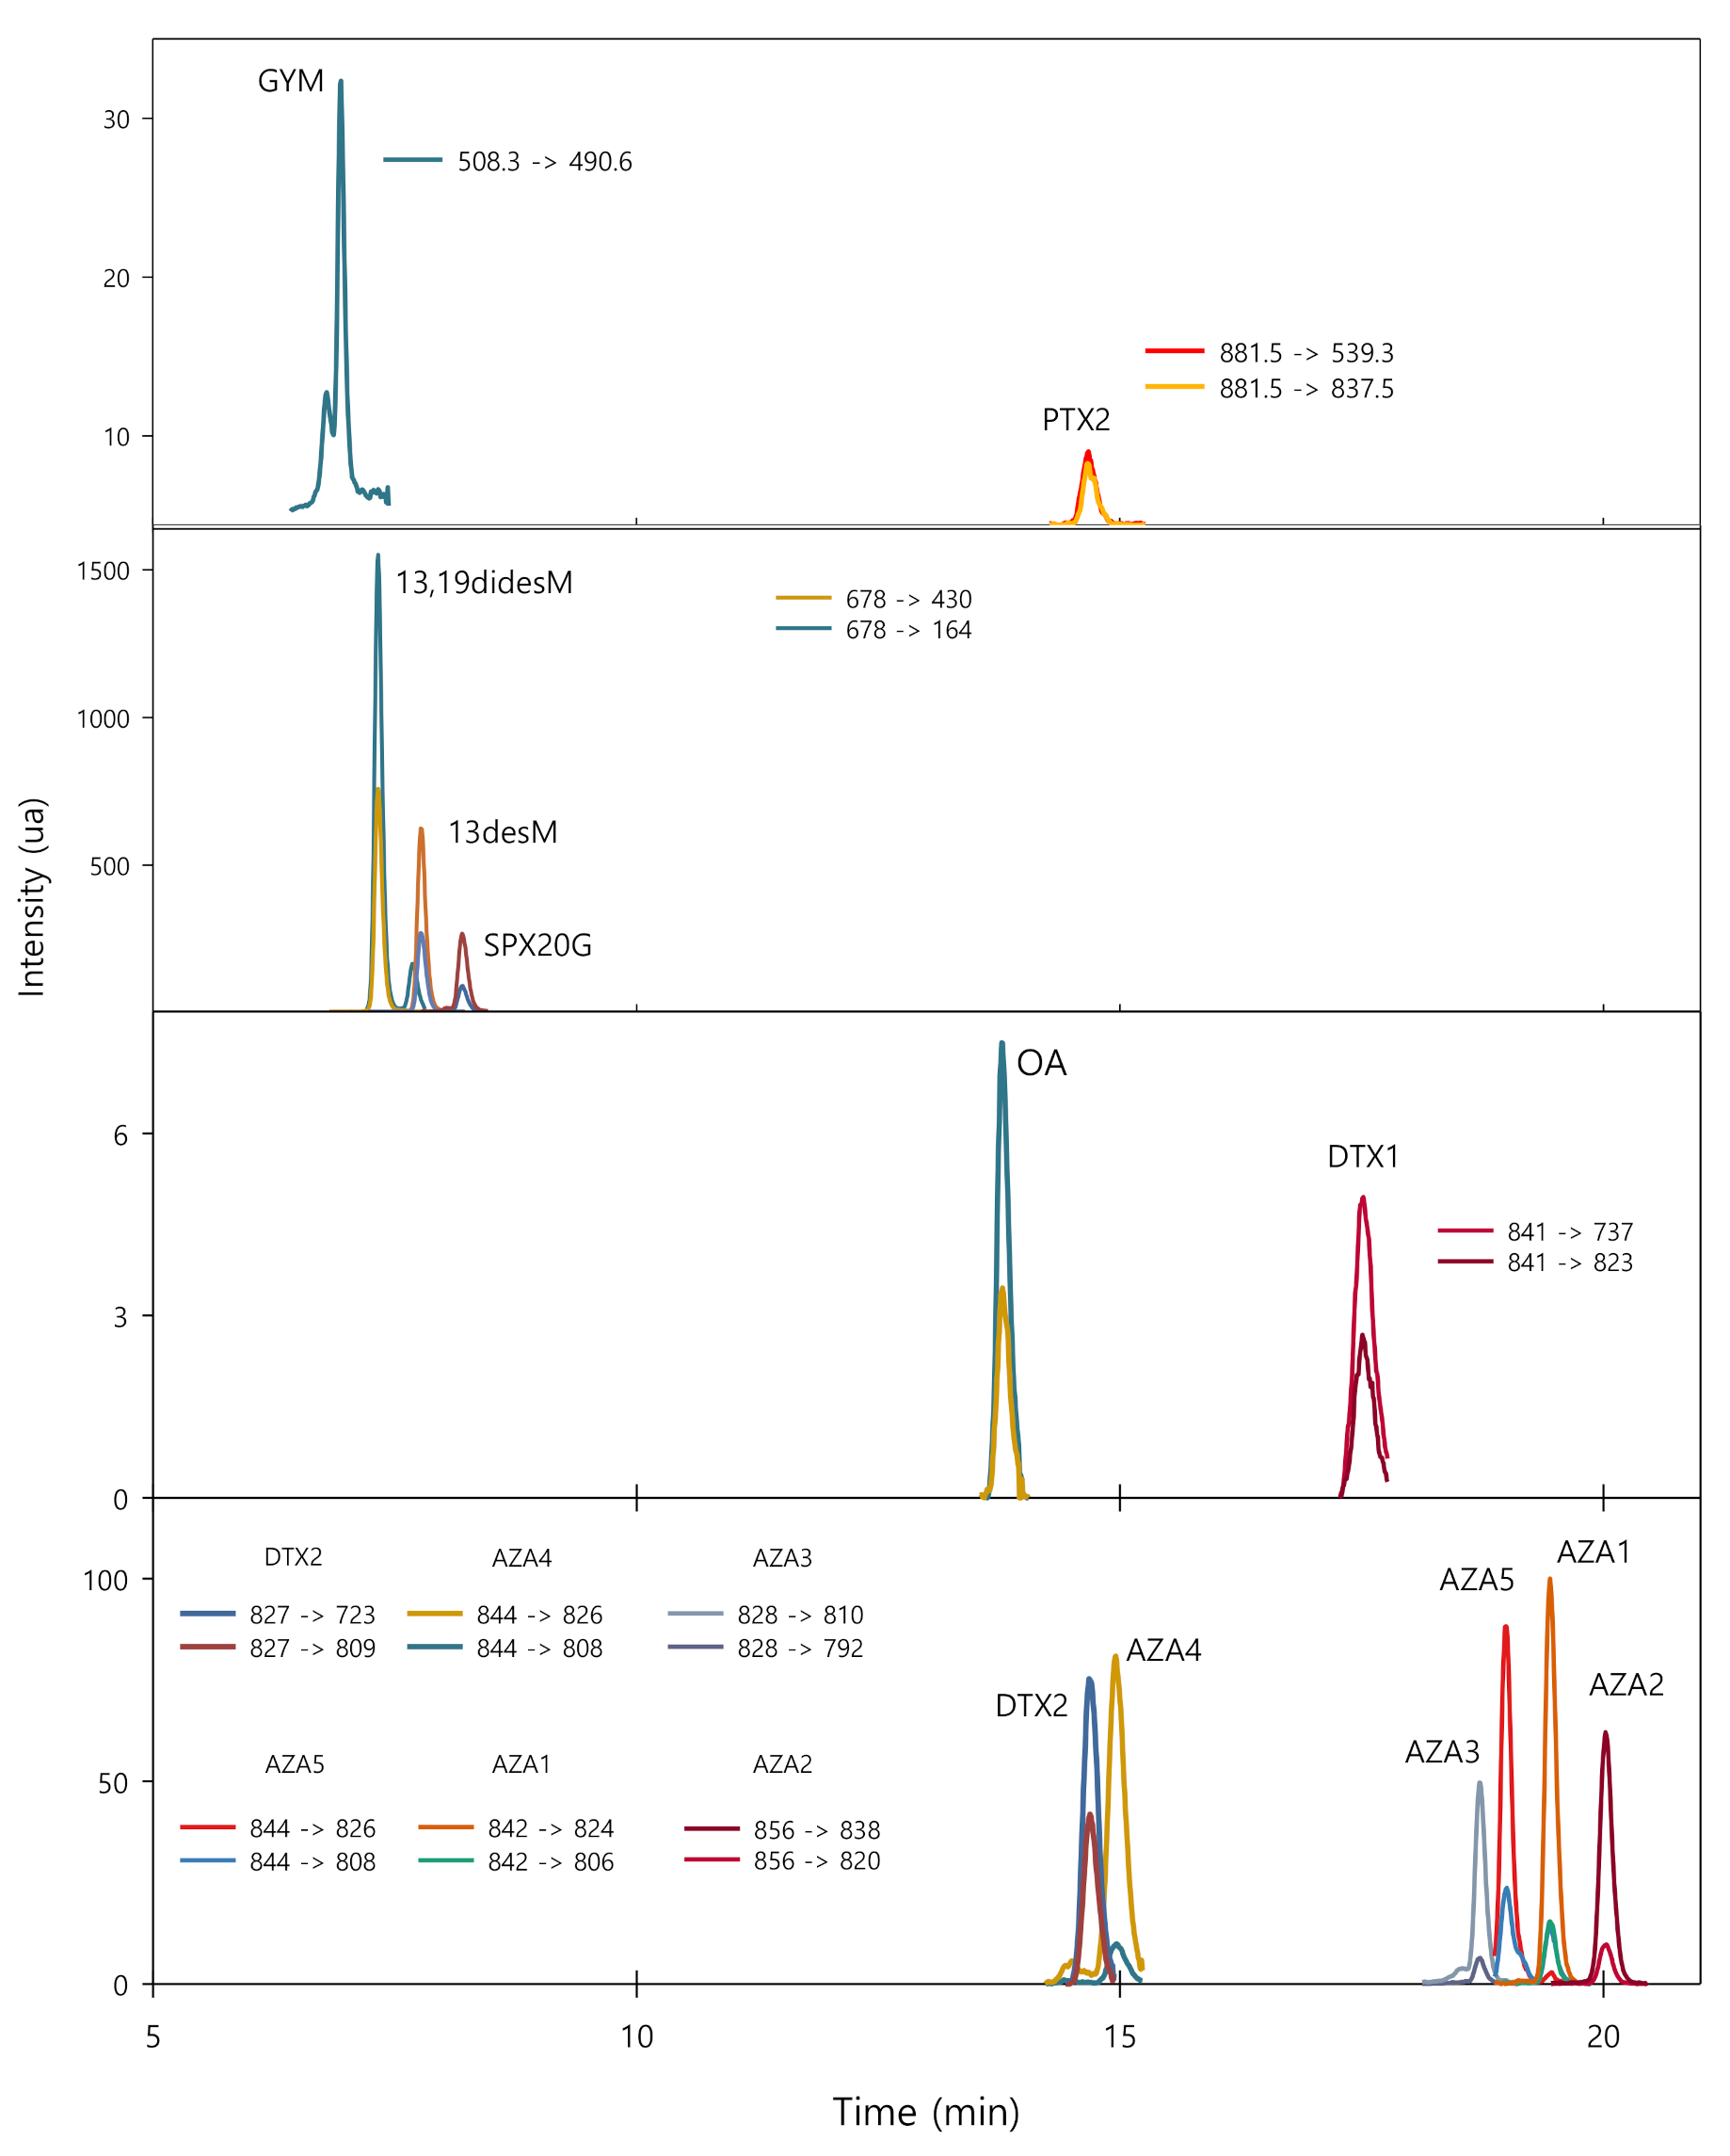
2.1. Chromatographic Separation and MS Conditions

Because of the lipophilic nature of the toxins studied, LC was applied in the reversed phase (RP) mode using a C18 stationary phase. The isocratic elution mode was not suitable for separating the thirteen compounds in a reasonable time, so different gradients were tested using different mixtures of 2 mM ammonium acetate and 0.1% formic acid (FA) solutions prepared in water (solvent A) and methanol (MeOH) (solvent B) [29,37]. Under the conditions finally selected, the elution was initiated with 25% of solvent B at a flow rate of 0.3 mL min−1, increased to 60% in 3 min, and maintained for 5 min, which allowed the elution of GYM and the two desmethyl-SPXs. Then, the percentage of the organic solution was increased to 75% in 0.5 min and maintained for 6.5 min to elute SPX20G, OA, DTX2, PTX2, and AZA4. In the next stage of the gradient, the flow rate was increased to 0.4 mL min−1 in 0.5 min in proportion, followed by another increase of solvent B to 85% in 4.5 min, which allowed the elution of DTX1 and the four AZAs still retained. Finally, as a cleaning stage, 95% of solvent B was programmed, and the initial conditions were restored using a flow of 0.5 mL min−1, as shown in Table 1. For high proportions of MeOH in the mobile phase, the pressure in the column decreased so that the mobile phase flow rate could be increased, and the analysis time shortened. The optimization of the mobile phase composition was also assayed in the absence of salt or acid, and no significant differences in the resolution of the peaks were observed, while the absence of acid and/or salt in the mobile phase led to a decrease in the ionization efficiency of the compounds.
The parameters of the MS detector were optimized in several steps, working first in full-scan mode from 80 to 1000 amu (m/z) to identify the precursor ion of each compound. All the toxins showed greater sensitivity in positive ionization mode at the Electrospray Ionization (ESI) source. Then, different fragmentation voltages and collision energies were applied, thus generating different product ions. The two most sensitive Multiple Reaction Monitoring (MRM) transitions were selected for each analyte, except GYM, for which only one transition was located (Table 2). The identification of each toxin was based on its retention time and the different MRM transitions involving the formation of product ions with the highest m/z values.
The influence of other variables in the ESI source were studied: temperature (200–350 °C), gas flow (4–12 L min−1), nebulizer pressure (20–50 psi), and capillary voltage (2000–5000 V). The conditions finally adopted were 350 °C, 8 L min−1 nitrogen flow rate, 40 psi, and 4500 V. Even though the pairs of analytes OA/DTX2 and AZA4/AZA5 showed the same precursor ions and even the same MRM transitions, this did not pose a problem for their quantitation since they eluted at different retention times.

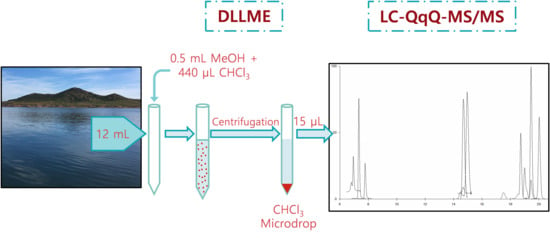
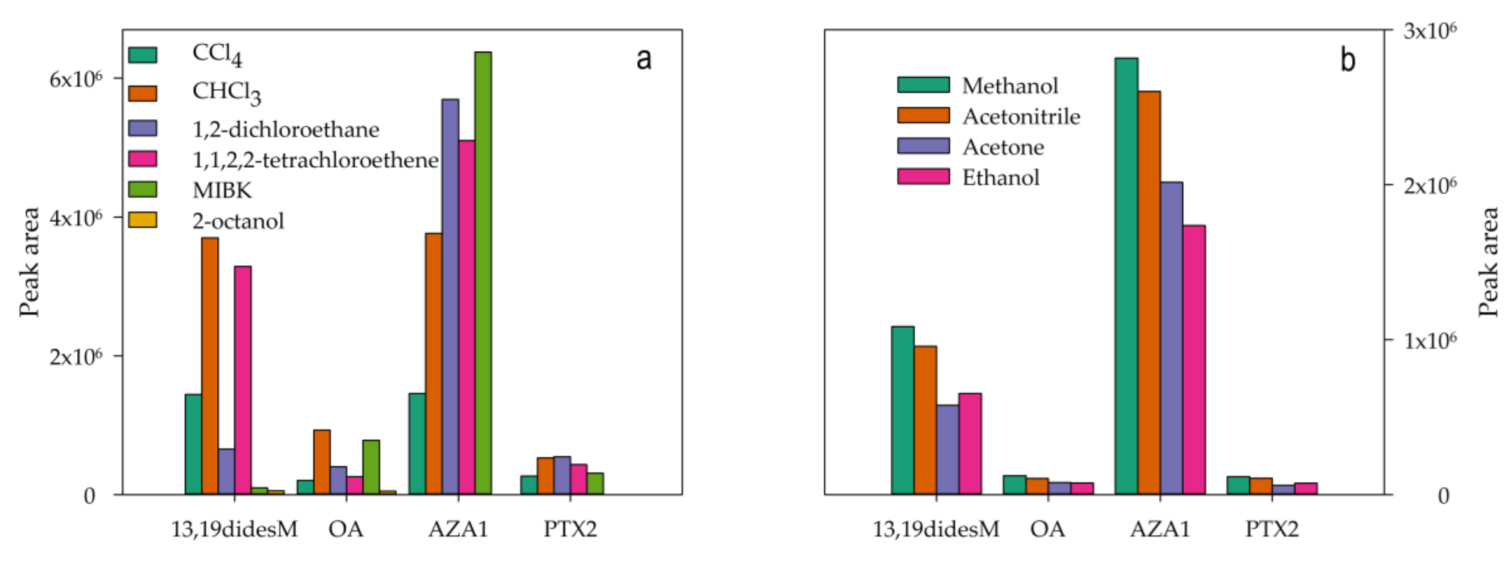
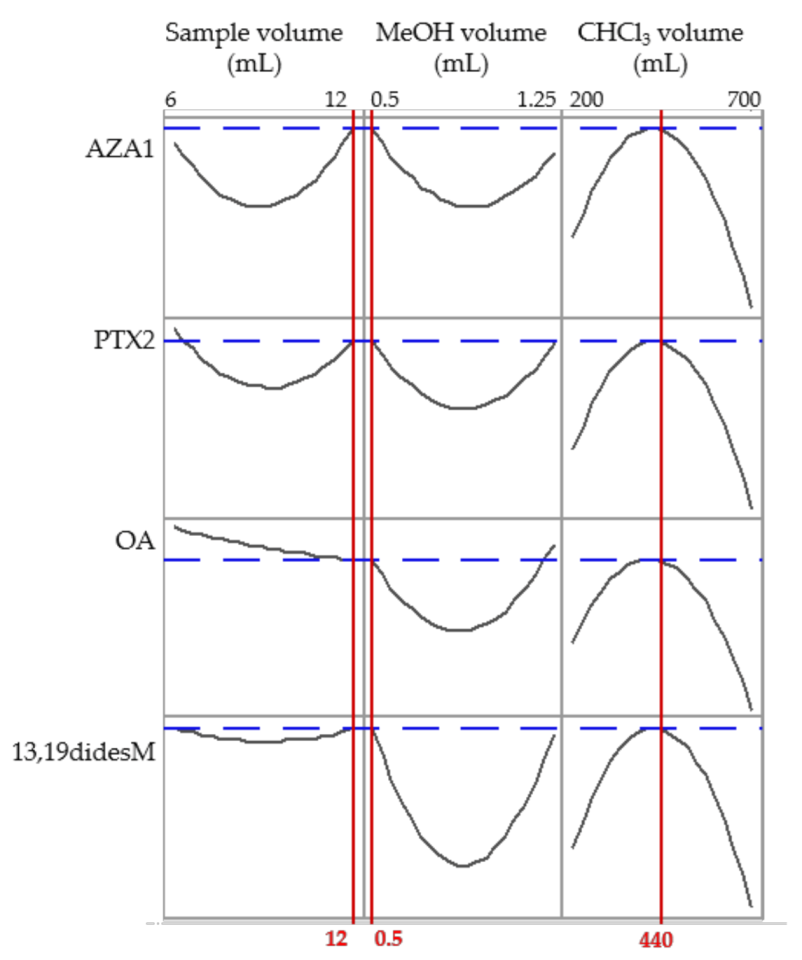
2.2. Optimization of the DLLME Procedure

The first experiments were directed towards selecting the extractant phase, for which eleven different solvents were tested, some heavier (CCl4, CHCl3, CH2Cl2, 1,2-dichloroethane, and 1,1,2,2-tetrachloroethene) and some lighter (methyl isobutyl ketone (MIBK), 2-octanol, 1-undecanol, 1-dodecanol, 2-octanone, and 2-undecanone) than water. An aqueous solution containing 1 ng mL−1 of one analyte from each of the four families studied (13,19didesM, OA, AZA1, and PTX2) was used to simplify the study. By means of a micro syringe, a mixture containing 1.5 mL MeOH and 440 µL extractant was injected into 8 mL of the standard solution, and the mixture was manually shaken for a few seconds before centrifuging for 3 min at 855× g. The enriched extracts obtained from solvents of lower density than water were directly injected (15 μL) into the LC system, while, in the case of solvents of higher density than water, the extract was evaporated and reconstituted in 150 µL MeOH before injection.
Except for MIBK, the lighter-than-water solvents did not preconcentrate the toxins (Figure 2a). Chloroform provided the highest efficiency for 13,19didesM and OA, while no significant differences were found between CHCl3 and 1,2-dichloroethane for PTX2. Considering that AZA1 was more efficiently extracted in MIBK, but recovery with CHCl3 was better, the latter solvent was chosen. Thus, peak areas in the absence of preconcentration were increased by factors of between 300 and 910, which corresponded to PTX2 and 13,19-didesM, respectively, when chloroform was used as the extractant solvent.
Acetone, ethanol, acetonitrile (AcN) and MeOH were tested as dispersant solvents, and although no great differences in sensitivity were found for OA and PTX2, MeOH provided better results for 13,19didesM and AZA1 (Figure 2b) and was, therefore, selected.
The volumes of the three components of the DLLME ternary mixture were studied simultaneously using a central composite design (CCD; α = 0.5; 8 cubic points; 6 axial points and 6 central points). The aqueous phase volume was studied in the 6–12 mL range, the dispersant from 0.5 to 2 mL, and the extractant from 200 to 700 µL, making a total of 20 runs, whose combinations are shown in Table 3. The results obtained were fitted to a response surface by quadratic polynomial regression. Figure 3 shows peak area values for each toxin selected from each group, normalized with respect to their average area in the corresponding set of experiments. The experimental matrices (Table 3) were generated, and the obtained results were evaluated using the Minitab 19.0 statistical package. Sensitivity for all compounds increased as the volume of CHCl3 increased up to 440 μL, and then decreased for higher values, probably due to a dilution effect (Figure 3). On the other hand, generally, the highest and the lowest volumes assayed for sample and dispersant phases, respectively, provided the best results. Thus, the conditions finally selected corresponded to 12 mL of water sample, 0.5 mL of MeOH, and 440 μL of CHCl3.
When the pH of the sample was varied between 4 and 9 by adding FA or ammonia, an acid pH was found to favor the extraction of toxins of acidic nature (PTX2, DTXs, and OA), whereas the basic ones, such as AZAs, SPXs, and GYM, showed higher extraction efficiencies in alkaline media, as expected. Consequently, a compromise was adopted, and the approximately neutral pH of the samples was not modified.

2.3. Validation of the Procedure and Matrix Effect

The procedure developed was validated in terms of precision, limits of detection (LODs) and quantitation (LOQs), linearity range, and accuracy. Calibration graphs were obtained by least-squares linear regression analysis, representing the chromatographic peak area vs. the concentration of each compound at seven concentration levels in triplicate. In all cases, the regression coefficients (R2) were greater than 0.998 for the ranges shown in Table 4.
To assess the possible existence of a matrix effect, the slopes of the aqueous standard calibration graphs were compared with those obtained by applying the standard additions method to five seawater samples obtained close to and far from the coast. No significant differences at the 95% confidence level were detected when applying the ANOVA test (as described in the Section 4) for each toxin separately because the “p” values obtained were higher than 0.05 for all the compounds. Consequently, the absence of a matrix effect was confirmed, and quantitation of the samples was carried out using aqueous standard solutions.
LOD and LOQ values were calculated, considering the analyte concentrations that provided analytical signals 3 and 10 times higher than the noise, respectively. The LODs were between 0.2 and 5.7 ng·L−1, and the LOQs in the 0.7–19 ng·L−1 range (Table 4). The precision of the method was studied in ten consecutive analyses of seawater samples fortified at 50 ng·L−1. The relative standard deviation (RSD) values were found to be between 0.1 and 7.5%, which corresponded to GYM and DTX1, respectively (Table 4). These RSD values demonstrated the very good repeatability of the developed procedure.
The accuracy of the procedure was checked in recovery studies. Two samples, taken at 1 m from the surface in the surf area in a beach and one sample collected 25 m off the coast, were fortified at two concentration levels, 10 and 50 ng·L−1, for all compounds except DTX1, for which concentrations of 50 and 100 ng·L−1 were used. The recoveries obtained are shown in Table 5, which were in the 82–123% and 90–121% ranges for the lowest and the highest fortification levels, respectively.
Table 6 shows a comparison between the DLLME-LC-QqQ-MS/MS procedure and others previously published for the determination of lipophilic toxins in seawater using LC-MS. Note that although lower LODs were achieved with some of those procedures that used SPE [22,26,27,28], these conventional sample treatments involved longer times (up to 9 h) and a much greater consumption of sample (between 200 and 500 mL). In contrast, the proposed DLLME procedure requires considerably lower volumes of organic solvent and sample, as well as a shorter application time (around 5 min). The DMSPE procedure developed by Zhang et al. [23] takes a similar time to that presented here with lower LODs, which may be attributed to the highly sensitive Q Exactive MS detector used, as in another SPE-based approach [28]. Nevertheless, the disadvantages inherent in using extractant solid dispersed phases compared with dispersed liquid phases should be considered. Moreover, the number of toxins that can be determined using the procedure studied here is higher than that mentioned in the above studies.

2.4. Analysis of Seawater Samples

The DLLME-LC-QqQ-MS/MS procedure was used to analyze ten seawater samples collected from the Mar Menor lagoon. None of the samples contained the studied toxins, at least above their corresponding LODs.
Figure 4 shows the extracted ion chromatograms (EICs) obtained for a seawater sample fortified with the analytes studied at 10 ng·L−1, except in the case of DTX1, which was fortified at 50 ng·L−1. For each toxin, the selected transitions are specified. No interfering peaks were observed at the different retention times for the toxins, demonstrating the good selectivity of the proposed procedure. The analytes were identified from their retention times, the transitions provided by their mass spectra and comparing the percentage of each transition obtained for standard solutions, and unfortified and fortified samples.

3. Conclusions

The combination of DLLME with LC-QqQ-MS/MS allowed for the sensitive and selective analysis of seawater samples. For the first time, a high number of lipophilic marine toxins, belonging to four chemical families, has been efficiently preconcentrated under the green analytical chemistry guidelines, achieving high analysis speed, great efficiency, low operational costs since the consumption of organic toxic solvents and sample volume are very low, and an environmentally friendly analytical procedure. The absence of any matrix effect allowed quantitation of the samples against aqueous standards. None of the studied toxins was detected in the waters collected from the Mar Menor lagoon in samples collected in 2019.

4. Materials and Methods

4.1. Reagents

The standards 13,19didesM (7.06 ± 0.24 µg·mL−1), 13desM (7.23 ± 0.10 µg·mL−1), SPX20G (7.01 ± 0.61 µg·mL−1), OA (16 ± 0.8 µg µg·mL−1), DTX1 (6.40 ± 0.33 µg·mL−1), DTX2 (2.01 ± 0.11 µg·mL−1), AZA1 (1.08 ± 0.06 µg·mL−1), AZA2 (1.05 ± 0.08 µg·mL−1), AZA3 (1.03 ± 0.07 µg·mL−1), AZA4 (1.01 ± 0.03 µg mL−1), and AZA5 (1.09 ± 0.03 µg·mL−1) were acquired from Cifga, S.A. (Lugo, Spain) in individual ampoules containing 0.5 mL of a methanolic solution at the specified concentrations. GYM (2.50 ± 0.13 µg mL−1) and PTX2 (4.40 ± 0.13 µg mL−1) were supplied by the Institute for Marine Biosciences of the National Research Council Canada (NRC CNRC, Halifax, Canada). The individual standard solutions were stored at −18 °C, and the working standard solutions were prepared daily in methanol (MeOH) and stored at 4 °C.
The MeOH used for the mobile phase was LC-MS grade. The rest of the employed solvents were ACS-grade. Acetonitrile (AcN), acetone, and ethanol were obtained from Chem-Lab NV (Zedelgem, Belgium) and chloroform, carbon tetrachloride, dichloromethane, 1,2-dichloroethane, 1,1,2,2-tetrachloroethene, methyl isobutyl ketone (MIBK), 1-octanol, 1-undecanol, 1-dodecanol, 2-octanone, and 2-undecanone from Sigma–Aldrich (Steinheim, Germany). Formic acid (FA, 98%) and ammonium acetate were purchased from Panreac (Barcelona, Spain). The purified water was obtained through a Milli-Q system (Millipore, Bedford, MA, USA).

4.2. Instrumentation

The chromatographic system consisted of a 1200 UHPLC apparatus from Agilent (Waldbronn, Germany) provided with a quaternary pump (G1312A) and a Zorbax SB-C18 reversed phase column (Agilent, 75 × 2.1 mm, 3.5 µm) thermostated at 30 °C. The samples were injected into the LC system (15 μL) by means of an automatic sampler using 2 mL amber vials provided with 250 µL micro-inserts with polymeric feet. The mobile phase was composed of an aqueous solution of 2 mM ammonium acetate and 0.1% FA (solvent A) and a methanolic solution of 2 mM ammonium acetate and 0.1% FA (solvent B) working in elution gradient mode. Table 1 shows the gradient program applied.
The analytes were detected by using a triple quadrupole mass spectrometer (Agilent, G6410A), equipped with an electronic impact ionization (ESI) source operating in positive mode, applying the following parameter values: pressure of nebulizer gas (nitrogen), 40 psi; capillary voltage, 4500 V; temperature and flow of the drying gas, 350 °C, and 8 L min−1, respectively. The mass spectra were analyzed in the range m/z 80–1000 amu. Data acquisition and method development were performed using the software “Agilent Mass Hunter Data Acquisition” (Qualitative Analysis and Quantitative Analysis, Agilent (Waldbronn, Germany)). The multiple reaction monitoring mode (MRM) was used. Minitab 19 software program was used for statistical evaluation of the results. For statistical evaluation of a possible matrix effect in the samples, a one way ANOVA test was used to compare two means from two independent groups, the slopes obtained by standard calibration and the slopes from standard additions to the samples, using the F-distribution. The null hypothesis for the test is that the two means are equal. Therefore, a significant result means that the two means are unequal.
Individual solutions (1 µg mL−1) of the toxins were injected into the MS system by means of the LC system, omitting the chromatographic column, and using as carrier flow a 50:50 mixture of solvents A and B, to select the optimal MRM transitions for each compound. The adopted collision energies (CE) and fragmentation voltages are shown in Table 2.
Other equipment used included an EBA 20 centrifuge (Hettich, Tuttlingen, Germany) and an XcelVapTM evaporator (Horizon Technology Inc., Salem, NH, USA).

4.3. Samples

Ten seawater samples, collected from ten different points of the Mar Menor lagoon (Murcia, south-eastern Spain) in August 2019, were analyzed. The samples were differentiated into two types, those collected close to beaches (on foot) and those collected by boat from areas far from the coast. A 5 m column was used for sampling far from the coast, which allowed an integrated water sample from different depths to be analyzed. The beach samples were taken at a depth of 40 cm. All the samples were stored in square polyethylene containers of one-liter capacity at 4 °C until analysis, which was normally carried out within 48 h of arrival in the laboratory.

4.4. Analytical Procedure

Before analysis, the water samples were vacuum filtered through 0.45 µm nylon membrane filters (Agilent), and 12 mL of filtered samples were placed in a conical bottomed 15 mL Falcon tube. A mixture of 0.5 mL MeOH and 440 µL chloroform was injected rapidly into the sample, resulting in turbidity as a consequence of the dispersion of chloroform microdroplets. The ternary mixture was stirred manually for a few seconds and centrifuged at 855× g for 3 min. The sedimented phase was collected by micro syringe, and the solvent was evaporated by applying a pressure of 440 bar at 40 °C. The dry residue was reconstituted in 100 µL MeOH, and 15 µL were injected into the LC system. All samples were analyzed in duplicate.
Recovery studies were performed with two different samples at two levels of fortification: 10 and 50 ng·L−1 for all toxins except DTX (50 and 100 ng L−1). Three aliquots of each sample were analyzed at each concentration level.

Author Contributions

Conceptualization, P.V. and N.C.; methodology, A.O.-R. and J.G.; software, A.O.-R.; validation, A.O.-R., P.V., M.H.-C., N.C., J.G and P.V.; formal analysis, A.O.-R. and J.G.; writing—original draft preparation, A.O.-R. and N.C.; writing—review and editing, A.O.-R., J.G., N.C., M.H.-C. and P.V.; supervision, N.C. and P.V.; project administration, P.V.; funding acquisition, M.H.-C., J.G. and P.V. All authors have read and agreed to the published version of the manuscript.

Funding

This research was funded by the Spanish MICINN (PGC2018-098363-B-I00), the Comunidad Autónoma de la Región de Murcia (CARM, Fundación Séneca, Project 19888/GERM/15) and the European Commission (FEDER/ERDF). This research was also funded from the “Análisis y determinación de umbrales de riesgo por proliferaciones de fitoplancton potencialmente tóxico en aguas costeras del Mar Menor (segunda fase)” project by the Consejería de Agua, Agricultura, Ganadería, Pesca y Medio Ambiente de la CARM and the European Commission (FEDER/ERDF).

Institutional Review Board Statement

Not applicable.

Informed Consent Statement

Not applicable.

Data Availability Statement

Not applicable.

Acknowledgments

A.O.-R. acknowledges a fellowship from the Spanish Ministry of Labour and Social Economy (Plan de Garantía Juvenil). The authors thank Ecosystem research group of the Polytechnic University of Cartagena for providing the samples from the Mar Menor.

Conflicts of Interest

The authors confirm that there are no known conflicts of interest associated with this manuscript and there has been no significant financial support for this work that could have influenced its outcome. All the named authors have read and approved this version of the manuscript and there are no other persons who satisfy the criteria for authorship but are not listed. We further confirm that the order of authors listed in the manuscript has been approved by all of us.

References

  1. Humbert, J.F. Advances in the detection of phycotoxins and cyanotoxins. Anal. Bioanal. Chem. 2010, 397, 1653–1654. [Google Scholar] [PubMed] [Green Version]
  2. Orellana, G.; Van Meulebroek, L.; De Rijcke, M.; Janssen, C.R.; Vanhaecke, L. High resolution mass spectrometry-based screening reveals lipophilic toxins in multiple trophic levels from the North Sea. Harmful Algae 2017, 64, 30–41. [Google Scholar] [CrossRef] [PubMed]
  3. McNamee, S.E.; Medlin, L.K.; Kegel, J.; McCoy, G.R.; Raine, R.; Barra, L.; Ruggiero, M.V.; Kooistra, W.H.C.F.; Montresor, M.; Hagstrom, J.; et al. Distribution, occurrence and biotoxin composition of the main shellfish toxin producing microalgae within European waters: A comparison of methods of analysis. Harmful Algae 2016, 55, 112–120. [Google Scholar] [PubMed]
  4. Fernández, R.; Mamán, L.; Jaén, D.; Fuentes, L.F.; Ocaña, M.A.; Gordillo, M.M. Dinophysis species and diarrhetic shellfish toxins: 20 years of monitoring program in Andalusia, South of spain. Toxins 2019, 11, 189. [Google Scholar]
  5. Palenzuela, J.M.T.; Vilas, L.G.; Bellas, F.M.; Garet, E.; González-Fernández, Á.; Spyrakos, E. Pseudo-nitzschia blooms in a coastal upwelling system: Remote sensing detection, toxicity and environmental variables. Water 2019, 11, 1954–1978. [Google Scholar]
  6. Paches, M.; Aguado, D.; Martínez-Guijarro, R.; Romero, I. Long-term study of seasonal changes in phytoplankton community structure in the western Mediterranean (Valencian Community). Environ. Sci. Pollut. Res. 2019, 26, 14266–14276. [Google Scholar]
  7. Alcolea, A.; Contreras, S.; Hunink, J.E.; García-Aróstegui, J.L.; Jiménez-Martínez, J. Hydrogeological modelling for the watershed management of the Mar Menor coastal lagoon (Spain). Sci. Total Environ. 2019, 663, 901–914. [Google Scholar]
  8. Soria, J.; Caniego, G.; Hernández-Sáez, N.; Dominguez-Gomez, J.A.; Erena, M. Phytoplankton distribution in Mar Menor coastal lagoon (SE Spain) during 2017. J. Mar. Sci. Eng. 2020, 8, 600–618. [Google Scholar]
  9. Alarcan, J.; Biré, R.; Le Hégarat, L.; Fessard, V. Mixtures of lipophilic phycotoxins: exposure data and toxicological assessment. Mar. Drugs 2018, 16, 46. [Google Scholar]
  10. Fessard, V.; Le Hégarat, L. A strategy to study genotoxicity: Application to aquatic toxins, limits and solutions. Anal. Bioanal. Chem. 2010, 397, 1715–1722. [Google Scholar]
  11. European Commission. Regulation 2019/627 of 15 March 2019 laying down uniform practical arrangements for the performance of official controls on products of animal origin intended for human consumption. Off. J. Eur. Union L 2019, 131, 51–100. [Google Scholar]
  12. Puech, L.; Dragacci, S.; Gleizes, E.; Fremy, J.M. Use of immunoaffinity columns for clean-up of diarrhetic toxins (okadaic acid and dinophysistoxins) extracts from shellfish prior to their analysis by HPLC/fluorimetry. Food Addit. Contam. 1999, 16, 239–251. [Google Scholar] [CrossRef] [PubMed]
  13. Quilliam, M.A. Analysis of diarrhetic shellfish poisoning toxins in shellfish tissue by liquid chromatography with fluorometric and mass spectrometric detection. J. AOAC Int. 1995, 78, 555–570. [Google Scholar] [CrossRef] [PubMed]
  14. Regueiro, J.; Rossignoli, A.E.; Álvarez, G.; Blanco, J. Automated on-line solid-phase extraction coupled to liquid chromatography-tandem mass spectrometry for determination of lipophilic marine toxins in shellfish. Food Chem. 2011, 129, 533–540. [Google Scholar] [CrossRef]
  15. Shen, Q.; Gong, L.; Baibado, J.T.; Dong, W.; Wang, Y.; Dai, Z.; Cheung, H.Y. Graphene based pipette tip solid phase extraction of marine toxins in shellfish muscle followed by UPLC-MS/MS analysis. Talanta 2013, 116, 770–775. [Google Scholar] [CrossRef] [PubMed]
  16. These, A.; Scholz, J.; Preiss-Weigert, A. Sensitive method for the determination of lipophilic marine biotoxins in extracts of mussels and processed shellfish by high-performance liquid chromatography-tandem mass spectrometry based on enrichment by solid-phase extraction. J. Chromatogr. A 2009, 1216, 4529–4538. [Google Scholar] [CrossRef]
  17. Wang, L.; Shi, X.; Zhao, Q.; Sun, A.; Li, D.; Zhao, J. Determination of lipophilic marine toxins in fresh and processed shellfish using modified QuEChERS and ultra-high-performance liquid chromatography–tandem mass spectrometry. Food Chem. 2019, 272, 427–433. [Google Scholar] [CrossRef] [PubMed]
  18. Fux, E.; McMillan, D.; Bire, R.; Hess, P. Development of an ultra-performance liquid chromatography-mass spectrometry method for the detection of lipophilic marine toxins. J. Chromatogr. A 2007, 1157, 273–280. [Google Scholar] [CrossRef] [PubMed]
  19. Wu, H.; Yao, J.; Guo, M.; Tan, Z.; Zhou, D.; Zhai, Y. Distribution of marine lipophilic toxins in shellfish products collected from the chinese market. Mar. Drugs 2015, 13, 4281–4295. [Google Scholar] [CrossRef] [Green Version]
  20. Moroney, C.; Lehane, M.; Braña-Magdalena, A.; Furey, A.; James, K.J. Comparison of solid-phase extraction methods for the determination of azaspiracids in shellfish by liquid chromatography-electrospray mass spectrometry. J. Chromatogr. A 2002, 963, 353–361. [Google Scholar] [CrossRef]
  21. Wang, Y.; Chen, J.; Li, Z.; Wang, S.; Shi, Q.; Cao, W.; Zheng, X.; Sun, C.; Wang, X.; Zheng, L. Determination of typical lipophilic marine toxins in marine sediments from three coastal bays of China using liquid chromatography-tandem mass spectrometry after accelerated solvent extraction. Mar. Pollut. Bull. 2015, 101, 954–960. [Google Scholar] [CrossRef] [PubMed]
  22. Chen, J.; Li, X.; Wang, S.; Chen, F.; Cao, W.; Sun, C.; Zheng, L.; Wang, X. Screening of lipophilic marine toxins in marine aquaculture environment using liquid chromatography-mass spectrometry. Chemosphere 2017, 168, 32–40. [Google Scholar] [CrossRef] [PubMed]
  23. Zhang, Y.; Chen, D.; Hong, Z.; Zhou, S.; Zhao, Y. Polymeric ion exchange material based dispersive micro solid-phase extraction of lipophilic marine toxins in seawater followed by the Q Exactive mass spectrometer analysis using a scheduled high resolution parallel reaction monitoring. Microchem. J. 2018, 138, 526–532. [Google Scholar] [CrossRef]
  24. Liu, Y.; Yu, R.C.; Kong, F.-Z.; Li, C.; Dai, L.; Chen, Z.-F.; Zhou, M.J. Lipophilic marine toxins discovered in the Bohai Sea using high performance liquid chromatography coupled with tandem mass spectrometry. Chemosphere 2017, 183, 380–388. [Google Scholar] [CrossRef] [PubMed]
  25. Quilliam, M.A.; Xie, M.; Hardstaff, W.R. Rapid extraction and cleanup for liquid chromatography determination of domoic acid in unsalted seafood. J. AOAC Int. 1995, 78, 543–554. [Google Scholar] [CrossRef]
  26. Chen, J.; Han, T.; Li, X.; He, X.; Wang, Y.; Chen, F.; Song, X.; Zhou, D.; Wang, X. Occurrence and distribution of marine natural organic pollutants: Lipophilic marine algal toxins in the Yellow Sea and the Bohai Sea, China. Sci. Total Environ. 2018, 612, 931–939. [Google Scholar] [CrossRef] [PubMed]
  27. Li, X.; Li, Z.; Chen, J.; Shi, Q.; Zhang, R.; Wang, S.; Wang, X. Detection, occurrence and monthly variations of typical lipophilic marine toxins associated with diarrhetic shellfish poisoning in the coastal seawater of Qingdao City, China. Chemosphere 2014, 111, 560–567. [Google Scholar] [CrossRef] [PubMed]
  28. Bosch-Orea, C.; Sanchís, J.; Farré, M.; Barceló, D. Analysis of lipophilic marine biotoxins by liquid chromatography coupled with high-resolution mass spectrometry in seawater from the Catalan Coast. Anal. Bioanal. Chem. 2017, 409, 5451–5462. [Google Scholar] [CrossRef]
  29. Zendong, Z.; Kadiri, M.; Herrenknecht, C.; Nézan, E.; Mazzeo, A.; Hess, P. Algal toxin profiles in Nigerian coastal waters (Gulf of Guinea) using passive sampling and liquid chromatography coupled to mass spectrometry. Toxicon 2016, 114, 16–27. [Google Scholar] [CrossRef] [Green Version]
  30. Xu, F.; Liu, F.; Wang, C.; Wei, Y. Reversed-phase/weak anion exchange magnetic mesoporous microspheres for removal of matrix effects in lipophilic marine biotoxins analysis by ultrahigh-performance liquid chromatography coupled to tandem mass spectrometry. Food Chem. 2019, 294, 104–111. [Google Scholar] [CrossRef]
  31. Giménez-Campillo, C.; Pastor-Belda, M.; Campillo, N.; Arroyo-Manzanares, N.; Hernández-Córdoba, M.; Viñas, P. Determination of cyanotoxins and phycotoxins in seawater and algae-based food supplements using ionic liquids and liquid chromatography with time-of-flight mass spectrometry. Toxins 2019, 11, 610. [Google Scholar] [CrossRef] [Green Version]
  32. Gerssen, A.; McElhinney, M.A.; Mulder, P.P.J.; Bire, R.; Hess, P.; De Boer, J. Solid phase extraction for removal of matrix effects in lipophilic marine toxin analysis by liquid chromatography-tandem mass spectrometry. Anal. Bioanal. Chem. 2009, 394, 1213–1226. [Google Scholar] [CrossRef] [PubMed] [Green Version]
  33. Rodríguez, I.; Alfonso, A.; González-Jartín, J.M.; Vieytes, M.R.; Botana, L.M. A single run UPLC-MS/MS method for detection of all EU-regulated marine toxins. Talanta 2018, 189, 622–628. [Google Scholar] [CrossRef]
  34. Domènech, A.; Cortés-Francisco, N.; Palacios, O.; Franco, J.M.; Riobó, P.; Llerena, J.J.; Vichi, S.; Caixach, J. Determination of lipophilic marine toxins in mussels. Quantification and confirmation criteria using high resolution mass spectrometry. J. Chromatogr. A 2014, 1328, 16–25. [Google Scholar] [CrossRef] [PubMed] [Green Version]
  35. Li, A.; Sun, G.; Qiu, J.; Fan, L. Lipophilic shellfish toxins in Dinophysis caudata picked cells and in shellfish from the East China Sea. Environ. Sci. Pollut. Res. 2015, 22, 3116–3126. [Google Scholar] [CrossRef] [PubMed]
  36. Orellana, G.; Van Meulebroek, L.; Van Vooren, S.; De Rijcke, M.; Vandegehuchte, M.; Janssen, C.R.; Vanhaecke, L. Quantification and profiling of lipophilic marine toxins in microalgae by UHPLC coupled to high-resolution orbitrap mass spectrometry. Anal. Bioanal. Chem. 2015, 407, 6345–6356. [Google Scholar] [CrossRef] [PubMed]
  37. Krock, B.; Tillmann, U.; John, U.; Cembella, A. LC-MS-MS aboard ship: Tandem mass spectrometry in the search for phycotoxins and novel toxigenic plankton from the North Sea. Anal. Bioanal. Chem. 2008, 392, 797–803. [Google Scholar] [CrossRef] [PubMed] [Green Version]
  38. McCarron, P.; Wright, E.; Quilliam, M.A. Liquid chromatography/mass spectrometry of domoic acid and lipophilic shellfish toxins with selected reaction monitoring and optional confirmation by library searching of product ion spectra. J. AOAC Int. 2014, 97, 316–324. [Google Scholar] [CrossRef]
  39. Josić, D.; Rešetar, D.; Peršurić, Ž.; Martinović, T.; Kraljevic Pavelić, S. Detection of microbial toxins by -omics methods: A growing role of proteomics. In Proteomics for Microbial Toxin Identification; Elsevier: Amsterdam, The Netherlands, 2017; pp. 497–505. ISBN 9780128040577. [Google Scholar]
Figure 1. Molecular structures of the monitored toxins.
Toxins 13 00057 g001
Figure 2. Influence of the nature of the: (a) extractant phase and (b) dispersant solvent on dispersive liquid–liquid microextraction (DLLME) microextraction efficiency. 13,19-didesM: 13,19-didesmethyl spirolide C; OA: okadaic acid; AZA1: azaspiracid 1; PTX2: pectenotoxin 2.
Toxins 13 00057 g002
Figure 3. Response plots showing the influence of sample, dispersant, and extractant volumes on the relative response of the compounds. 13,19-didesM: 13,19-didesmethyl spirolide C; OA: okadaic acid; AZA1: azaspiracid 1; PTX2: pectenotoxin 2.
Toxins 13 00057 g003
Figure 4. Extracted ion chromatograms (EICs) obtained using the DLLME with LC-QqQ-MS/MS procedure for a sample fortified at 10 ng L−1 (50 ng L−1 for DTX1). GYM: gymnodimine; 13,19-didesM: 13,19-didesmethyl spirolide C; 13-desM: 13-desmethyl spirolide C; SPX20G: 20-spirolide G; OA: okadaic acid; DTX: dinophysitoxin; PTX2: pectenotoxin 2; AZA: azaspiracid.
Toxins 13 00057 g004
Table 1. Elution gradient program.
Time (min)Solvent B (%)Flow Rate (mL min−1)
0250.3
3600.3
8600.3
8.5750.3
15750.3
15.5750.4
20850.4
20.5950.5
26950.5
31250.5
Table 2. Liquid chromatography-triple quadrupole-tandem mass spectrometry (LC-QqQ-MS/MS) parameters for the lipophilic toxins analyzed.
CompoundRetention Time (min)Multiple Reaction Monitoring Transition (m/z)Fragmentation Voltage (V)Collision Energy (V)
GYM6.93508.3 → 490.6 120040
13,19didesM7.32678 → 430 1
678 → 164 (194)
200
200
50
40
13desM7.72692 → 164 1
692 → 444 (44)
200
200
50
20
SPX20G8.12706 → 688 1
706 → 670 (33)
190
190
30
35
OA13.8827 → 723 1
827 → 809 (47)
190
190
55
45
DTX214.7827 → 723 1
827 → 809 (40)
190
190
55
45
PTX214.8881.5 → 539.3 1
881.5 → 837.5 (99)
230
230
60
70
AZA415.0844 → 826 1
844 → 808 (12)
190
190
30
45
DTX117.5841 → 737 1
841 → 823 (50)
190
190
45
55
AZA318.6828 → 810 1
828 → 792 (13)
190
190
30
45
AZA519.0844 → 826 1
844 → 808 (37)
180
180
30
40
AZA119.4842 → 824 1
842 → 806 (17)
190
190
30
45
AZA220.0856 → 838 1
856 → 820 (17)
190
190
30
45
1 Transition used for quantitation. Values in brackets mean relative abundance (expressed as a percentage) related to the product ion of the transition used for quantitation. GYM: gymnodimine; 13,19-didesM: 13,19-didesmethyl spirolide C; 13-desM: 13-desmethyl spirolide C; SPX20G: 20-spirolide G; OA: okadaic acid; DTX: dinophysitoxin; PTX2: pectenotoxin 2; AZA: azaspiracid.
Table 3. Central composite design (CCD) to study the relationship between the volumes of the three phases used in the dispersive liquid-liquid microextraction (DLLME) technique.
AssayPoint TypeSample
(mL)
MeOH
(mL)
CHCl3
(µL)
AssayPoint TypeSample
(mL)
MeOH
(mL)
CHCl3
(µL)
1Cubic6220011Central91.25450
2Cubic120.570012Cubic122700
3Cubic12220013Axial91.25575
4Central91.2545014Axial91.25325
5Cubic120.520015Central91.25450
6Cubic60.520016Axial91.625450
7Central91.2545017Axial10.51.25450
8Cubic6270018Axial7.51.25450
9Central91.2545019Axial90.875450
10Cubic60.570020central91.25450
Table 4. Analytical characteristics.
CompoundLinearity Range
(ng L−1)
Limit of
Detection
(ng L−1)
Limit of
Quantitation
(ng L−1)
Relative Standard Deviation
(%)
GYM2.5–10000.72.30.1
13,19didesM1.0–10000.31.03.1
13desM1.0–10000.20.71.7
SPX20G3.5–10001.03.30.9
OA5.0–15001.44.70.8
DTX24.0–10001.13.71.9
PTX24.5–10001.13.72.3
AZA44.5–10001.34.35.1
DTX120–50005.7197.5
AZA33.0–10000.93.02.1
AZA51.0–10000.20.71.8
AZA11.0–10000.31.01.0
AZA22.0–10000.62.03.6
GYM: gymnodimine; 13,19-didesM: 13,19-didesmethyl spirolide C; 13-desM: 13-desmethyl spirolide C; SPX20G: 20-spirolide G; OA: okadaic acid; DTX: dinophysitoxin; PTX2: pectenotoxin 2; AZA: azaspiracid.
Table 5. Recovery 1 studies in seawater samples.
CompoundLevel
(ng·L−1)
Sample 1Sample 2CompoundLevel
(ng·L−1)
Sample 1Sample 2
GYM10
50
100
98
112
102
AZA410
50
121
114
104
120
13,19didesM10
50
89
92
90
94
DTX150
100
90
106
123
93
13desM10
50
95
96
98
97
AZA310
50
101
106
113
106
SPX20G10
50
82
119
114
121
AZA510
50
104
101
104
104
OA10
50
111
99
109
96
AZA110
50
105
95
107
112
DTX210
50
90
105
118
90
AZA210
50
101
99
115
102
PTX210
50
96
102
112
112
1 Mean value (n = 3). GYM: gymnodimine;13,19-didesM: 13,19-didesmethyl spirolide C; 13-desM: 13-desmethyl spirolide C; SPX20G: 20-spirolide G; OA: okadaic acid; DTX: dinophysitoxin; PTX2: pectenotoxin 2; AZA: azaspiracid.
Table 6. Comparison of the developed method with others previously published for the determination of toxins in seawater using liquid chromatography-mass spectrometry.
Sample TreatmentLimit of Detection Range (ng L−1)Ref.
TechniqueSample Volume (mL)Solvent ConsumptionTime (min)GYMSPXsOA and DTXsPTXsAZAs
SPE50010 mL MeOH5321410250171–657.51291237–1283[22]
SPE3006 mL MeOH + 9 mL NH4OH/MeOH3382523.534.2–128.960.68.5–82.4[26]
SPE2009 mL MeOH238--6813-[27]
SPE50010 mL MeOH520--0.30.50.002–0.003[28]
DMSPE501.5 mL NH4OH/AcN + 1.5 mL FA/AcN-0.030.030.2-0.03[23]
IL-DLLME100.5 mL AcN3--1500--[31]
DLLME120.5 mL MeOH + 0.44 mL CHCl350.70.2–11.1–5.71.10.2–1.3This work
GYM: gymnodimine; SPX: spirolide; OA: okadaic acid; DTX: dinophysitoxin; PTX: pectenotoxin; AZA: azaspiracid. SPE: solid phase extraction; DMSPE: dispersive magnetic solid phase extraction; IL: ionic liquid; DLLME: dispersive liquid-liquid microextraction.
Publisher’s Note: MDPI stays neutral with regard to jurisdictional claims in published maps and institutional affiliations.

