Analysis of Multiple Mycotoxins in the Qatari Population and Their Relation to Markers of Oxidative Stress

 , and
, and
Abstract
:1. Introduction
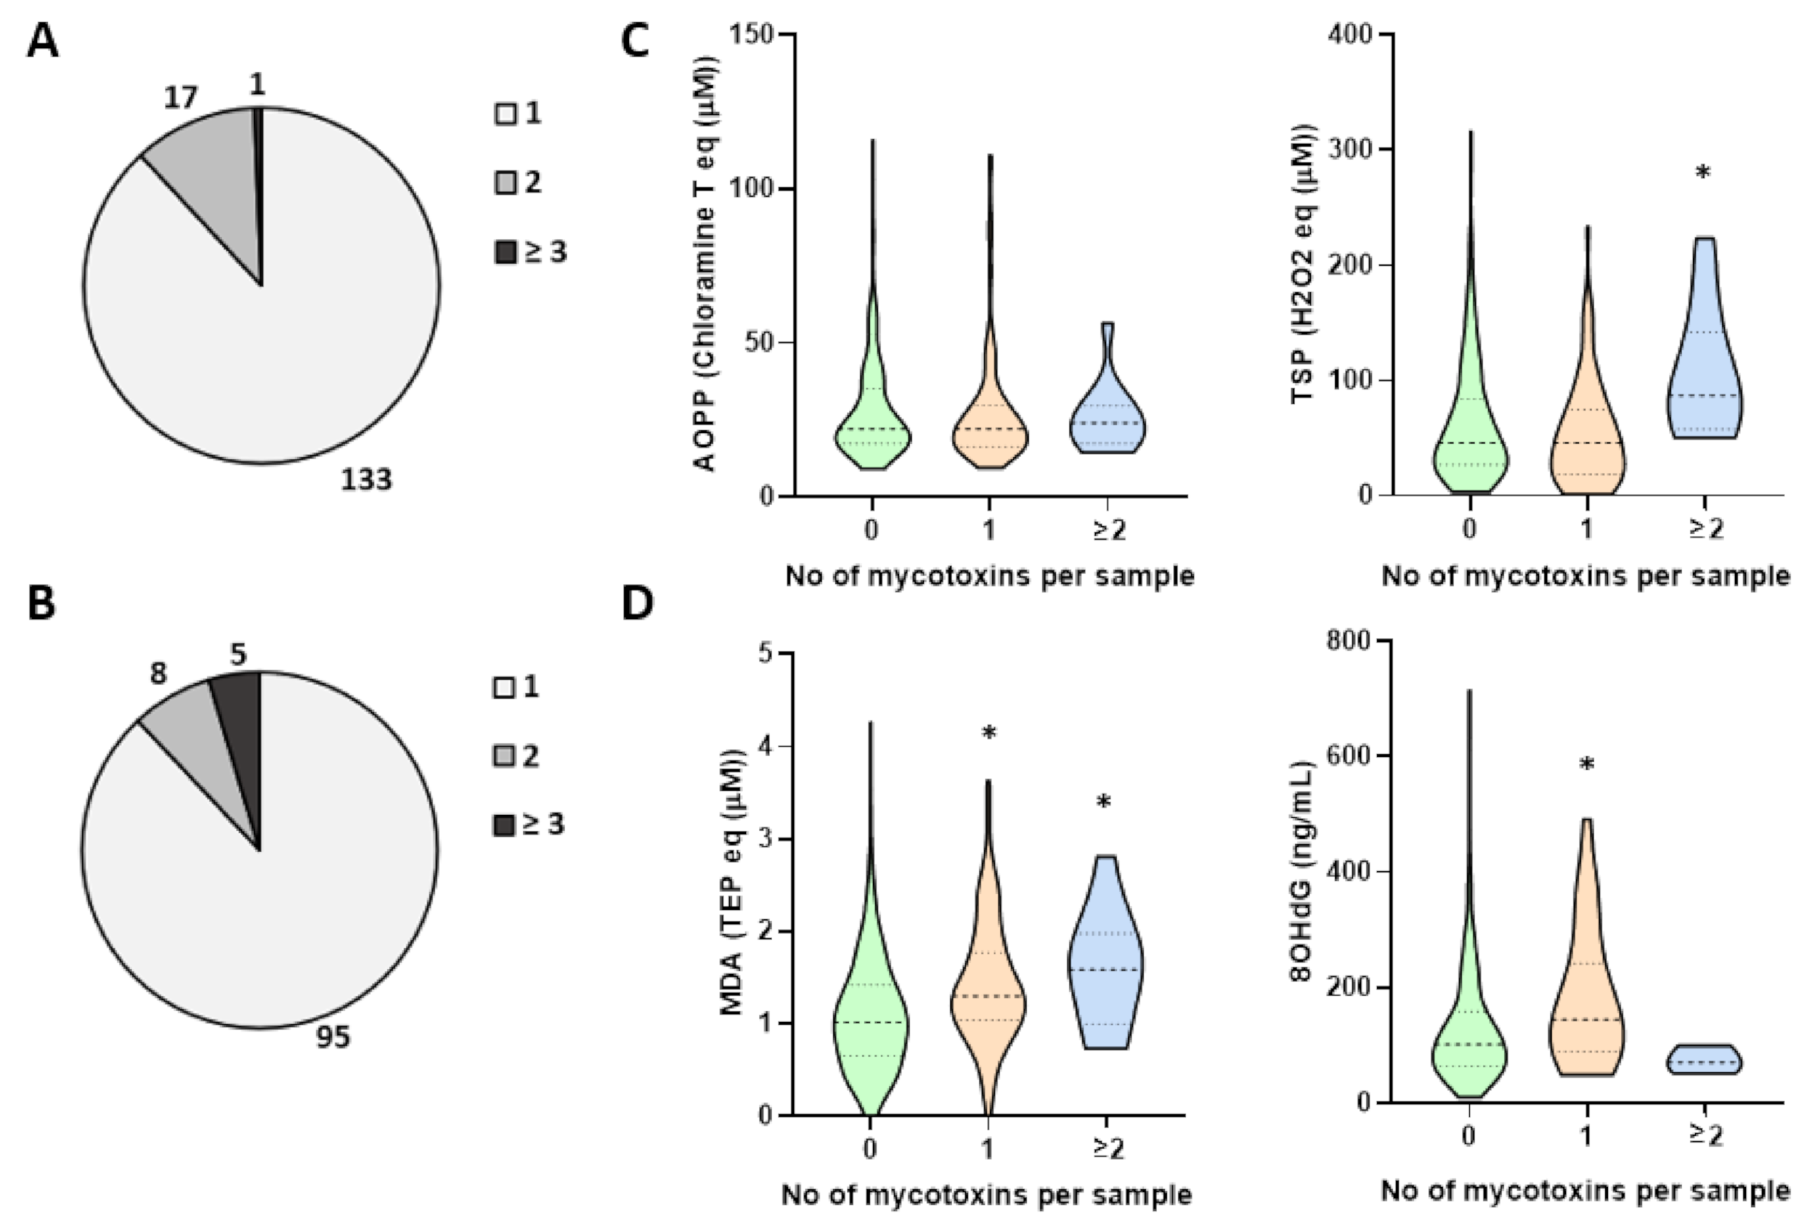
2. Results
3. Discussion
4. Conclusions
5. Materials and Methods
5.1. Chemicals and Reagents
5.2. Reference Materials
5.3. Study Population and Biological Samples
5.4. Sample Preparation
5.5. MultiMycotoxin Analysis of Serum Samples by UHPLC–MS/MS
5.6. MultiMycotoxin Analysis of Urine Samples by HPLC–ESI–HRAMS
5.7. Serum AOPP Assay
5.8. Measurement of TSP
5.9. Thiobarbituric Acid Reactive Substances (TBARS) Assay
5.10. Urinary DNA/RNA Oxidative Damage Assay
5.11. Statistics and Data Analysis
Author Contributions
Funding
Institutional Review Board Statement
Informed Consent Statement
Data Availability Statement
Acknowledgments
Conflicts of Interest
References
- Eskola, M.; Kos, G.; Elliott, C.T.; Hajšlová, J.; Mayar, S.; Krska, R. Worldwide contamination of food-crops with mycotoxins: Validity of the widely cited ‘FAO estimate’ of 25%. Crit. Rev. Food Sci. Nutr. 2020, 60, 2773–2789. [Google Scholar] [CrossRef] [PubMed]
- Reddy, K.R.N.; Salleh, B.; Saad, B.; Abbas, H.K.; Abel, C.A.; Shier, W.T. An overview of mycotoxin contamination in foods and its implications for human health. Toxin Rev. 2010, 29, 3–26. [Google Scholar] [CrossRef]
- Al-Jaal, B.; Salama, S.; Al-Qasmi, N.; Jaganjac, M. Mycotoxin contamination of food and feed in the Gulf Cooperation Council countries and its detection. Toxicon 2019, 171, 43–50. [Google Scholar] [CrossRef] [PubMed]
- Ostry, V.; Malir, F.; Toman, J.; Grosse, Y. Mycotoxins as human carcinogens—the IARC Monographs classification. Mycotoxin Res. 2017, 33, 65–73. [Google Scholar] [CrossRef]
- Al-Jaal, B.A.; Latiff, A.; Salama, S.; Barcaru, A.; Horvatovich, P.; Jaganjac, M. Determination of multiple mycotoxins in Qatari population serum samples by LC–MS/MS. World Mycotoxin J. 2020, 13, 57–65. [Google Scholar] [CrossRef]
- Al Jabir, M.; Barcaru, A.; Latiff, A.; Jaganjac, M.; Ramadan, G.; Horvatovich, P. Dietary exposure of the Qatari population to food mycotoxins and reflections on the regulation limits. Toxicol. Rep. 2019, 6, 975–982. [Google Scholar] [CrossRef]
- Da Silva, E.O.; Bracarense, A.P.F.L.; Oswald, I.P. Mycotoxins and oxidative stress: Where are we? World Mycotoxin J. 2018, 11, 113–133. [Google Scholar] [CrossRef]
- Jaganjac, M.; Čačev, T.; Čipak, A.; Kapitanović, S.; Trošelj, K.G.; Žarković, N. Even stressed cells are individuals: Second messengers of free radicals in pathophysiology of cancer. Croat. Med. J. 2012, 53, 304–309. [Google Scholar] [CrossRef] [Green Version]
- Jaganjac, M.; Cipak, A.; Schaur, R.J.; Zarkovic, N. Pathophysiology of neutrophil-mediated extracellular redox reactions. Front. Biosci. Landmark 2016, 21, 839–855. [Google Scholar] [CrossRef] [Green Version]
- Jaganjac, M.; Glavan, T.M.; Zarkovic, N. The Role of Acrolein and NADPH Oxidase in the Granulocyte-Mediated Growth-Inhibition of Tumor Cells. Cells 2019, 8, 292. [Google Scholar] [CrossRef] [Green Version]
- Jaganjac, M.; Milkovic, L.; Gegotek, A.; Cindric, M.; Zarkovic, K.; Skrzydlewska, E.; Zarkovic, N. The relevance of pathophysiological alterations in redox signaling of 4-hydroxynonenal for pharmacological therapies of major stress-associated diseases. Free Radic. Biol. Med. 2020, 157. [Google Scholar] [CrossRef]
- Al-Menhali, A.S.; Banu, S.; Angelova, P.R.; Barcaru, A.; Horvatovich, P.; Abramov, A.Y.; Jaganjac, M. Lipid peroxidation is involved in calcium dependent upregulation of mitochondrial metabolism in skeletal muscle. Biochim. Biophys. Acta Gen. Subj. 2020, 1864. [Google Scholar] [CrossRef]
- Al-Jaal, B.A.; Jaganjac, M.; Barcaru, A.; Horvatovich, P.; Latiff, A. Aflatoxin, fumonisin, ochratoxin, zearalenone and deoxynivalenol biomarkers in human biological fluids: A systematic literature review, 2001–2018. Food Chem. Toxicol. 2019, 129, 211–228. [Google Scholar] [CrossRef] [Green Version]
- Anninou, N.; Chatzaki, E.; Papachristou, F.; Pitiakoudis, M.; Simopoulos, C. Mycotoxins’ activity at toxic and sub-toxic concentrations: Differential cytotoxic and genotoxic effects of single and combined administration of sterigmatocystin, ochratoxin a and citrinin on the hepatocellular cancer cell line Hep3B. Int. J. Environ. Res. Public Health 2014, 11, 1855–1872. [Google Scholar] [CrossRef]
- Johnsen, H.; Odden, E.; Johnsen, B.A.; Fonnum, F. Metabolism of T-2 toxin by blood cell carboxylesterases. Biochem. Pharmacol. 1988, 37, 3193–3197. [Google Scholar] [CrossRef]
- Abdulkadar, A.H.W.; Al-Ali, A.A.; Al-Kildi, A.M.; Al-Jedah, J.H. Mycotoxins in food products available in Qatar. Food Control 2004, 15, 543–548. [Google Scholar] [CrossRef]
- Ul Hassan, Z.; Al Thani, R.; Atia, F.A.; Al Meer, S.; Migheli, Q.; Jaoua, S. Co-occurrence of mycotoxins in commercial formula milk and cereal-based baby food on the Qatar market. Food Addit. Contam. Part B Surveill. 2018, 11, 191–197. [Google Scholar] [CrossRef]
- Al-Hazmi, N. Fungal flora and deoxynivalenol (DON) level in wheat from Jeddah market, Saudi Arabia. Afr. J. Biotechnol. 2011, 10, 168–173. [Google Scholar] [CrossRef]
- Finoli, C.; Vecchio, A.; Galli, A.; Dragoni, I. Roquefortine C occurrence in blue cheese. J. Food Prot. 2001, 64, 246–251. [Google Scholar] [CrossRef]
- Reinholds, I.; Rusko, J.; Pugajeva, I.; Berzina, Z.; Jansons, M.; Kirilina-Gutmane, O.; Tihomirova, K.; Bartkevics, V. The occurrence and dietary exposure assessment of mycotoxins, biogenic amines, and heavy metals in mould-ripened blue cheeses. Foods 2020, 9, 93. [Google Scholar] [CrossRef] [Green Version]
- Domijan, A.-M.; Abramov, A.Y. Fumonisin B1 inhibits mitochondrial respiration and deregulates calcium homeostasis—Implication to mechanism of cell toxicity. Int. J. Biochem. Cell Biol. 2011, 43, 897–904. [Google Scholar] [CrossRef]
- Wang, W.-J.; Xu, Z.-L.; Yu, C.; Xu, X.-H. Effects of aflatoxin B1 on mitochondrial respiration, ROS generation and apoptosis in broiler cardiomyocytes. Anim. Sci. J. 2017, 88, 1561–1568. [Google Scholar] [CrossRef]
- Juan-García, A.; Juan, C.; Tolosa, J.; Ruiz, M.-J. Effects of deoxynivalenol, 3-acetyl-deoxynivalenol and 15-acetyl-deoxynivalenol on parameters associated with oxidative stress in HepG2 cells. Mycotoxin Res. 2019, 35, 197–205. [Google Scholar] [CrossRef]
- Babayan, N.; Tadevosyan, G.; Khondkaryan, L.; Grigoryan, R.; Sarkisyan, N.; Haroutiounian, R.; Stopper, H. Ochratoxin A induces global DNA hypomethylation and oxidative stress in neuronal cells in vitro. Mycotoxin Res. 2020, 36, 73–81. [Google Scholar] [CrossRef] [PubMed]
- Malekinejad, H.; Aghazadeh-Attari, J.; Rezabakhsh, A.; Sattari, M.; Ghasemsoltani-Momtaz, B. Neurotoxicity of mycotoxins produced in vitro by Penicillium roqueforti isolated from maize and grass silage. Hum. Exp. Toxicol. 2015, 34, 997–1005. [Google Scholar] [CrossRef]
- Marin, D.E.; Pistol, G.C.; Neagoe, I.V.; Calin, L.; Taranu, I. Effects of zearalenone on oxidative stress and inflammation in weanling piglets. Food Chem. Toxicol. 2013, 58, 408–415. [Google Scholar] [CrossRef]
- Ribeiro, S.M.R.; Chagas, G.M.; Campello, A.P.; Klüppel, M.L.W. Mechanism of citrinin-induced dysfunction of mitochondria. V. Effect on the homeostasis of the reactive oxygen species. Cell Biochem. Funct. 1997, 15, 203–209. [Google Scholar] [CrossRef]
- Technical Note 17. Guidelines for the Validation and Verification of Quantitative and Qualitative Test Methods; National Association of Testing Authorities (NATA): Rhodes, Australia, 2013; pp. 3–23. [Google Scholar]
- Witko-Sarsat, V.; Friedlander, M.; Khoa, T.N.; Capeillère-Blandin, C.; Nguyen, A.T.; Canteloup, S.; Dayer, J.-M.; Jungers, P.; Drücke, T.; Descamps-Latscha, B. Advanced oxidation protein products as novel mediators of inflammation and monocyte activation in chronic renal failure. J. Immunol. 1998, 161, 2524–2532. [Google Scholar]
- Tatzber, F.; Griebenow, S.; Wonisch, W.; Winkler, R. Dual method for the determination of peroxidase activity and total peroxides-iodide leads to a significant increase of peroxidase activity in human sera. Anal. Biochem. 2003, 316, 147–153. [Google Scholar] [CrossRef]


| Urine Samples (n = 559) | Serum Samples (n = 412) | |
|---|---|---|
| Female | 256 | 197 |
| Male | 303 | 215 |
| Age (years) | 38.5 ± 9.7 | 39.2 ± 10.1 |
| Weight (kg) | 76.8 ± 18.5 | 76.3 ± 17.3 |
| Overall Health | ||
| Excellent | 169 | 137 |
| Good | 289 | 209 |
| Fair | 84 | 53 |
| Poor | 13 | 8 |
| No answer | 4 | 5 |
| Smoking Status | ||
| Smoker | 132 | 85 |
| Nonsmoker | 198 | 161 |
| Former smoker | 42 | 31 |
| No answer | 187 | 135 |
| Analyte | No of Positive Samples | Total Incidence | Incidence (%) | Range (ng/mL) * | |
|---|---|---|---|---|---|
| <LOQ # | >LOQ | ||||
| 15-AcDON | 0 | 1 | 1 | 0.2 | 8.3 |
| 3-AcDON | 14 | 12 | 26 | 6.3 | 3.2–7.2 |
| AFB1 | 0 | 0 | 0 | 0.0 | n.a. |
| AFB2 | 0 | 1 | 1 | 0.2 | 0.2 |
| AFG2 | 1 | 25 | 26 | 6.3 | 0.2–12.9 |
| AFM1 | 0 | 0 | 0 | 0.0 | n.a. |
| Total AFs $ | 1 | 26 | 27 | 6.6 | 0.2–12.9 |
| CPA | 1 | 5 | 6 | 1.5 | 0.4–2.6 |
| DON | 0 | 0 | 0 | 0.0 | n.a. |
| FusX | 0 | 0 | 0 | 0.0 | n.a. |
| HT-2 | 0 | 0 | 0 | 0.0 | n.a. |
| MPA | 40 | 1 | 41 | 10.0 | 1126.1 |
| NEO | 45 | 0 | 45 | 10.9 | <LOQ |
| OTA | 15 | 4 | 19 | 4.6 | 3.9–5.6 |
| OTB | 2 | 1 | 3 | 0.7 | <LOQ–46 |
| Total OTs | 17 | 5 | 22 | 5.0 | <LOQ–46 |
| ROC | 0 | 0 | 0 | 0.0 | n.a. |
| STE | 0 | 1 | 1 | 0.2 | 0.7 |
| ZEN | 0 | 1 | 1 | 0.2 | 28.1 |
| a-ZEL | 0 | 0 | 0 | 0.0 | n.a. |
| b-ZEL | 0 | 0 | 0 | 0.0 | n.a. |
| Analyte | No of Positive Samples | Total Incidence | Incidence (%) | Range (ng/mL) * | |
|---|---|---|---|---|---|
| <LOQ # | >LOQ | ||||
| AFB1 | 2 | 0 | 2 | 0.4 | <LOQ |
| AFB2 | 13 | 0 | 13 | 2.3 | <LOQ |
| AFG2 | 5 | 4 | 9 | 1.6 | 0.19–0.34 |
| AFM1 | 3 | 0 | 3 | 0.5 | <LOQ |
| Total AFs $ | 23 | 4 | 27 | 4.8 | 0.19–0.34 |
| CIT | 6 | 0 | 6 | 1.1 | <LOQ |
| CPA | 0 | 0 | 0 | 0.0 | n.a. |
| FB1 | 1 | 0 | 1 | 0.2 | <LOQ |
| OTA | 0 | 0 | 0 | 0.0 | n.a. |
| OTB | 3 | 0 | 3 | 0.5 | <LOQ |
| ROC | 18 | 6 | 24 | 4.3 | 0.21–0.33 |
| STE | 5 | 0 | 5 | 0.9 | <LOQ |
| T-2 | 3 | 0 | 3 | 0.5 | <LOQ |
| b-ZEL | 28 | 14 | 42 | 7.5 | 5.11–19.58 |
| a-ZEL | 16 | 6 | 22 | 3.9 | 5.08–7.01 |
| Analyte | Linear Range (ng/mL) | R2 | LOQ (ng/mL) | Measured Form/Adduct | Accurate Mass (m/z) | RT (min) |
|---|---|---|---|---|---|---|
| AFB1 | 0.2–10.0 | >0.994 | 0.2 | [M + H]+ | 313.07066 | 5.17 |
| AFB2 | 0.2–8.0 | >0.998 | 0.2 | [M + H]+ | 315.08631 | 4.84 |
| AFG2 | 0.2–8.0 | >0.990 | 0.2 | [M + H]+ | 331.08123 | 4.45 |
| AFM1 | 0.2–6.4 | >0.985 | 0.2 | [M + H]+ | 329.06558 | 4.82 |
| CIT | 1.5–24.0 | >0.990 | 1.5 | [M + H]+ | 251.09140 | 6.00 |
| CPA | 0.2–10.0 | >0.994 | 0.2 | [M + H]+ | 337.15467 | 7.53 |
| FB1 | 0.2–10.0 | >0.995 | 0.2 | [M + H]+ | 722.39575 | 5.03 |
| OTA | 1.5–24.0 | >0.989 | 1.5 | [M + H]+ | 404.08954 | 6.86 |
| OTB | 5.0–40.0 | >0.990 | 5.0 | [M + H]+ | 370.12851 | 6.15 |
| ROC | 0.2–10.0 | >0.992 | 0.2 | [M + H]+ | 390.19245 | 5.25 |
| STE | 0.2–10.0 | >0.994 | 0.2 | [M + H]+ | 325.07066 | 7.08 |
| T-2 | 1.5–15.0 | >0.986 | 1.5 | [M + Na]+ | 489.20950 | 6.60 |
| a-ZEL | 5.0–40.0 | >0.994 | 5.0 | [M + H]+ | 321.16965 | 6.21 |
| b-ZEL | 5.0–40.0 | >0.991 | 5.0 | [M + H]+ | 321.16965 | 5.80 |
Publisher’s Note: MDPI stays neutral with regard to jurisdictional claims in published maps and institutional affiliations. |
© 2021 by the authors. Licensee MDPI, Basel, Switzerland. This article is an open access article distributed under the terms and conditions of the Creative Commons Attribution (CC BY) license (https://creativecommons.org/licenses/by/4.0/).
Share and Cite
Al-Jaal, B.; Latiff, A.; Salama, S.; Hussain, H.M.; Al-Thani, N.A.; Al-Naimi, N.; Al-Qasmi, N.; Horvatovich, P.; Jaganjac, M. Analysis of Multiple Mycotoxins in the Qatari Population and Their Relation to Markers of Oxidative Stress. Toxins 2021, 13, 267. https://0-doi-org.brum.beds.ac.uk/10.3390/toxins13040267
Al-Jaal B, Latiff A, Salama S, Hussain HM, Al-Thani NA, Al-Naimi N, Al-Qasmi N, Horvatovich P, Jaganjac M. Analysis of Multiple Mycotoxins in the Qatari Population and Their Relation to Markers of Oxidative Stress. Toxins. 2021; 13(4):267. https://0-doi-org.brum.beds.ac.uk/10.3390/toxins13040267
Chicago/Turabian StyleAl-Jaal, Belqes, Aishah Latiff, Sofia Salama, Huda Mohamed Hussain, Noora Abdulaziz Al-Thani, Noor Al-Naimi, Noof Al-Qasmi, Peter Horvatovich, and Morana Jaganjac. 2021. "Analysis of Multiple Mycotoxins in the Qatari Population and Their Relation to Markers of Oxidative Stress" Toxins 13, no. 4: 267. https://0-doi-org.brum.beds.ac.uk/10.3390/toxins13040267