Article

Interactions between Filter-Feeding Bivalves and Toxic Diatoms: Influence on the Feeding Behavior of Crassostrea gigas and Pecten maximus and on Toxin Production by Pseudo-nitzschia

1
Normandie Université, UNICAEN, CNRS UMR 8067, BOREA, 14000 Caen, France
2
Laboratoire de Biologie des Organismes et Ecosystèmes Aquatiques (BOREA)—Université de Caen Normandie, MNHN, SU, UA, CNRS UMR 8067, IRD 207, 14000 Caen, France
3
Laboratoire de Biologie des Organismes et Ecosystèmes Aquatiques (BOREA)—MNHN, CNRS UMR 8067, SU, IRD 207, UCN, UA, Station de Biologie Marine, MNHN, 29900 Concarneau, France
4
Laboratoire Mer, Molécules, Santé, EA 2160 MMS, Le Mans Université, CEDEX 9, 72085 Le Mans, France
5
Laboratoire des Sciences de l’Environnement Marin (LEMAR), UMR 6539 CNRS, UBO, IRD, Ifremer, IUEM, Technopôle Brest-Iroise, Rue Dumont d’Urville, 29280 Plouzané, France
6
Normandie Université, UNICAEN, EA2608, OeReCa, 14000 Caen, France
7
Normandie Université, UNICAEN, Centre de Recherches en Environnement Côtier (CREC)—Station Marine, Université de Caen Normandie, 14530 Luc-sur-Mer, France
*
Authors to whom correspondence should be addressed.
Submission received: 11 June 2021 / Revised: 10 August 2021 / Accepted: 10 August 2021 / Published: 19 August 2021
(This article belongs to the Special Issue Phycotoxins: From Producers to Transfer in the Food Chain)

Abstract

:
Among Pseudo-nitzschia species, some produce the neurotoxin domoic acid (DA), a source of serious health problems for marine organisms. Filter-feeding organisms—e.g., bivalves feeding on toxigenic Pseudo-nitzschia spp.—are the main vector of DA in humans. However, little is known about the interactions between bivalves and Pseudo-nitzschia. In this study, we examined the interactions between two juvenile bivalve species—oyster (Crassostrea gigas) and scallop (Pecten maximus)—and two toxic Pseudo-nitzschia species—P. australis and P. fraudulenta. We characterized the influence of (1) diet composition and the Pseudo-nitzschia DA content on the feeding rates of oysters and scallops, and (2) the presence of bivalves on Pseudo-nitzschia toxin production. Both bivalve species fed on P. australis and P. fraudulenta. However, they preferentially filtered the non-toxic Isochrysis galbana compared to Pseudo-nitzschia. The presence of the most toxic P. australis species resulted in a decreased clearance rate in C. gigas. The two bivalve species accumulated DA in their tissues (up to 0.35 × 10⁻³ and 5.1 × 10⁻³ µg g−1 for C. gigas and P. maximus, respectively). Most importantly, the presence of bivalves induced an increase in the cellular DA contents of both Pseudo-nitzschia species (up to 58-fold in P. fraudulenta in the presence of C. gigas). This is the first evidence of DA production by Pseudo-nitzschia species stimulated in the presence of filter-feeding bivalves. The results of this study highlight complex interactions that can influence toxin production by Pseudo-nitzschia and accumulation in bivalves. These results will help to better understand the biotic factors that drive DA production by Pseudo-nitzschia and bivalve contamination during Pseudo-nitzschia blooms.
Key Contribution: This work highlights complex interactions between toxic diatoms and filter-feeding bivalves. Domoic-acid-producing Pseudo-nitzschia species affected oyster feeding behavior. This work is the first report highlighting that the presence of filter-feeding bivalves can stimulate Pseudo-nitzschia toxin production.

1. Introduction

The pennate diatoms Pseudo-nitzschia are cosmopolitan [1,2,3]. About 60 species are currently described, and some of them are considered toxic, i.e., able to produce a neurotoxin—domoic acid (DA) [4,5]. DA is transferred to various organisms within marine food webs when toxic Pseudo-nitzschia species are ingested by bivalves (mussels, oysters, scallops), zooplankton (copepods), or planktivorous fish [1,3]. These marine organisms then serve as vectors of the toxin to higher levels of the food web. Bivalves are the primary vector of DA that can cause severe intoxication symptoms in humans [6,7]. Moreover, not only do Pseudo-nitzschia species produce DA, but they also excrete it in their environment, e.g., [8,9,10]. Exposure to dissolved DA (dDA) can also have negative effects on the development of marine life [11,12,13].
Despite the harmful effects of DA on higher trophic levels, only few studies have explored the interactions between toxic Pseudo-nitzschia and primary consumers. The main interactions studied so far are with copepods, e.g., [14,15,16,17,18,19,20,21,22]. These studies showed no difference in the grazing rates of copepods exposed to toxic and/or non-toxic Pseudo-nitzschia. For example, the ingestion rates of Calanus copepodites did not differ when exposed to a toxic P. seriata or non-toxic P. obtusa [20]. In addition, to our knowledge, there are only very few studies available on the influence of toxic Pseudo-nitzschia species on bivalve feeding behavior [23,24,25,26]. The results of these studies show that the oyster Crassostrea virginica and the mussel Mytilus edulis can filter both P. delicatissima and P. multiseries. However, numerous laboratory studies show that bivalve grazing can be affected by other harmful algal species [27,28,29,30,31,32], but other studies did not evidence any influence on grazing, e.g., [33]. The responses of bivalves to toxin-producing algae are highly species-specific [34].
The influence of primary consumers on Pseudo-nitzschia toxin production has mainly been studied with copepods, brine shrimps (Artemia salina) or euryhaline rotifers (Brachionus plicatilis). However, the influence of filtering bivalves on DA production by Pseudo-nitzschia is still poorly known. Copepods can stimulate DA production in some Pseudo-nitzschia species [18,20,21], as observed for other algal toxins in harmful dinoflagellate species [35,36,37]. For example, the cellular DA content of P. seriata increased from undetected to 13.1 pg cell−1 when exposed to the copepods Calanus hyperboreus for 8 days [18]. Moreover, the presence of brine shrimps and/or euryhaline rotifers also increases Pseudo-nitzschia cellular DA contents, as reviewed in [1]. For example, A. salina increased DA production by P. multiseries up to 23-fold [38]. Thus, DA production in Pseudo-nitzschia can be stimulated by the presence of some primary consumers, but very little is known on the influence of filter feeders on DA production.
Pseudo-nitzschia is a common member of the diatom community of the French coasts [39]. Several toxic species have been identified on these coasts [8,40,41,42,43,44] among which are P. australis—one of the most toxic species—and P. fraudulenta—a less toxic one [45,46]. Along the French coasts, Pseudo-nitzschia species grow throughout the year with maximum abundance from May to July and in September [8,39,41,42,44]. However, the interannual variability of Pseudo-nitzschia toxic blooms in these ecosystems is related to variations in Pseudo-nitzschia species diversity [44]. In France (Bay of Seine, English Channel), DA concentrations in king scallops (Pecten maximus) exceeded the European Union regulatory limit (i.e., DA > 20 µg g−1 wet weight) for the first time in 2004. Since then, DA contamination events have mainly been reported in scallops, resulting in closures of scallop fisheries on the French coasts [39]. DA may also contaminate other bivalve species [47,48]. Despite the presence of toxic Pseudo-nitzschia species in French coastal waters and the health and economic consequences of shellfish DA contaminations, studies on the interactions between Pseudo-nitzschia and bivalves are rare.
Considering the absence of information on the influence of bivalves on DA production by Pseudo-nitzschia and the importance to better characterize DA accumulation in bivalves for human health issues, the aims of this study were to investigate the interactions between two juvenile bivalve species—the oyster C. gigas and the scallop P. maximus—and two Pseudo-nitzschia species—P. australis and P. fraudulenta—from French coastal waters. More specifically, we investigated (1) if bivalve clearance and filtration rates varied according to the algal species and the Pseudo-nitzschia toxin content, (2) to which extent bivalves accumulated DA depending on the Pseudo-nitzschia species they filtered, and (3) if the presence of bivalves influenced DA production by the two Pseudo-nitzschia species with contrasting toxin contents.

2. Results

2.1. Cell Concentrations, Clearance Rates, Filtration Rates

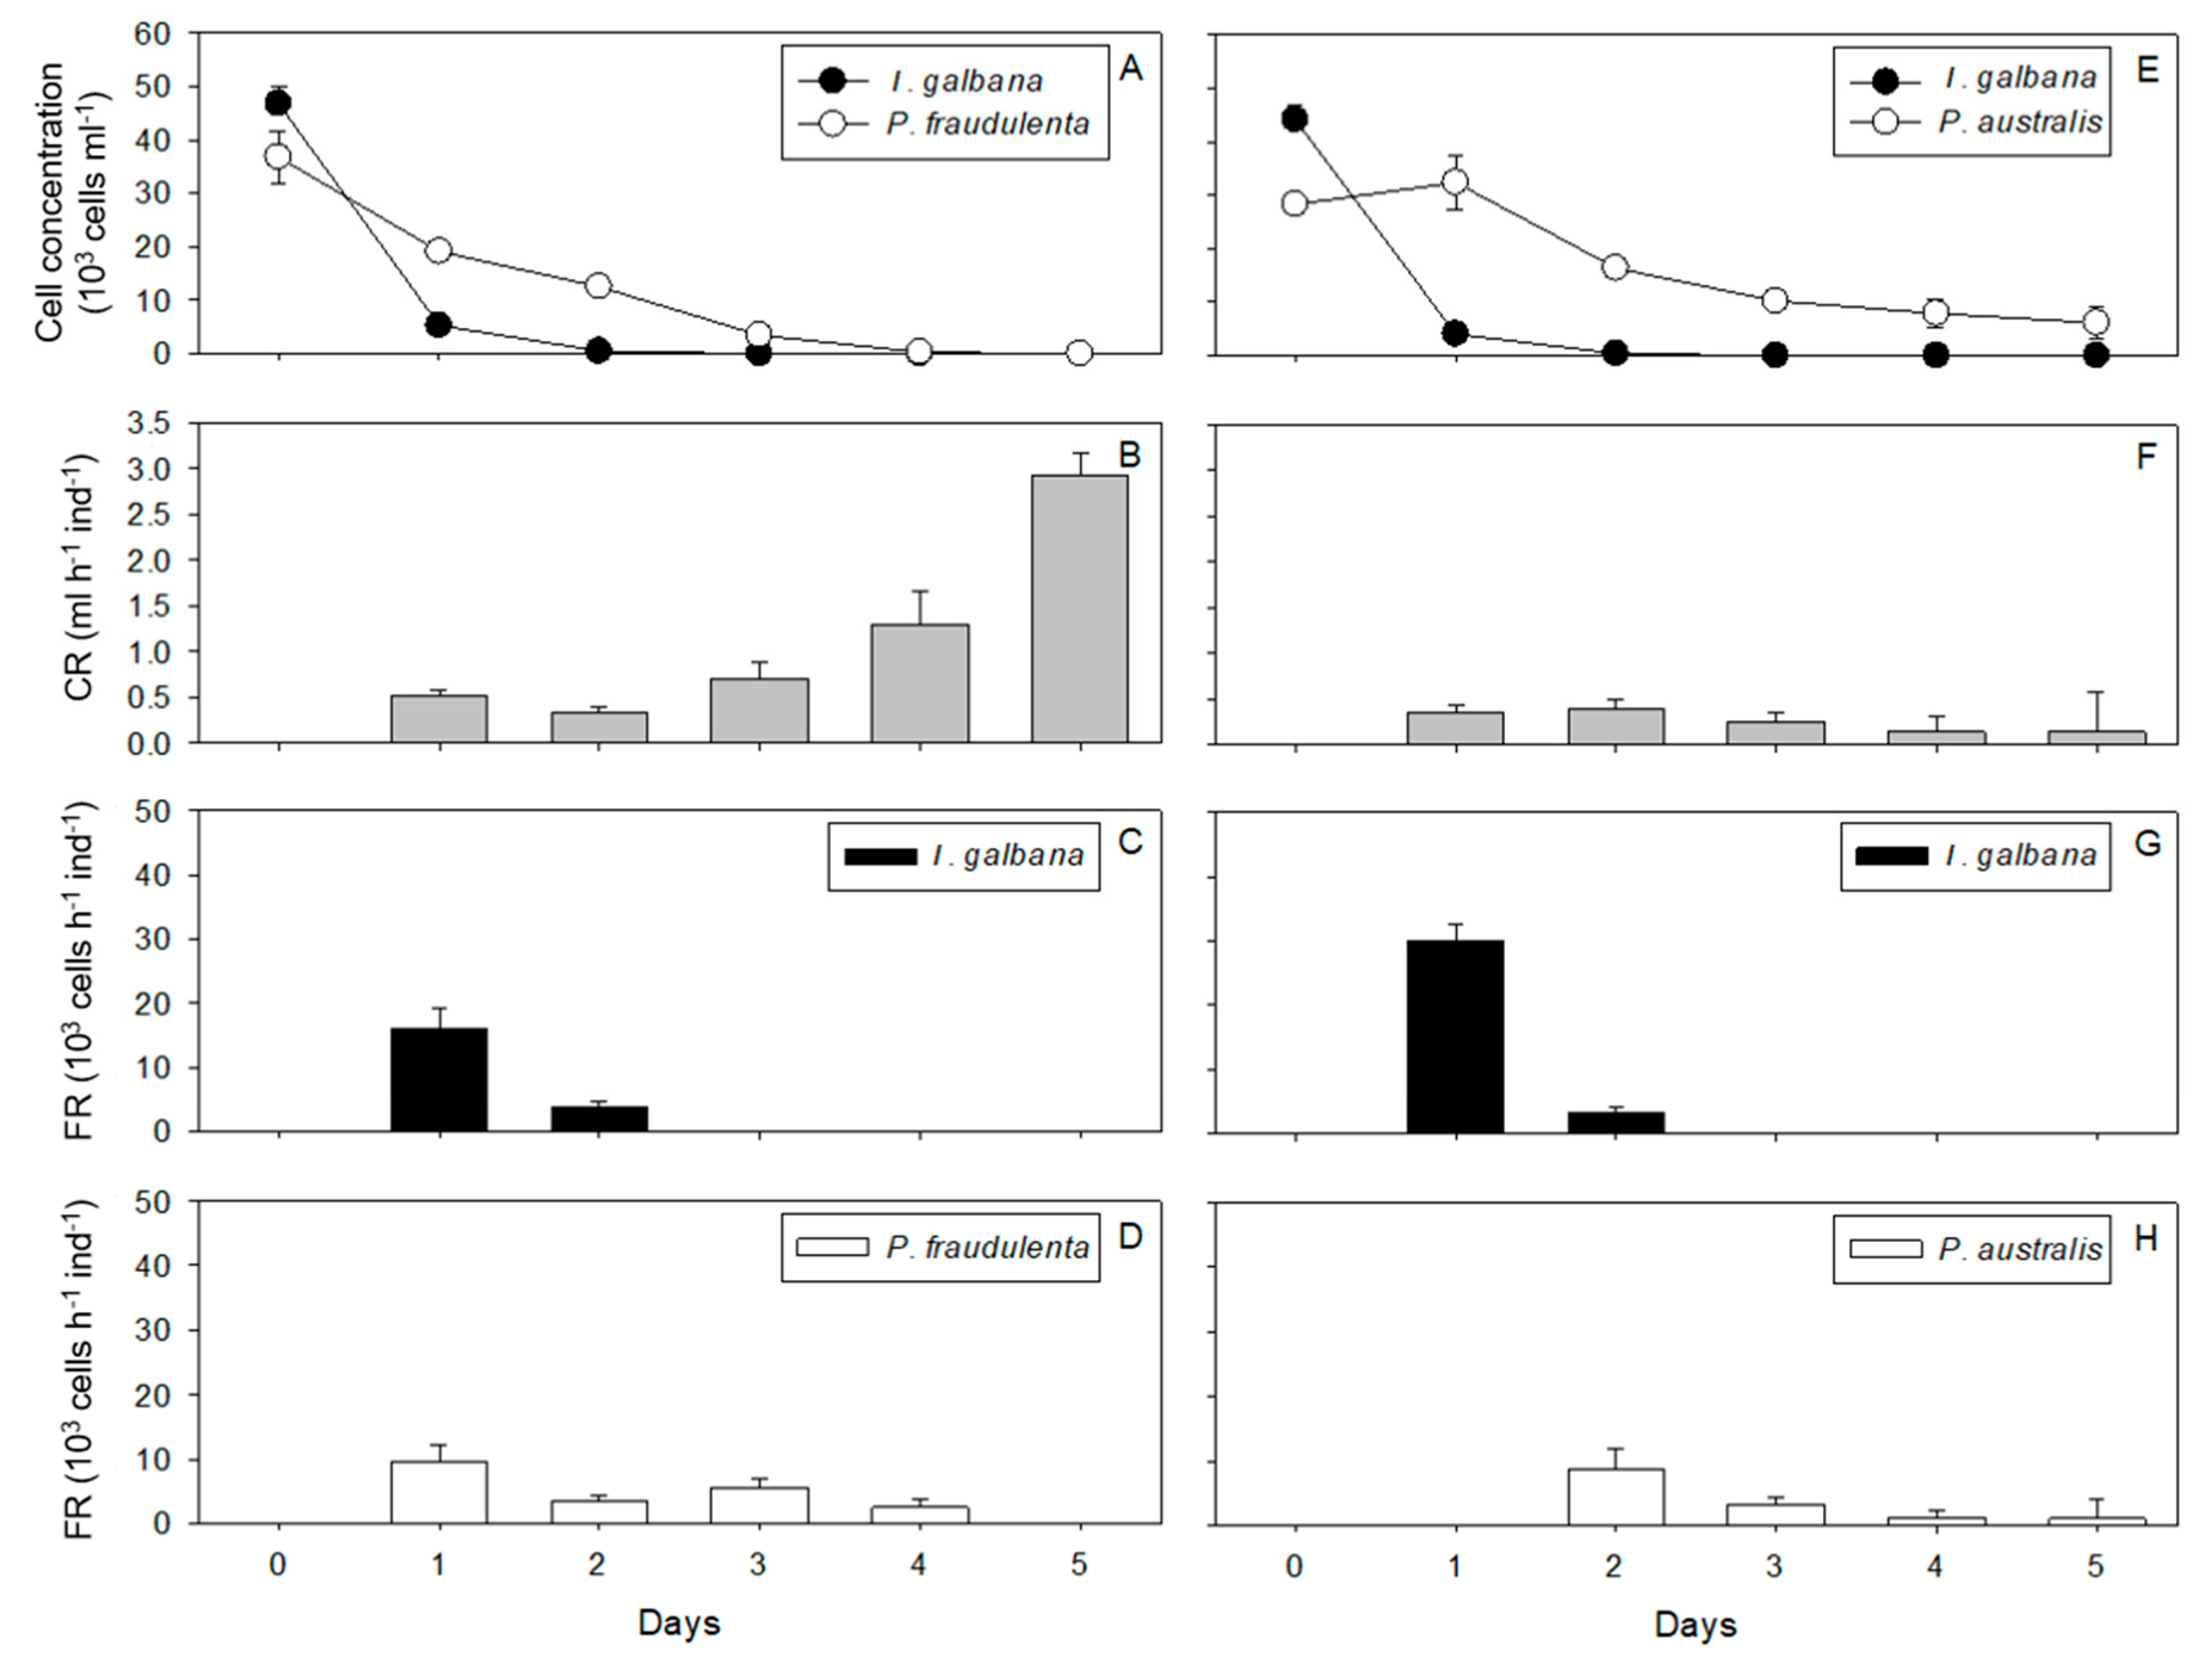
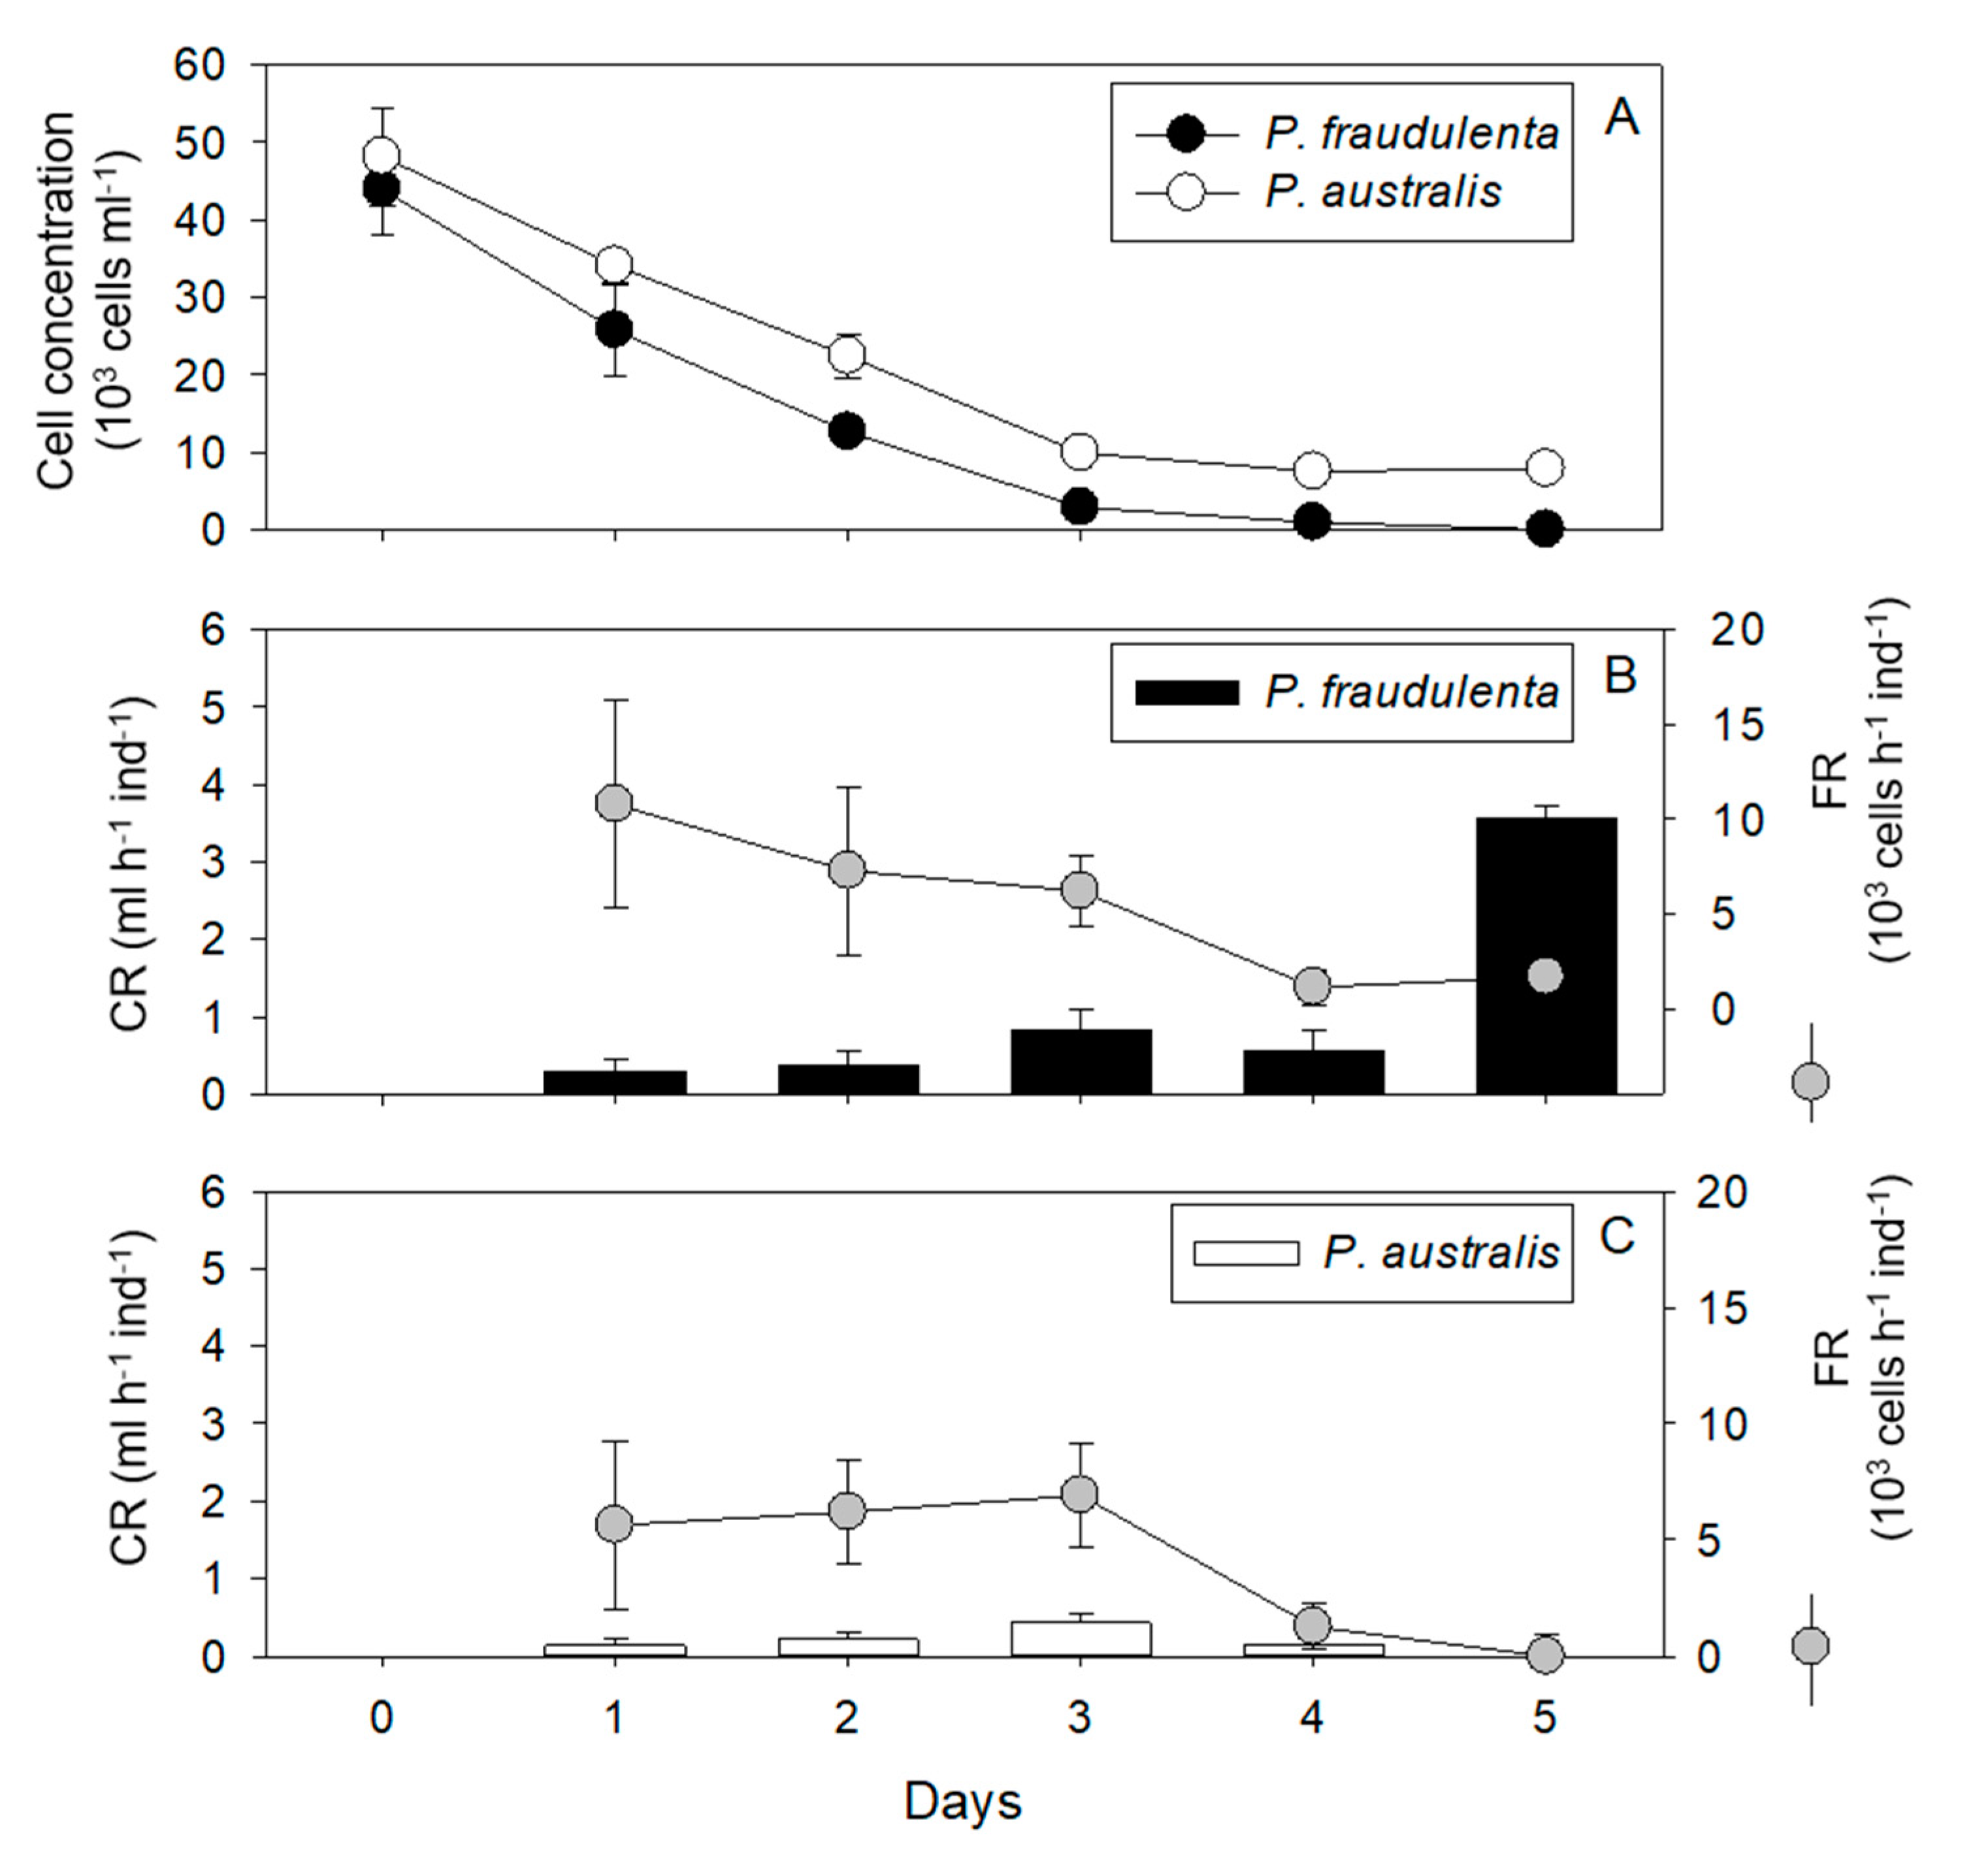
2.1.1. Crassostrea gigas

Condition 1: Juvenile oysters exposed to P. fraudulenta and I. galbana for 5 days. I. galbana and P. fraudulenta cell concentrations decreased over time in all replicates in the presence of C. gigas (Figure 1A), whereas they increased in the absence of oysters (data not shown). The cell concentrations decreased to exhaustion between day 1 and day 2 for I. galbana and between day 3 and day 4 for P. fraudulenta (Figure 1A). The clearance rate (CR) of juvenile C. gigas was around 0.43 mL h−1 ind−1 on days 1 and 2, then it gradually increased significantly from 0.71 mL h−1 ind−1 on day 3 to 2.92 mL h−1 ind−1 on day 5 (RM ANOVA, p < 0.0001, Figure 1B). It started to increase when the cell concentration of the microalgae was less than 3.5 × 10³ cells mL−1 (Figure 1A,B). For I. galbana, the filtration rate (FR) decreased significantly from 16 × 103 cells h−1 ind−1 (day 1) to 3.7 × 10³ cells h−1 ind−1 (day 2) (RM ANOVA, p < 0.01, Figure 1C). For P. fraudulenta, the FR decreased significantly from 9.5 × 10³ cells h−1 ind−1 on day 1 to 2.5 × 10³ cells h−1 ind−1 on day 4 (RM ANOVA, p < 0.01, Figure 1D). This decreased FR was related to the decreasing cell concentrations of both algae throughout the experiment. In addition, the maximum FR for I. galbana was significantly higher than the maximum FR for P. fraudulenta (ANOVA, p < 0.05).
Condition 2: Juvenile oysters exposed to P. australis and I. galbana for 5 days. In the presence of oyster spat, I. galbana cell concentrations decreased to depletion between day 1 and day 2 (Figure 1E). In contrast, P. australis cell concentrations started to decrease only after day 1 and until day 3, and then it stabilized around 8 × 10³ cells mL−1 until the end of the experiment (Figure 1E). The cell concentrations of all two microalgae increased in the oyster-free control (data not shown). The CR remained quite constant and low throughout the 5 days of the experiment, between 0.14 ± 0.43 and 0.40 ± 0.10 mL h−1 ind−1 (Figure 1F). Juvenile C. gigas exposed to P. australis did not increase their CR as microalgal concentrations decreased (Figure 1F). The FRs for I. galbana and P. australis decreased significantly from 30 × 103 (day 1) to 3 × 10³ cells h−1 ind−1 (day 2) and from 8.7 × 10³ cells h−1 ind−1 on day 2 to 0.9 × 10³ cells h−1 ind−1 on day 4, respectively (RM ANOVA, p < 0.01, Figure 1G,H). On day 1, the FR for P. australis was zero (Figure 1H).
Conditions 3 and 4: Juvenile oysters exposed to P. fraudulenta (condition 3) or P. australis (condition 4) for 5 days. P. fraudulenta and P. australis cell concentrations decreased over time in the presence of C. gigas (Figure 2A), whereas they increased in the absence of oysters (data not shown). In the presence of C. gigas, the cell concentration of P. australis decreased between day 0 and day 3, and then it stabilized until the end of the experiment around 8.5 × 10³ cells mL−1, while there were no P. fraudulenta cells left at the end of the experiment (Figure 2A). The CR of C. gigas exposed to P. fraudulenta was between 0.30 and 0.55 mL h−1 ind−1 from day 1 to day 4, and then increased significantly up to 3.55 mL h−1 ind−1 on day 5 (RM ANOVA, p < 0.001, Figure 2B). The FR for P. fraudulenta remained quite constant between day 1 and day 3 with 10.8 × 10³ ± 5.5 × 10³ (day 1) and 6.2 × 10³ ± 1.9 × 10³ cells h−1 ind−1 (day 3, Figure 2B). Then, it decreased significantly to 1.1 × 10³ cells h−1 ind−1 (day 4) and stabilized at 1.7 × 10³ cells h−1 ind−1 on day 5 (RM ANOVA, p < 0.001, Figure 2B). The CR of C. gigas exposed to P. australis varied between 0 ± 0.13 and 0.43 ± 0.13 mL h−1 ind−1 (Figure 2C) and did not differ significantly throughout the experiment. The FR for P. australis was relatively constant during the first three days with an average of 6.2 × 10³ ± 0.4 × 10³ cells h−1 ind−1, and then decreased significantly down to 1.2 × 10³ cells h−1 ind−1 on day 4 and 0 cells h−1 ind−1 on day 5 (RM ANOVA, p < 0.01, Figure 2C), while P. australis cells were still present. The maximum CR was significantly lower for P. australis than for P. fraudulenta (ANOVA, p < 0.001; Figure 2B,C).

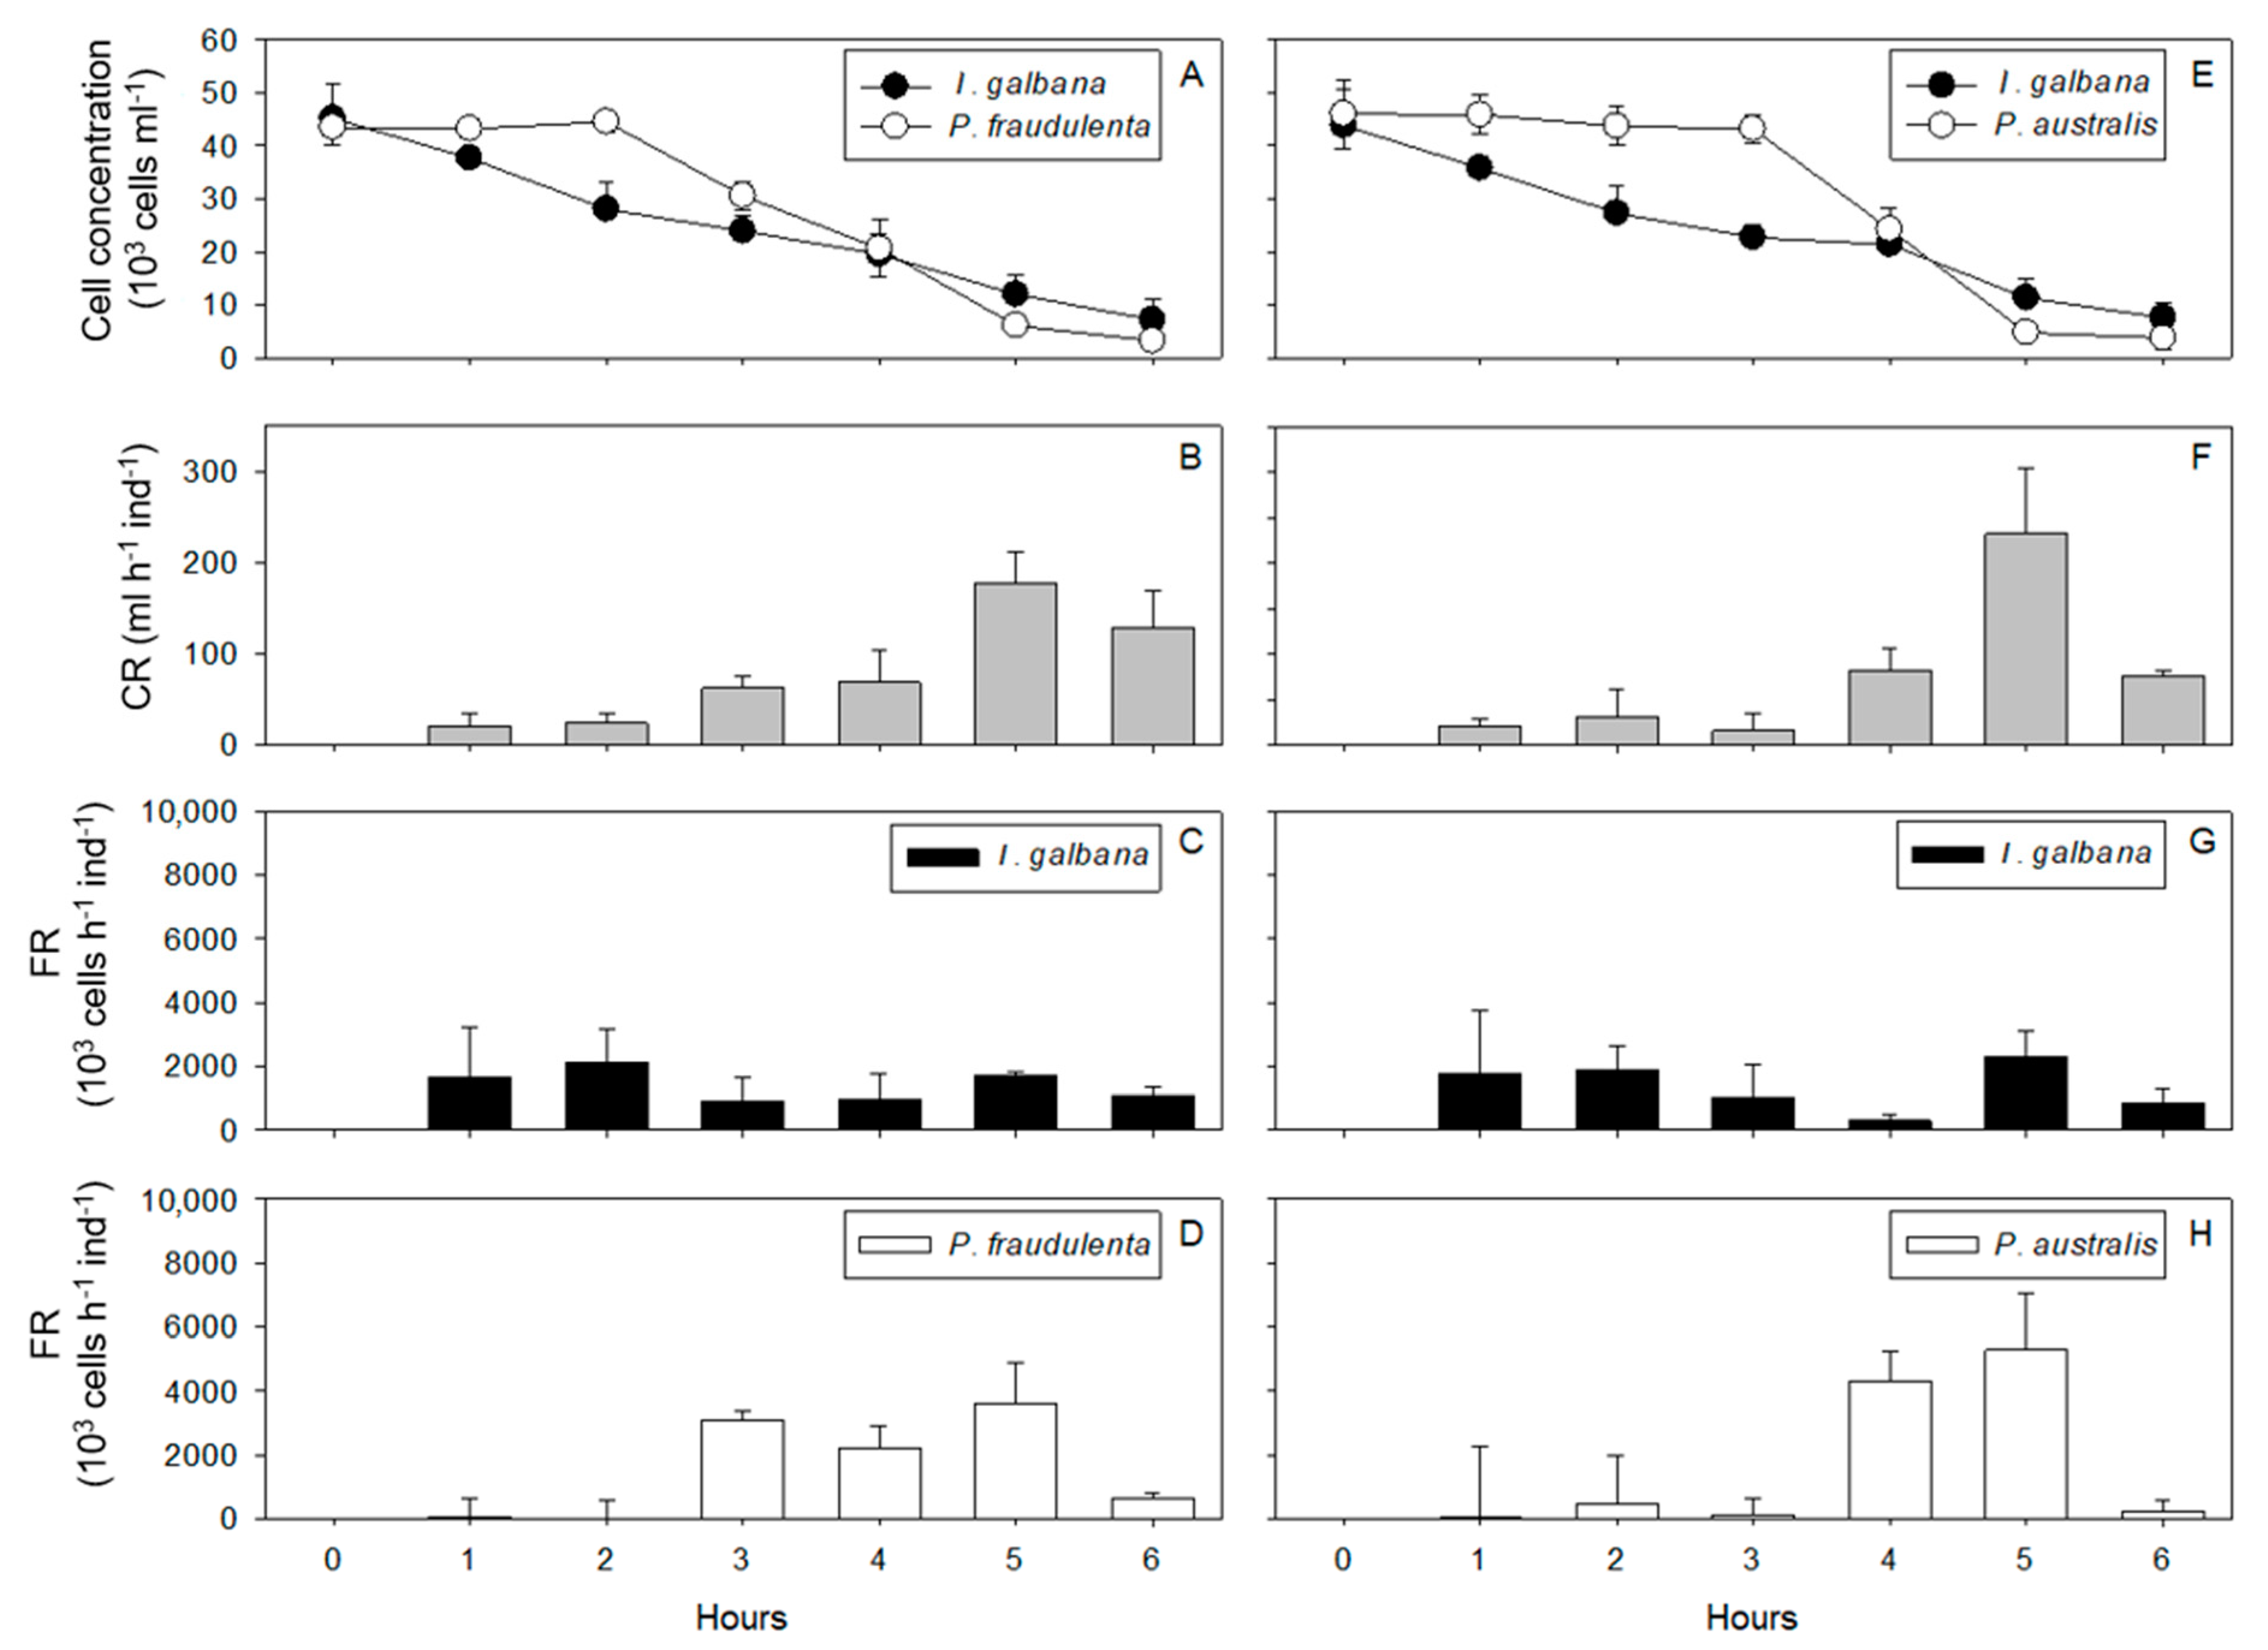
2.1.2. Pecten maximus

Condition 1: Juvenile scallops exposed to P. fraudulenta and I. galbana for 6 h. I. galbana cell concentrations decreased over time from 45.2 × 10³ cells mL−1 after 1 h to 7.2 × 10³ cells mL−1 after 6 h (Figure 3A). P. fraudulenta cell concentrations remained constant during the first 2 h with an average 43.7 × 10³ cells mL−1, and then the concentrations decreased until the end of the experiment when they reached 3.3 × 10³ cells mL−1 (Figure 3A). The CR of juvenile P. maximus was relatively constant during the first 4 h, between 20 ± 15 and 70 ± 35 mL h−1 ind−1. Then, it increased significantly to 180 mL h−1 ind−1 at T = 5 h and 130 mL h−1 ind−1 at T = 6 h (RM ANOVA, p < 0.01, Figure 3B). This increased CR coincided with cell concentrations of less than 18.5 × 10³ cells mL−1 in the culture medium (Figure 3A,B). The FR for I. galbana and P. fraudulenta did not show any significant difference throughout the 6 h of P. maximus exposure because variability among replicates was high. The FRs were between 900 × 103 ± 730 × 103 and 2140 × 103 ± 1050 × 103 cells h−1 ind−1 for I. galbana (Figure 3C) and between 0 ± 560 × 103 and 3600 × 103 ± 1300 × 103 cells h−1 ind−1 for P. fraudulenta (Figure 3D).
Condition 2: Juvenile scallops exposed to P. australis and I. galbana for 6 h. I. galbana cell concentrations decreased over time from 43.8 × 10³ cells mL−1 at the beginning of the experiment to 7.6 × 10³ cells mL−1 after 6 h (Figure 3E). P. australis cell concentrations remained constant during the first 3 h of exposure with an average 44.7 × 10³ cells mL−1, and then decreased to 3.8 × 10³ cells mL−1 after 6 h of exposure (Figure 3E). The CR of P. maximus was relatively constant during the first 4 h, between 16 ± 20 and 82 ± 24 mL h−1 ind−1, and then increased significantly to reach 230 mL h−1 ind−1 at T = 5 h (RM ANOVA, p < 0.05) and decreased significantly to 75 mL h−1 ind−1 at T = 6 h (RM ANOVA, p < 0.05, Figure 3F). The FR for I. galbana and P. australis did not show any significant difference throughout the 6 h of P. maximus exposure because of high variability among replicates. The FRs were between 290 × 103 ± 190 × 103 and 2300 × 103 ± 780 × 103 cells h−1 ind−1 for I. galbana (Figure 3G) and between 30 × 103 ± 2210 × 103 and 5280 × 103 ± 1760 × 103 cells h−1 ind−1 for P. australis (Figure 3H).

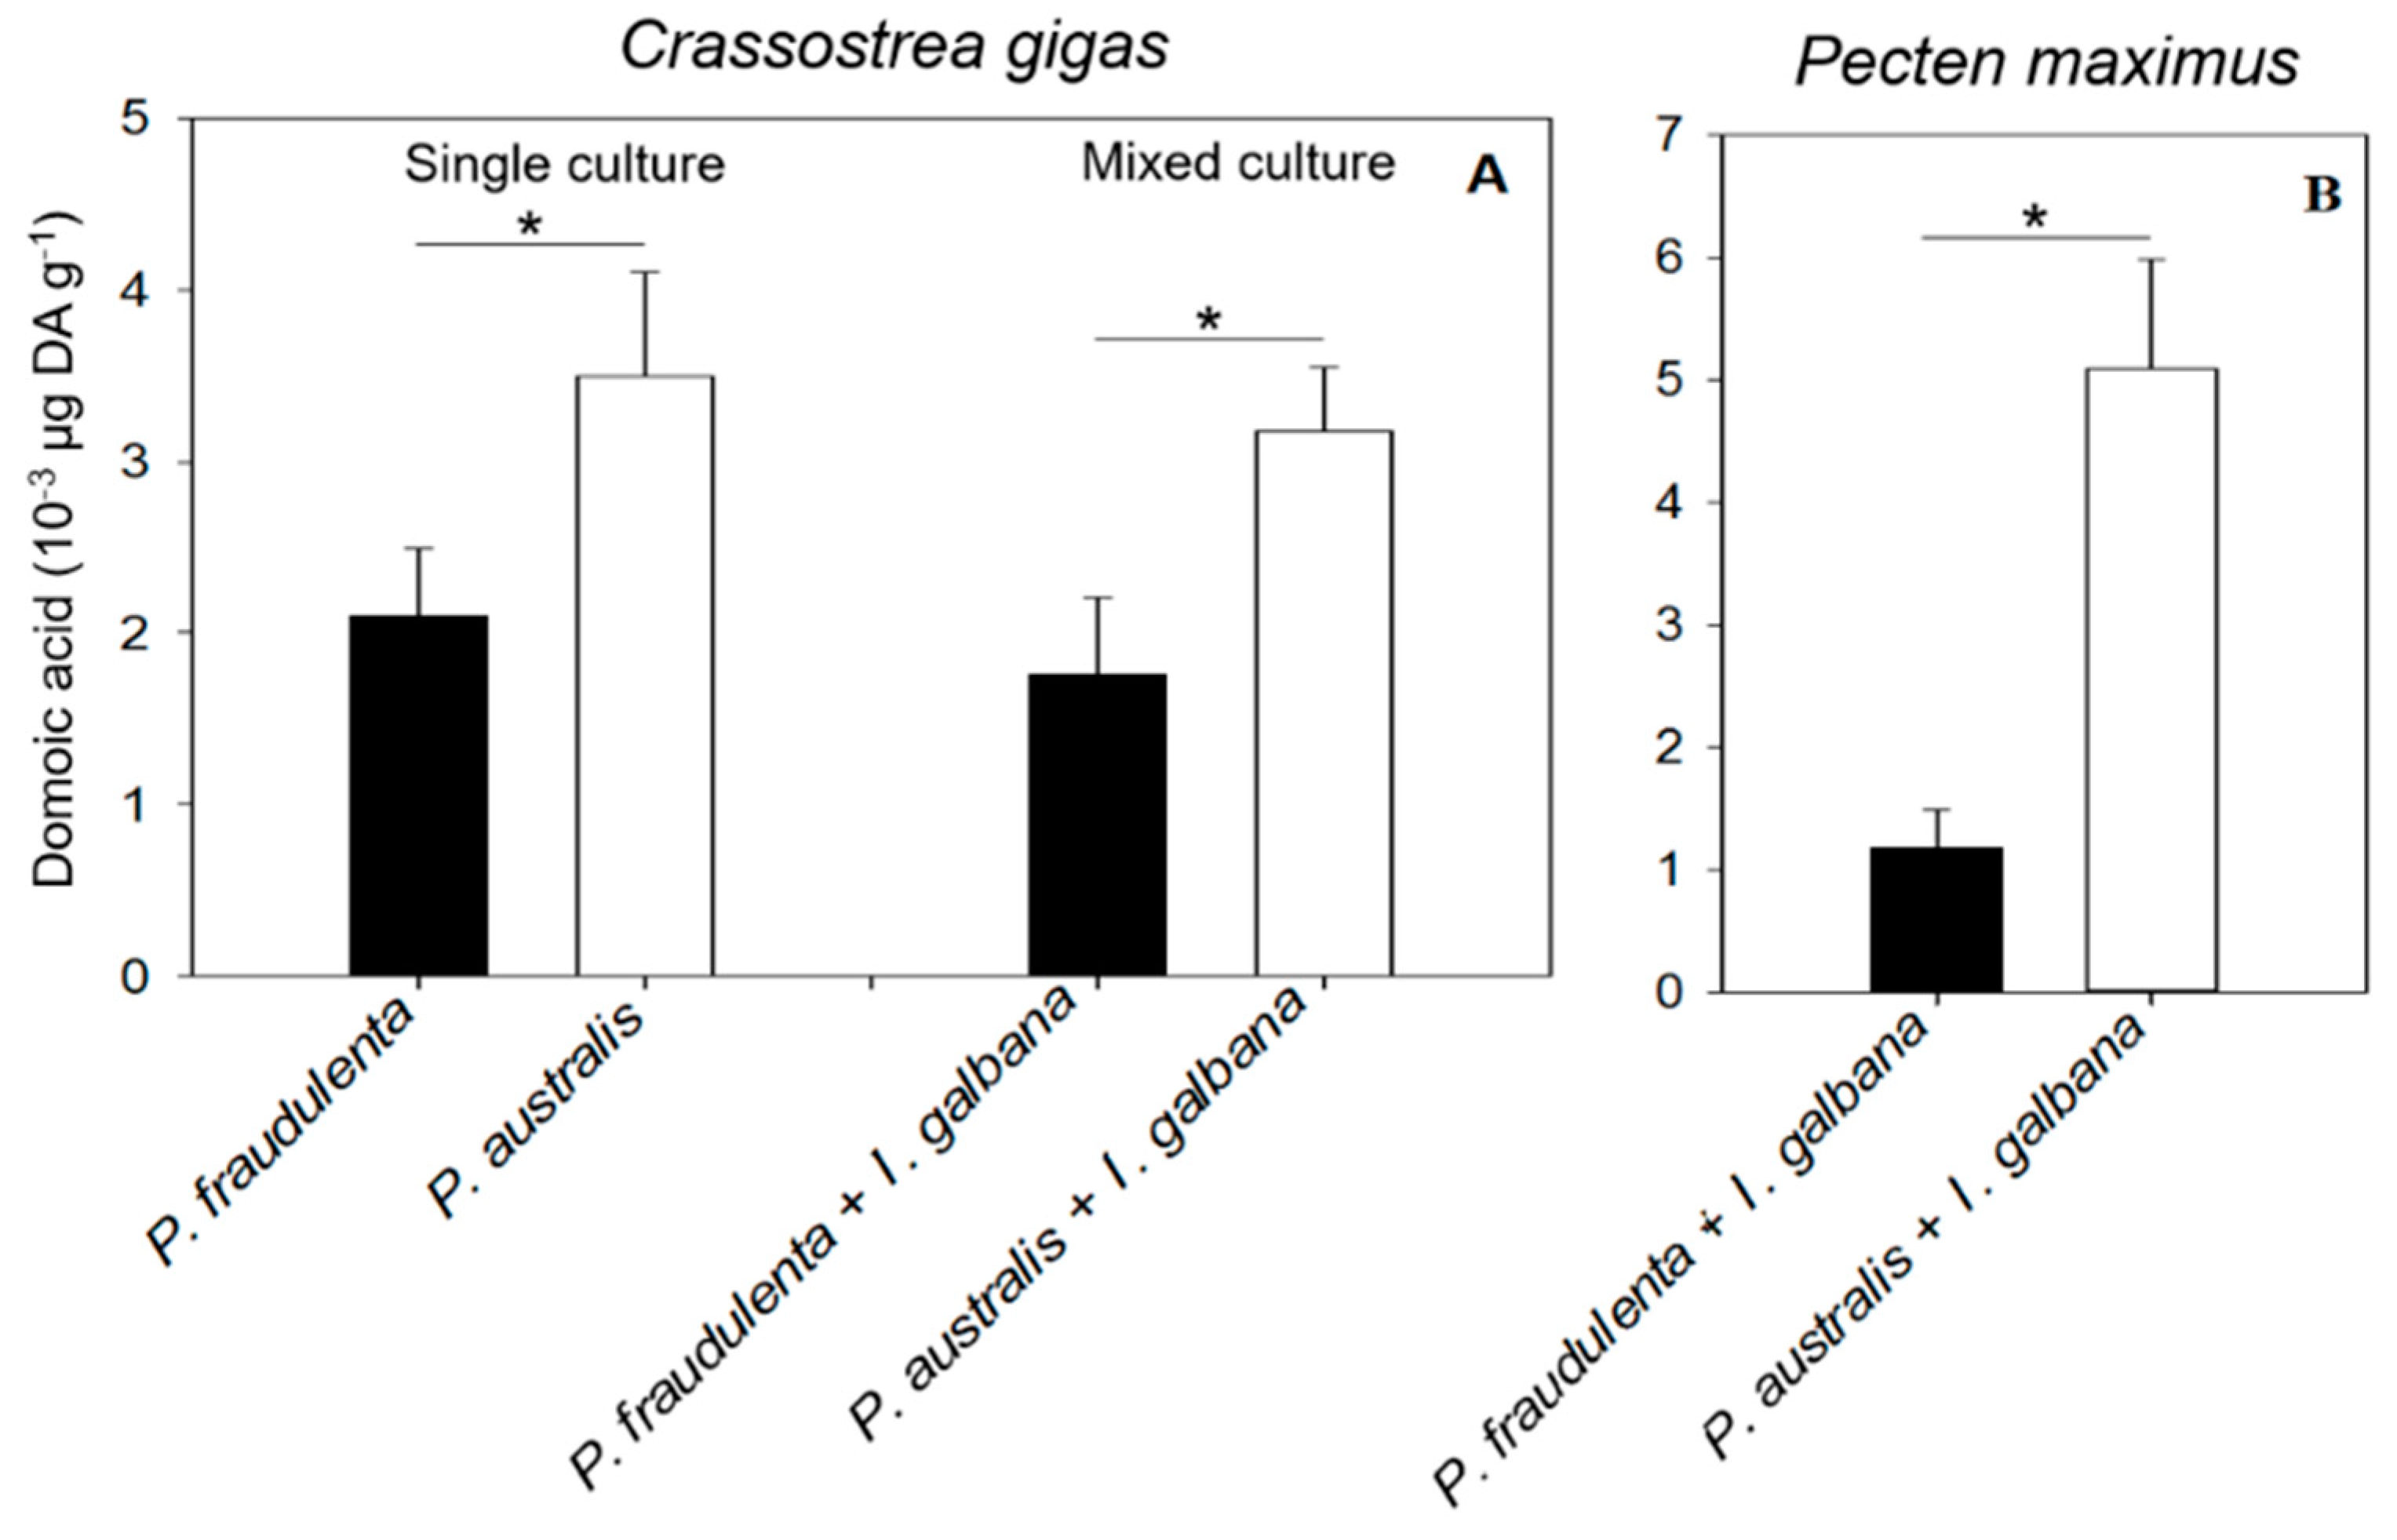
2.2. DA Accumulation in Crassostrea gigas and Pecten maximus

At the beginning of the experiment, the DA levels in the flesh tissues of all bivalves were below the detection limit of the ELISA method (data not shown). After 5 days of C. gigas exposure (Figure 4A) and 6 h of P. maximus exposure to Pseudo-nitzschia cells (Figure 4B), significant DA concentrations were measured in all the flesh tissues of the bivalves.
No significant differences were observed between the DA levels in C. gigas exposed to single Pseudo-nitzschia cultures and C. gigas exposed to mixed cultures of the two Pseudo-nitzschia species. In contrast, significant differences in DA accumulation were observed in C. gigas exposed to P. fraudulenta and P. australis. C. gigas exhibited significantly more DA when exposed to P. australis (0.32 × 10⁻³ to 0.35 × 10⁻³ µg DA g−1) than when exposed to P. fraudulenta (0.18 × 10⁻³ to 0.21 × 10⁻³ µg DA g−1; ANOVA, p < 0.05, Figure 4A). P. maximus DA levels were also significantly higher following exposure to P. australis than following exposure to P. fraudulenta, with 5.1 × 10⁻³ and 1.2 × 10⁻³ µg DA g−1 on average, respectively (ANOVA, p < 0.05, Figure 4B). No significant relationship was found between the weight of each bivalve species and its DA content (data not shown).

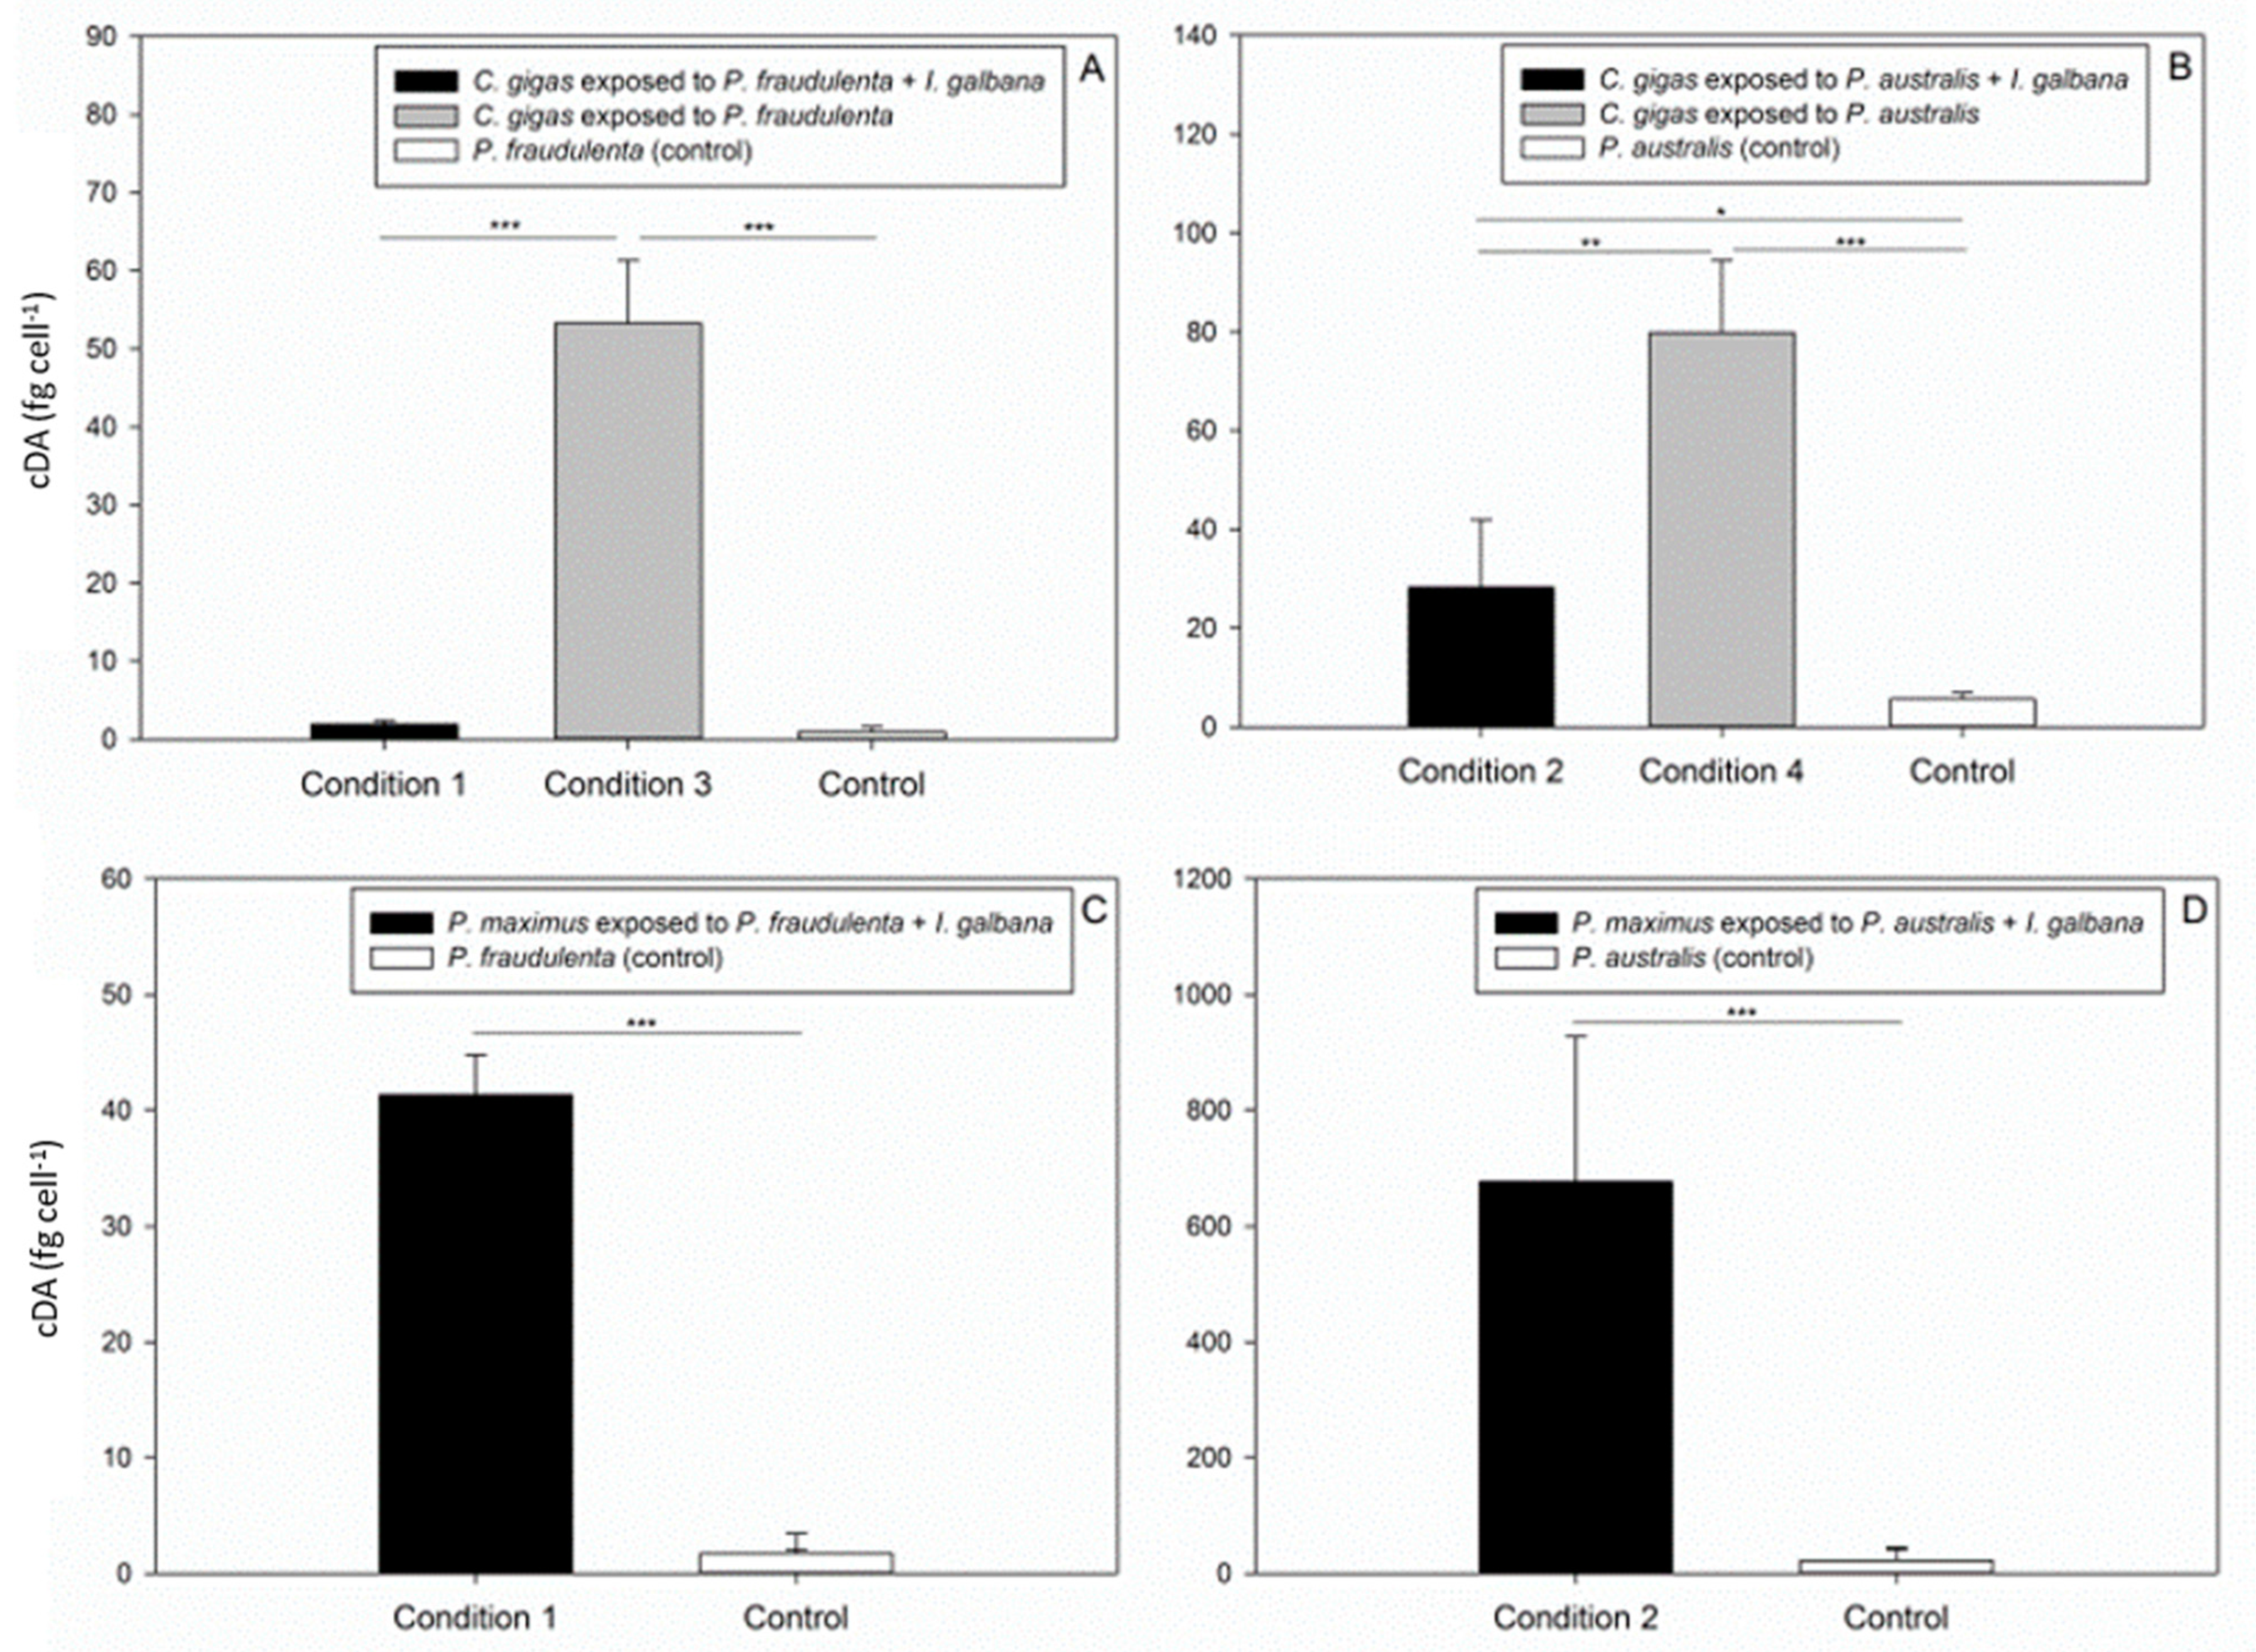
2.3. DA Concentrations in Pseudo-nitzschia Cells (cDA) and in the Medium (dDA), and Nutrient Concentrations

In the experiments with C. gigas, the initial cDA concentration in P. fraudulenta was 1.6 fg cell−1 (data not shown). At the end of the experiment (i.e., at T = 96 h), it was 0.9 fg cell−1 in the control, 1.9 fg cell−1 in P. fraudulenta in mixed culture in the presence of C. gigas, and 53.3 fg cell−1 in P. fraudulenta in single culture in the presence of C. gigas (Figure 5A), with average P. fraudulenta cell concentrations of 1.5 × 10⁵ cells mL−1, 5 × 10² cells mL−1, and 1 × 10³ cells mL−1, respectively. P. fraudulenta cDA was more than 58-fold higher than the control level when it was in single culture in the presence of C. gigas, and more than 28-fold higher than when it was in mixed culture (ANOVA, p < 0.001, Figure 5A). As far as P. australis is concerned, the initial cDA concentration was 4.2 fg cell−1 (data not shown). At the end of the experiment (i.e., at T = 120 h), the cDA concentration was 5.6 fg cell−1 in the control, 28.3 fg cell−1 when P. australis was in mixed culture in the presence of C. gigas, and 79.9 fg cell−1 when it was in single culture in the presence of C. gigas (Figure 5B), with average P. australis cell concentrations of 5.9 × 10⁴, 8 × 10³, and 8.5 × 10³ cells mL−1, respectively. The cDA concentration in P. australis was significantly different, i.e., 5-fold or 14-fold higher, when P. australis was in mixed culture (ANOVA, p < 0.05) or in single culture to C. gigas compared to the control, respectively (ANOVA, p < 0.001, Figure 5B).
In the presence of P. maximus, the initial cDA concentration in P. fraudulenta was 1.6 fg cell−1 (data not shown). After 6 h, it was 1.7 fg cell−1 in the control and 41.3 fg cell−1 when P. maximus was exposed to P. fraudulenta in mixed culture (Figure 5C) with a final P. fraudulenta cell concentration of 3.3 × 10³ cells mL−1. P. fraudulenta cDA was 24-fold higher than in the control condition when it was in the presence of P. maximus (ANOVA, p < 0.001, Figure 5C). The initial P. australis cDA concentration was 9.7 fg cell−1 (data not shown). After 6 h, it was 22.2 fg cell−1 in the control and 676.1 fg cell−1 in P. australis in mixed culture in the presence of P. maximus (Figure 5D), with a final P. australis cell concentration of 7.6 × 10³ cells mL−1. P. australis cDA was significantly different and more than 30-fold higher than in the control after 6 h in the presence of P. maximus (ANOVA, p < 0.001, Figure 5D).
When C. gigas and P. maximus were exposed to P. fraudulenta, dDA concentrations at the beginning and at the end of the experiment were not significantly different in the control and in all the conditions tested (Supplementary Table S1). During exposure to P. australis, the dDA concentrations in all treatments with or without C. gigas were not significantly different from each other either (Supplementary Table S1). In contrast, when P. maximus was exposed to P. australis, the dDA concentrations were significantly higher at the end of the experiment compared to the beginning or to the control, with 4.13, 2.15, and 2.33 pg mL−1, respectively (ANOVA, p < 0.05, Supplementary Table S1).
The nutrient measurements revealed relatively stable nitrate and phosphate concentrations throughout all experiments (Supplementary Table S2). In contrast, the silicate concentrations significantly decreased in all but one condition between the beginning and the end of the experiments (ANOVA, p < 0.05, Supplementary Table S2): when C. gigas was exposed to P. australis (condition 4), the silicate concentration was significantly lower in the control compared to the silicate concentration measured at the end of the experiment (Supplementary Table S2). However, the final silicate concentrations under the other conditions were not significantly different from those in the control condition. In addition, nutrients (nitrate, phosphate, or silicate) were constantly available at high concentrations in the culture medium and they were never depleted at the end of the experiments. At that time and in all conditions, the minimum concentrations of nitrate, phosphate, and silicate were 117, 7, and 32 µmol L−1, respectively (Supplementary Table S2).

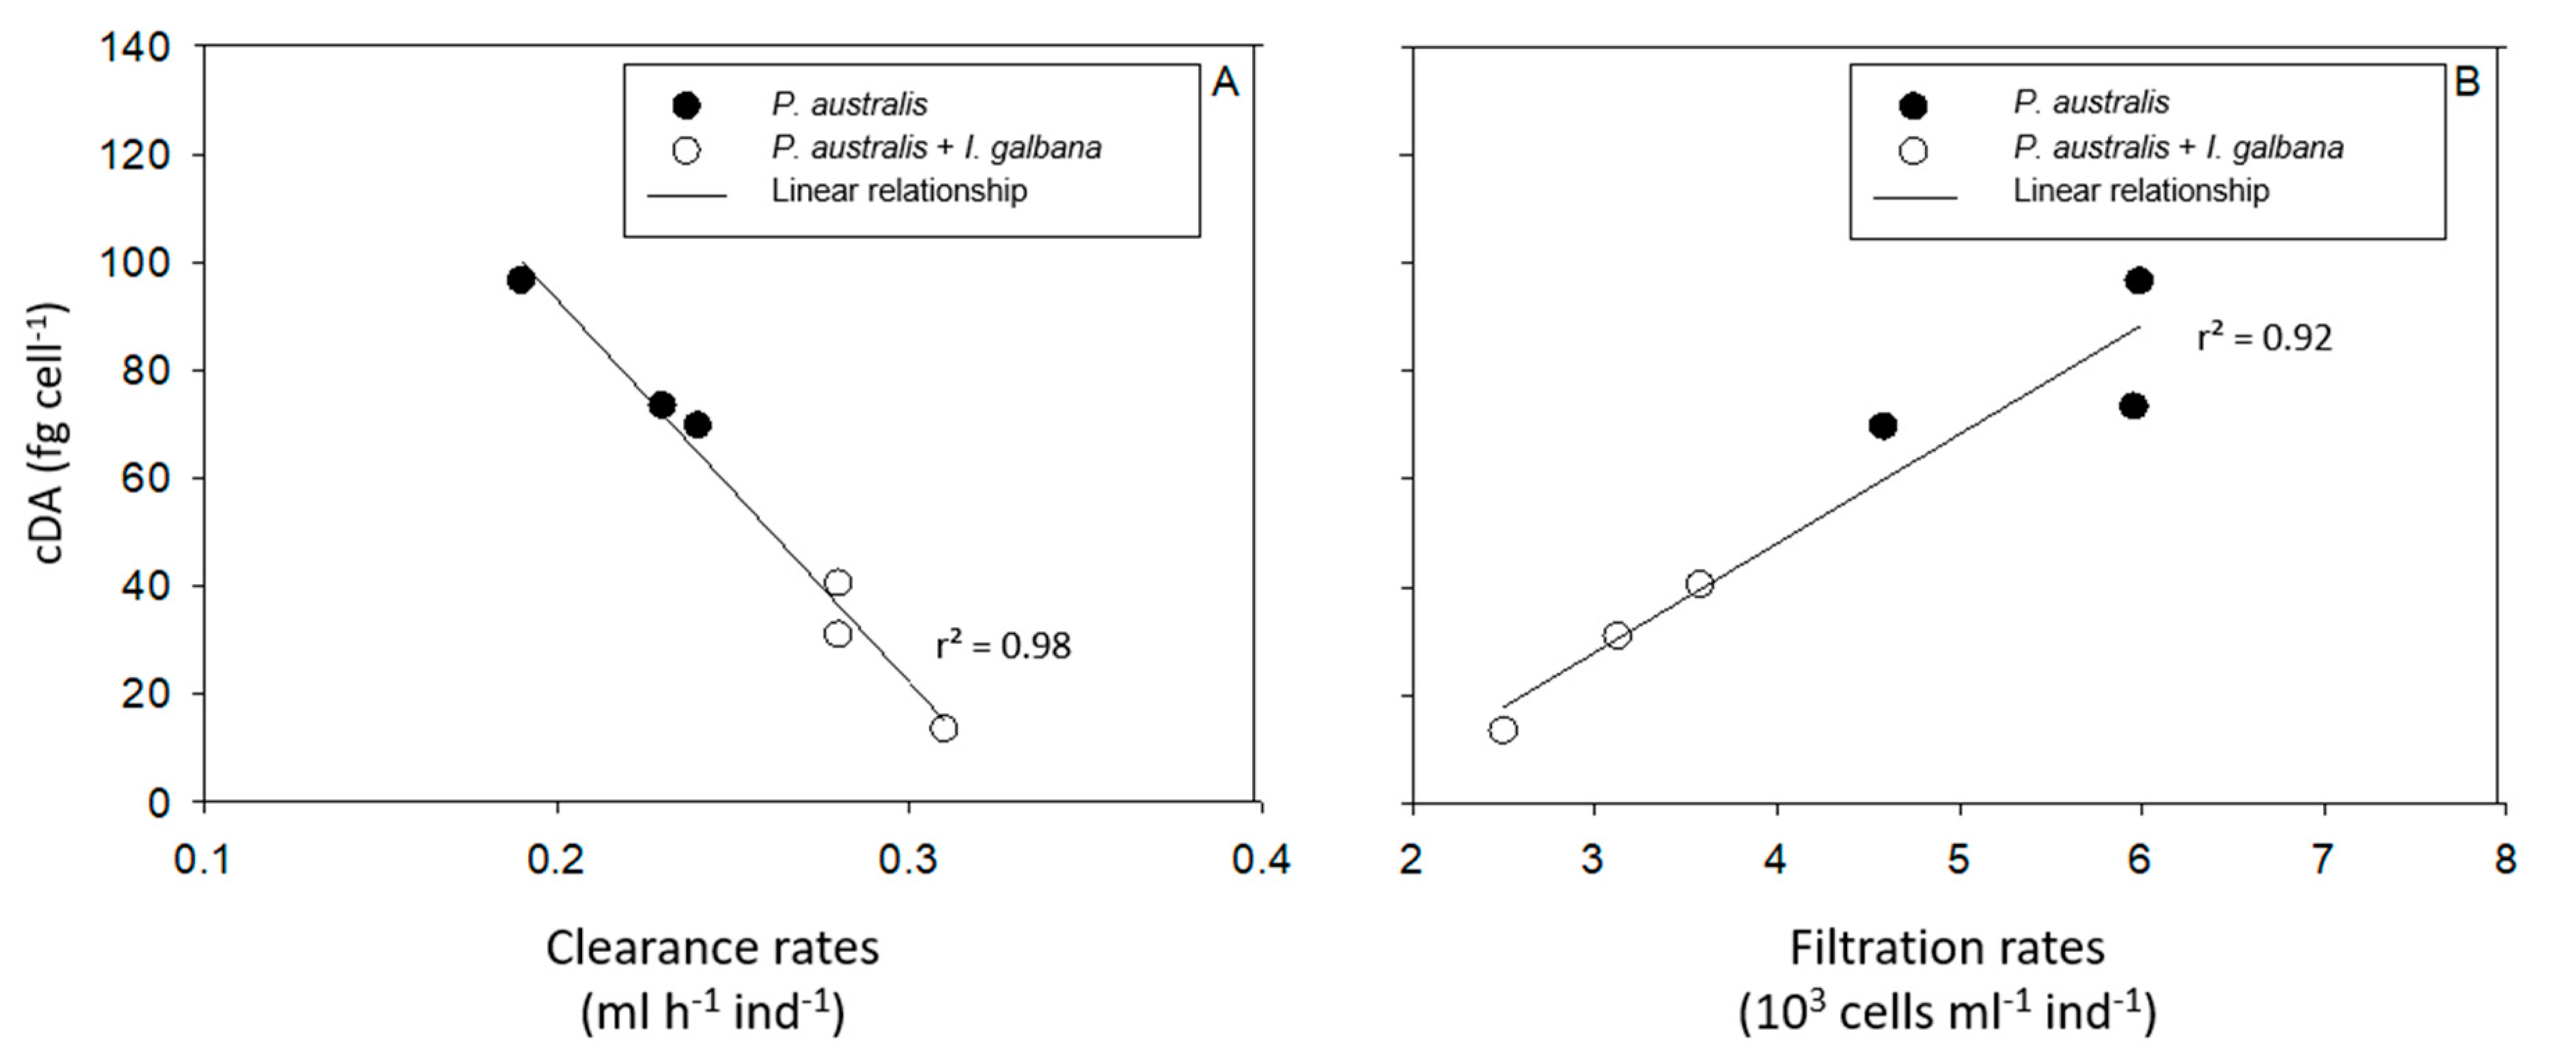
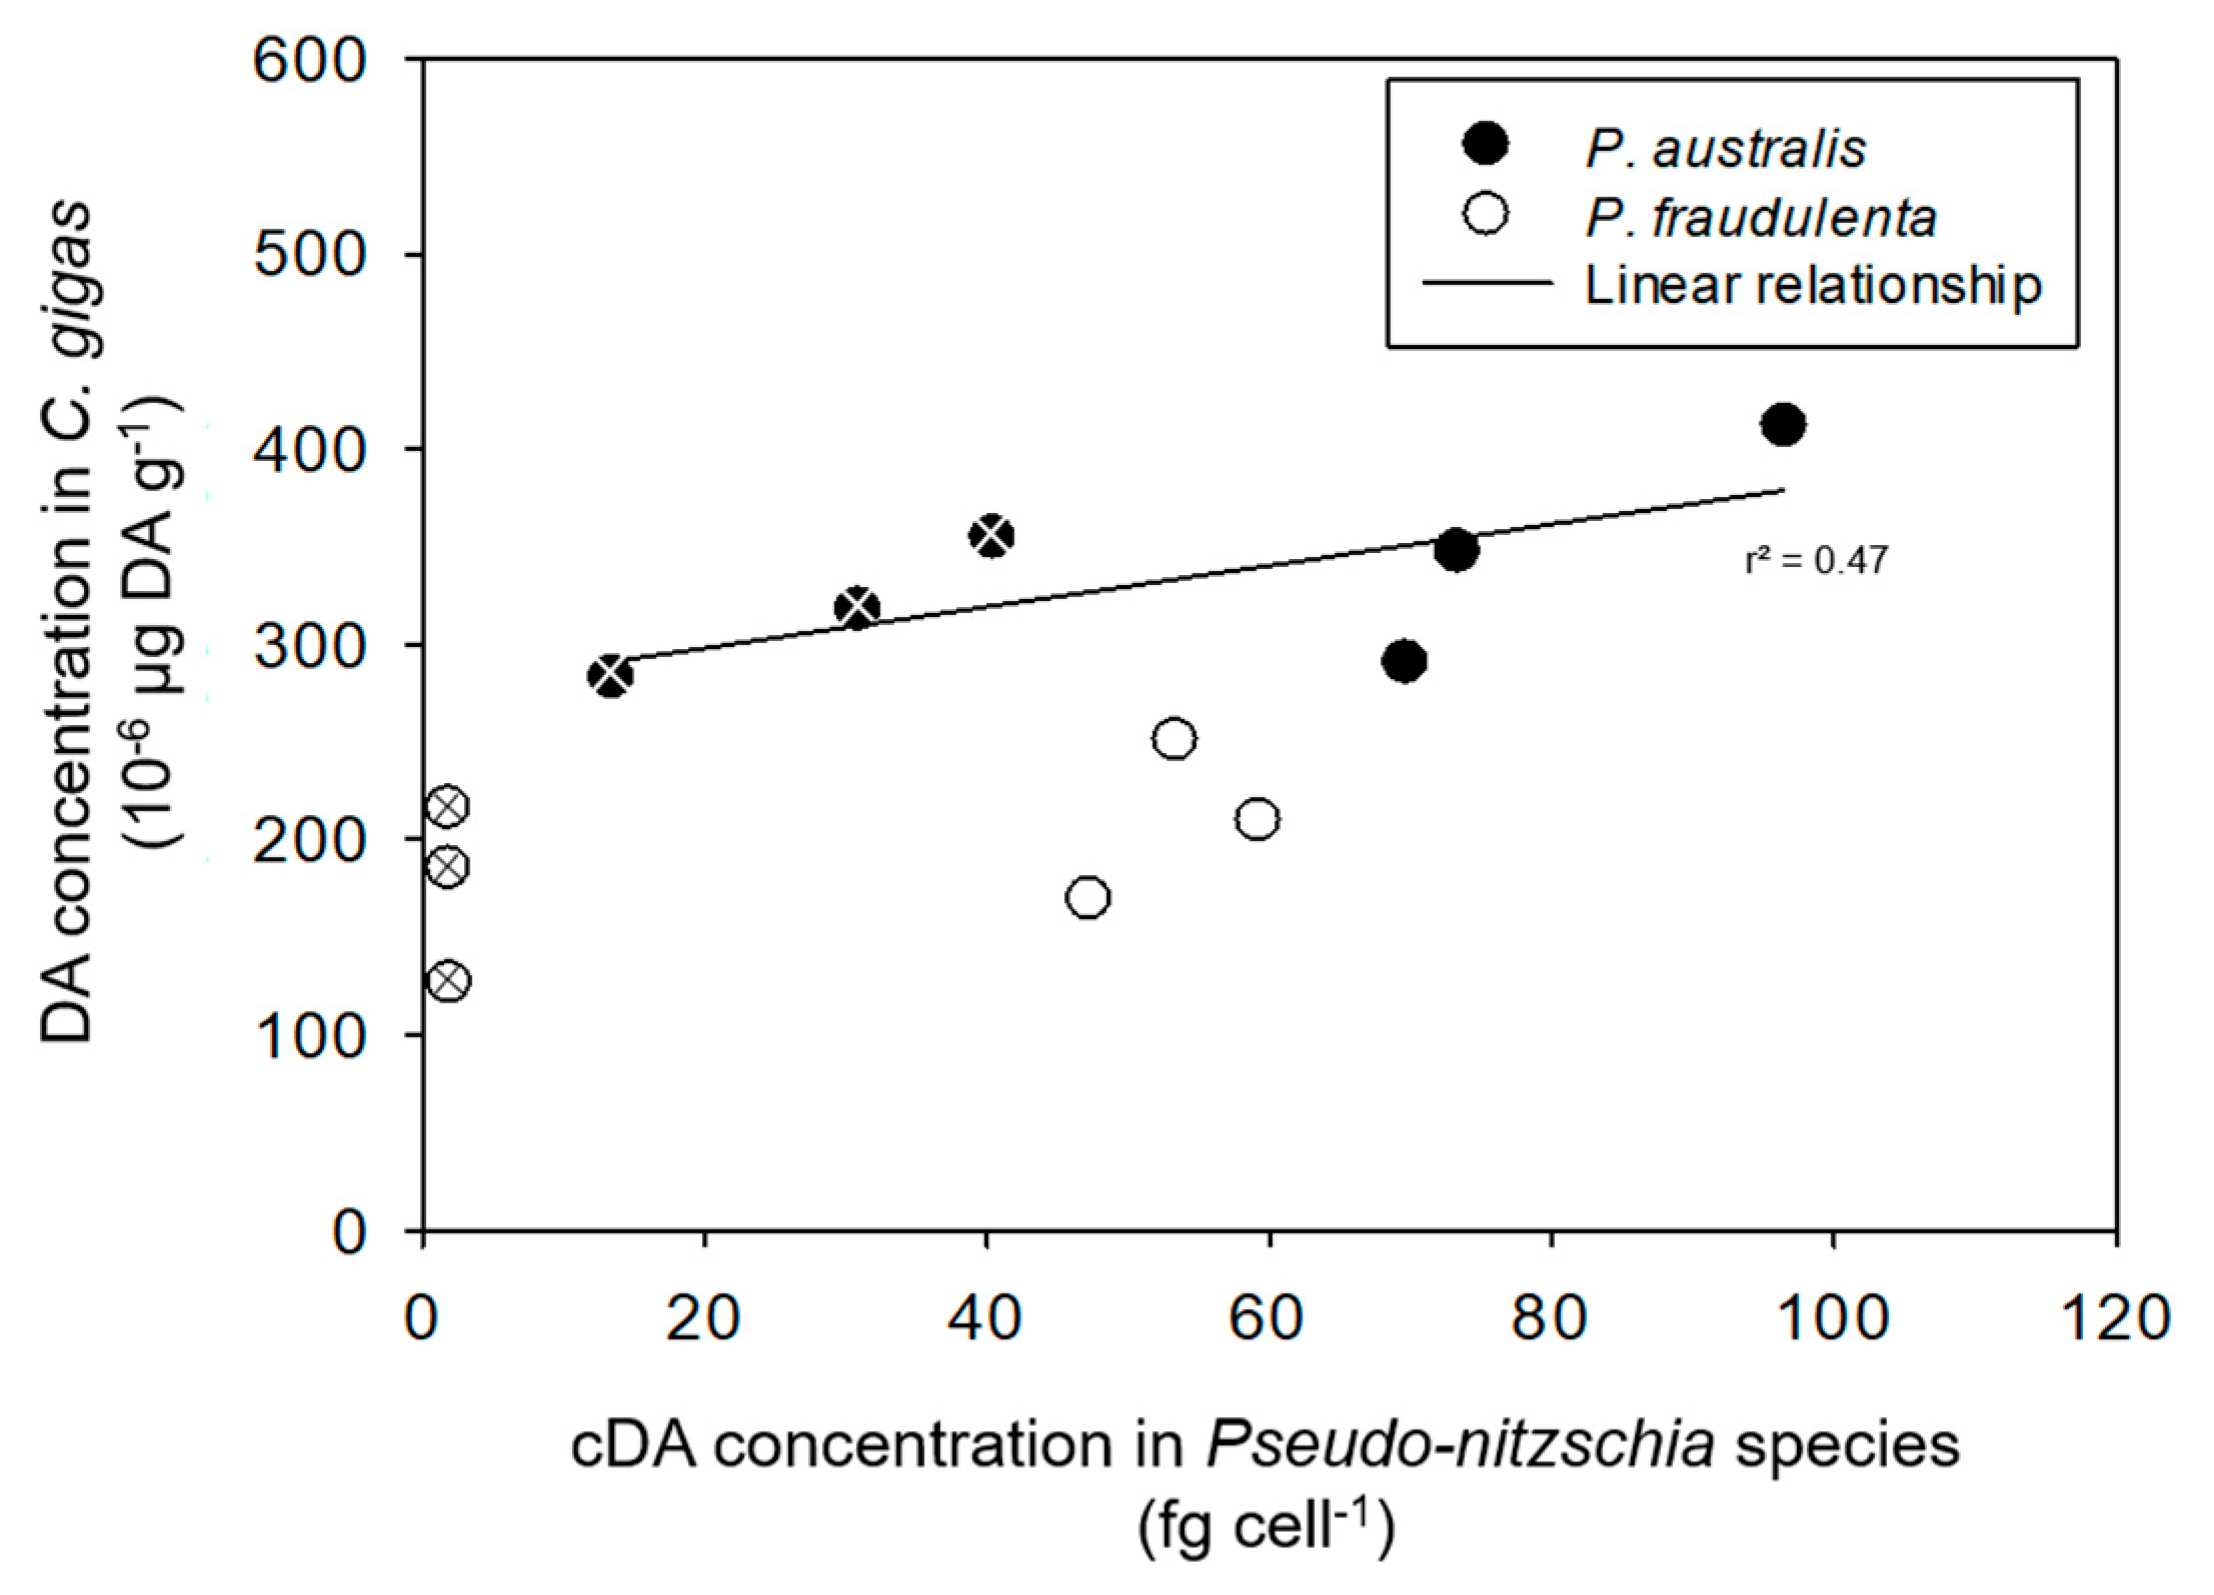
2.4. Potential Relationship between cDA Concentrations in P. australis and P. fraudulenta on the One Hand, and the CR, the FR, and DA Accumulation in Bivalve Species on the Other Hand

Figure 6 and Supplementary Figure S1 present the relationships between the cDA concentrations in P. australis (Figure 6) and P. fraudulenta (Supplementary Figure S1) and the average CR and FR of C. gigas throughout the 5 days of the experiment. The results show no relationship between P. fraudulenta cDA concentrations and the CR or FR of C. gigas (Supplementary Figure S1). In contrast, P. australis cDA concentrations present linear relationships with the CR (r2 = 0.98; CR = −709 cDA + 235; Figure 6A) and the FR (r2 = 0.92; FR = 0.0202 cDA − 33; Figure 6B) of C. gigas.
As far as C. gigas DA concentrations at the end of the experiment are concerned, no relationship was found with their FR of any of the Pseudo-nitzschia species (data not shown). In contrast, Figure 7 shows a linear regression between C. gigas DA concentrations and P. australis cDA concentrations at the end of the experiment (r2 = 0.47; C. gigas cDA concentration = 1.06 P. australis cDA concentration + 277.11). In contrast, no significant relationship was found for P. fraudulenta. As for P. maximus, only one experiment was performed, so that data are not sufficient to allow us to explore any relationship.

3. Discussion

3.1. Feeding Responses of the Bivalves Exposed to Pseudo-nitzschia Species

The feeding behavior of bivalves is generally dependent on the phytoplankton species available [27,49]. Our results confirm this observation: the two studied bivalves filtered the haptophyte I. galbana rather than the two Pseudo-nitzschia species. These results confirm the preference observed in juvenile Crassostrea virginica oysters by [24] and [26]. These studies report that C. virginica filtered other microalgal species (Ditylum brightwellii, Thalassiosira weissflogii, I. galbana) rather than Pseudo-nitzschia (P. delicatissima and P. multiseries). Nevertheless, when C. virginica was exposed to toxic P. multiseries and non-toxic P. delicatissima, their clearance rates were lower than when they were exposed to other diatoms, but similar for both Pseudo-nitzschia species regardless of their toxin level [26]. Our observation that C. gigas rather fed on the smaller I. galbana cells than on the large, needle-shaped Pseudo-nitzschia, regardless of their toxin content, is also consistent with more general observations indicating that filtration by bivalves is influenced by the physical aspects of the microalgae, i.e., size, density, electric charge, and morphology [49,50]. The preferential choice of some microalgae suggests that bivalves possess mechanisms in their gills and/or labial palps that select algal species based on cell size and/or morphology [25,49]. However, the selection of microalgae may also depend on a chemosensory response to food stimuli on the gills and labial palps of bivalves [49,51]. The mechanism potentially involved in the chemosensory detection of toxic cells by bivalves remains to be determined [31].
The present study also demonstrates changes in the clearance and filtration rates of bivalves fed on distinct Pseudo-nitzschia species. Decreased clearance rates of bivalves (oysters, mussels, clams, scallops) have been reported following exposure to the toxic dinoflagellates Alexandrium spp. and Karenia brevis [29,32,33,52,53]. However, clams (Mulinia edulis) and mussels (Mytilus chilensis) filtered Alexandrium catenella—a producer of paralytic shellfish toxin (PST)—and Alexandrium affine—a non-producer of PST—at similar rates [33]. We observed lower clearance rates when C. gigas was exposed to the most toxic species P. australis compared to the less toxic P. fraudulenta. As both Pseudo-nitzschia species had similar morphologies and cell sizes, the lower clearance rate for P. australis is attributable to its higher cellular DA content. Therefore, DA affected the feeding behavior of C. gigas, as already shown for paralytic shellfish toxins produced by the dinoflagellate Alexandrium tamarense [27]. These results confirm that the feeding response to diverse microalgae is species-specific in bivalves, since DA did not affect another oyster species (C. virginica) that filters toxic and non-toxic Pseudo-nitzschia at similar rates [24,25,26]. Moreover, oysters are more sensitive than other bivalves to phycotoxin-producing microalgae [54]. This is supported by our results: the presence of either Pseudo-nitzschia species did not affect the clearance or filtration rates of P. maximus. Consequently, DA did not affect the feeding behavior of scallop, as opposed to recent results about Alexandrium minutum and PST [55]. The presence of Pseudo-nitzschia cells affected the feeding behavior of C. gigas more than that of P. maximus. However, our experiments with P. maximus were shorter than those with C. gigas, and the response of P. maximus over more than a few hours will have to be investigated to confirm our results. Furthermore, to really grasp the real impact of Pseudo-nitzschia on the feeding dynamics of C. gigas and P. maximus, further studies are needed to precisely explore the pre-ingestive feeding processes (e.g., rejection of cells in the pseudofeces). These processes may also influence the ingestion of Pseudo-nitzschia cells beyond filtration, as shown for the oyster C. virginica by [25].

3.2. DA Accumulation in the Bivalves

C. gigas and P. maximus both retained DA when fed on toxic P. australis or P. fraudulenta cells. The maximum DA concentrations accumulated by C. gigas and P. maximus were measured when they were exposed to P. australis. The duration of exposure, the experimental conditions, the bivalve species, and bivalve size vary across studies, so that it is difficult to compare our DA accumulation results with literature data. However, the maximum DA concentrations accumulated by oysters (0.35 × 10⁻³ µg g−1 after 5 days of exposure) and scallops (5.1 × 10⁻³ µg g−1 after 6 h of exposure) in the present study are lower than the maximum DA levels measured in previous studies with various bivalves during exposure to Pseudo-nitzschia under controlled conditions: a maximum of 22.8 µg g−1 was recorded for the oyster C. virginica after 14 days of exposure to P. multiseries [23], and 3.1 × 10³ µg g−1 in the digestive gland of the Atlantic sea scallop Placopecten magellanicus after 22 days of exposure to P. multiseries [56]. The lower toxin accumulation measured in our study probably resulted from the shorter exposure times, the single supply and non-renewal of toxic Pseudo-nitzschia, and the lower DA concentration in Pseudo-nitzschia. The P. multiseries strains used in [56] and [23] produced 1000 times more DA than P. australis and P. fraudulenta did in this study (up to 6.67 pg cell−1 [56]; up to 9.8 pg cell−1 [23]). The two bivalve species were also exposed to a continuous supply of P. multiseries, whereas no P. australis or P. fraudulenta were added after the beginning of the experiments in our study, hence a very low number of toxic cells per bivalve. Furthermore, toxic cell ingestion by oysters mostly occurred in the first three days of exposure, but we measured DA contents after five days; therefore, toxin depuration may have been ongoing within oyster tissues when the measurements were made. The authors of [57] indeed highlight that C. gigas accumulate DA within a few hours and start depurating it immediately: oysters contaminated up to 36.3 µg g−1 of DA had fully depurated it after 120 h. Our oysters may have been more contaminated at the beginning of our experiment than after 5 days, when samples were taken for DA measurements. Finally, the present study was performed with oyster spat and juvenile scallops, whereas most of the literature data relate to adult bivalves.
The different levels of DA accumulation by the two bivalves may partly result from differences in clearance and filtration rates. P. maximus filtered more toxic Pseudo-nitzschia cells than C. gigas did: 16 × 105 cells h−1 ind−1 or 16 × 105 cells h−1 g−1 versus 3.7 × 10³ cells h−1 ind−1 or 2 × 10⁵ cells h−1 g−1 on average, respectively. The authors of [23] obtained similar results with juvenile oysters (C. virginica), which accumulated 3–75 times less DA than juvenile mussels (Mytilus edulis) did, while the CRs of oysters were 7.4–8.5 times lower than those of mussels. The different DA accumulation rates of the two bivalves could also be linked to differences in gill anatomy and in the sorting system of digestive particles. The size of the gill filaments may be a physical limitation to the selection of micro-algal particles based on their cell size [58]. Scallops have larger branchial filaments (200 µm [59]) compared to oysters (<70 µm [25]) allowing easier ingestion of longer cells like Pseudo-nitzschia. The selective rejection of Pseudo-nitzschia based on size may be another explanation for the differences in DA accumulation in our study given the mean size of P. australis cells (52 µm). This hypothesis stresses once more the need to complete the present study with further observations, e.g., pseudofeces formation, as in [25,26], to determine whether the differences in DA concentrations in the bivalves are linked to differences in Pseudo-nitzschia ingestion. In addition, the differential DA accumulation by oysters and scallops may also be explained by differential DA metabolism and degradation by intestinal bacteria during toxin accumulation [60]. Therefore, to better comprehend the differences in DA accumulation, it would be interesting to investigate the ways C. gigas and P. maximus ingest Pseudo-nitzschia and degrade DA. DA accumulation by C. gigas exposed to P. australis was also correlated to cDA concentrations in P. australis. To our knowledge, this is the first time that a relationship between toxin accumulation by bivalves and the toxin content per microalgal cell is highlighted. Thus, beyond all the processes likely to occur in C. gigas exposed to P. australis (altered feeding behavior, possible rejection in the pseudofeces, metabolization of DA in the digestive tract), DA accumulation seems greatly influenced by the toxin content of the algal cells. This suggests that the toxin content of Pseudo-nitzschia cells is critical for determining the toxin content of C. gigas in situ, besides the extent of the Pseudo-nitzschia bloom itself.

3.3. Induction of DA Production in Pseudo-nitzschia in the Presence of Bivalves

During the different co-exposure experiments, the cellular DA content of P. australis and P. fraudulenta in the exponential growth phase without any nutrient limitation increased 14- and 58-fold, respectively, in the presence of C. gigas, and 30- and 24-fold in the presence of P. maximus compared to the bivalve-free control. In the literature, the increase in cDA is mainly related to changes in environmental factors, especially nutrient availability (reviewed in [1,2]). Most Pseudo-nitzschia species significantly increase their cDA content in the stationary phase under silicate or phosphate limitation [45,61,62,63,64,65,66]. In the present study, given that nitrate, phosphate, and silicate were replete at the end of our experiments, it is unlikely that changes in cDA in P. australis and P. fraudulenta were related to nutrient concentrations. The experiments were performed in a controlled environment, so that no other parameter (e.g., temperature or light intensity) varied during exposure. Therefore, the observed increase in cDA was related to the presence of the bivalves. This suggests that filter-feeding bivalves can stimulate toxin production by P. australis and P. fraudulenta.
To our knowledge, these are the first results showing that DA production by Pseudo-nitzschia can increase in the presence of filter-feeding bivalves. The presence of bivalves induced an increase in Pseudo-nitzschia cDA up to 58-fold in C. gigas within 5 days and up to 30-fold in P. maximus within only 6 h. Similar results for PST production in the dinoflagellate Alexandrium fundyense were obtained in the presence of Mytilus edulis and Mya arenaria [67]. Increased toxin production by Pseudo-nitzschia in the presence of primary consumers other than bivalves has been reported in the literature: DA production increased or was induced in some Pseudo-nitzschia species in the presence of herbivorous copepods [17,18,20,21,68]. Furthermore, only 2 h of exposure to copepods resulted in a cDA increase in P. seriata [18,20]. Our results show that Pseudo-nitzschia can increase their toxin production not only in the presence of copepods, but also when exposed to other primary consumers like bivalves. We also confirm that exposure times in the range of a few hours are sufficient to influence DA production. Complex interactions have already been shown between primary consumers and toxin-producing phytoplankton, mainly between copepods and Pseudo-nitzschia or between bivalves and dinoflagellates. Some dinoflagellates can increase their toxin production in the presence of copepods and bivalves, and diatoms react to the presence of copepods through different morphological and biochemical defense strategies. However, the relationship between toxin production and grazing or filtration by bivalves is still poorly understood [69,70], and not fully explored for Pseudo-nitzschia. The relationships observed in this study between the clearance rates of oysters and Pseudo-nitzschia cDA contents, and also between filtration rates and cDA contents, suggest complex interactions probably mediated by chemical communication. The feeding-related cues may be metabolites released by the bivalves upon filtration or ingestion of Pseudo-nitzschia cells. DA may also act as a chemical cue, although dDA concentrations did not significantly vary during our experiments. Metabolites excreted by grazers can warn harmful algae of their presence [67]. For example, primary consumers such as copepods excrete copepodamides, a group of polar lipids that induce and/or stimulate the production of paralytic shellfish toxins by Alexandrium and DA production by Pseudo-nitzschia [69,71]. The reciprocal influence between P. fraudulenta/P. australis and C. gigas/P. maximus observed in the present study shows that further metabolomics studies are needed to explore the mechanisms and the chemical cues associated with the stimulation of DA production and the alteration of the feeding behavior during bivalve/Pseudo-nitzschia interactions.

4. Conclusions

This study characterizes the interactions between filter-feeding bivalves and two Pseudo-nitzschia species. C. gigas and P. maximus were able to feed on P. australis and P. fraudulenta and accumulate DA in their tissue, even during short-term exposure. Furthermore, the presence of bivalves induced an increase in cDA content in both Pseudo-nitzschia species, suggesting that DA production by Pseudo-nitzschia could be a grazer-deterrent mechanism. This is also supported by the facts that (1) both bivalves preferentially filtered the non-toxic I. galbana and (2) the presence of the most toxic P. australis affected the clearance rate of C. gigas. However, the influence of Pseudo-nitzschia on the feeding behavior was bivalve-specific: C. gigas was more affected than P. maximus was. These results will help to better understand the biotic factors that control DA production by Pseudo-nitzschia and bivalve contamination during Pseudo-nitzschia blooms. These findings are a first step before further studies on the feeding behavior of bivalves and their metabolism when exposed to toxic Pseudo-nitzschia, and also on the chemical communication underlying the interactions between bivalves and toxic diatoms.

5. Materials and Methods

5.1. Organisms

5.1.1. Phytoplankton Cultures

Three species of microalgae were tested: two species belonging to the genus Pseudo-nitzschia and one species belonging to Prymnesiophyceae, Isochrysis galbana. By using the two Pseudo-nitzschia species, we tested two algae with similar shapes and sizes but different DA contents. By adding I. galbana, we also compare the interactions of the bivalves the two DA-producing species on the one hand and one non-producer on the other hand.
Pseudo-nitzschia cultures. Two species of Pseudo-nitzschia were used: P. australis (P6B3) and P. fraudulenta (PNfra 12). P. australis strain P6B3 is a known toxic strain [45,46], while PNfra 12 is less toxic (unpublished data). Strain P6B3 was isolated from the West Finistère coast of France (Brittany, Atlantic coast) in April 2014, and strain PNfra 12 was isolated from the Bay of Seine (Normandy, English Channel) in August 2011. To establish monoclonal strains, single cells were isolated using a micropipette, washed three times with filter-sterilized seawater, and incubated in 4-well culture plates in K/2-medium [72] enriched in Si(OH)4 (54 µmoL L−1) at a temperature of 16 °C, an irradiance of 30 µmoL photons m−2 s−1, and a 14 h:10 h light:dark (L:D) cycle. When the clonal culture was established, it was maintained in 50 mL ventilated plastic flasks (Falcon®, Corning Life Sciences, Tewksbury, MA USA) in K/2-medium + Si(OH)4 in the same conditions. Strain P6B3 was identified using sequencing of the gene ITS1-5.8S-ITS2. This strain had identical sequences to P. australis strains from [45]. Strain PNfra 12 was identified from measurements of frustule properties by transmission electron microscopy (TEM). For TEM observations, culture samples were cleaned up to remove organic material according to the method of [73], except that 2 mL of hydrochloric acid were used in addition to sulfuric acid [44]. Drops of cleaned material were placed on grids and studied in a JEOL-1010 (Jeol, Tokyo, Japan) electron microscope operating at 100 kV. For morphometric measurements, the length and width of the valves were measured, together with the densities of their striae, fibulae, and poroids, the number of rows of poroids, and the absence/presence of a central interspace. A minimum of 10 cells was measured for each strain. For cell length, each strain was observed before each experiment under a Nikon Eclipse 80i light microscope equipped with a Nikon DS-Ri2 camera, and 20 cells were measured (length in µm) using NIS-Elements Imaging Software. Cell length was calculated as the mean ± standard deviation of these 20 cells. Cell length was 52 ± 2.5 µm for P6B3, and 47 ± 1 µm for PNfra 12.
Isochrysis galbana cultures. The non-toxic flagellate I. galbana (AC34) was obtained from the Algobank-Caen culture collection of the University of Caen Normandy. This species is routinely used as a food source for bivalves. AC34 was cultured in K/2-medium enriched in Si(OH)4 (54 µmoL L−1) at a temperature of 16 °C, an irradiance of 30 µmol photons m−2 s−1, and a 14 h:10 h L:D cycle.

5.1.2. Juvenile Filter-Feeding Bivalves

One-year-old juvenile scallops (P. maximus) were obtained from Tinduff hatchery (Finistère, Brittany, France). The average shell length was 4.10 ± 0.75 cm, and the average wet weight 1.0 ± 0.2 g.
Oyster (C. gigas) spat at stage T6 was obtained from France Naissain (Vendée, Loire Countries, France). The average shell length was 1.0 ± 0.15 cm, and the average wet weight 18 ± 4 mg.

5.2. Experimental Procedure

The aim of our experiments was to study the early effects of exposure of juvenile filtering bivalves to toxic Pseudo-nitzschia, without prior acclimatization of the bivalves to Pseudo-nitzschia. Algal cultures were not renewed during the experiments in order to study the response of the bivalves along with the changes in the proportions of the different microalgae. Before each experiment, each phytoplankton strain and bivalve species was acclimated to the experimental conditions, i.e., 15 °C, 100 µmol photons m−2 s−1, and a 14 h:10 h L:D cycle.

5.2.1. Experimental Protocols of Contact between Bivalves and Microalgae

The experiments were carried out in Erlenmeyer flasks with an oxygenation system. Four experimental protocols (Table 1) were used with the bivalve species, the microalgal species, or a combination of species. A bivalve-free control condition was prepared for each experimental condition. The experiments were carried out in triplicates.
For C. gigas spat, 20 individuals were added in 250 mL of K/2-medium + Si(OH)4 (95 µM) for five days. For juvenile P. maximus experiments, scallops were exposed for 6 h: one juvenile was added in 220 mL of K/2-medium + Si(OH)4 (63 µM). Considering the FR and that no microalgae culture was added during the experiments, P. maximus was not exposed for more than 6 h since no more microalgae were available after this time.

5.2.2. Sampling

At the beginning of the experiments, samples containing all the tissues of 20 C. gigas on the one hand and three P. maximus on the other hand were taken to determine the DA concentrations in their flesh tissues. Microalgal culture samples were also taken to determine extracellular dissolved DA (dDA), cellular DA (cDA) and nutrient concentrations. Samples of the medium containing the microalgae were collected every day (from day 0 to day 5) for C. gigas and every hour (from hour 0 to hour 6) for P. maximus to determine microalgal cell concentrations and calculate the clearance and filtration rates. At the end of the experiments, the bivalves of each flask were collected to determine DA concentrations in their flesh tissues, and the medium was also sampled for nutrient concentration measurements. In the flasks containing the Pseudo-nitzschia species, the medium was sampled to determine dDA and cDA concentrations. The samples for the dDA and cDA measurements when C. gigas was exposed to P. fraudulenta were taken on day 4 instead of day 5 to avoid having no P. fraudulenta cells left in the culture medium at the end of the experiment.

5.3. Data Analysis

5.3.1. Cell Concentrations, Clearance Rates, Filtration Rates

P. australis and P. fraudulenta cell concentrations were estimated using a Nageotte counting chamber, and I. galbana cell concentrations were estimated using a Malassez counting chamber. Then, we determined the clearance rates of the bivalves (CR in mL h−1 ind−1)—every day for 5 days and every hour for 6 h for the experiments with C. gigas and P. maximus, respectively—using the following equation [74] and assuming the absence of sedimentation and negligible growth in the Erlenmeyer flasks:
CR = ln ( C 1 C 2 )   ×   V T 2     T 1   ×   1 N
where C1 and C2 are the phytoplankton cell concentrations in the presence of the bivalves (cells mL−1) at T1 and T2 (hours), V is the volume of medium in the Erlenmeyer flasks (mL), and N is the number of bivalve individuals in each Erlenmeyer flask.
The filtration rates (FR, in cells h−1 ind−1) were determined from the previous equation:
FR   =   CR   ×   C 1   +   C 2 2
CR and FR were calculated for each bivalve only over the period when phytoplankton cells were not depleted in the culture medium.

5.3.2. Dissolved Inorganic Nutrient Analysis

Samples for the determination of inorganic nutrient (nitrate, phosphate and silicate) concentrations in the culture medium were obtained by filtering 10 mL of culture medium on a 0.45 µm cellulose acetate membrane under low filtration pressure to remove algal cells. The filtrate was stored at −20 °C for nitrate and phosphate assays and at 4 °C for the silicate assay prior to analysis. Dissolved nutrients were quantified with an auto-analyzer AA3_HR (Seal Analytical) following standard protocols [75].

5.3.3. Domoic Acid Analysis

DA in Pseudo-nitzschia species. Total (tDA) and dissolved (dDA) domoic acid concentrations were measured using enzyme-linked immunosorbent assay (ELISA) Biosense kits (Biosense Laboratories, Bergen, Norway), following the manufacturer’s instructions modified from [76]. tDA was measured from 5 mL of culture stored at −20 °C until analysis (maximum two months). For dDA, 5 mL of culture were centrifuged, and the supernatant was frozen at −20 °C prior to analysis (maximum two months). The dDA samples were directly analyzed. For tDA, the whole culture samples were sonicated on ice with a sonication probe (Bioblock Scientific Vibracell 72442 ultrasons) for 4 min to disrupt cell membranes and release DA from the cells. Then, the samples were filtered on a 0.2 µm cellulose acetate membrane to remove cell debris, and the filtrate was analyzed. Every sample was analyzed by ELISA in duplicate for quality control purposes, as specified by the manufacturer. cDA (pg cell−1) was obtained by subtracting dDA from tDA and by normalizing to the cell concentration.
DA in bivalves. Three sets of 20 C. gigas or 3 P. maximus were collected from each experimental protocol for analysis at the beginning and the end of the experiment. These pools of bivalves were frozen at −20 °C prior to analysis. The bivalves were dissected, weighed, placed in a microtube (Eppendorf, Germany) containing the extraction solution (50%/50% methanol/water), and crushed with a pellet piston (Eppendorf, Germany). The samples were vigorously shaken on a vortex for 1 min and centrifuged at 3000 g for 10 min at room temperature to recover the supernatant for DA analysis. DA quantifications were then carried out as presented above, using an ELISA kit (Biosense Laboratories, Bergen, Norway). The DA concentration in bivalve tissues (µg DA g−1) was calculated using the following equation:
DA   in   bivalves   =   DA   ×   d   ×   V   ×   10 6 M
where DA is the DA concentration in the diluted extract (pg mL−1), d is the dilution factor of the diluted extract, V is the volume of the methanolic extract (mL), and M is the mass of the bivalve sample (g).
The limit of detection (LOD) for the ELISA method was 3.3 × 10⁻³ µg DA g−1 wet weight for shellfish samples and 6.8 ng L−1 for seawater samples.

5.3.4. Statistical Analyses

Statistical analyses were conducted to compare CRs and FRs as well as cDA concentrations. The normality of the distribution was verified by a Shapiro–Wilk test, and the homogeneity of the variances was verified using a Bartlett test. Variance analysis tests (ANOVA) were carried out using the “car” package and repeated measures (ANOVA) were carried out using the “lme4” package in R version 3.6.1. These tests were completed with a Tukey post-hoc test. Statistical significance was set at α = 0.05 in all tests.

Supplementary Materials

The following are available online at https://0-www-mdpi-com.brum.beds.ac.uk/article/10.3390/toxins13080577/s1, Figure S1: cDA concentrations in P. fraudulenta (fg cell−1) as a function of the average clearance rates (mL h−1 ind−1, A) and the average filtration rates (cells mL−1 ind−1, B) of C. gigas over the 5 days of the experiment. Table S1: Concentrations of dissolved domoic acid (dDA, pg mL−1) in the media containing P. australis or P. fraudulenta at the beginning and the end of the exposure experiments. * significant difference with a p-value of 0.05. Table S2: Nutrient concentrations (µmol L−1) in the culture medium in the control, at the beginning and the end of the C. gigas and P. maximus exposure experiments.

Author Contributions

Conceptualization, A.S., J.F., F.D. and C.L.; methodology, A.S. and J.F.; software; validation, J.F., F.D., H.H. and C.L.; formal analysis, A.S., H.H., M.P. and J.F.; investigation, A.S. and B.L.R.; resources, J.F., F.D., O.J. and C.L.; data curation, A.S., M.P. and J.F.; writing—original draft preparation, A.S.; writing—review and editing, A.S., J.F., F.D., H.H., C.L., B.L.R. and O.J.; visualization, A.S.; supervision, J.F.; project administration, J.F. and F.D.; funding acquisition, J.F. and F.D. All authors have read and agreed to the published version of the manuscript.

Funding

This research has received funding from the BOREA laboratory (UMR BOREA—CNRS 8067).

Institutional Review Board Statement

Not applicable.

Informed Consent Statement

Not applicable.

Acknowledgments

The authors thank the staff of the BOREA laboratory for their help during the experiments and Annie Buchwalter for English corrections. We are most grateful to Guillaume Rivière and Lorane Le Franc for lending us equipment. We thank Mickaël Le Gac (Ifremer, DYNECO PELAGOS, Plouzané, France), Elisabeth Nézan, and Nicolas Chomérat (Ifremer, LER/BO, Concarneau, France) for the P. australis strain.

Conflicts of Interest

The authors declare no conflict of interest.

References

  1. Bates, S.S.; Hubbard, K.A.; Lundholm, N.; Montresor, M.; Leaw, C.P. Pseudo-nitzschia, Nitzschia, and domoic acid: New research since 2011. Harmful Algae 2018, 79, 3–43. [Google Scholar] [CrossRef]
  2. Lelong, A.; Hégaret, H.; Soudant, P.; Bates, S.S. Pseudo-nitzschia (Bacillariophyceae) species, domoic acid and amnesic shellfish poisoning: Revisiting previous paradigms. Phycologia 2012, 51, 168–216. [Google Scholar] [CrossRef] [Green Version]
  3. Trainer, V.L.; Bates, S.S.; Lundholm, N.; Thessen, A.E.; Cochlan, W.P.; Adams, N.G.; Trick, C.G. Pseudo-nitzschia physiological ecology, phylogeny, toxicity, monitoring and impacts on ecosystem health. Harmful Algae 2012, 14, 271–300. [Google Scholar] [CrossRef] [Green Version]
  4. Chen, X.M.; Pang, J.X.; Huang, C.X.; Lundholm, N.; Teng, S.T.; Li, A.; Li, Y. Two new and non-toxigenic Pseudo-nitzschia species (Bacillariophyceae) from Chinese southeast coastal waters. J. Phycol. 2020, 57, 335–344. [Google Scholar] [CrossRef]
  5. Guiry, M.D.; Guiry, G.M. AlgaeBase. Available online: www.algaebase.org (accessed on 13 January 2021).
  6. Bates, S.S.; Bird, C.J.; de Freitas, A.S.W.; Foxall, R.; Gilgan, M.; Hanic, L.A.; Johnson, G.R.; McCulloch, A.W.; Odense, P.; Pocklington, R.; et al. Pennate diatom Nitzschia pungens as the primary source of domoic acid, a toxin in shellfish from eastern Prince Edward Island, Canada. Can. J. Fish. Aquat. Sci. 1989, 46, 1203–1215. [Google Scholar] [CrossRef]
  7. Visciano, P.; Schirone, M.; Berti, M.; Milandri, A.; Tofalo, R.; Suzzi, G. Marine biotoxins: Occurrence, toxicity, regulatory limits and reference methods. Front. Microbiol. 2016, 7, 1–10. [Google Scholar] [CrossRef] [PubMed] [Green Version]
  8. Delegrange, A.; Lefebvre, A.; Gohin, F.; Courcot, L.; Vincent, D. Pseudo-nitzschia sp. diversity and seasonality in the southern North Sea, domoic acid levels and associated phytoplankton communities. Estuar. Coast. Shelf Sci. 2018, 214, 194–206. [Google Scholar] [CrossRef] [Green Version]
  9. Geuer, J.K.; Trimborn, S.; Koch, F.; Brenneis, T.; Krock, B.; Koch, B.P. Dissolved domoic acid does not improve growth rates and iron content in iron-stressed Pseudo-nitzschia subcurvata. Front. Mar. Sci. 2020, 7, 1–13. [Google Scholar] [CrossRef]
  10. Umhau, B.P.; Benitez-Nelson, C.R.; Anderson, C.R.; McCabe, K.; Burrell, C. A time series of water column distributions and sinking particle flux of Pseudo-nitzschia and domoic acid in the Santa Barbara Basin, California. Toxins 2018, 10, 480. [Google Scholar] [CrossRef] [Green Version]
  11. De Rijcke, M.; Vandegehuchte, M.B.; Vanden Bussche, J.; Nevejan, N.; Vanhaecke, L.; De Schamphelaere, K.A.C.; Janssen, C.R. Common European harmful algal blooms affect the viability and innate immune responses of Mytilus edulis larvae. Fish Shellfish Immunol. 2015, 47, 175–181. [Google Scholar] [CrossRef]
  12. Liu, H.; Kelly, M.S.; Campbell, D.A.; Dong, S.L.; Zhu, J.X.; Wang, S.F. Exposure to domoic acid affects larval development of king scallop Pecten maximus (Linnaeus, 1758). Aquat. Toxicol. 2007, 81, 152–158. [Google Scholar] [CrossRef]
  13. Panlilio, J.M.; Aluru, N.; Hahn, M.E. Developmental neurotoxicity of the harmful algal bloom toxin domoic acid: Cellular and molecular mechanisms underlying altered behavior in the zebrafish model. Environ. Health Perspect. 2020, 128, 1–19. [Google Scholar] [CrossRef] [PubMed]
  14. Tester, P.A.; Pan, Y.; Doucette, G.J. Accumulation of domoic acid activity in copepods. Harmful Algal Bloom. 2000, 418–421. Available online: https://www.researchgate.net/publication/258178061_Accumulation_of_domoic_acid_activity_in_copepods (accessed on 11 June 2021).
  15. Lincoln, J.A.; Turner, J.T.; Bates, S.S.; Léger, C.; Gauthier, D.A. Feeding, egg production, and egg hatching success of the copepods Acartia tonsa and Temora longicornis on diets of the toxic diatom Pseudo-nitzschia multiseries and the non-toxic diatom Pseudo-nitzschia pungens. Hydrobiologia 2001, 453–454, 107–120. [Google Scholar] [CrossRef]
  16. Maneiro, I.; Iglesias, P.; Guisande, C.; Riveiro, I.; Barreiro, A.; Zervoudaki, S.; Granéli, E. Fate of domoic acid ingested by the copepod Acartia clausi. Mar. Biol. 2005, 148, 123–130. [Google Scholar] [CrossRef]
  17. Leandro, L.F.; Teegarden, G.J.; Roth, P.B.; Wang, Z.; Doucette, G.J. The copepod Calanus finmarchicus: A potential vector for trophic transfer of the marine algal biotoxin, domoic acid. J. Exp. Mar. Biol. Ecol. 2010, 382, 88–95. [Google Scholar] [CrossRef]
  18. Tammilehto, A.; Nielsen, T.G.; Krock, B.; Møller, E.F.; Lundholm, N. Induction of domoic acid production in the toxic diatom Pseudo-nitzschia seriata by calanoid copepods. Aquat. Toxicol. 2015, 159, 52–61. [Google Scholar] [CrossRef] [Green Version]
  19. Tammilehto, A.; Nielsen, T.G.; Krock, B.; Møller, E.F.; Lundholm, N. Calanus spp.-Vectors for the biotoxin, domoic acid, in the Arctic marine ecosystem? Harmful Algae 2012, 20, 165–174. [Google Scholar] [CrossRef]
  20. Harðardóttir, S.; Pančić, M.; Tammilehto, A.; Krock, B.; Møller, E.F.; Nielsen, T.G.; Lundholm, N. Dangerous relations in the Arctic marine food web: Interactions between toxin producing Pseudo-nitzschia diatoms and Calanus copepodites. Mar. Drugs 2015, 13, 3809–3835. [Google Scholar] [CrossRef] [Green Version]
  21. Lundholm, N.; Krock, B.; John, U.; Skov, J.; Cheng, J.; Pančić, M.; Wohlrab, S.; Rigby, K.; Nielsen, T.G.; Selander, E.; et al. Induction of domoic acid production in diatoms—Types of grazers and diatoms are important. Harmful Algae 2018, 79, 64–73. [Google Scholar] [CrossRef]
  22. Harðardóttir, S.; Krock, B.; Wohlrab, S.; John, U.; Nielsen, T.G.; Lundholm, N. Can domoic acid affect escape response in copepods? Harmful Algae 2018, 79, 50–52. [Google Scholar] [CrossRef] [Green Version]
  23. Mafra, L.L.; Bricelj, V.M.; Ouellette, C.; Bates, S.S. Feeding mechanics as the basis for differential uptake of the neurotoxin domoic acid by oysters, Crassostrea virginica, and mussels, Mytilus edulis. Aquat. Toxicol. 2010, 97, 160–171. [Google Scholar] [CrossRef]
  24. Mafra, L.L.; Bricelj, V.M.; Ouellette, C.; Léger, C.; Bates, S.S. Mechanisms contributing to low domoic acid uptake by oysters feeding on Pseudo-nitzschia cells. I. Filtration and pseudofeces production. Aquat. Biol. 2009, 6, 201–212. [Google Scholar] [CrossRef] [Green Version]
  25. Mafra, L.L.; Bricelj, V.M.; Ward, J.E. Mechanisms contributing to low domoic acid uptake by oysters feeding on Pseudo-nitzschia cells. II. Selective rejection. Aquat. Biol. 2009, 6, 213–226. [Google Scholar] [CrossRef]
  26. Thessen, A.E.; Soniat, T.M.; Dortch, Q.; Doucette, G.J. Crassostrea virginica grazing on toxic and non-toxic diatoms. Toxicon 2010, 55, 570–579. [Google Scholar] [CrossRef] [PubMed]
  27. Bardouil, M.; Bohec, M.; Bougrier, S.; Lassus, P.; Truquet, P. Feeding responses of Crassostrea gigas (Thunberg) to inclusion of different proportions of toxic dinoflagellates in their diet. Oceanol. Acta 1996, 19, 177–182. [Google Scholar]
  28. Bricelj, V.M.; MacQuarrie, S.P.; Schaffner, R.A. Differential effects of Aureococcus anophagefferens isolates (“brown tide”) in unialgal and mixed suspensions on bivalve feeding. Mar. Biol. 2001, 139, 605–615. [Google Scholar] [CrossRef]
  29. Contreras, A.M.; Marsden, I.D.; Munro, M.H.G. Effects of short-term exposure to paralytic shellfish toxins on clearance rates and toxin uptake in five species of New Zealand bivalve. Mar. Freshw. Res. 2012, 63, 166–174. [Google Scholar] [CrossRef]
  30. Gainey, L.F.; Shumway, S.E. The physiological effect of Aureococcus anophagefferens (“brown tide”) on the lateral cilia of bivalve mollusks. Biol. Bull. 1991, 181, 298–306. [Google Scholar] [CrossRef] [Green Version]
  31. Shumway, S.E.; Burkholder, J.A.M.; Springer, J. Effects of the estuarine dinoflagellate Pfiesteria shumwayae (Dinophyceae) on survival and grazing activity of several shellfish species. Harmful Algae 2006, 5, 442–458. [Google Scholar] [CrossRef]
  32. May, S.P.; Burkholder, J.A.M.; Shumway, S.E.; Hégaret, H.; Wikfors, G.H.; Frank, D. Effects of the toxic dinoflagellate Alexandrium monilatum on survival, grazing and behavioral response of three ecologically important bivalve molluscs. Harmful Algae 2010, 9, 281–293. [Google Scholar] [CrossRef]
  33. Navarro, J.M.; Widdows, J.; Chaparro, O.R.; Ortíz, A.; Mellado, C.; Villanueva, P.A. Pre-ingestive selection capacity and endoscopic analysis in the sympatric bivalves Mulinia edulis and Mytilus chilensis exposed to diets containing toxic and non-toxic dinoflagellates. PLoS ONE 2018, 13, 0193370. [Google Scholar] [CrossRef] [Green Version]
  34. Hégaret, H.; Wikfors, G.H.; Shumway, S.E. Diverse feeding responses of five species of bivalve mollusc when exposed to three species of harmful algae. J. Shellfish Res. 2007, 26, 549–559. [Google Scholar] [CrossRef]
  35. Selander, E.; Cervin, G.; Pavia, H. Effects of nitrate and phosphate on grazer-induced toxin production in Alexandrium minutum. Limnol. Oceanogr. 2008, 53, 523–530. [Google Scholar] [CrossRef]
  36. Selander, E.; Fagerberg, T.; Wohlra, S.; Paviae, H. Fight and flight in dinoflagellates? Kinetics of simultaneous grazer-induced responses in Alexandrium tamarense. Limnol. Oceanogr. 2012, 57, 58–64. [Google Scholar] [CrossRef]
  37. Selander, E.; Thor, P.; Toth, G.; Pavia, H. Copepods induce paralytic shellfish toxin production in marine dinoflagellates. Proc. R. Soc. B Biol. Sci. 2006, 273, 1673–1680. [Google Scholar] [CrossRef] [Green Version]
  38. Huang, C.X.; Dong, H.C.; Lundholm, N.; Teng, S.T.; Zheng, G.C.; Tan, Z.J.; Lim, P.T.; Li, Y. Species composition and toxicity of the genus Pseudo-nitzschia in Taiwan Strait, including P. chiniana sp. nov. and P. qiana sp. nov. Harmful Algae 2019, 84, 195–209. [Google Scholar] [CrossRef]
  39. Husson, B.; Hernández-Fariñas, T.; Le Gendre, R.; Schapira, M.; Chapelle, A. Two decades of Pseudo-nitzschia spp. blooms and king scallop (Pecten maximus) contamination by domoic acid along the French Atlantic and English Channel coasts: Seasonal dynamics, spatial heterogeneity and interannual variability. Harmful Algae 2016, 51, 26–39. [Google Scholar] [CrossRef] [Green Version]
  40. Caruana, A.M.N.; Ayache, N.; Raimbault, V.; Rétho, M.; Hervé, F.; Bilien, G.; Amzil, Z.; Chomérat, N. Direct evidence for toxin production by Pseudo-nitzschia plurisecta (Bacillariophyceae) and extension of its distribution area. Eur. J. Phycol. 2019, 54, 585–594. [Google Scholar] [CrossRef]
  41. Downes-Tettmar, N.; Rowland, S.; Widdicombe, C.; Woodward, M.; Llewellyn, C. Seasonal variation in Pseudo-nitzschia spp. and domoic acid in the western English Channel. Cont. Shelf Res. 2013, 53, 40–49. [Google Scholar] [CrossRef]
  42. Klein, C.; Claquin, P.; Bouchart, V.; Le Roy, B.; Véron, B. Dynamics of Pseudo-nitzschia spp. and domoic acid production in a macrotidal ecosystem of the eastern English Channel (Normandy, France). Harmful Algae 2010, 9, 218–226. [Google Scholar] [CrossRef]
  43. Nezan, E.; Antoine, E.; Fiant, L.; Billard, C. Identification of Pseudo-nitzschia australis and P. multiseries in the Bay of Seine. Was there a relation to presence of domoic acid in King scallops in autumn 2004? Harmful Algae News 2006, 31, 1–12. [Google Scholar]
  44. Thorel, M.; Claquin, P.; Schapira, M.; Le Gendre, R.; Riou, P.; Goux, D.; Le Roy, B.; Raimbault, V.; Deton-Cabanillas, A.-F.; Bazin, P.; et al. Nutrient ratios influence variability in Pseudo-nitzschia species diversity and particulate domoic acid production in the Bay of Seine (France). Harmful Algae 2017, 68, 192–205. [Google Scholar] [CrossRef] [PubMed]
  45. Lema, K.A.; Latimier, M.; Nezan, E.; Fauchot, J.; Le Gac, M. Inter and intra-specific growth and domoic acid production in relation to nutrient ratios and concentrations in Pseudo-nitzschia: Phosphate an important factor. Harmful Algae 2017, 64, 11–19. [Google Scholar] [CrossRef] [PubMed] [Green Version]
  46. Sauvey, A.; Claquin, P.; Le Roy, B.; Le Gac, M.; Fauchot, J. Differential influence of life cycle on growth and toxin production of three Pseudo-nitzschia species (Bacillariophyceae). J. Phycol. 2019, 55, 1126–1139. [Google Scholar] [CrossRef] [PubMed]
  47. Belin, C.; Amzil, Z. Phycotoxin monitoring in France: Risk-based strategy and main results (2006–2008). In Proceedings of the 7th International Conference on Molluscan Shellfish Safety, Nantes, France, 14–19 June 2009; Lassus, P., Ed.; Ifremer: Nantes, France, 2009; pp. 149–156. [Google Scholar]
  48. Amzil, Z.; Fresnel, J.; Le Gal, D.; Billard, C. Domoic acid accumulation in french shellfish in relation to toxic species of Pseudo-nitzschia multiseries and P. pseudodelicatissima. Toxicon 2001, 39, 1245–1251. [Google Scholar] [CrossRef]
  49. Rosa, A.M.; Ward, J.E.; Shumway, S.E. Selective capture and ingestion of particles by suspension-feeding bivalve molluscs: A review. J. Shellfish Res. 2018, 37, 727–746. [Google Scholar] [CrossRef]
  50. Ward, J.E.; Shumway, S.E. Separating the grain from the chaff: Particle selection in suspension- and deposit-feeding bivalves. J. Exp. Mar. Biol. Ecol. 2004, 300, 83–130. [Google Scholar] [CrossRef]
  51. Shumway, S.E.; Cucci, T.L.; Newell, R.C.; Selvin, R.C.; Guillard, R.R.L.; Yentsch, C.M. Flow cytometry: A new method for characterization of differential ingestion, digestion and egestion by suspension feeders. Mar. Ecol. Prog. Ser. 1985, 24, 201–204. [Google Scholar]
  52. Leverone, J.R.; Shumway, S.E.; Blake, N.J. Comparative effects of the toxic dinoflagellate, Karenia brevis, on bivalve molluscs from Florida, USA. Toxicon 2007, 49, 634–645. [Google Scholar] [CrossRef] [PubMed]
  53. Pousse, E.; Flye-Sainte-Marie, J.; Alunno-Bruscia, M.; Hégaret, H. Sources of paralytic shellfish toxin accumulation variability in the Pacific oyster Crassostrea gigas. Toxicon 2018, 144, 14–22. [Google Scholar] [CrossRef] [Green Version]
  54. Shumway, S.E.; Barter, J.; Sherman-Caswell, S. Auditing the impact of toxic algal blooms on oysters. Environ. Audit. 1990, 2, 41–56. [Google Scholar]
  55. Borcier, E.; Morvezen, R.; Boudry, P.; Miner, P.; Charrier, G.; Laroche, J.; Hégaret, H. Effects of bioactive extracellular compounds and paralytic shellfish toxins produced by Alexandrium minutum on growth and behaviour of juvenile great scallops Pecten maximus. Aquat. Toxicol. 2017, 184, 142–154. [Google Scholar] [CrossRef] [Green Version]
  56. Douglas, D.J.; Kenchington, E.R.; Bird, C.J.; Pocklington, R.; Bradford, B.; Silvert, W. Accumulation of domoic acid by the sea scallop (Placopecten magellanicus) fed cultured cells of toxic Pseudo-nitzschia multiseries. Can. J. Fish. Aquat. Sci. 1997, 54, 907–913. [Google Scholar] [CrossRef]
  57. Jones, T.O.; Whyte, J.N.C.; Townsend, L.D.; Gintherb, N.G.; Iwamaa, G.K. Effects of domoic acid on haemolymph pH, PCO2, and PO in the Pacific oyster, Crassostrea gigas and the California mussel, Mytilus californianus. Aquat. Toxicol. 1995, 31, 43–55. [Google Scholar] [CrossRef]
  58. Mafra, L.L.; Bricelj, V.M.; Fennel, K. Domoic acid uptake and elimination kinetics in oysters and mussels in relation to body size and anatomical distribution of toxin. Aquat. Toxicol. 2010, 100, 17–29. [Google Scholar] [CrossRef] [PubMed] [Green Version]
  59. Beninger, P.G.; Ward, E.; MacDonald, B.A.; Thompson, R.J. Gill function and particle transport in Placopecten magellanicus (Mollusca: Bivalvia) as revealed using video endoscopy. Mar. Biol. 1992, 114, 281–288. [Google Scholar] [CrossRef]
  60. Stewart, J.E.; Marks, L.J.; Gilgan, M.W.; Pfeiffer, E.; Zwicker, B.M. Microbial utilization of the neurotoxin domoic acid: Blue mussels (Mytilus edulis) and soft shell clams (Mya arenaria) as sources of the microorganisms. Can. J. Microbiol. 1998, 44, 456–464. [Google Scholar] [CrossRef] [PubMed]
  61. Bates, S.; Garrison, D.; Horner, R. Bloom dynamics and physiology producing Pseudo-nitzschia species. NATO ASI Ser. G Ecol. Sci. 1998, 41, 267–292. [Google Scholar]
  62. Fehling, J.; Davidson, K.; Bolch, C.J.; Bates, S.S. Growth and domoic acid production by Pseudo-nitzschia seriata (Bacillariophyceae) under phosphate and silicate limitation. J. Phycol. 2004, 40, 674–683. [Google Scholar] [CrossRef]
  63. Hagström, J.A.; Granéli, E.; Moreira, M.O.P.; Odebrecht, C. Domoic acid production and elemental composition of two Pseudo-nitzschia multiseries strains, from the NW and SW Atlantic Ocean, growing in phosphorus or nitrogen-limited chemostat cultures. J. Plankton Res. 2011, 33, 297–308. [Google Scholar] [CrossRef] [Green Version]
  64. Kudela, R.; Roberts, A.; Armstrong, M. Laboratory analyses of nutrient stress and toxin production in Pseudo-nitzschia spp. from Monterey Bay, California. Harmful Algae 2002, 136–138. Available online: https://people.ucsc.edu/~kudela/reprints/Kudela_XHAB2_2003.pdf (accessed on 11 June 2021).
  65. Pan, Y.; Subba Rao, D.V.; Mann, K.H.; Brown, R.G.; Pocklington, R. Effects of silicate limitation on production of domoic acid, a neurotoxin, by the diatom Pseudo-nitzschia multiseries. I. Batch culture studies. Mar. Ecol. Prog. Ser. 1996, 131, 225–233. [Google Scholar] [CrossRef]
  66. Pan, Y.; Subba Rao, D.V.; Mann, K.H.; Li, W.K.W.; Harrison, W.G. Effects of silicate limitation on production of domoic acid, a neurotoxin, by the diatom Pseudo-nitzschia multiseries. II. Continuous culture studies. Mar. Ecol. Prog. Ser. 1996, 131, 235–243. [Google Scholar] [CrossRef]
  67. Senft-Batoh, C.D.; Dam, H.G.; Shumway, S.E.; Wikfors, G.H. A multi-phylum study of grazer-induced paralytic shellfish toxin production in the dinoflagellate Alexandrium fundyense: A new perspective on control of algal toxicity. Harmful Algae 2015, 44, 20–31. [Google Scholar] [CrossRef]
  68. Miesner, A.K.; Lundholm, N.; Krock, B.; Nielsen, T.G. The effect of Pseudo-nitzschia seriata on grazing and fecundity of Calanus finmarchicus and Calanus glacialis. J. Plankton Res. 2016, 38, 564–574. [Google Scholar] [CrossRef] [Green Version]
  69. Selander, E.; Kubanek, J.; Hamberg, M.; Andersson, M.X.; Cervin, G.; Pavia, H. Predator lipids induce paralytic shellfish toxins in bloom-forming algae. Proc. Natl. Acad. Sci. USA 2015, 112, 6395–6400. [Google Scholar] [CrossRef] [PubMed] [Green Version]
  70. Wohlrab, S.; Iversen, M.H.; John, U. A Molecular and co-evolutionary context for grazer induced toxin production in Alexandrium tamarense. PLoS ONE 2010, 5, e15039. [Google Scholar] [CrossRef] [PubMed]
  71. Grebner, W.; Berglund, E.C.; Berggren, F.; Eklund, J.; Harðadóttir, S.; Andersson, M.X.; Selander, E. Induction of defensive traits in marine plankton—new copepodamide structures. Limnol. Oceanogr. 2018, 64, 820–831. [Google Scholar] [CrossRef]
  72. Keller, M.D.; Selvin, R.C.; Claus, W.; Guillard, R.R.L. Media for the culture of oceanic ultraphytoplankton. J. Phycol. 1987, 23, 633–638. [Google Scholar] [CrossRef]
  73. Lundholm, N.; Daugbjerg, N.; Moestrup, Ø. Phylogeny of the Bacillariaceae with emphasis on the genus Pseudo-nitzschia (Bacillariophyceae) based on partial LSU RDNA. Eur. J. Phycol. 2002, 37, 115–134. [Google Scholar] [CrossRef] [Green Version]
  74. Coughlan, J. The estimation of filtering rate from the clearance of suspensions. Mar. Biol. 1969, 2, 356–358. [Google Scholar] [CrossRef]
  75. Aminot, A.; Kérouel, R. Dosage Automatique Des Nutriments Dans Les Eaux Marines: Méthodes en Flux Continu; Editions Quae: Paris, France, 2007. [Google Scholar]
  76. Garthwaite, L.; Ross, K.M.; Miles, C.O.; Hansen, R.P.; Foster, D.; Wilkins, A.L.; Towers, N.R. Polyclonal antibodies to domoic acid, and their use in immunoassays for domoic acid in sea water and shellfish. Nat. Toxins 1998, 6, 93–104. [Google Scholar] [CrossRef]
Figure 1. Cell concentrations (A,E), clearance rates (CRs: B,F), and filtration rates (FRs: C,D,G,H) over the 5 days of exposure of C. gigas to P. fraudulenta and I. galbana—condition 1 (AD)—or P. australis and I. galbana—condition 2 (EH).
Toxins 13 00577 g001
Figure 2. Cell concentrations (A), clearance rates (CRs: B,C), and filtration rates (FRs: B,C) over the 5 days of exposure of C. gigas to P. fraudulenta—condition 3 (A,B)—or P. australis—condition 4 (A,C).
Toxins 13 00577 g002
Figure 3. Cell concentrations (A,E), clearance rates (CRs: B,F), and filtration rates (FRs: C,D,G,H) throughout the 6 h of exposure of P. maximus to P. fraudulenta and I. galbana—condition 1 (AD)—or P. australis and I. galbana—condition 2 (EH).
Toxins 13 00577 g003
Figure 4. DA concentrations in C. gigas (A) and P. maximus (B) at the end of the exposure experiments. An asterisk (*) indicates a significant difference at p < 0.05.
Toxins 13 00577 g004
Figure 5. cDA concentrations (fg cell−1) in P. fraudulenta (A,C) and P. australis (B,D) at the end of the experiments with C. gigas (A,C) and P. maximus (B,D). The asterisks indicate significant difference at p < 0.05 (*), p < 0.01 (**) and p < 0.001 (***).
Toxins 13 00577 g005
Figure 6. Linear regression for all data between P. australis cDA concentrations (fg cell−1) and the average clearance rates (CR, mL h−1 ind−1, A) or the average filtration rates (FR, cells mL−1 ind−1, B) of C. gigas throughout the 5 days of the experiment.
Toxins 13 00577 g006
Figure 7. DA concentrations in C. gigas (10−6 µg DA g−1) as a function of cDA concentrations in P. australis or P. fraudulenta (fg cell−1). The linear regression only applies to P. australis. Crossed circles: C. gigas exposed to mixed cultures of I. galbana and P. australis or P. fraudulenta.
Toxins 13 00577 g007
Table 1. Experimental conditions and protocols used in the four experiments with C. gigas and P. maximus exposure. Each condition was performed in triplicate.
C. gigasP. maximus
Experimental dataDuration5 days6 h
Volume250 mL220 mL
Number of individuals per condition20 C. gigas1 P. maximus
Average size of individuals1.0 ± 0.15 cm4.10 ± 0.75 cm
Average weight of individuals18 ± 4 mg1.0 ± 0.2 g
Experimental conditionsBivalves exposed to a mixed culture of microalgaeCondition 138 × 103 cells mL−1 P. fraudulenta
47 × 103 cells mL−1 I. galbana
43 × 103 cells mL−1 P. fraudulenta
45 × 103 cells mL−1 I. galbana
Condition 228 × 103 cells mL−1 P. australis
44 × 103 cells mL−1 I. galbana
46 × 103 cells mL−1 P. australis
44 × 103 cells mL−1 I. galbana
Bivalves exposed to a single culture of Pseudo-nitzschiaCondition 342 × 103 cells mL−1 P. fraudulenta-
Condition 448 × 103 cells mL−1 P. australis-
Publisher’s Note: MDPI stays neutral with regard to jurisdictional claims in published maps and institutional affiliations.

