Article

Neutralizing Concentrations of Anti-Botulinum Toxin Antibodies Positively Correlate with Mouse Neutralization Assay Results in a Guinea Pig Model

1
National Resilience, Inc., 2061 Challenger Dr., Alameda, CA 94501, USA
2
Department of Anesthesia and Perioperative Care, University of California, 1001 Potrero Ave., San Francisco, CA 94110, USA
3
Battelle Biomedical Research Center, West Jefferson, Columbus, OH 43162, USA
4
National Resilience, Inc., 13200 NW, Nano Ct, Alachua, FL 32615, USA
*
Author to whom correspondence should be addressed.
Submission received: 7 July 2021 / Revised: 24 August 2021 / Accepted: 16 September 2021 / Published: 21 September 2021
(This article belongs to the Special Issue Occurrence, Detection and Mitigation of Microbial Toxins)

Abstract

:
Botulinum neurotoxins (BoNT) are some of the most toxic proteins known and can induce respiratory failure requiring long-term intensive care. Treatment of botulism includes the administration of antitoxins. Monoclonal antibodies (mAbs) hold considerable promise as BoNT therapeutics and prophylactics, due to their potency and safety. A three-mAb combination has been developed that specifically neutralizes BoNT serotype A (BoNT/A), and a separate three mAb combination has been developed that specifically neutralizes BoNT serotype B (BoNT/B). A six mAb cocktail, designated G03-52-01, has been developed that combines the anti-BoNT/A and anti-BoNT/B mAbs. The pharmacokinetics and neutralizing antibody concentration (NAC) of G03-52-01 has been determined in guinea pigs, and these parameters were correlated with protection against an inhalation challenge of BoNT/A1 or BoNT/B1. Previously, it was shown that each antibody demonstrated a dose-dependent mAb serum concentration and reached maximum circulating concentrations within 48 h after intramuscular (IM) or intraperitoneal (IP) injection and that a single IM injection of G03-52-01 administered 48 h pre-exposure protected guinea pigs against an inhalation challenge of up to 93 LD50s of BoNT/A1 and 116 LD50s of BoNT/B1. The data presented here advance our understanding of the relationship of the neutralizing NAC to the measured circulating antibody concentration and provide additional support that a single IM or intravenous (IV) administration of G03-52-01 will provide pre-exposure prophylaxis against botulism from an aerosol exposure of BoNT/A and BoNT/B.
Key Contribution: This paper demonstrates the correlation between the results of the mouse neutralization assay for anti-botulinum antibodies and the neutralizing antibody concentration in a guinea pig model of inhalational botulism.

1. Introduction

Botulism can be fatal if untreated and is caused by exposure to any one of the highly toxic protein family known as botulinum neurotoxins (BoNTs) [1,2,3,4], which are the most potent of all known biological poisons [5,6]. At least seven BoNT serotypes (A-G) have been reported [7,8,9]. An eighth serotype, BoNT/H has been reported [10], though its existence as a separate serotype is not universally agreed upon [11]. Serotypes are defined immunologically by the inability of the IgG antibodies that neutralize one serotype to neutralize the other serotypes [12]. BoNT serotypes A, B, E, and F cause the disease botulism in humans [13,14,15]. The majority of cases within the US are caused by BoNT/A and B, while worldwide, most botulism cases are caused by BoNT/A, B, and E, with BoNT/F being associated with a low incidence of food poisoning-related cases of botulism intoxication [1,2,3,4,13].
Due to the potential for use of BoNT by those of ill intent, the US Department of Defense has funded development of vaccines for BoNT/A and BoNT/B to protect warfighters from these serotypes [16]. An alternative to vaccination is prophylactic administration of safe recombinant human antibodies that neutralize BoNT [17,18,19,20,21,22]. Advantages of this passive immunization approach are that protection would be immediate and recipients would be able to receive therapeutic botulinum neurotoxin if needed subsequently [23].
The development of a potent human monoclonal antibody (mAb) based drug product, G03-52-01, composed of multiple mAbs binding to non-overlapping epitopes on BoNT/A and BoNT/B has been described previously [17,19,20,24,25,26]. The BoNT/A [27], BoNT/B [28], BoNT/E (NCT03603665, unpublished results), and BoNT/C/D [29] antitoxins have completed Phase 1 testing in humans, without serious adverse side effects.
Botulinum toxin exposure can occur through a variety of routes, but inhalation is considered the most likely route in bioterrorism or biowarfare settings [30]. Therefore, an inhalational model of toxin exposure using the guinea pig has been developed [31]. The recombinant BoNT/A and BoNT/B antitoxins have been shown to be efficacious in inhalation botulism models in guinea pigs [26].
The primary objective of this study was to investigate the pharmacokinetic (PK) profiles of G03-52-01 following intramuscular (IM) or intravenous (IV) administration to guinea pigs and to evaluate the correlation between circulating antibody concentrations and the neutralizing antibody concentrations (NAC), measured using a mouse neutralization assay (MNA). Several MNA measurements are required to obtain the average NAC for a given sample. The levels of circulating anti-BoNT/A mAbs were assessed using an enzyme-linked immunosorbent assay (ELISA) [25]. The levels of circulating anti-BoNT/B mAbs were assessed using an electrochemiluminescence (ECL) assay [24].
Establishment of a correlation between the NAC and MNA would reduce the need for conducting multiple MNA studies during the development of these antibody drugs. The National Institute of Health (NIH) has identified finding alternatives to the use of animals for the BoNT mouse bioassay as a priority. The Scientific Advisory Committee on Alternative Toxicological Methods, which advises the Interagency Coordinating Committee on the Validation of Alternative Methods (ICCVAM) and the National Toxicology Program Interagency Center for the Evaluation of Alternative Methods (NICEATM), also considered the development and validation of alternatives to the mouse LD50 assay for BoNT potency testing a high priority [32]. Using a large number of animals for the efficacy/toxicity testing of botulinum toxins is also at odds with the concepts of reduction, replacement, and refinement, adopted by the European Union and the Organization for Economic Co-operation and Development, which suggests the development of alternative test methods that do not require animals for such studies [33].

2. Results

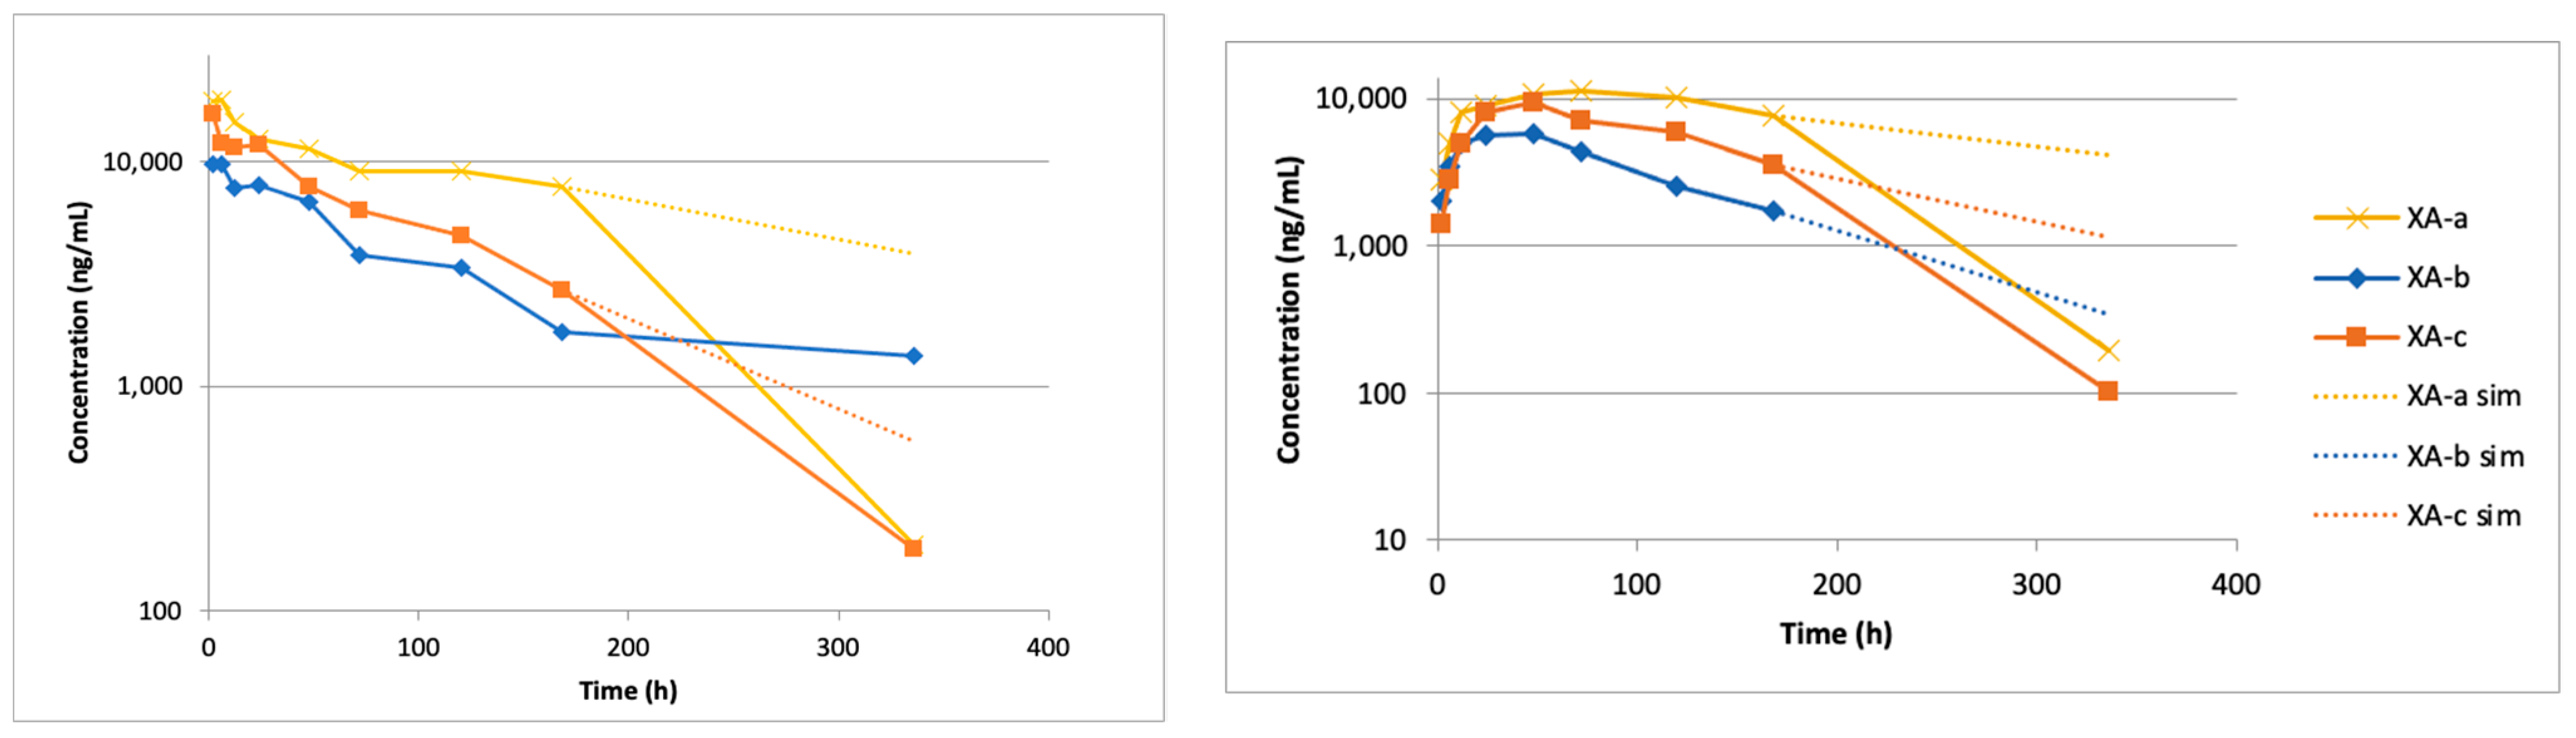
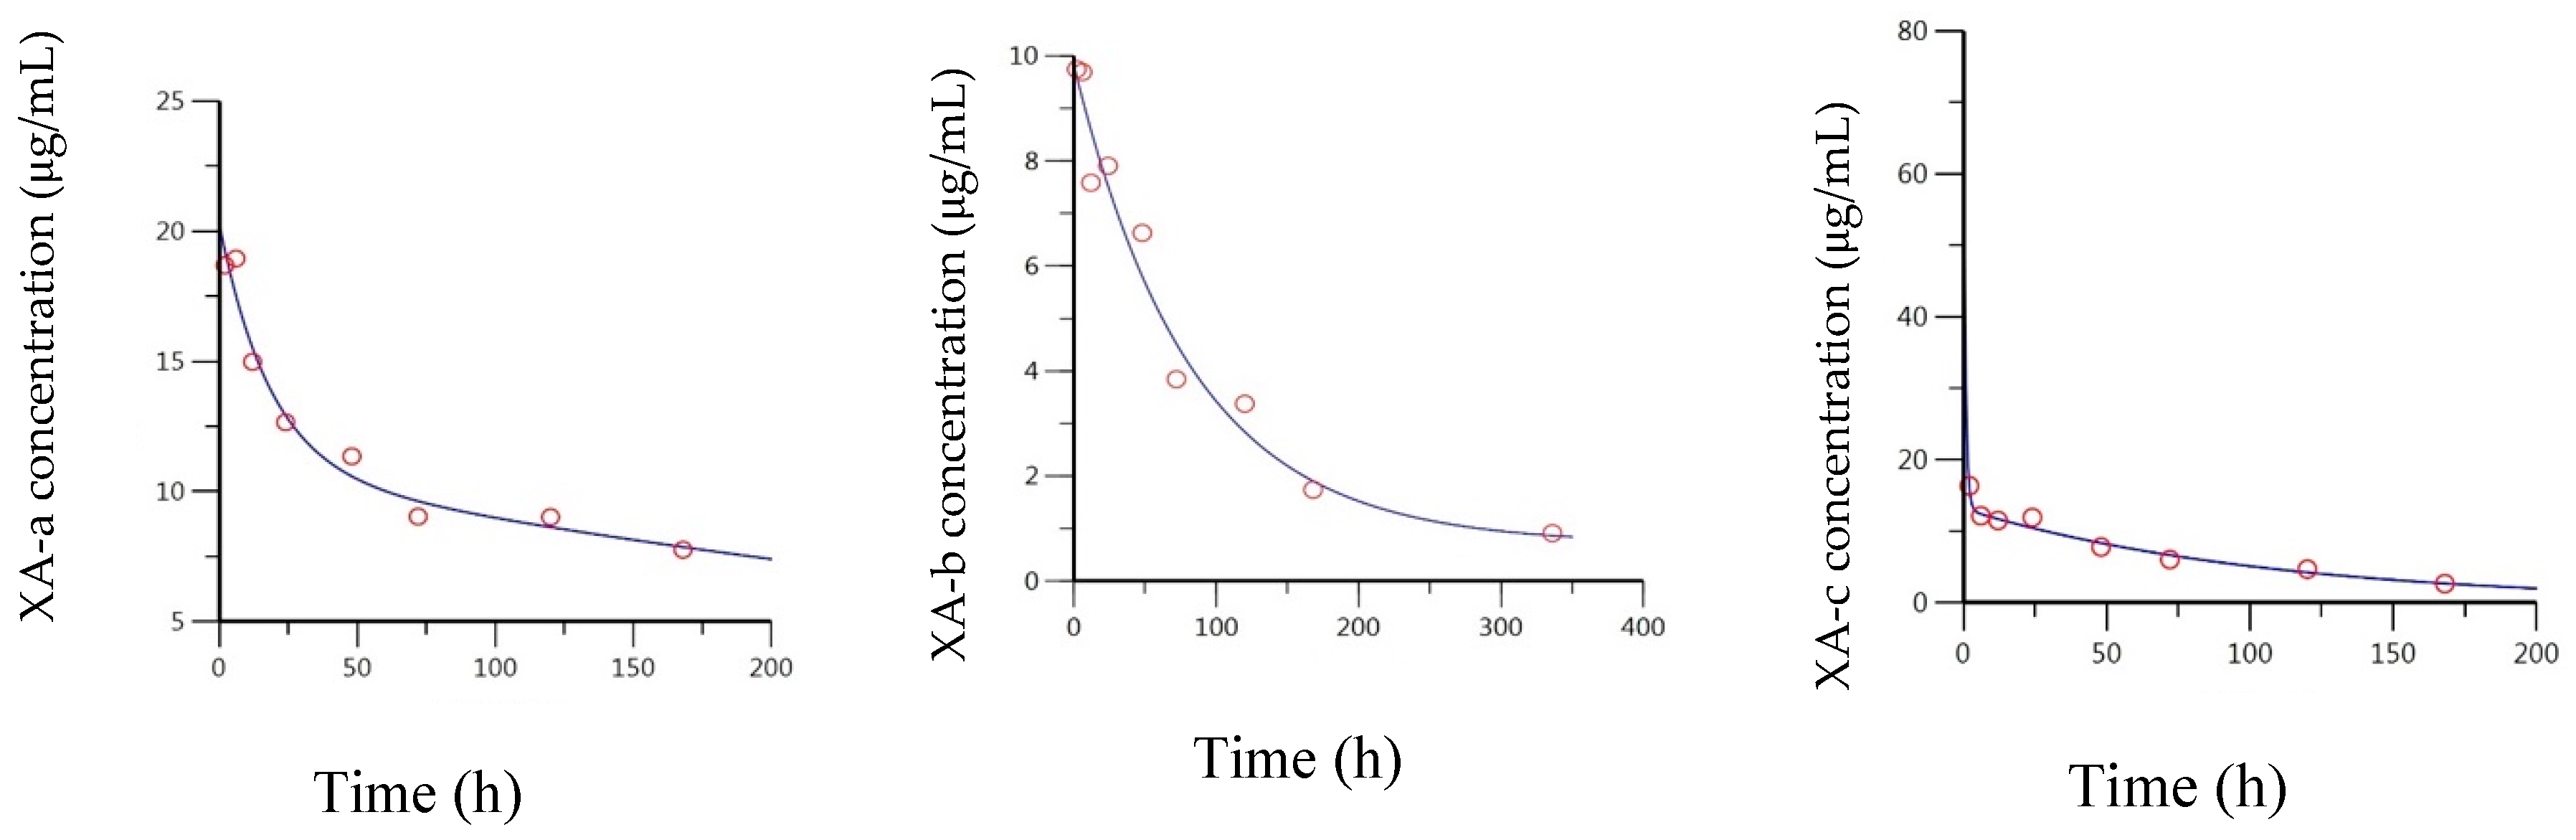
2.1. Intravenous (IV) Administration of Anti-BoNT/A Antibodies

All the IV administered antibodies in the anti-BoNT/A mAbs exhibited a biphasic curve consistent with 2-compartment kinetics through 168 h (7 days). The mAb concentration at the final timepoint at 336 h (14 days) was very low compared to the earlier timepoints for the XA-a and XA-c mAbs and did not fall on the biphasic curve (Figure 1); after 168 h there was a large increase in mAb clearance. As the kinetics of clearance change over time, the data could not be modeled compartmentally through 336 h. The XA-a and XA-c antibodies could not be detected after 336 h, suggesting an anti-drug antibody (ADA) response was likely generated against the mAbs. To fully characterize the PK properties, the data were modeled two ways: (1) the data through 168 h was fit to a 2-compartment model representing the intrinsic kinetics of the antibody without the putative ADA response, and (2) the data were fit to a non-compartmental model through 336 h. The latter method provides the most accurate representation of exposure in the animal.
The measured versus predicted concentration–time curve for XA-a, XA-b, and XA-c from the 2-compartment model is presented in Figure 2, and the derived parameters are presented in Table 1. While all the data fit a two-compartment model better than a one-compartment model, there was substantial variability between the curves. XA-a had a well-characterized distribution and elimination phase, with equilibrium being established by approximately 50 h. XA-b had a much longer distribution phase, such that the first point on the terminal phase was at 168 h. A concentration estimate for XA-b at 336 h was used to define the terminal phase. XA-c had an extremely fast distribution phase, such that the second timepoint at 6 h appears to be on the terminal phase. This made it difficult to accurately model the distribution phase, which led to a notably high estimate of C0 (the concentration immediately upon injection). The elimination rate half-lives (t½ elim) estimated from this analysis were 201 h and 447 h, for XA-a and XA-b, respectively. Since the XA-c was cleared much faster, its estimated elimination rate half-life was 14.8 h. Despite the short elimination rate half-life, mAb concentrations could be measured through 336 h. This is because the mAb distributes between compartments at a slower rate, thus limiting clearance. Consequently, the beta-phase half-life for XA-c was 73.5 h. The beta-phase half-life is the slope of the terminal phase in a 2-compartmental model and is dependent on the rates of distribution between compartments, in addition to the elimination rate constant. The long half-lives resulted in large area under the curve (AUCs), of 5880, 6330, and 1430 h*μg/mL for XA-a, XA-b, and XA-c, respectively. These AUC estimates are the result of an extrapolation through infinite time with no ADA. Thus, they should be considered overestimates of the exposures in smaller animals but may be more useful in extrapolating exposures to humans, where an ADA response is less likely.
The full data set was analyzed using the non-compartmental model to provide a more accurate representation of the data that were measured, and the results are summarized in Table 2. The terminal phase half-life (i.e., the β-phase) was greatly decreased for XA-a and XA-c, due to the sharp reduction in concentrations at 336 h, with respective half-lives of 35.2 and 34.4 h. XA-b was less affected in the terminal phase estimation of 93.9 h, due to the lack of a measurable concentration at 336 h. AUClast was used as the estimate of exposure for noncompartmental analysis, because the concentration dropped off rapidly for XA-a and XA-c, so there was no difference between AUClast and AUCinf. The concentration at 336 h allowed for significantly increased AUCinf for XA-b; without this data point the AUCinf for XA-b would have been well over 20% extrapolated. Thus, the estimates for AUClast are 2410, 1020, and 1390 h*μg/mL for XA-a, XA-b, and XA-c, respectively.

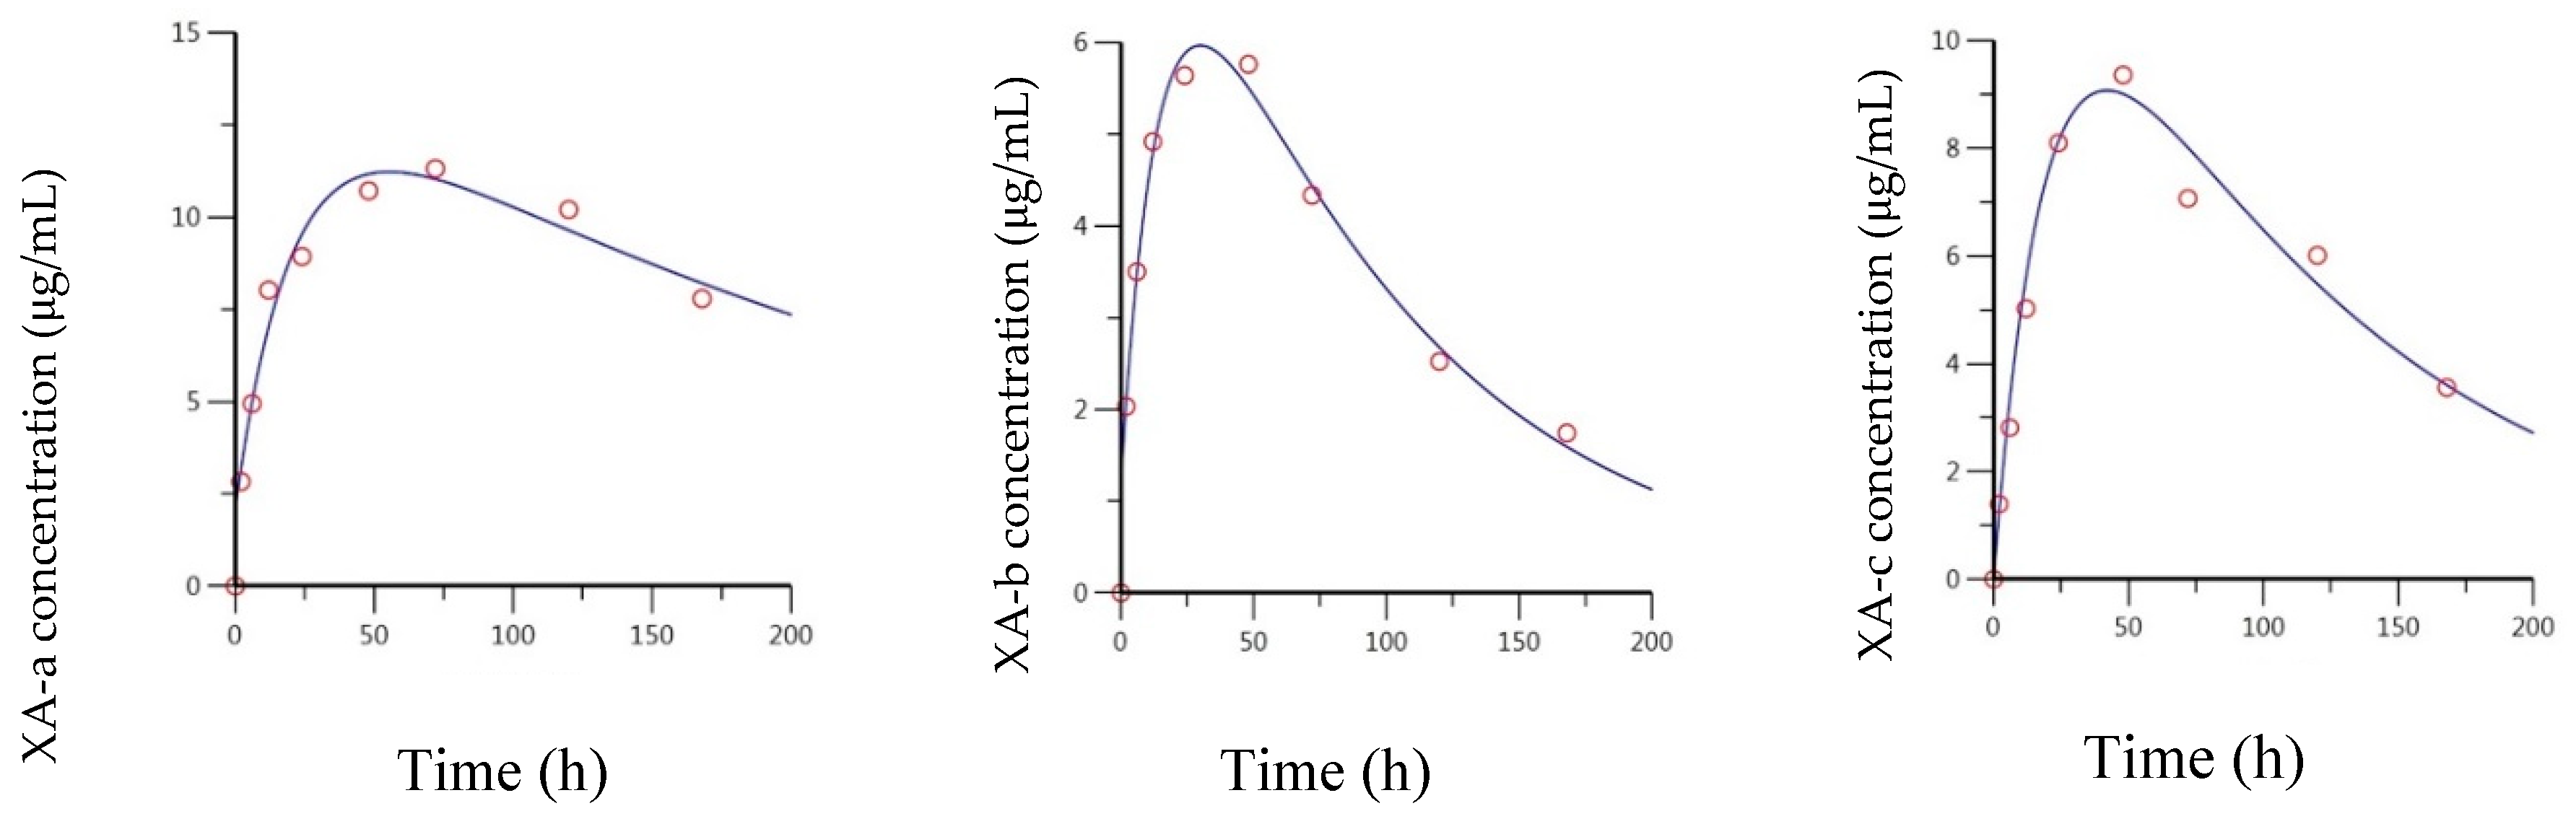
2.2. Pharmacokentics Following Intramuscular (IM) Administration of Anti-BoNT/A mAbs

When the anti-BoNT/A mAbs were administered IM, all three mAbs exhibited a slow absorption phase followed by the elimination phase. In the case of all three mAbs, a biphasic curve could not be seen after the Cmax, thus an extravascular one-compartment model provided a better fit for the data. Like the results observed with IV administration, all three of the mAbs could be modeled through 168 h. At the next timepoint, 336 h, XA-b was not measurable while XA-a and XA-c showed an expedited clearance (Figure 1). The measured versus predicted concentration–time data for XA-a, XA-b, and XA-c, based on the compartmental model are provided in Figure 3. Based on the model, the respective estimates of the absorption half-life for XA-a, XA-b, and XA-c, were 14.3, 10.2, and 13.8 h, which corresponded to Tmax values (time for antibody for reach maximum level) of 55.4, 29.9, and 42.0 h. Estimates of the elimination half-life were 202, 64.1, and 78.2 h, respectively, for XA-a, XA-b, and XA-c. While the elimination rates for XA-a were very similar for both routes of administration, the elimination rate was lower for XA-b and greater for XA-c administered via IM, due to the limitations in fitting the models described above. Extrapolated estimates of AUC were determined to be 4000, 781, and 1480 h*μg/mL, respectively, for XA-a, XA-b, and XA-c.
Noncompartmental analysis of the IM concentration–time data resulted in terminal elimination half-life estimates of 24.5, 73, and 30.4 h for XA-a, XA-b, and XA-c, which agree with the compartmental estimates. However, the terminal elimination half-life of XA-a was underestimated substantially, due to the 336 h timepoint (Figure 3). Estimates for AUClast were 2260, 627, and 1370 h*μg/mL for XA-a, XA-b, and XA-c, respectively. Since the IM dose was equivalent to the IV dose, the ratio is also a reflection of the absolute bioavailability, F. Based on these estimates, XA-a was 94% bioavailable, XA-b was 83% bioavailable, and XA-c was 99% bioavailable. The lower estimate for XA-b is due in part to the lack of a value at the 336 h timepoint in the concentration–time curve following IM administration. However, the concentrations at 168 h were similar following both IM and IV administration of XA-b, due to the longer terminal half-life estimated following IV administration; thus, even if the AUC is extrapolated, it will not increase the bioavailability greatly.

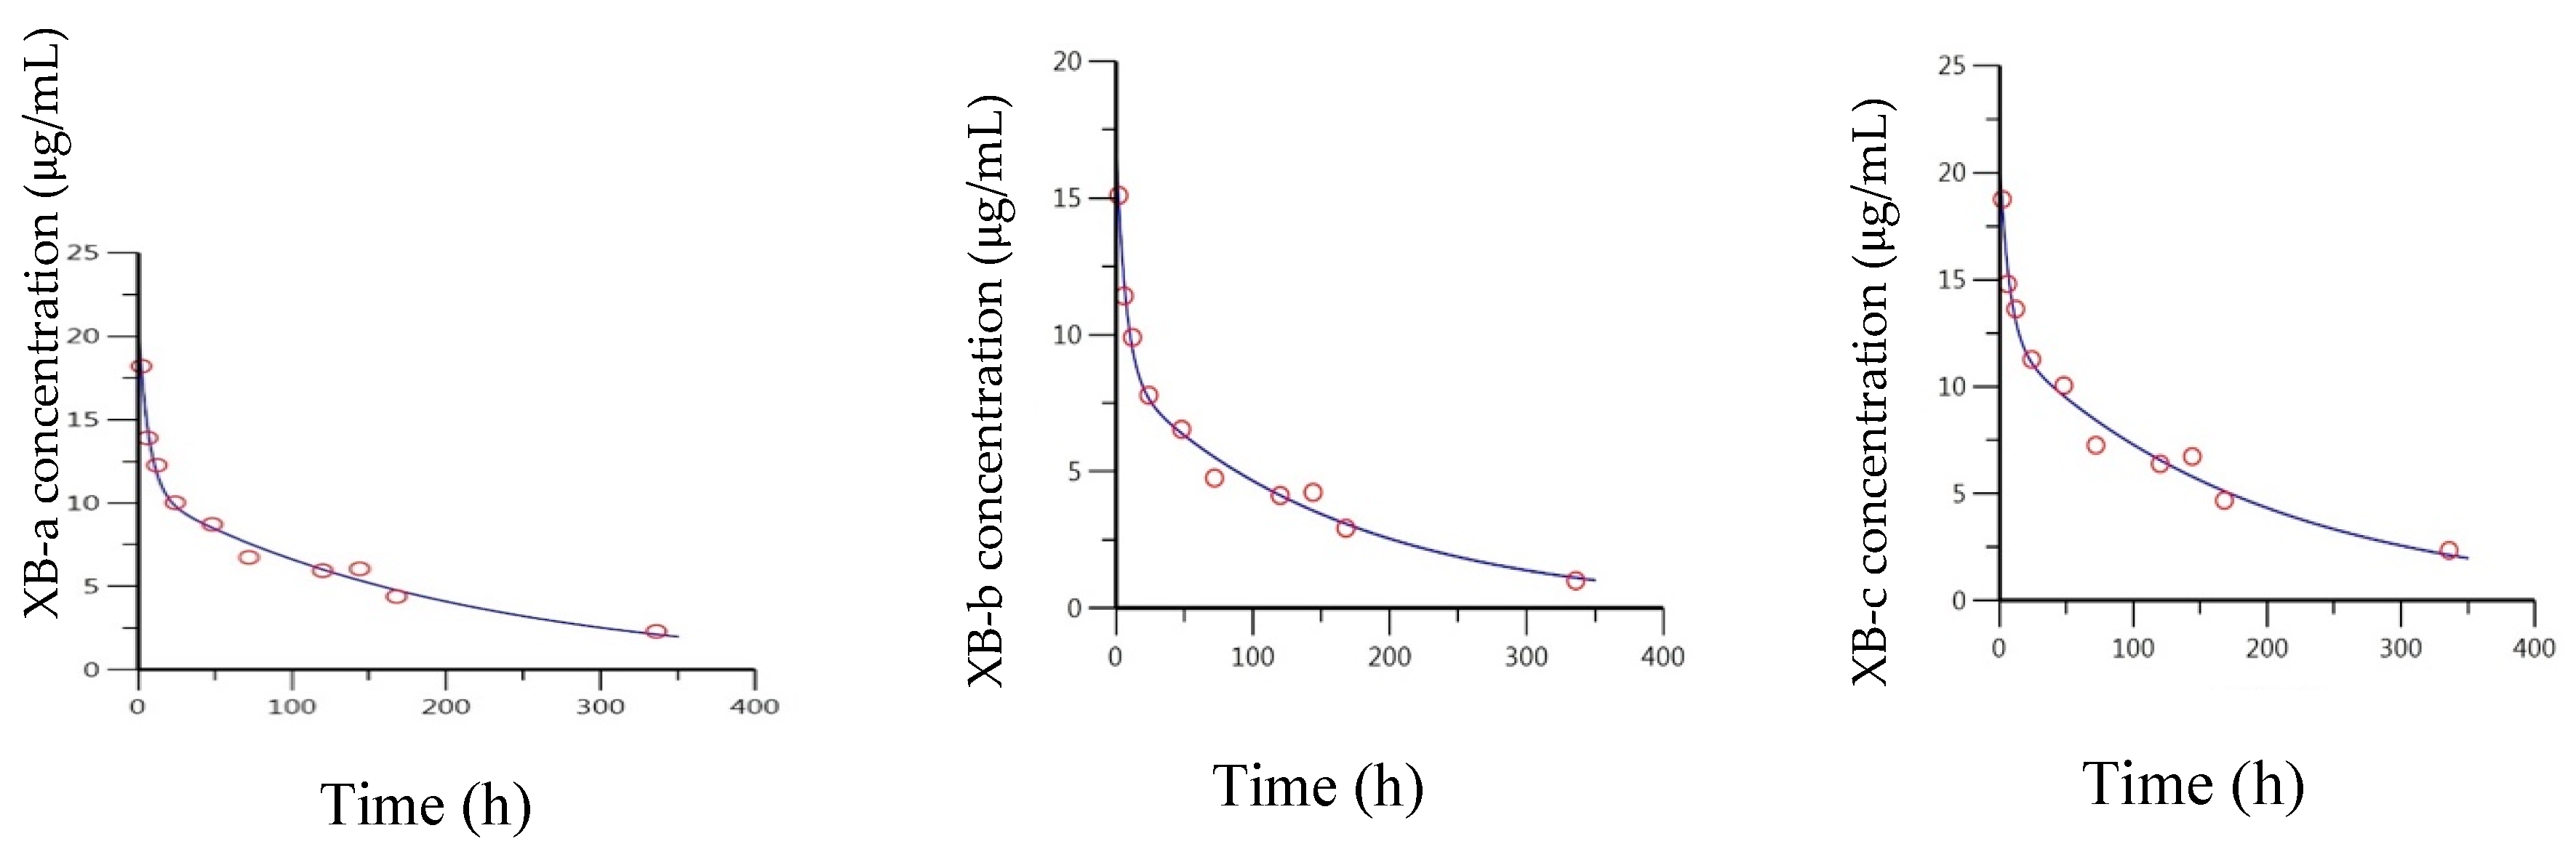
2.3. Pharmacokentics Following Intravenous (IV) Administration of Anti-BoNT/B mAbs

The anti-BoNT/B mAbs exhibited less variability between constituent antibodies compared to the anti-BoNT/A mAbs and were more amenable to modeling. A biphasic curve is observed for all three mAbs. Additionally, the concentration–time curves suggest similar distribution and elimination rates for all the antibodies, as all curves are parallel; XB-a and XB-c are nearly superimposable (Figure 4). The kinetics appear to diverge from the model after 336 h; however, the same phenomenon of rapidly decreasing concentrations is observed. The concentration–time data for the anti-BoNT/B mAbs were analyzed by fitting a two-compartment model through 336 h, to determine the intrinsic PK parameters. Estimates of exposure and bioavailability were derived based on a non-compartmental model.
The measured versus predicted concentration for all three anti BoNT/B mAbs is presented in Figure 5. All three models are nearly identical, with a clear distribution phase through 24 h, before the terminal phase becomes apparent. Based on the model, XB-b appears to have a slightly decreased C0 of 17.2 μg/mL, compared to 20.7 μg/mL for XB-a and XB-c. This is potentially due to a difference in dosing, as the entire XB-b curve is shifted slightly lower compared to the two other curves. The derived parameters from all three curves are in good agreement with each other (Table 2). Estimates of elimination half-life ranged from 59.4 to 81.1 h, β-phase half-lives ranged from 115 to 144 h, and AUC estimates ranged from 1470 to 2420 h*μg/mL for each of the XB antibodies.
Noncompartmental analysis of the concentration–time data provided similar estimates to the compartmental model for IV administration. Since so many timepoints were used in the estimation of the terminal phase, the significantly lower concentration at 504 h of the XB mAbs (Figure 4) did not greatly affect estimates. Terminal phase half-lives of 69.5, 49.6, and 77.2 h were estimated for XB-a, XB-b, and XB-c, respectively. Similar estimates of exposure were also determined compared to the compartmental data; 2060, 1380, and 2220 h*μg/mL for XB-a, XB-b, and XB-c, respectively.

2.4. Pharmacokentics Following Intramuscular (IM) Administration of XB mAbs

Following IM administration, the anti-BoNT/B mAbs were absorbed faster than the XA mAbs. Like the XA mAbs, after Cmax a biphasic profile was not observed, thus a 1-compartment extravascular model fit the data better than a 2-compartment model. In addition, measurable concentrations were observed at 336 h for all three mAbs; however, the 168 h timepoint was again the inflection point for a change in clearance (Figure 4). Therefore, the data were modeled in the same manner as the anti-BoNT/A mAbs, with a compartmental model to estimate the intrinsic PK parameters and a noncompartmental analysis for measured values.
The measured versus predicted concentrations for all three mAbs are presented in Figure 6, and a summary of the PK parameters is provided in Table 3 and Table 4. All three mAbs exhibited very similar absorption and elimination profiles; again, with the XB-a and XB-c profiles essentially superimposed and the XB-b profile shifted slightly downward. The anti-BoNT/B mAbs were absorbed, approximately, twice as fast as the anti-BoNT/A mAbs, with absorption half-lives of 6.71, 5.59, and 8.08 h, for XB-a, XB-b, and XB-c, respectively. The corresponding Tmax estimates were 36.1, 31.0, and 40.7 h, respectively. Elimination half-lives were very consistent, with estimates of 254, 237, and 236 h, respectively, for XB-a, XB-b, and XB-c, as reflected in the essentially parallel curves of Figure 6. The resulting AUCs were also very similar; 3310, 2300, and 3570 h*μg/mL, for XB-a, XB-b, and XB-c, respectively.
Due to the sharp decrease in concentration for all three mAbs at 336 h, the estimated terminal phase half-lives were greatly reduced in the noncompartmental analysis. For XB-a, XB-b, and XB-c, estimates of 38.1, 26.5, and 46.3 h were calculated, which were approximately 5- to 8-fold lower than those estimated from the compartmental analysis. Corresponding AUClast estimates were 1670, 1210, and 1890 h*μg/mL. When these estimates of exposure were compared to those for IV, bioavailability estimates of 81%, 88%, and 85% were calculated for XB-a, XB-b, and XB-c, respectively. These estimates are similar but slightly lower than those for the anti-BoNT/A mAbs.

2.5. Correlation of Pharmacokinetics and MNA for Anti-BoNT/A and /B mAbs

The concentration of the mAbs measured by ELISA or ECL was compared with that measured by MNA. Blood samples were collected at 6, 12, 24, 48, and 336 h (14 days) post-dosing, following either IV or IM administration. After anti-BoNT/A mAb IM administration, the NAC increased from 5.3 Units/mL at 6 h to 19 Units/mL at 48 h post-administration and then decreased to less than 0.14 Units/mL at 336 h (Figure 7). The NAC 6 h after anti-BoNT/A mAb IV administration was 16 Units/mL and remained elevated at 12 h, 24 h, and 48 h, with values of 17, 12, and 20 Units/mL, respectively, before decreasing to 1.4 Units/mL at 336 h. For anti-BoNT/B mAbs administered IM, the average NAC increased, from 10 Units/mL at 6 h to 30 U/mL at 24 h. The NAC remained at 29 Units/mL at 48 h and decreased to less than 0.45 Units/mL at 336 h. The anti-BoNT/B mAbs administered IV had a NAC of 31 Units/mL at 6 h post-administration. Overall, the NAC per group remained elevated at 12, 24, and 48 h, with values of 39, 23, and 33 Units/mL, respectively. The NAC decreased to less than 5.3 Units/mL at 336 h.
Since the serum drug concentration is independent of the route of administration, the antibody concentrations at each timepoint were compared to the average NAC from both IV and IM assays. Total antibody concentrations (XA-a, XA-b, and XA-c, or XB-a, XB-b, and XB-c) at each timepoint, as determined using ELISA or ECL, respectively, were compared to the average NAC. The NAC values and mAb concentration values were then plotted. The individual mAb concentrations correlated well with the average NAC, indicating a linear correlation between circulating antibody and the protection observed, as measured by the NAC (Figure 8). For all mAbs, the slope was significantly different from zero, p < 0.0001 and the correlations were significant (alpha = 0.05). Parameters from linear regression analyses are shown in Table 5. The R2 for XA-a was 0.6934, for XA-b was 0.5765, and for XA-c was 0.6795. The correlation between average NAC and MNA was stronger for the anti-B mAbs. The R2 for XB-a was 0.8012, for XB-b was 0.7659, and for XB-c was 0.821.
The average NAC is a result of the three circulating antibodies, due to the mechanism of action [17], thus the concentrations of the three anti-BoNT/A and anti-BoNT/B were averaged and plotted against the average NAC to determine the correlation (Figure 7). As the average NAC increases, the molecular concentration increases, establishing a significant correlation between the circulating antibody concentration and protection, indicated by the average NAC observed. For both anti-A and anti-B mAbs, the slope is significantly different from zero, p < 0.0001 and the correlations are significant (alpha = 0.05).
It was previously shown that the concentration of each of the six antibodies that comprise G03-52-01 demonstrate peak or near-peak mAb serum concentrations 48 h after IM injection in guinea pigs [26] and that the antibody concentrations of each of the antibodies could be detected up to 28 days post-IM injection. Here, we found NAC up to 14 days post-IM injections, with doses of 1.5 mg/animal for anti-BoNT/A and 1.5 mg of anti-BoNT/B mAbs, which are correlated with the efficacy and mouse NAC determinations.

3. Discussion

Botulism is a neuroparalytic syndrome that can progress to respiratory failure and death without rapid treatment [34]. Passive immunization against botulism can be achieved by administering neutralizing antibodies [35,36,37]. The only FDA approved therapies, polyclonal antibodies such as botulinum immune globulin (BIG-IV) [38] and BAT® [39], have severe limitations [40,41] that can be overcome by recombinant mAbs.
MNA is the gold standard method for determining the potency of an antitoxin and is used to demonstrate the NAC for a given sample [42]. However, the mouse bioassay requires hundreds of animals a week to perform, is expensive, and is subject to the significant variability inherent in a bioassay. Thus, a more rapid in vitro method to determine the potency of antitoxin mAbs would be a considerable advance in the development of these antibody drugs.
Here, we correlated the MNA and the average NAC measured with the circulating antibody concentration for anti-BoNT/A and anti-BoNT/B mAbs delivered via IM and IV. Comparison of the NAC and measured circulating antibody concentration allows for the establishment of a correlation between the presence of antibody in the sera and the NAC. Circulating antibodies, as determined by ELISA or ECL, and neutralizing antibodies, as determined by the MNA, reached a peak concentration in guinea pigs within 48 h post-administration, and the correlation with the average NAC measured demonstrates the causative effect of the antibodies in circulation. This correlation provides evidence in support of the use of circulating antibody concentration as measured by ECL or ELISA as a replacement for the MNA.
All the anti-BoNT/B antibodies exhibited a dramatic change in kinetics between 336 and 504 h (Figure 4), when the long terminal half-lives that are characteristic of mAbs abruptly decreased. The timing and effect on the concentration–time profile is consistent with an ADA response that occurred at approximately the same time and was independent of the route of administration. While we did not measure ADA in the guinea pig, we did measure ADA in rat [43]. There is no expectation that guinea pigs would be unique in not generating ADA. The effect of ADA would be to reduce the drug antibodies from circulation and because they would not bind to toxin, they would not interfere with the ECL or ELISA. From the PK analysis, the anti-BoNT/A mAbs exhibited a greater physiological variability than the anti-BoNT/B mAbs. Each of the six IgG1 antibodies studied here has the same constant region, with different variable regions. The reason for the variation in PK for each antibody is unknown. This can be seen in the widely variable distribution phases following IV administration, as shown in Figure 2. The same was observed following IM injection of the anti-BoNT/A mAbs (Figure 3). The absorption and elimination profiles are variable for each antibody, resulting in three dissimilar curves. Due to this, the exposure to each antibody was highly variable: 1020–2410 h*μg/mL (IV, non-compartmental analysis), 1430–6330 h*μg/mL (IV, compartmental analysis), 627–2260 h*μg/mL (IM, non-compartmental analysis), and 781–4000 h*μg/mL (IM, compartmental analysis). The concentration–time profiles for anti-BoNT/B mAbs, on the other hand, were nearly superimposable following both IV and IM administration (Figure 4). The XB-b profile was consistently below the other two curves, but resulted in similar Cmax and AUC estimates, independently of the route of administration or method of analysis.

4. Conclusions

This work continues previous efficacy investigations with three antibody combinations to BoNT serotypes A and B, which were shown to completely protect guinea pigs against lethal aerosolized doses of BoNT/A and BoNT/B [26]. To protect against BoNT/A and BoNT/B intoxication, a single cocktail of antibodies has been co-formulated in a lyophilized presentation, delivered IM for ease and speed of delivery.
The statistically significant correlation of the circulating antibody concentration with the serum NAC has been demonstrated in this study. Limitations of the MNA for PK modeling include intrinsic variability of the assay, high cost, long assay time, and the requirement for large numbers of animals. This study provides evidence to support the use of the measurement of the circulating antibody concentration as a surrogate for the MNA.

5. Materials and Methods

5.1. Antibodies

An oligoclonal mixture of six IgG monoclonal antibodies (mAbs) against BoNT/A and BoNT/B, G03-52-01, comprised of a lyophilized, equimolar mixture of mAbs XA-a, XA-b, XA-c, and mAbs XB-a, XB-b, XB-c [24,25,26,27,28,44].

5.2. Animals and Animal Welfare

For the PK studies, a total of 108 male and female guinea pigs (Cavia porcellus, Crl: [HA]Br) purchased from the Charles River Laboratory were used. Guinea pigs were individually housed, with ad lib PMI, Inc., guinea pig chow and water, as previously described [36], except that a 12 h light–dark cycle was used. At the end of the study guinea pigs were euthanized by CO2 gas.
For the MNA studies, 240 male CD-1 (ICR) mice (Mus musculus) purchased from the Charles River Laboratory and weighing 17 to 23 g were used. Mice were individually housed with ad lib PMI, Inc. rodent chow and water under the same conditions as the guinea pigs. Mice that survived the 96 ± 2-h post-challenge observation period were euthanized by CO2 gas.
The research was conducted in compliance with the Animal Welfare Act (AWA, 7 U.S.C. §2131, 2002, 2007, and 2008) and other federal statutes and regulations relating to animals and experiments involving animals and adhered to the principles stated in the Guide for the Care and Use of Laboratory Animals (Battelle Biomedical Research Center, Columbus, OH, USA, Protocol Number 91734, approved 6 December 2017). Battelle Biomedical Research Center provides the only FDA approved, statistically validated MNA for determining anti-BoNT antibody concentrations (NACs) in the United States [16]. All animal procedures were conducted under protocols approved by the Institutional Animal Care and Use Committees (IACUC) of Battelle Biomedical Research Center, in accordance with IACUC guidelines [45]. General procedures for animal care and housing were in accordance with the Association for Assessment and Accreditation of Laboratory Animal Care International (AAALAC) recommendations.

5.3. Pharmacokinetics (PK)

PK profiles of circulating anti-BoNT/A antibodies were assessed using an enzyme-linked immunosorbent assay (ELISA). The levels of circulating Anti-BoNT/B antibodies were assessed using an electrochemiluminescence (ECL) assay, as described [26]. Guinea pigs (Cavia porcellus, Crl: [HA]Br) were studied in three cohorts, PBS, G03-52-01 at doses of 3 mg/animal delivered by IM or IV. A total of 108 male and female guinea pigs were used (12 controls, 48 each for IV and IM administration of G03-52-01). Samples were analyzed for PK with the ECL or ELISA assay at timepoints of 2 h, 6 h, 12 h, 24 h, 48 h, 72 h, 120 h, 168 h, 336 h, 504 h, 672 h, 840 h, 1008 h, 1344 h, and 1680 h. Due to the large volume of samples required to perform the MNA, samples were analyzed at timepoints of 0, 6, 12, 24, 48 h, and 14-day post-antibody dose using the MNA. The amount of toxin neutralization afforded by the antibodies NAC was assessed using the MNA with BoNT/A1 and BoNT/B1, with concomitant ECL/ELISA mAb concentration measurements for the PK.

5.4. Electrochemiluminescence (ECL) Assay for Anti-BoNT/B mAbs

The levels of circulating Anti-BoNT/B antibodies, XB-a, XB-b, and XB-c, were assessed using an electrochemiluminescence (ECL) assay. The ECL method to measure mAb concentration in guinea pig serum is based on a bridging immunoassay using the Meso Scale Discovery (MSD) electrochemiluminescence (ECL) format [26,27,44]. The antibody specific domains used are recombinant domains of BoNT/A or /B [24,25]. Biotinylated and ruthenylated domains were used as the capturing and detecting reagents for the assay, respectively. The assay uses the bivalent binding capability of the antibodies to form a bridging complex with biotinylated domain and ruthenylated domain to generate ECL signals for the measurement of the target antibody concentration in serum.
Briefly, a solution of reaction mixture containing both biotinylated domain and ruthenylated domain plus either calibration standards, assay acceptance controls, or study samples was incubated for 1 h at room temperature on an orbital shaker and shielded from light. The calibration standards and assay acceptance controls were prepared using drug products G03-52-01 containing six mAbs XA-a, XA-b, XA-c, XB-a, XB-b, and XB-c [24,25]. The standards were prepared by spiking G03-52-01 into neat guinea pig serum to make the highest concentration standard sample at 500 ng/mL (1 X assay concentration). The subsequent standard points were prepared as described [26].
Three separate assay methods were used to measure concentrations of the anti-BoNT/B mAbs, XB-a, XB-b, and XB-c in guinea pig serum. In each method standards, controls, and samples were diluted at the minimum required dilution of 1:20, with some samples being further diluted into the standard curve range. Each diluted standard, control, and sample was then combined with a solution containing the biotin labeled and ruthenium labeled forms of one of three recombinant domains of BoNT/B in a 96-well polypropylene plate and incubated for 12 to 18 h at room temperature on a shaker shielded from light. Once this incubation had been completed samples were transferred from the polypropylene plate to a streptavidin plate blocked with Blocking Buffer and incubated for an additional 2 h at room temperature on the shaker. The plate was washed and 2X read buffer was added to the plate before reading on the MSD Meso QuickPlex SQ 120.
The MSD instrument detected the chemiluminescent signal generated when an electric current was applied. The resulting signal was measured in ECL units. The calibration curve was plotted using a 4-parameter logistic curve fit using 1/y2 weighting. The concentrations of each analyte in the quality control (QC) and study samples were interpolated from the calibration curve generated.

5.5. ELISA Assay for Anti-BoNT/A mAbs

Three separate enzyme-linked immunosorbent assay (ELISA) methods were used to measure concentrations of the BoNT/A mAbs, XA-a, XA-b, and XA-c in guinea pig serum, as previously described [25] with modifications. In the XA-a, XA-b, and XA-c assay, the domains were coated at concentrations of 1.0 µg/mL, 20.0 µg/mL, and 5.0 µg/mL; these are recombinant domains of botulinum toxin A. Nunc Maxisorp 96-well plates are used in each assay. After a coat incubation period of 12–24 h, each plate was washed and blocked for 1–4 h. Standards, controls, and samples were diluted at the minimum required dilution of 1:20, with some samples being further diluted into the standard curve range. Diluted standards, controls, and samples were added to the coated and blocked plate for three hours at room temperature on a shaker. During sample incubation, the XA-a, XA-b, and XA-c antibodies in guinea pig serum bind with the coated domains. The plate was then washed and goat anti-human IgG (H + L)-HRP was added to the plate and incubated for an additional hour. The plate was washed and 3,3′,5,5′-Tetramethylbenzidine (TMB) substrate solution was added to the plate and incubated in the dark for approximately 20 min before the addition of stop solution. The plate was read on a microplate reader at 450 nm for detection and 630 nm for reference.
A calibration curve was generated from the resulting absorbance values and plotted using a 4-parameter logistic curve fit using 1/y2 weighting. The concentrations of each analyte in the QCs and study samples were interpolated from the calibration curve generated.

5.6. Measurement of Neutralizing Antibody Concentration (NAC) and Mouse Neutralization Assay (MNA)

NACs were determined using a standardized and statistically-validated MNA based on methods developed by Cardella and Hatheway and Dang [46,47], as described previously [26]. Male CD-1 (ICR) mice (Mus musculus) purchased from the Charles River Laboratory and weighing 17 to 23 g were used for the MNA. A total of 240 mice were used (five timepoints x ten mice per group x two serotypes x two routes of administration, plus controls). The BoNT challenge materials were dilutions of the complex form of BoNT/A subtype A1 and BoNT/B subtype B1 purchased from Metabiologics (Madison, WI, USA). The BoNT/A1 was produced from a C. botulinum Hall A strain. The BoNT/B1 was produced from the C. botulinum Okra strain. BoNT and samples for the mouse neutralization assays (MNA) were diluted in 30 mM phosphate buffered saline (PBS, pH 6.2) containing 0.2% (w/v) gelatin. Eight, four-fold dilutions were prepared for each serum sample. The antitoxin reference standards and guinea pig serum samples were titrated against a fixed amount of BoNT (31 mouse LD50/mL for BoNT/A1 and 19 mouse LD50/mL for BoNT/B1), incubated for 60 to 120 min at room temperature and 0.2 mL was injected IP into mice. The NAC was calculated as the ratio of the effective dose at which 50% of the animals survived (ED50) of the standard curve, over the ED50 of the test curve.

5.7. Statistical Methods

For each MNA, probit analysis was used to fit a dose–response curve to the proportion of mice dead as a function of the base 10 logarithm of the antibody concentration. The NAC for each sample was estimated from the probit curves for the samples and associated reference standard. The ED50 of the associated standard was divided by the ED50 for the assay corresponding to the test sample.
For assays that failed due to excessive mortality, sample-specific lower limits of quantitation (LLOQs) were derived from hypothetical MNAs, in which the test curve just met the assay acceptance criteria and had the largest ED50 obtainable within the range of antibody concentrations tested. The observed standard curve ED50 (from the standard curve run concurrently with the test sample) was also incorporated, to allow for day-to-day variation in the performance of the assay. Thus, the LLOQ was calculated as the observed standard curve ED50 divided by the hypothetical test curve ED50. An adjusted NAC was then calculated with a value equal to one-half the LLOQ for the test curve.
The arithmetic mean was calculated for each BoNT serotype, dose route, and control or treatment group. To determine the average NAC per group, the sum of the individual NACs was divided by the total number of assays that passed the assay control acceptance criteria.
Linear regression and correlation analysis was performed using Prism 9.0 (GraphPad Software LLC, San Diego, CA). The data point at 0.0 was included in the linear regression. Pearson correlation and two-tailed p values were calculated using Prism 9.0.

Author Contributions

M.T.T. funding acquisition, designed experiments, analyzed data, and wrote and edited manuscript; E.S.S., N.N., D.K., Y.E., Z.M., K.P. performed experiments and analyzed data; R.R.C. funding acquisition, designed experiments, analyzed data, and wrote and edited the manuscript; D.M.S. designed experiments, analyzed data, and edited manuscript; M.J.H. analyzed data; S.F.-J.—Wrote and edited the manuscript and analyzed data, and J.D.M. edited the manuscript. All authors have read and agreed to the published version of the manuscript.

Funding

This research was funded by a contract from the Joint PEO Chemical and Biological Defense DOD-Army-USASC, contract number W15QKN1691002.

Institutional Review Board Statement

Not applicable.

Informed Consent Statement

Not applicable.

Data Availability Statement

We have not disclosed the sequences of the antibodies described here because their intended use is for biodefense. All other data is included in this manuscript.

Conflicts of Interest

The authors of this paper are either employees of National Resilience, Inc. or were paid by National Resilience, Inc via this contract to perform this work. The funders had no role in the design of the study; in the collection, analyses, or interpretation of data; in the writing of the manuscript, or in the decision to publish the results.

Abbreviations

ADAAnti-drug antibody
AUCArea under the curve
AUCinfArea under the curve from zero timepoint extrapolated to infinity
AUClastArea under the curve from zero timepoint to last measured timepoint
BAT®Trade name of equine heptavalent Botulinum antitoxin
BIGbotulinum immune globulin
BoNTBotulinum neurotoxin
BoNT/ABoNT serotype A
BoNT/BBoNT serotype B
BoNT/CBoNT serotype C
BoNT/DBoNT serotype D
BoNT/EBoNT serotype E
BoNT/FBoNT serotype F
C0Concentration at zero timepoint (immediately after injection)
CmaxMaximal concentration
CIConfidence interval
ECLElectrochemiluminescence
ED50Effective dose at which 50% of the animals survived
ELISAEnzyme-linked immunosorbent assay
F absFraction absorbed (bioavailability)
FDAFood and Drug Administration
ICCVAMInteragency Coordinating Committee on the Validation of Alternative Methods
IMIntramuscular
IPIntraperitoneal
IVIntravenous
LLOQLower limit of quantitation
mAbMonoclonal antibody
MNAMouse neutralization assay
MSDMeso Scale Discovery
NACNeutralizing antibody concentration
NICEATMNational Toxicology Program Interagency Center for the Evaluation of Alternative Methods
NIHNational Institute of Health
PBSPhosphate buffered saline
PKPharmacokinetic
QCQuality control
t½ absAbsorption rate half life
t½ elimElimination rate half-life
TMB3,3′,5,5′-Tetramethylbenzidine
XA-amonoclonal antibody that binds BoNT/A component of G03-52-01
XA-bmonoclonal antibody that binds BoNT/A component of G03-52-01
XA-cmonoclonal antibody that binds BoNT/A component of G03-52-01
XB-amonoclonal antibody that binds BoNT/B component of G03-52-01
XB-bmonoclonal antibody that binds BoNT/B component of G03-52-01
XB-cmonoclonal antibody that binds BoNT/B component of G03-52-01

References

  1. Gupta, A.; Sumner, C.J.; Castor, M.; Maslanka, S.; Sobel, J. Adult botulism type F in the United States, 1981–2002. Neurology 2005, 65, 1694–1700. [Google Scholar] [CrossRef] [PubMed]
  2. Hibbs, R.G.; Weber, J.T.; Corwin, A.; Allos, B.M.; El Rehim, M.S.A.; Sharkawy, S.E.; Sarn, J.E.; McKee, K.T., Jr. Experience with the use of an investigational F(ab’)2 heptavalent botulism immune globulin of equine origin during an outbreak of type E botulism in Egypt. Clin. Infect. Dis. 1996, 23, 337–340. [Google Scholar] [CrossRef]
  3. Jalava, K.; Selby, K.; Pihlajasaari, A.; Kolho, E.; Dahlsten, E.; Forss, N.; Backlund, T.; Korkeala, H.; Honkanen-Buzalski, T.; Hulkko, T.; et al. Two cases of food-borne botulism in Finland caused by conserved olives, October 2011. Eurosurveillance 2011, 16, 20034. [Google Scholar] [CrossRef] [PubMed] [Green Version]
  4. Pingeon, J.M.; Vanbockstael, C.; Popoff, M.R.; King, L.A.; Deschamps, B.; Pradel, G.; Dupont, H.; Spanjaard, A.; Houdard, A.; Mazuet, C.; et al. Two outbreaks of botulism associated with consumption of green olive paste, France, September 2011. Eurosurveillance 2011, 16, 20035. [Google Scholar] [CrossRef] [PubMed] [Green Version]
  5. Gill, D.M. Bacterial toxins: A table of lethal amounts. Microbiol. Rev. 1982, 46, 86–94. [Google Scholar] [CrossRef] [PubMed]
  6. Schechter, R.; Arnon, S.S. Extreme potency of botulinum toxin. Lancet 2000, 355, 237–238. [Google Scholar] [CrossRef]
  7. Lacy, D.B.; Stevens, R.C. Sequence homology and structural analysis of the clostridial neurotoxins. J. Mol. Biol. 1999, 291, 1091–1104. [Google Scholar] [CrossRef]
  8. Hatheway, C.L. Toxigenic clostridia. Clin. Microbiol. Rev. 1990, 3, 66–98. [Google Scholar] [CrossRef] [PubMed]
  9. Hatheway, C.L. Clostridium botulinum and other clostridia that produce botulinum neurotoxin. In Ecology and Control in Foods; Hauschild, A.H.W.D., Karen, L., Eds.; Marcel Dekker: New York, NY, USA, 1993; pp. 3–20. [Google Scholar]
  10. Barash, J.R.; Arnon, S.S. A novel strain of Clostridium botulinum that produces type B and type H botulinum toxins. J. Infect. Dis. 2014, 209, 183–191. [Google Scholar] [CrossRef] [PubMed] [Green Version]
  11. Maslanka, S.E.; Lúquez, C.; Dykes, J.K.; Tepp, W.H.; Pier, C.L.; Pellett, S.; Raphael, B.H.; Kalb, S.R.; Barr, J.R.; Rao, A. A novel botulinum neurotoxin, previously reported as serotype H, has a hybrid-like structure with regions of similarity to the structures of serotypes A and F and is neutralized with serotype A antitoxin. J. Infect. Dis. 2016, 213, 379–385. [Google Scholar] [CrossRef] [PubMed]
  12. Moller, V.; Scheibel, I. Preliminary report on the isolation of an apparently new type of CI. botulinum. Acta Pathol. Microbiol. Scand. 1960, 48, 80. [Google Scholar] [CrossRef]
  13. Arnon, S.S.; Schechter, R.; Inglesby, T.V.; Henderson, D.A.; Bartlett, J.G.; Ascher, M.S.; Eitzen, E.; Fine, A.D.; Hauer, J.; Layton, M.; et al. Botulinum toxin as a biological weapon: Medical and public health management. JAMA 2001, 285, 1059–1070. [Google Scholar] [CrossRef]
  14. Dembek, Z.F.; Smith, L.A.; Rusnak, J.M. Botulism: Cause, effects, diagnosis, clinical and laboratory identification, and treatment modalities. Disaster Med. Public Health Prep. 2007, 1, 122–134. [Google Scholar] [CrossRef]
  15. Sobel, J. Botulism. Clin. Infect. Dis. 2005, 41, 1167–1173. [Google Scholar] [CrossRef]
  16. Khouri, J.M.; Motter, R.N.; Arnon, S.S. Safety and immunogenicity of investigational recombinant botulinum vaccine, rBV A/B, in volunteers with pre-existing botulinum toxoid immunity. Vaccine 2018, 36, 2041–2048. [Google Scholar] [CrossRef]
  17. Nowakowski, A.; Wang, C.; Powers, D.B.; Amersdorfer, P.; Smith, T.J.; Montgomery, V.A.; Sheridan, R.; Blake, R.; Smith, L.A.; Marks, J.D. Potent neutralization of botulinum neurotoxin by recombinant oligoclonal antibody. Proc. Natl. Acad. Sci. USA 2002, 99, 11346–11350. [Google Scholar] [CrossRef] [PubMed] [Green Version]
  18. Fan, Y.; Dong, J.; Lou, J.; Wen, W.; Conrad, F.; Geren, I.N.; Garcia-Rodriguez, C.; Smith, T.J.; Smith, L.A.; Ho, M. Monoclonal antibodies that inhibit the proteolytic activity of botulinum neurotoxin serotype/B. Toxins 2015, 7, 3405–3423. [Google Scholar] [CrossRef] [PubMed] [Green Version]
  19. Garcia-Rodriguez, C.; Razai, A.; Geren, I.N.; Lou, J.; Conrad, F.; Wen, W.H.; Farr-Jones, S.; Smith, T.J.; Brown, J.L.; Skerry, J.C.; et al. A Three Monoclonal Antibody Combination Potently Neutralizes Multiple Botulinum Neurotoxin Serotype E Subtypes. Toxins 2018, 10, 105. [Google Scholar] [CrossRef] [Green Version]
  20. Fan, Y.; Garcia-Rodriguez, C.; Lou, J.; Wen, W.; Conrad, F.; Zhai, W.; Smith, T.J.; Smith, L.A.; Marks, J.D. A three monoclonal antibody combination potently neutralizes multiple botulinum neurotoxin serotype F subtypes. PLoS ONE 2017, 12, e0174187. [Google Scholar] [CrossRef] [PubMed]
  21. Marks, J.D. Deciphering antibody properties that lead to potent botulinum neurotoxin neutralization. Mov. Disord. Off. J. Mov. Disord. Soc. 2004, 19, S101–S108. [Google Scholar] [CrossRef]
  22. Rasetti-Escargueil, C.; Avril, A.; Miethe, S.; Mazuet, C.; Derman, Y.; Selby, K.; Thullier, P.; Pelat, T.; Urbain, R.; Fontayne, A. The european AntibotABE framework program and its update: Development of innovative botulinum antibodies. Toxins 2017, 9, 309. [Google Scholar] [CrossRef] [Green Version]
  23. Casadevall, A. Passive antibody administration (immediate immunity) as a specific defense against biological weapons. Emerg. Infect. Dis. 2002, 8, 833. [Google Scholar] [CrossRef] [PubMed]
  24. Meng, Q.; Garcia-Rodriguez, C.; Manzanarez, G.; Silberg, M.A.; Conrad, F.; Bettencourt, J.; Pan, X.; Breece, T.; To, R.; Li, M.; et al. Engineered domain-based assays to identify individual antibodies in oligoclonal combinations targeting the same protein. Anal. Biochem. 2012, 430, 141–150. [Google Scholar] [CrossRef] [PubMed] [Green Version]
  25. Meng, Q.; Li, M.; Silberg, M.A.; Conrad, F.; Bettencourt, J.; To, R.; Huang, C.; Ma, J.; Meyer, K.; Shimizu, R.; et al. Domain-based assays of individual antibody concentrations in an oligoclonal combination targeting a single protein. Anal. Biochem. 2012, 421, 351–361. [Google Scholar] [CrossRef] [PubMed] [Green Version]
  26. Tomic, M.T.; Espinoza, Y.; Martinez, Z.; Pham, K.; Cobb, R.R.; Snow, D.M.; Earnhart, C.G.; Pals, T.; Syar, E.E.; Niemuth, N.; et al. Monclonal antibody combinations prevent serotype A and serotype B inhalational botulism in a guinea pig model. Toxins 2019, 11, 208. [Google Scholar] [CrossRef] [PubMed] [Green Version]
  27. Nayak, S.U.; Griffiss, J.M.; McKenzie, R.; Fuchs, E.J.; Jurao, R.A.; An, A.T.; Ahene, A.; Tomic, M.; Hendrix, C.W.; Zenilman, J.M. Safety and pharmacokinetics of XOMA 3AB, a novel mixture of three monoclonal antibodies against botulinum toxin A. Antimicrob. Agents Chemother. 2014, 58, 5047–5053. [Google Scholar] [CrossRef] [PubMed] [Green Version]
  28. Guptill, J.; Raja, S.; Juel, V.; Walter, E.; Cohen-Wolkowiez, M.; Hill, H.; Sendra, E.; Hauser, B.; Jackson, P.; Swamy, G. Safety, Tolerability and Pharmacokinetics of NTM-1632, a Novel Mixture of Three Monoclonal Antibodies against Botulinum Toxin B. Antimicrob. Agents Chemother. 2021, 65, e0232920. [Google Scholar] [CrossRef]
  29. Snow, D.M.; Riling, K.; Kimbler, A.; Espinoza, Y.; Wong, D.; Pham, K.; Martinez, Z.; Kraus, C.N.; Conrad, F.; Garcia-Rodriguez, C.; et al. Safety and Pharmacokinetics of a Four Monoclonal Antibody Combination Against Botulinum C and D Neurotoxins. Antimicrob. Agents Chemother. 2019, 63, e01270-19. [Google Scholar] [CrossRef] [Green Version]
  30. Franz, D.R.; Pitt, L.M.; Clayton, M.A.; Hanes, M.A.; Rose, K.J. Efficacy of prophylactic and therapeutic administration of antitoxin for inhalation botulism. In Botulinum and Tetanus Neurotoxins; Springer: New York, NY, USA, 1993; pp. 473–476. [Google Scholar]
  31. Gelzleichter, T.; Myers, M.; Menton, R.; Niemuth, N.; Matthews, M.; Langford, M. Protection against botulinum toxins provided by passive immunization with botulinum human immune globulin: Evaluation using an inhalation model. J. Appl. Toxicol. 1999, 19, S35–S38. [Google Scholar] [CrossRef]
  32. Interagency Coordinating Committee on the Validation of Alternative Methods. Report on the ICCVAM–NICEATM/ECVAM Scientific Workshop on Alternative Methods to Refine, Reduce, or Replace the Mouse LD50 Assay for Botulinum Toxin Testing. Available online: https://ntp.niehs.nih.gov/iccvam/docs/biologics-docs/bontwkshprept.pdf (accessed on 7 June 2021).
  33. Törnqvist, E.; Annas, A.; Granath, B.; Jalkesten, E.; Cotgreave, I.; Öberg, M. Strategic focus on 3R principles reveals major reductions in the use of animals in pharmaceutical toxicity testing. PLoS ONE 2014, 9, e101638. [Google Scholar] [CrossRef] [Green Version]
  34. Shapiro, R.L.; Hatheway, C.; Swerdlow, D.L. Botulism in the United States: A clinical and epidemiologic review. Ann. Intern. Med. 1998, 129, 221–228. [Google Scholar] [CrossRef]
  35. Barker, D.; Gillum, K.T.; Niemuth, N.A.; Kodihalli, S. Therapeutic efficacy of equine botulism heptavalent antitoxin against all seven botulinum neurotoxins in symptomatic guinea pigs. PLoS ONE 2019, 14, e0222670. [Google Scholar] [CrossRef]
  36. Emanuel, A.; Qiu, H.; Barker, D.; Takla, T.; Gillum, K.; Neimuth, N.; Kodihalli, S. Efficacy of equine botulism antitoxin in botulism poisoning in a guinea pig model. PLoS ONE 2019, 14, e0209019. [Google Scholar] [CrossRef] [PubMed]
  37. Kodihalli, S.; Emanuel, A.; Takla, T.; Hua, Y.; Hobbs, C.; LeClaire, R.; O’Donnell, D.C. Therapeutic efficacy of equine botulism antitoxin in Rhesus macaques. PLoS ONE 2017, 12, e0186892. [Google Scholar] [CrossRef] [PubMed]
  38. Arnon, S.S.; Schechter, R.; Maslanka, S.E.; Jewell, N.P.; Hatheway, C.L. Human Botulism Immune Globulin for the Treatment of Infant Botulism. N. Engl. J. Med. 2006, 354, 462–471. [Google Scholar] [CrossRef]
  39. Cangene Corp. BAT® [Botulism Antitoxin Heptavalent (A, B, C, D, E, F, G)—(Equine)] Sterile Solution for Injection. Available online: https://www.fda.gov/vaccines-blood-biologics/approved-blood-products/bat-botulism-antitoxin-heptavalent-b-c-d-e-f-g-equine (accessed on 16 September 2021).
  40. Jankovic, J.; Brin, M.F. Therapeutic uses of botulinum toxin. N. Engl. J. Med. 1991, 324, 1186–1194. [Google Scholar] [PubMed]
  41. Yu, P.A.; Lin, N.H.; Mahon, B.E.; Sobel, J.; Yu, Y.; Mody, R.K.; Gu, W.; Clements, J.; Kim, H.J.; Rao, A.K. Safety and Improved Clinical Outcomes in Patients Treated With New Equine-Derived Heptavalent Botulinum Antitoxin. Clin. Infect. Dis. 2017, 66, S57–S64. [Google Scholar] [CrossRef] [Green Version]
  42. Centers for Disease Control and Prevention, Botulism in the United States. In 1899–1996: Handbook for Epidemiologists, Clinicians, and Laboratory Workers; Centers for Disease Control and Prevention: Atlanta, GA, USA, 1998.
  43. Espinoza, Y.; Wong, D.; Ahene, A.; Der, K.; Martinez, Z.; Pham, J.; Cobb, R.R.; Farr-Jones, S.; Marks, J.; Tomic, M.T. Pharmacokinetics of human recombinant anti-botulinum toxin antibodies in rats. Toxins 2019, 11, 345. [Google Scholar] [CrossRef] [Green Version]
  44. Snow, D.M.; Cobb, R.R.; Martinez, J.; Finger-Baker, I.; Collins, L.; Terpening, S.; Syar, E.S.; Niemuth, N.; Kobs, D.; Barnewall, R.; et al. A monoclonal antibody combination against both serotypes A and B botulinum toxin prevents inhalational botulism in a guinea pig model. Toxins 2021, 13, 31. [Google Scholar] [CrossRef]
  45. USDA. Available online: https://www.nal.usda.gov/awic/institutional-animal-care-and-use-committees (accessed on 16 November 2020).
  46. Cardella, M.A. Botulism: Proceedings of a Symposium; U.S Department of Health, Education, Welfare, Public Service: Cincinnati, OH, USA, 1964.
  47. Hatheway, C.; Dang, C. Immunogenicity of the neurotoxins of Clostridium botulinum. In Therapy with Botulinum Toxin; Jankovic, J., Hallett, M., Eds.; Marcel Dekker: New York, NY, USA, 1994; Volume 25, pp. 93–107. [Google Scholar]
Figure 1. Concentration–time curves following IV (left) and IM (right) administration of 1.5 mg total antibody XA-a, XA-b, and XA-c; solid lines represent ELISA-measured concentrations and dashed lines represent predicted concentrations based on noncompartmental analysis of the data through 168 h.
Toxins 13 00671 g001
Figure 2. Concentration–time data for IV-administered XA-a, XA-b, and XA-c. Blue line indicates best line fit, based on a two-compartment model using Phoenix WinNonlin. A single point (t = 2 h) represents the distribution phase for XA-c, which biased the model to a large C0 of 66 μg/mL.
Toxins 13 00671 g002
Figure 3. Concentration–time data for IM-administered XA-a, XA-b, and XA-c. Blue line indicates best fit, based on a one-compartment model using Phoenix WinNonlin.
Toxins 13 00671 g003
Figure 4. Concentration–time curves following IV (left) and IM (right) administration of 1.5 mg total antibody XB-a, XB-b, and XB-c; solid lines represent ECL-measured concentrations. Dashed lines represent predicted concentrations, based on noncompartmental analysis of the data through 336 h (IV) or 168 h (IM).
Toxins 13 00671 g004
Figure 5. Predicted and observed concentration–time data for IV-administered XB-a, XB-b, and XB-c, based on a 2-compartment model fit by Phoenix WinNonlin.
Toxins 13 00671 g005
Figure 6. Predicted and observed concentration–time data for IM-administered XB-a, XB-b, and XB-c, based on a 2-compartment model fit by Phoenix WinNonlin.
Toxins 13 00671 g006
Figure 7. Comparison of anti-BoNT/A and /B mAbs average concentrations measured by ELISA or ECL and MNA. Measurements from animals dosed via IM and IV are combined for this analysis. The line was calculated from regression and included the 0, 0 datapoint. Regression and correlation parameters are shown in Table 5.
Toxins 13 00671 g007
Figure 8. Comparison of individual anti-BoNT/A and B mAbs concentrations measured by ELISA or ECL and average (avg.) neutralizing antibody concentration (NAC) from the mouse neutralization assay (MNA). Measurements from animals dosed via IM and IV are combined for this analysis. The line was calculated from regression and included the 0, 0 datapoint. Regression and correlation parameters are shown in Table 5. Error bars indicate standard deviation. Linear regression and correlation were calculated with Prism v9.0. 0, 0 data point included.
Toxins 13 00671 g008
Table 1. Pharmacokinetic parameters from compartmental analysis of anti-BoNT/A mAbs.
mAbDose (mg/kg), RouteModelC0 (μg/mL)Tmax (h)β-Phase t1/2 (h)t1/2 Abs (h)t1/2 Elim (h)AUCinf
(h*μg/mL)
XA-a3, IV2-compartment20.30365 2015880
XA-b2-compartment9.8305200 4476330
XA-c2-compartment66.9073.5 14.81430
XA-a3, IM1-compartment11.255.4 14.32024000
XA-b1-compartment5.9729.9 10.264.1781
XA-c1-compartment9.0742.0 13.878.21480
C0—the concentration immediately upon injection assuming instantaneous distribution throughout the central compartment; t1/2—half life; abs—absorption, elim—elimination; AUCinf—area under the curve from time zero extrapolated to infinity; Tmax—time for antibody to reach maximal concentration.
Table 2. Pharmacokinetic parameters from noncompartmental analysis of anti-BoNT/A mAbs.
mAbDose (mg/kg), RouteCmax
(μg/mL)
Tmax
(h)
t1/2 Elim (h)AUClast (h*μg/mL)FSimulated Concentration at 336 h Post-dose
(g/mL)
XA-a3, IV18.9635.22410 3880
XA-b9.75293.91020 -
XA-c16.4234.41390 569
XA-a3, IM11.37224.5226094%4170
XA-b5.76487362783%344
XA-c9.364830.4137099%1140
C0—the concentration immediately upon injection assuming instantaneous distribution throughout the central compartment; t1/2—half life; elim—elimination; AUClast—area under the curve from time zero to last measurable timepoint; Tmax—time for antibody to reach maximal concentration.
Table 3. Pharmacokinetic parameters from compartmental analysis of anti-BoNT/B mAbs.
Administration
Route
mAbDose (mg/kg)ModelC0
(μg/mL)
Tmax (h)β-Phase t1/2 (h)t1/2 Abs (h)t1/2 Elim (h)AUCinf (h*μg/mL)
IVXB-a32-compartment20.70144 77.12300
XB-b2-compartment17.2011559.41470
XB-c2-compartment20.7013381.12420
IMXB-a31-compartment8.1936.1 6.712543310
XB-b1-compartment6.1631.05.592372300
XB-c1-compartment9.340.78.082363570
C0—the concentration immediately upon injection, assuming instantaneous distribution throughout the central compartment; 1.5 mg total anti-BoNT/B mAbs administered t1/2—half life; elim—elimination.
Table 4. Pharmacokinetic parameters from non-compartmental analysis of anti-BoNT/B mAbs.
Administration RoutemAbDose (mg/kg)Cmax (μg/mL)Tmax (h)t1/2 Elim (h)AUClast (h*μg/mL)F
(%)
Simulated C336 (μg/mL)Simulated C504 (μg/mL)
IVXB-a318.2269.52060 1040
XB-b15.1249.61380361
XB-c18.8277.222201000
IMXB-a38.524838.11670814480
XB-b6.334826.51210882760
XB-c9.694846.31890854520
C336; C504—concentration at 336 and 504 h post-dose, respectively; 1.5 mg total anti-BoNT/B mAbs were administered; Cmax—the maximal concentration; Tmax—time that maximal concentration is observed; t1/2 elim—elimination half-life; AUClast—area under the curve from time zero to last measurable timepoint; F—fraction absorbed.
Table 5. Parameters from linear regression and correlation of individual mAb concentration from ELISA or ECL vs. neutralizing antibody concentration (NAC).
XA-aXA-bXA-cAll 3 Anti-A mAbsXB-aXB-bXB-cAll 3 Anti-B mAbs
Best fit Slope
(95% CI)
815.7
(614.0–1017)
453.8
(335.9–571.8)
618.9
461.4–776.5)
1888
(1428–2349)
324.8
(302.8–346.9)
253.6
(234–273.1)
358.3
(335.3–381.3)
880.3
(694.8–1066)
Goodness of fit38552289301180642169192222616605
R20.69340.57650.67950.69490.80120.76590.82100.7436
p value0.00280.01760.00360.00270.00050.00090.00030.0013
CI: Confidence interval. Linear regression and correlation calculated with Prism v9.0. The 0,0 data point included. Correlation was calculated using the average of replicates.
Publisher’s Note: MDPI stays neutral with regard to jurisdictional claims in published maps and institutional affiliations.

