The Effect of Experimental Fusarium Mycotoxicosis on Microbiota Diversity in Porcine Ascending Colon Contents

 , ,
, ,
Abstract
:1. Introduction
2. Results and Discussion

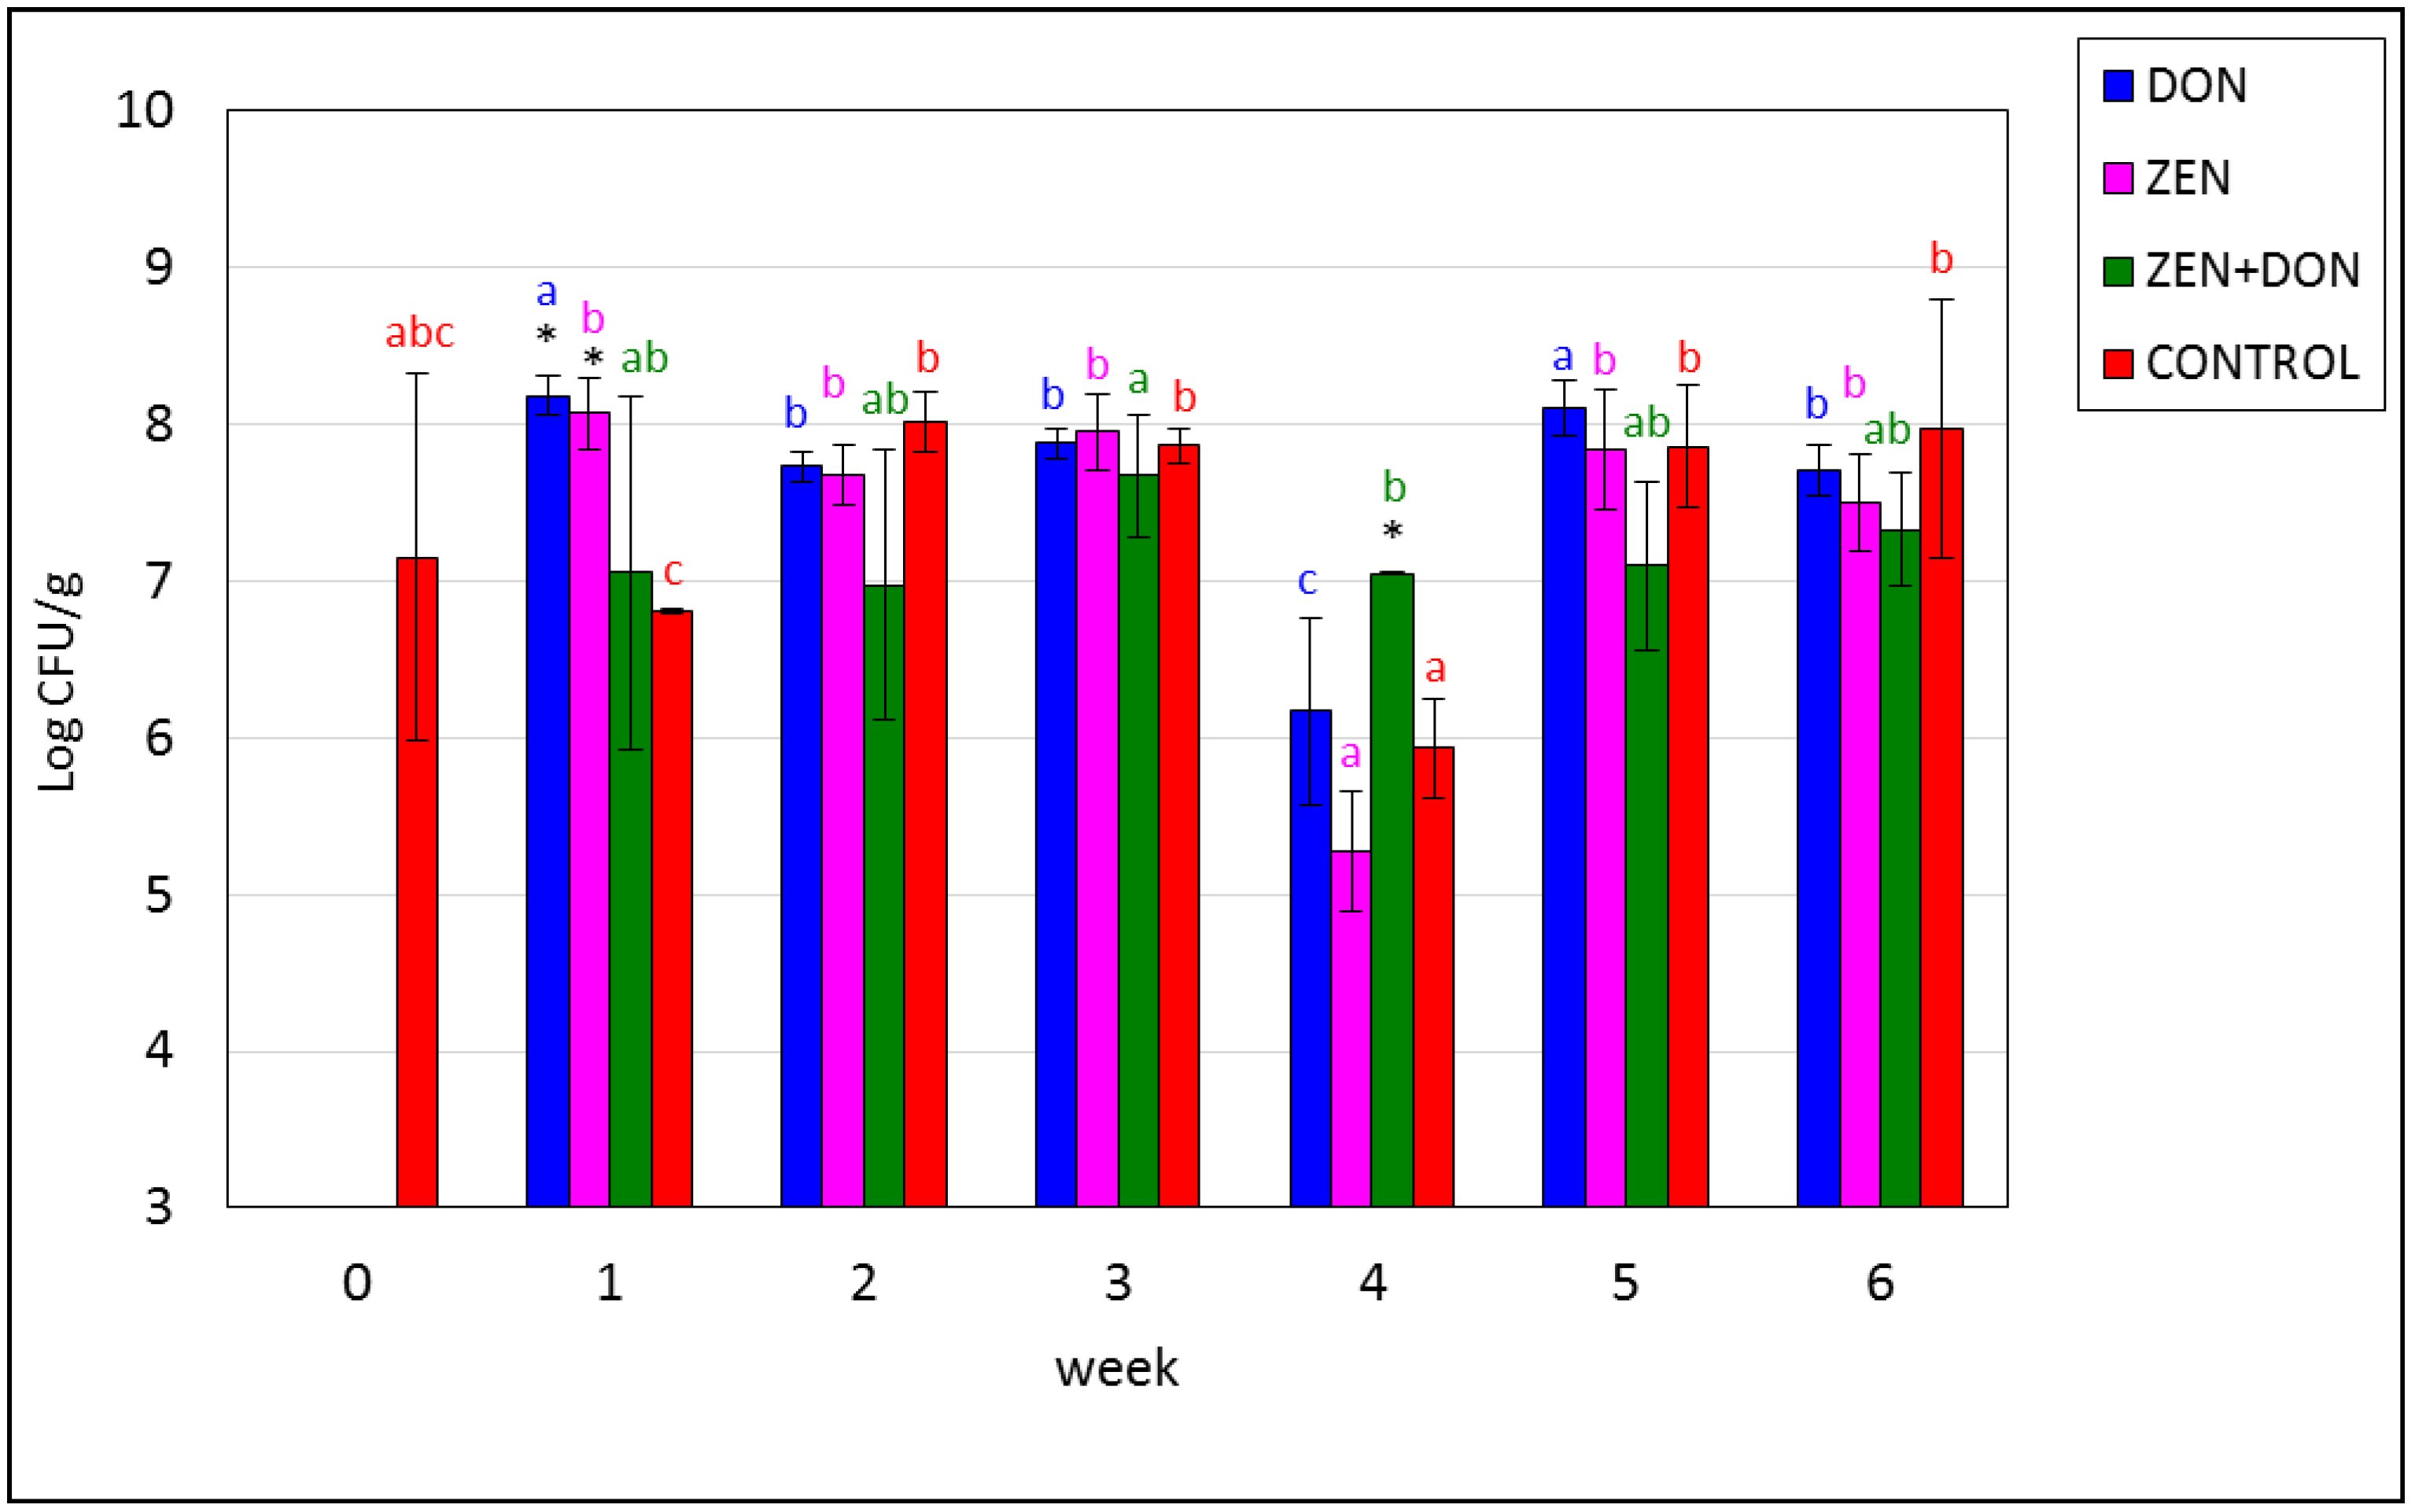
| Weeks of experiment | Experimental Groups | |||
|---|---|---|---|---|
| DON | ZEN | ZEN+DON | CONTROL | |
| 0 | 8.95 a,A ± 0.36 | 8.95 a,A ± 0.36 | 8.95 a,A ± 0.36 | 8.95 a,A ± 0.36 |
| 1 | 9.32 a,A ± 0.14 | 9.28 a,A ± 0.21 | 9.24 a,A ± 0.05 | 8.64 a,A ± 0.62 |
| 2 | 9.20 a,A ± 0.03 | 9.16 a,A ± 0.20 | 8.79 a,A ± 0.35 | 8.87 a,A ± 0.72 |
| 3 | 9.27 a,A ± 0.15 | 9.07 a,A ± 0.25 | 9.12 a,A ± 0.29 | 9.21 a,A ± 0.16 |
| 4 | 8.69 a,A ± 0.33 | 8.69 a,A ± 0.43 | 8.95 a,A ± 0.20 | 9.26 a,A ± 0.21 |
| 5 | 8.82 a,A ± 0.20 | 8.80 a,A ± 0.35 | 8.61 a,A ± 0.45 | 9.02 a,A ± 0.21 |
| 6 | 8.98 a,B ± 0.06 | 8.72 a,A ± 0.16 | 8.50 a,A ± 0.30 | 9.00 a,AB ± 0.48 |
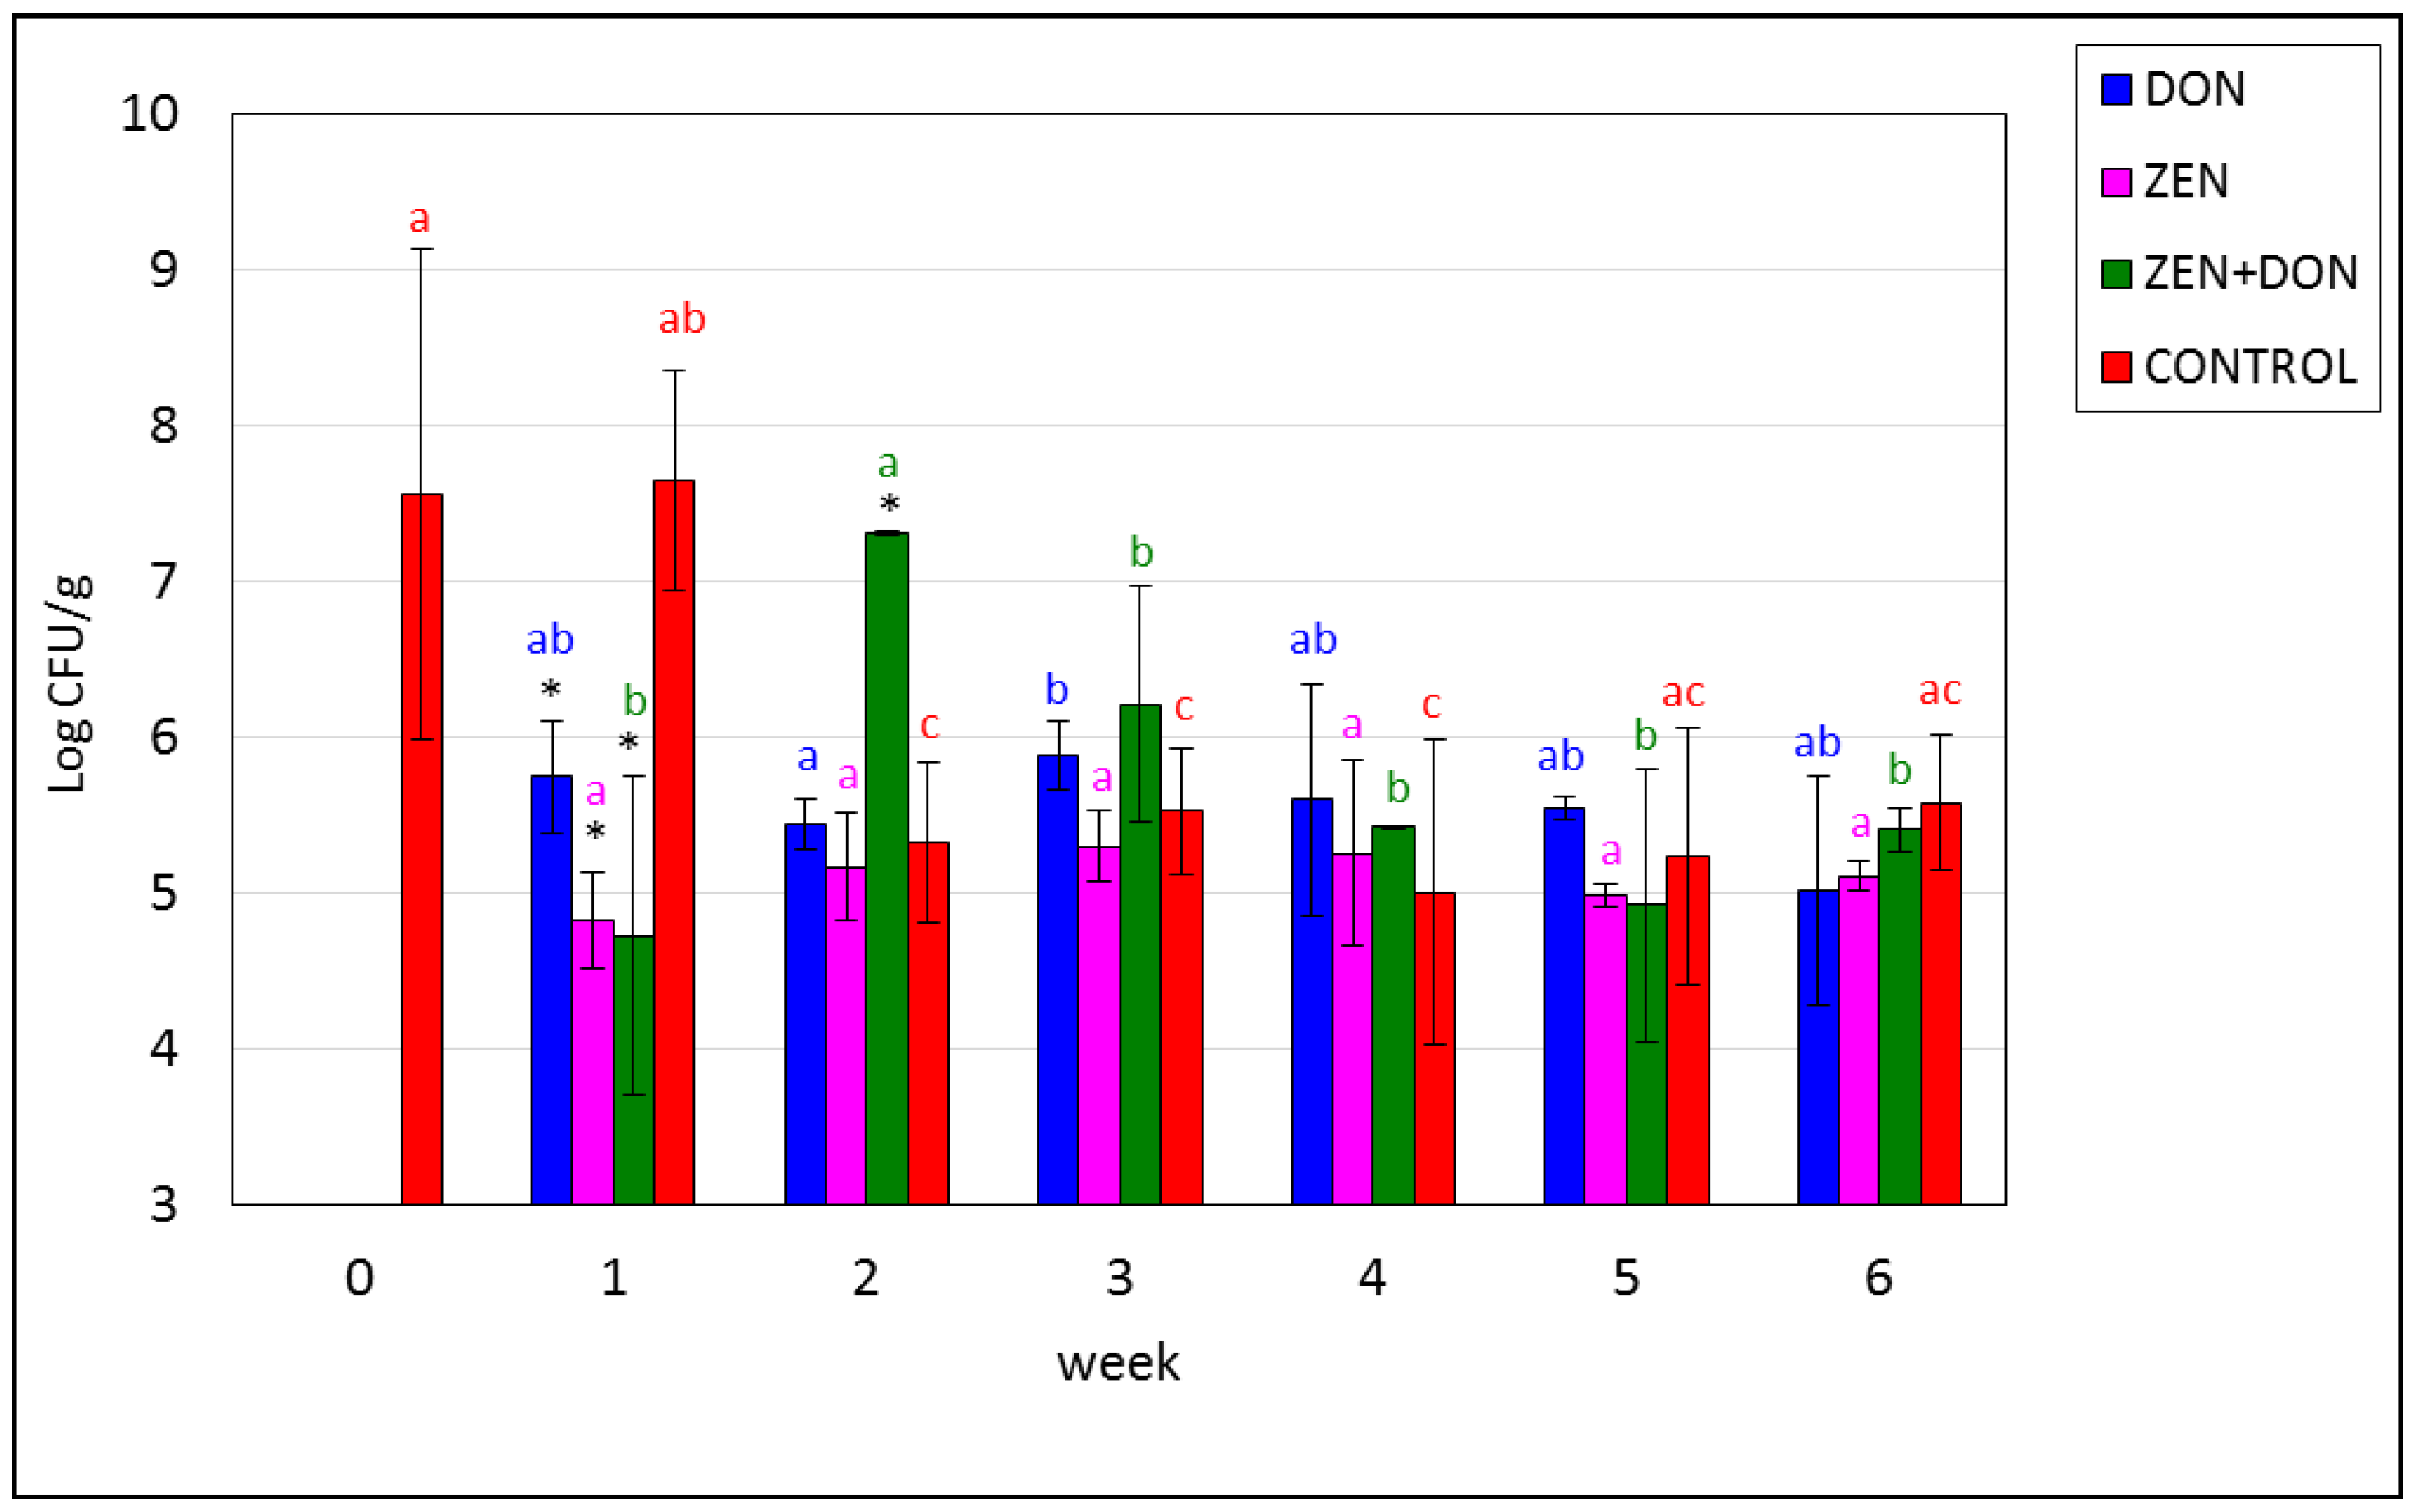
| Weeks of experiment | Experimental Groups | |||
|---|---|---|---|---|
| DON | ZEN | ZEN+DON | CONTROL | |
| 0 | 7.79 a,A ± 1.77 | 7.79 a,A ± 1.77 | 7.79 a,A ± 1.77 | 7.79 a,A ± 1.77 |
| 1 | 6.21 a,AB ± 1.03 | 6.12 b,A ± 0.18 | 5.98 ac,A ± 0.96 | 7.66 a,B ± 0.64 |
| 2 | 5.43 a,A ± 0.34 | 5.71 b,A ± 0.34 | 6.48 ac,A ± 1.44 | 5.57 a,A ± 0.73 |
| 3 | 5.91 a,A ± 0.83 | 5.90 b,A ± 0.23 | 6.38 ac,A ± 0.84 | 5.52 a,A ± 0.49 |
| 4 | 5.17 a,A ± 0.99 | 5.79 b,A ± 0.54 | 5.48 c,A ± 0.11 | 5.54 a,A ± 1.00 |
| 5 | 6.30 a,A ± 1.11 | 5.82 b,A ± 0.29 | 6.13 ac,A ± 1.99 | 5.44 a,A ± 0.64 |
| 6 | 6.06 a,A ± 0.88 | 4.79 c,B ± 0.22 | 5.59 c,A ± 0.17 | 5.55 a,AB ± 1.10 |
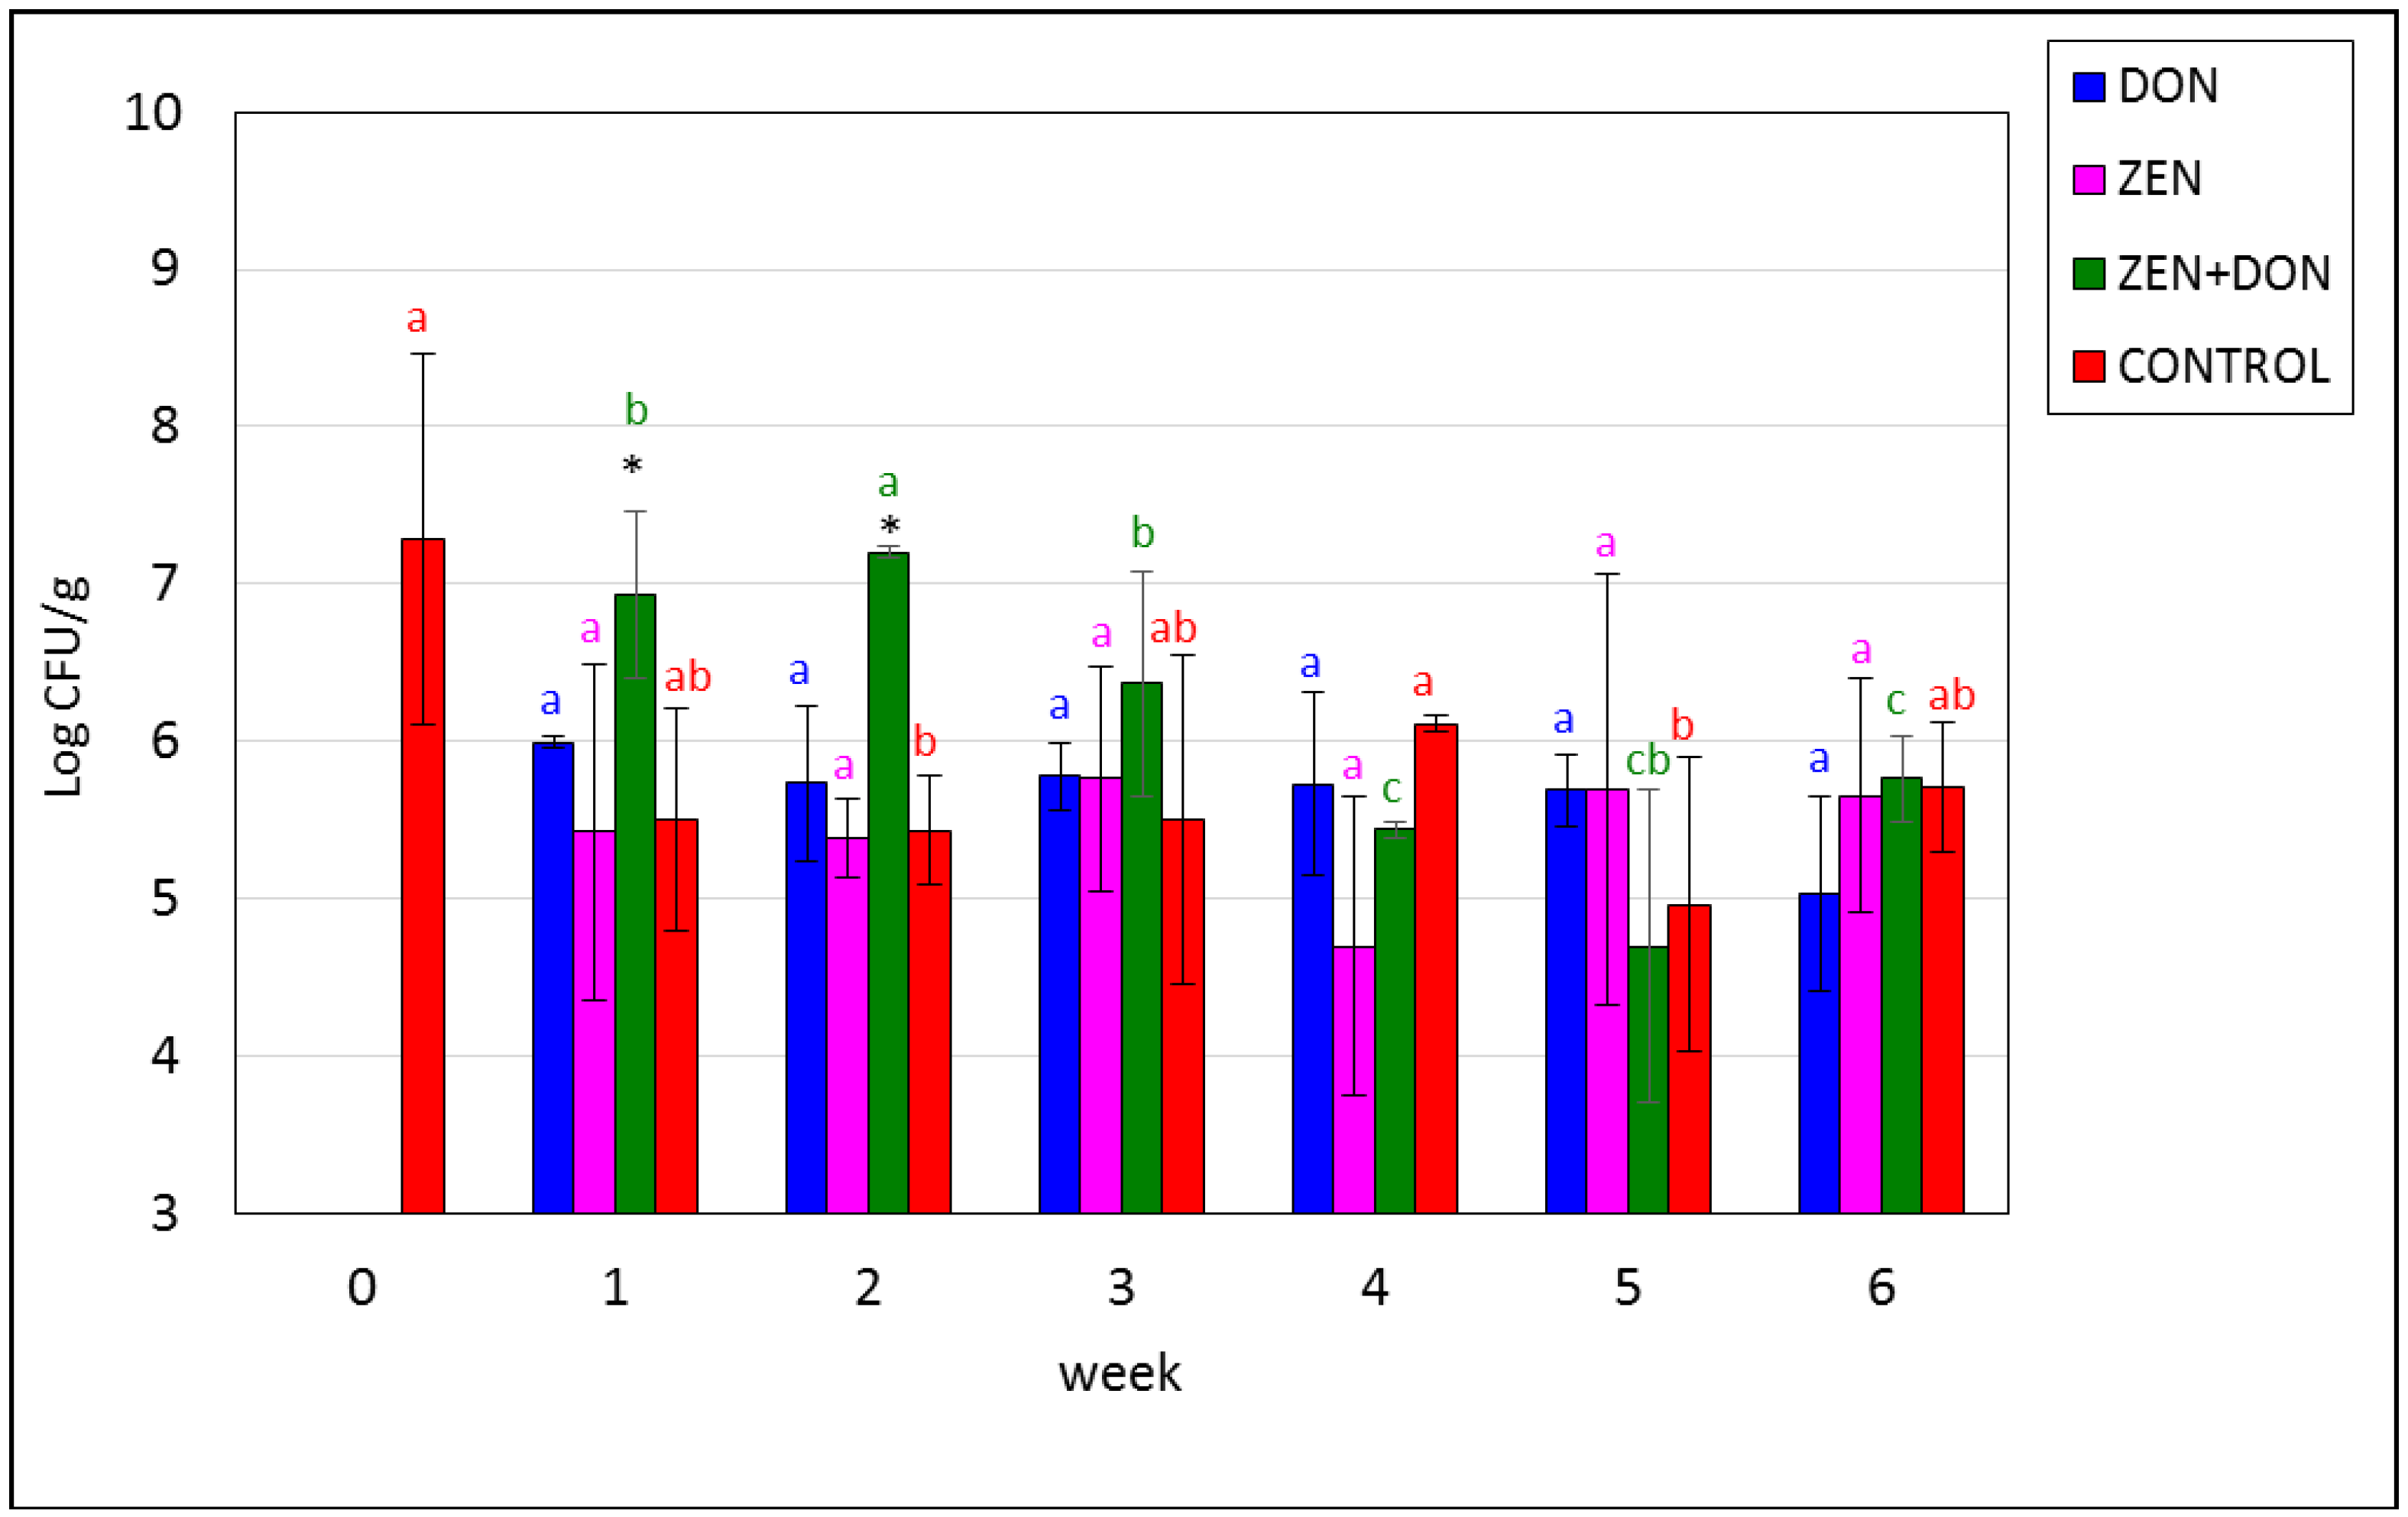
| Weeks of experiment | Experimental Groups | |||
|---|---|---|---|---|
| DON | ZEN | ZEN+DON | CONTROL | |
| 0 | 4.04 a,A ± 0.09 | 4.04 a,A ± 0.09 | 4.04 a,A ± 0.09 | 4.04 a,A ± 0.09 |
| 1 | 4.01 a,A ± 0.16 | 3.86 a,A± 0.19 | 4.19 a,AB ± 0.46 | 5.58 a,B ± 0.94 |
| 2 | 3.33 a,A ± 0.30 | 3.57 b,AB ± 0.29 | 4.81 a,B ± 1.06 | 4.16 a,AB ± 1.06 |
| 3 | 3.77 a,AB ± 0.87 | 3.93 a,AB ± 0.68 | 4.99 a,A ± 0.49 | 3.85 a,B ± 0.19 |
| 4 | 4.13 a,A ± 1.03 | 4.90 a,A ± 0.96 | 3.79 a,A ± 0.56 | 4.18 a,A ± 0.75 |
| 5 | 4.49 a,A ± 0.67 | 3.50 a,A ± 0.54 | 4.33 a,A ± 1.71 | 3.89 a,A ± 0.34 |
| 6 | 4.67 a,B ± 0.40 | 3.29 b,A ± 0.37 | 3.92 a,AB ± 0.47 | 3.74 a,AB ± 0.84 |


3. Experimental Section
3.1. In Vivo Experiment
3.2. Toxins
3.3. Microbiological Analysis
3.4. Microorganisms Identification
3.5. Determination of the Functional Diversity of the Intestinal Microbiota
| ID | Substrate | Group |
|---|---|---|
| C0 | Water (blank) | - |
| C1 | Pyruvic acid methyl ester | Carbohydrate |
| C2 | Tween 40 | Polymers |
| C3 | Tween 80 | Polymers |
| C4 | α-Cyclodextrin | Polymers |
| C5 | Glycogen | Polymers |
| C6 | d-Cellobiose | Carbohydrate |
| C7 | a-d-Lactose | Carbohydrate |
| C8 | b-Methyl-d-glucoside | Carbohydrate |
| C9 | d-Xylose | Carbohydrate |
| C10 | i-Erythritol | Carbohydrate |
| C11 | d-Mannitol | Carbohydrate |
| C12 | N-Acetyl-d-glucosamine | Carbohydrate |
| C13 | d-Glucosaminic acid | Carboxylic & acetic acids |
| C14 | Glucose-1-phosphate | Carbohydrate |
| C15 | d,l-a-Glycerol phosphate | Carbohydrate |
| C16 | d-Galactonic acid γ–lactone | Carboxylic & acetic acids |
| C17 | d-Galacturonic acid | Carboxylic & acetic acids |
| C18 | 2-Hydroxybenzoic acid | Carboxylic & acetic acids |
| C19 | 4-Hydroxybenzoic acid | Carboxylic & acetic acids |
| C20 | c-Hydroxybutyric acid | Carboxylic & acetic acids |
| C21 | Itaconic acid | Carboxylic & acetic acids |
| C22 | a-Ketobutyric acid | Carboxylic & acetic acids |
| C23 | d-Malic acid s | Carboxylic & acetic acids |
| C24 | l-Arginine | Amino acids |
| C25 | l-Asparagine | Amino acids |
| C26 | l-Phenylalanine | Amino acids |
| C27 | l-Serine | Amino acids |
| C28 | l-Threonine | Amino acids |
| C29 | Glycyl-l-glutamic acid | Amino acids |
| C30 | Phenylethylamine | Amines/amides |
| C31 | Putrescine | Amines/amides |
3.6. Statistical Analysis
4. Conclusions
Acknowledgments
Author Contributions
Conflicts of Interest
References
- Bryden, W.L. Mycotoxin contamination of the feed supply chain: Implications for animal productivity and feed security. Anim. Feed Sci. Technol. 2012, 173, 134–158. [Google Scholar] [CrossRef]
- Zain, M.E. Impact of mycotoxins on humans and animals. J. Saudi Chem. Soc. 2011, 15, 129–144. [Google Scholar] [CrossRef]
- Bottalico, A.; Perrone, G. Toxigenic Fusarium species and mycotoxins associated with head blight in small-grain cereals in Europe. Eur. J. Plant Pathol. 2002, 108, 611–624. [Google Scholar] [CrossRef]
- Wiśniewska, H.; Stępień, L.; Waśkiewicz, A.; Beszterda, M.; Góral, T.; Belter, J. Toxigenic Fusarium species infecting wheat heads in Poland. Cent. Eur. J. Biol. 2014, 9, 163–172. [Google Scholar] [CrossRef]
- Streit, E.; Naehrer, K.; Rodrigues, I.; Schatzmayr, G. Mycotoxin occurrence in feed and feed raw materials worldwide: Long-term analysis with special focus on Europe and Asia. J. Sci. Food Agric. 2013, 93, 2892–2899. [Google Scholar] [CrossRef]
- European Commission. Commission Recommendation No 2006/576/EC of 17 August 2006 on the presence of deoxynivalenol, zearalenone, ochratoxin A, T-2 and HT-2 and fumonisins in products intended for animal feeding. Off. J. Eur. Union 2006, 229, 7–9. [Google Scholar]
- Obremski, K.; Zielonka, L.; Gajęcka, M.; Jakimiuk, E.; Bakula, T.; Baranowski, M.; Gajęcki, M. Histological estimation of the small intestine wall after administration of feed containing deoxynivalenol, T-2 toxin and zearalenone in the pig. Pol. J. Vet. Sci. 2008, 11, 339–345. [Google Scholar]
- Fink-Gremmels, J.; Malekinejad, H. Clinical effects and biochemical mechanisms associated with exposure to the mycoestrogen zearalenone. Anim. Feed Sci. Technol. 2007, 137, 326–341. [Google Scholar] [CrossRef]
- Gajęcki, M. Zearalenone: Undesirable substances in feed. Pol. J. Vet. Sci. 2002, 5, 117–122. [Google Scholar]
- Kanora, A.; Maes, D. The role of mycotoxins in pig reproduction: A review. Vet. Med.-Czech. 2009, 54, 565–576. [Google Scholar]
- Edwards, S.; Cantley, T.C.; Day, B.N. The effects of zearalenone on reproduction in swine. II. The effect on puberty attainment and postweaning rebreeding performance. Theriogenology 1987, 28, 51–58. [Google Scholar] [CrossRef]
- Obremski, K.; Gajecki, M.; Zwierzchowski, W.; Zielonka, L.; Otrocka-Domagala, I.; Rotkiewicz, T.; Mikolajczyk, A.; Gajecka, M.; Polak, M. Influence of zearalenone on reproductive system cell proliferation in gilts. Pol. J. Vet. Sci. 2003, 6, 239–245. [Google Scholar]
- Zinedine, A.; Soriano, J.M.; Molto, J.C.; Manes, J. Review on the toxicity, occurrence, metabolism, detoxification, regulations and intake of zearalenone: An oestrogenic mycotoxin. Food Chem. Toxicol. 2007, 45, 1–18. [Google Scholar] [CrossRef]
- Tiemann, U.; Danicke, S. In vivo and in vitro effects of the mycotoxins zearalenone and deoxynivalenol on different non-reproductive and reproductive organs in female pigs: A review. Food Addit. Contam. 2007, 24, 306–314. [Google Scholar] [CrossRef]
- Pestka, J.J. Toxicological mechanisms and potential health effects of deoxynivalenol and nivalenol. World Mycotoxin. J. 2010, 3, 323–347. [Google Scholar] [CrossRef]
- Pinton, P.; Accensi, F.; Beauchamp, E.; Cossalter, A.-M.; Callu, P.; Grosjean, F.; Oswald, I.P. Ingestion of deoxynivalenol (DON) contaminated feed alters the pig vaccinal immune responses. Toxicol. Lett. 2008, 177, 215–222. [Google Scholar] [CrossRef]
- Pestka, J.J. Deoxynivalenol: Toxicity, mechanisms and animal health risks. Anim. Feed Sci. Technol. 2007, 137, 283–298. [Google Scholar] [CrossRef]
- Rotter, B.A.; Prelusky, D.B.; Pestka, J.J. Toxicology of deoxynivalenol (vomitoxin). J. Toxicol. Environ. Health 1996, 48, 1–34. [Google Scholar]
- Bergsjo, B.; Matre, T.; Nafstad, I. Effects of diets with graded-levels of deoxynivalenol on performance in growing pigs. J. Vet. Med. A 1992, 39, 752–758. [Google Scholar] [CrossRef]
- Young, L.G.; McGirr, L.; Valli, V.E.; Lumsden, J.H.; Lun, A. Vomitoxin in corn fed to young-pigs. J. Anim. Sci. 1983, 57, 655–664. [Google Scholar]
- Richards, J.D.; Gong, J.; de Lange, C.F.M. The gastrointestinal microbiota and its role in monogastric nutrition and health with an emphasis on pigs: Current understanding, possible modulations, and new technologies for ecological studies. Can. J. Anim. Sci. 2005, 85, 421–435. [Google Scholar] [CrossRef]
- Maresca, M.; Fantini, J. Some food-associated mycotoxins as potential risk factors in humans predisposed to chronic intestinal inflammatory diseases. Toxicon 2010, 56, 282–294. [Google Scholar] [CrossRef]
- Bauer, E.; Williams, B.A.; Smidt, H.; Mosenthin, R.; Verstegen, M.W.A. Influence of dietary components on development of the microbiota in single-stomached species. Nutr. Res. Rev. 2006, 19, 63–78. [Google Scholar] [CrossRef]
- Culpepper, T.; Mai, V. Evidence for contributions of gut microbiota to colorectal carcinogenesis. Curr. Nutr. Rep. 2013, 2, 10–18. [Google Scholar] [CrossRef]
- He, P.; Young, L.G.; Forsberg, C. Microbial transformation of deoxynivalenol (vomitoxin). Appl. Environ. Microbiol. 1992, 58, 3857–3863. [Google Scholar]
- Young, J.C.; Zhou, T.; Yu, H.; Zhu, H.; Gong, J. Degradation of trichothecene mycotoxins by chicken intestinal microbes. Food Chem. Toxicol. 2007, 45, 136–143. [Google Scholar] [CrossRef]
- Guan, S.; He, J.; Young, J.C.; Zhu, H.; Li, X.Z.; Ji, C.; Zhou, T. Transformation of trichothecene mycotoxins by microorganisms from fish digesta. Aquaculture 2009, 290, 290–295. [Google Scholar] [CrossRef]
- Kabak, B.; Dobson, A.D.; Var, I. Strategies to prevent mycotoxins contamination of food and animal feed: A review. Crit. Rev. Food Sci. Nutr. 2006, 46, 593–619. [Google Scholar] [CrossRef]
- Kabak, B.; Dobson, A.D.W. Biological strategies to counteract the effects of mycotoxins. J. Food Protect. 2009, 72, 2006–2016. [Google Scholar]
- Ali-Vehmas, T.; Rizzo, A.; Westermarck, T.; Atroshi, F. Measurement of antibacterial activities of t-2 toxin, deoxynivalenol, ochratoxin a, aflatoxin b1 and fumonisin b1 using microtitration tray-based turbidimetric techniques. J. Vet. Med. Ser. A 1998, 45, 453–458. [Google Scholar] [CrossRef]
- Wache, Y.J.; Valat, C.; Postollec, G.; Bougeard, S.; Burel, C.; Oswald, I.P.; Fravalo, P. Impact of deoxynivalenol on the intestinal microflora of pigs. Int. J. Mol. Sci. 2009, 10, 1–17. [Google Scholar]
- Saint-Cyr, M.J.; Perrin-Guyomard, A.; Houee, P.; Rolland, J.-G.; Laurentie, M. Evaluation of an oral subchronic exposure of deoxynivalenol on the composition of human gut microbiota in a model of human microbiota-associated rats. PLoS One 2013, 8, e80578. [Google Scholar]
- Leser, T.D.; Amenuvor, J.Z.; Jensen, T.K.; Lindecrona, R.H.; Boye, M.; Moller, K. Culture-independent analysis of gut bacteria: The pig gastrointestinal tract microbiota revisited. Appl. Environ. Microbiol. 2002, 68, 673–690. [Google Scholar] [CrossRef]
- Leser, T.D.; Lindecrona, R.H.; Jensen, T.K.; Jensen, B.B.; Moller, K. Changes in bacterial community structure in the colon of pigs fed different experimental diets and after infection with Brachyspira hyodysenteriae. Appl. Environ. Microbiol. 2000, 66, 3290–3296. [Google Scholar]
- Weber, K.P.; Grove, J.A.; Gehder, M.; Anderson, W.A.; Legge, R.L. Data transformations in the analysis of community-level substrate utilization data from microplates. J. Microbiol. Methods 2007, 69, 461–469. [Google Scholar] [CrossRef]
- Stefanowicz, A. The Bolog plates technique as a tool in ecological studies of microbial communities. Pol. J. Environ. Stud. 2006, 15, 669–676. [Google Scholar]
- Aira, M.; Monroy, F.; Dominguez, J. Changes in microbial biomass and microbial activity of pig slurry after the transit through the gut of the earthworm Eudrilus eugeniae (Kinberg, 1867). Biol. Fertil. Soils 2006, 42, 371–376. [Google Scholar] [CrossRef]
- Maul, J.D.; Gandhi, J.P.; Farris, J.L. Community-level physiological profiles of cloacal microbes in songbirds (order: Passeriformes): Variation due to host species, host diet, and habitat. Microb. Ecol. 2005, 50, 19–28. [Google Scholar] [CrossRef]
- Pedersen, K.; Tannock, G.W. Colonization of the porcine gastrointestinal-tract by lactobacilli. Appl. Environ. Microbiol. 1989, 55, 279–283. [Google Scholar]
- Giang, H.H.; Viet, T.Q.; Ogle, B.; Lindberg, J.E. Growth performance, digestibility, gut environment and health status in weaned piglets fed a diet supplemented with potentially probiotic complexes of lactic acid bacteria. Livest. Sci. 2010, 129, 95–103. [Google Scholar] [CrossRef]
- Rovers, M. Healthy pigs with less use of antibiotics—A nutritional approach in three steps. Int. Pigs Top. 2012, 27, 15–17. [Google Scholar]
- Marin, D.; Țăranu, I.; Grosu, H. Microorganisms involved in the decontamination of trichotecens, mycotoxins produced by Fusarium fungi. Arch. Zootech. 2011, 14, 5–24. [Google Scholar]
- Franco, T.S.; Garcia, S.; Hirooka, E.Y.; Ono, Y.S.; dos Santos, J.S. Lactic acid bacteria in the inhibition of Fusarium graminearum and deoxynivalenol detoxification. J. Appl. Microbiol. 2011, 111, 739–748. [Google Scholar] [CrossRef]
- El-Nezami, H.S.; Chrevatidis, A.; Auriola, S.; Salminen, S.; Mykkanen, H. Removal of common Fusarium toxins in vitro by strains of Lactobacillus and Propionibacterium. Food Addit. Contam. 2002, 19, 680–686. [Google Scholar] [CrossRef]
- Burel, C.; Tanguy, M.; Guerre, P.; Boilletot, E.; Cariolet, R.; Queguiner, M.; Postollec, G.; Pinton, P.; Salvat, G.; Oswald, I.P.; et al. Effect of low dose of fumonisins on pig health: Immune status, intestinal microbiota and sensitivity to Salmonella. Toxins 2013, 5, 841–864. [Google Scholar] [CrossRef]
- Drew, M.D.; van Kessel, A.G.; Estrada, A.E.; Ekpe, E.D.; Zijlstra, R.T. Effect of dietary cereal on intestinal bacterial populations in weaned pigs. Can. J. Anim. Sci. 2002, 82, 607–609. [Google Scholar] [CrossRef]
- Hughes, R.; Rowland, I.R. Metabolic activities of the gut microflora in relation to cancer. Microb. Ecol. Health D 2000, 12, 179–185. [Google Scholar] [CrossRef]
- De Moreno de LeBlanc, A.; Perdigón, G. Reduction of β-glukuronidase and reductase activity by yoghurt in a murine colon cancer model. Biocell 2005, 29, 15–24. [Google Scholar]
- Gajęcka, M.; Stopa, E.; Tarasiuk, M.; Zielonka, L.; Gajęcki, M. The expression of type-1 and type-2 nitric oxide synthase in selected tissues of the gastrointestinal tract during mixed mycotoxicosis. Toxins 2013, 5, 2281–2292. [Google Scholar] [CrossRef]
- Boermans, H.J.; Leung, M.C.K. Mycotoxins and the pet food industry: Toxicological evidence and risk assessment. Int. J. Food Microbiol. 2007, 119, 95–102. [Google Scholar] [CrossRef]
- Laufersweiler, M.C.; Gadagbui, B.; Baskerville-Abraham, I.M.; Maier, A.; Willis, A.; Scialli, A.R.; Carr, G.J.; Felter, S.P.; Blackburn, K.; Daston, G. Correlation of chemical structure with reproductive and developmental toxicity as it relates to the use of the threshold of toxicological concern. Regul. Toxicol. Pharm. 2012, 62, 160–182. [Google Scholar] [CrossRef]
- Schlatter, J. Toxicity data relevant for hazard characterization. Toxicol. Lett. 2004, 153, 83–89. [Google Scholar] [CrossRef]
- Waśkiewicz, A.; Kostecki, M.; Goliński, P.; Obremski, K.; Gajęcka, M. Biosynthesis, Purification and Analysis of Zearalenone in Biological Experiments. In Proceeding of the XIV Veterinary Congress, Wrocław, Poland, 13–15 September 2012; p. 483. (In Polish)
- De Man, J.D.; Rogosa, M.; Sharpe, M.E. A medium for the cultivation of Lactobacilli. J. Appl. Bact. 1960, 23, 130–135. [Google Scholar] [CrossRef]
- Samson, R.; Hoekstra, E.; Frisvad, J.; Filtenborg, O. Introduction to Food—Borne Fungi; CBS: Delft, The Netherlands, 1996. [Google Scholar]
- Domsch, K.; Gams, W.; Anderson, T. Compendium of Soil Fungi; IHW Verlag: Eching, Germany, 1993. [Google Scholar]
- Weber, K.P.; Legge, R.L. One-dimensional metric for tracking bacterial community divergence using sole carbon source utilization patterns. J. Microbiol. Methods 2009, 79, 55–61. [Google Scholar] [CrossRef]
- Garland, J.L. Analysis and interpretation of community-level physiological profiles in microbial ecology. FEMS Microbiol. Ecol. 1997, 24, 289–300. [Google Scholar] [CrossRef]
© 2014 by the authors; licensee MDPI, Basel, Switzerland. This article is an open access article distributed under the terms and conditions of the Creative Commons Attribution license (http://creativecommons.org/licenses/by/3.0/).
Share and Cite
Piotrowska, M.; Śliżewska, K.; Nowak, A.; Zielonka, Ł.; Żakowska, Z.; Gajęcka, M.; Gajęcki, M. The Effect of Experimental Fusarium Mycotoxicosis on Microbiota Diversity in Porcine Ascending Colon Contents. Toxins 2014, 6, 2064-2081. https://0-doi-org.brum.beds.ac.uk/10.3390/toxins6072064
Piotrowska M, Śliżewska K, Nowak A, Zielonka Ł, Żakowska Z, Gajęcka M, Gajęcki M. The Effect of Experimental Fusarium Mycotoxicosis on Microbiota Diversity in Porcine Ascending Colon Contents. Toxins. 2014; 6(7):2064-2081. https://0-doi-org.brum.beds.ac.uk/10.3390/toxins6072064
Chicago/Turabian StylePiotrowska, Małgorzata, Katarzyna Śliżewska, Adriana Nowak, Łukasz Zielonka, Zofia Żakowska, Magdalena Gajęcka, and Maciej Gajęcki. 2014. "The Effect of Experimental Fusarium Mycotoxicosis on Microbiota Diversity in Porcine Ascending Colon Contents" Toxins 6, no. 7: 2064-2081. https://0-doi-org.brum.beds.ac.uk/10.3390/toxins6072064