
Investigating β-N-Methylamino-l-alanine Misincorporation in Human Cell Cultures: A Comparative Study with Known Amino Acid Analogues

Abstract
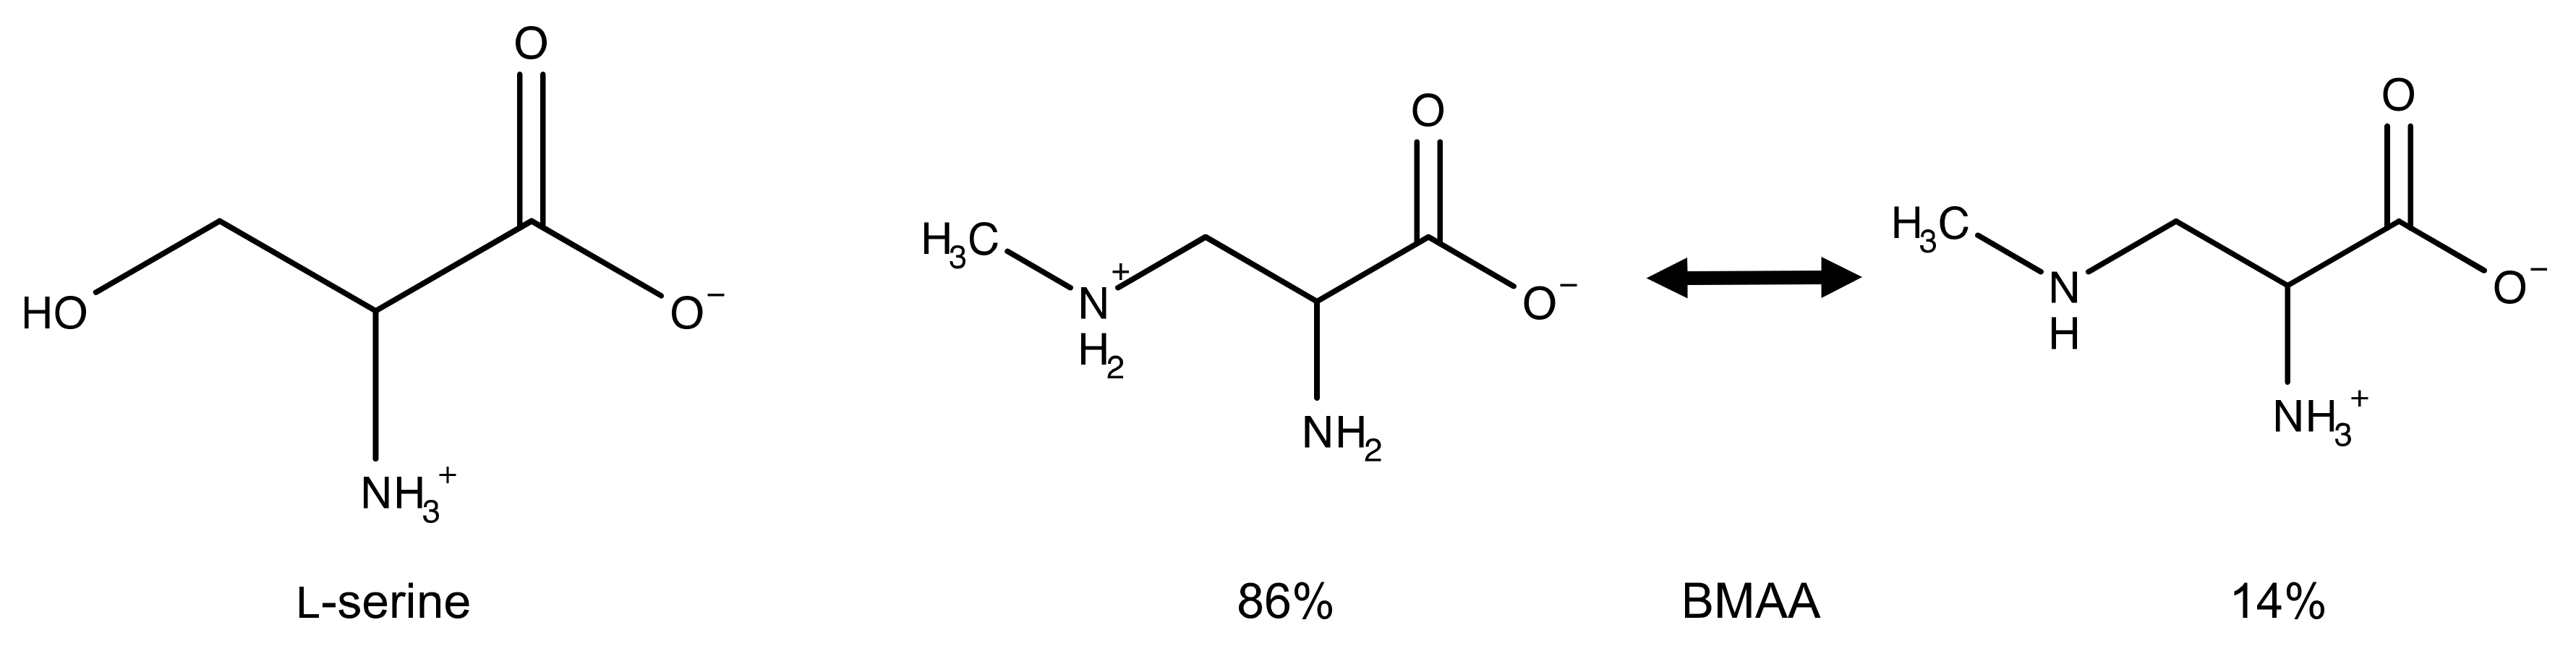
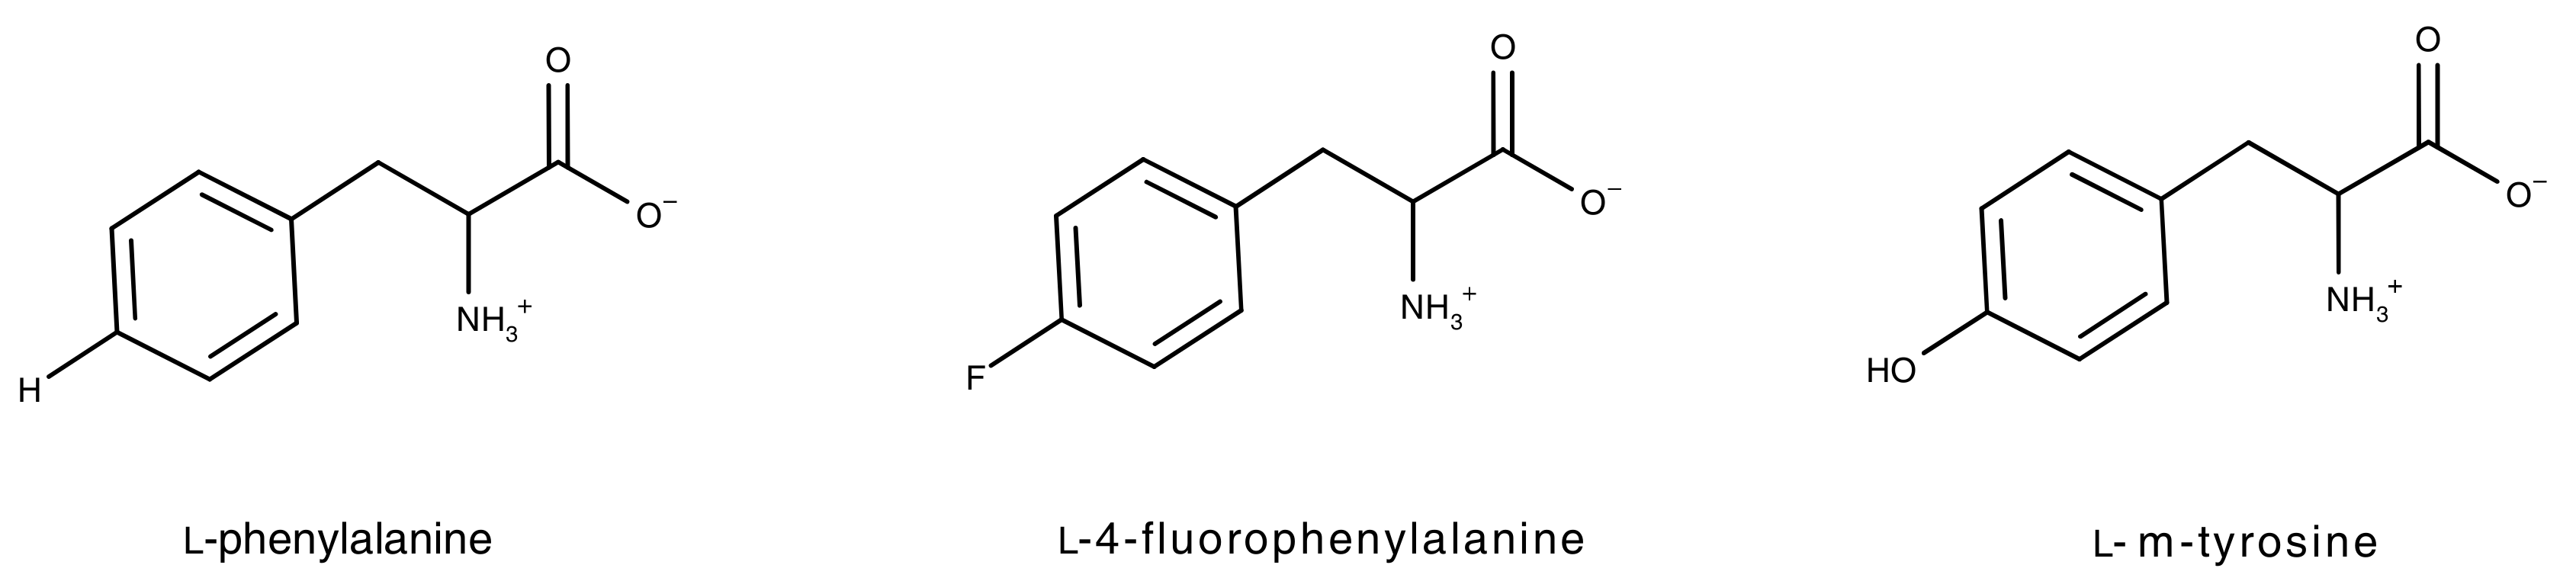
:1. Introduction
2. Results and Discussion
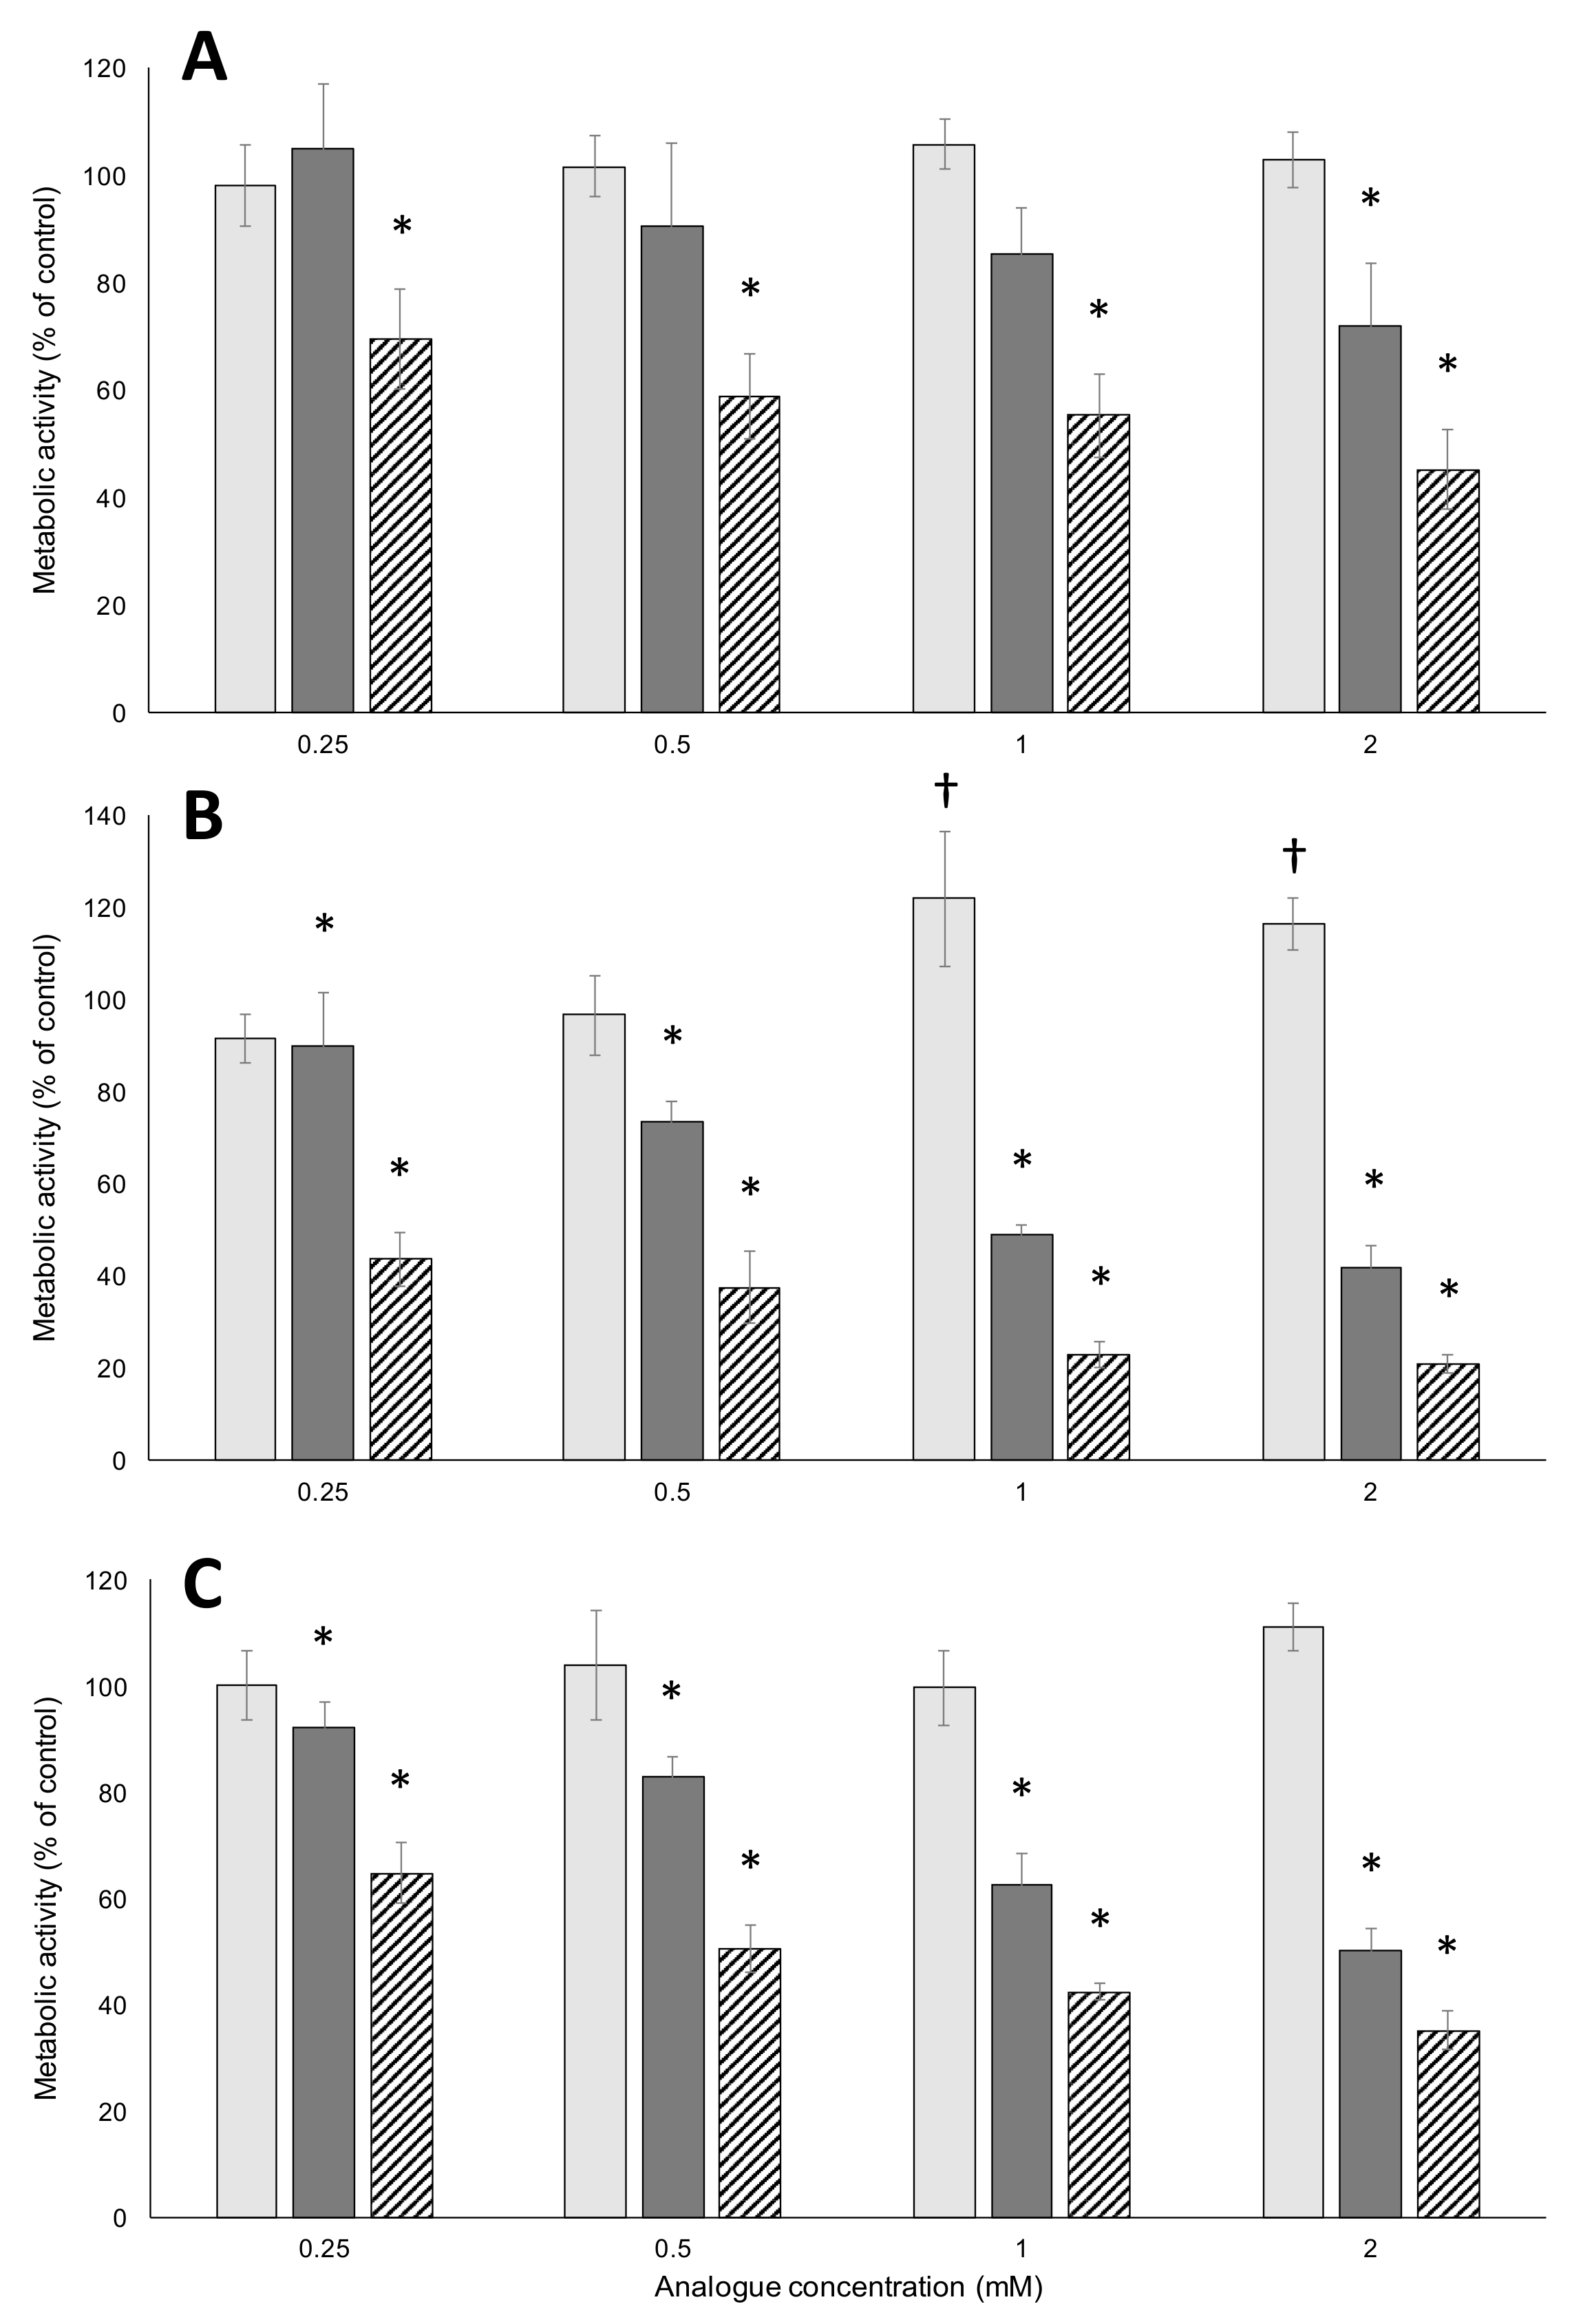
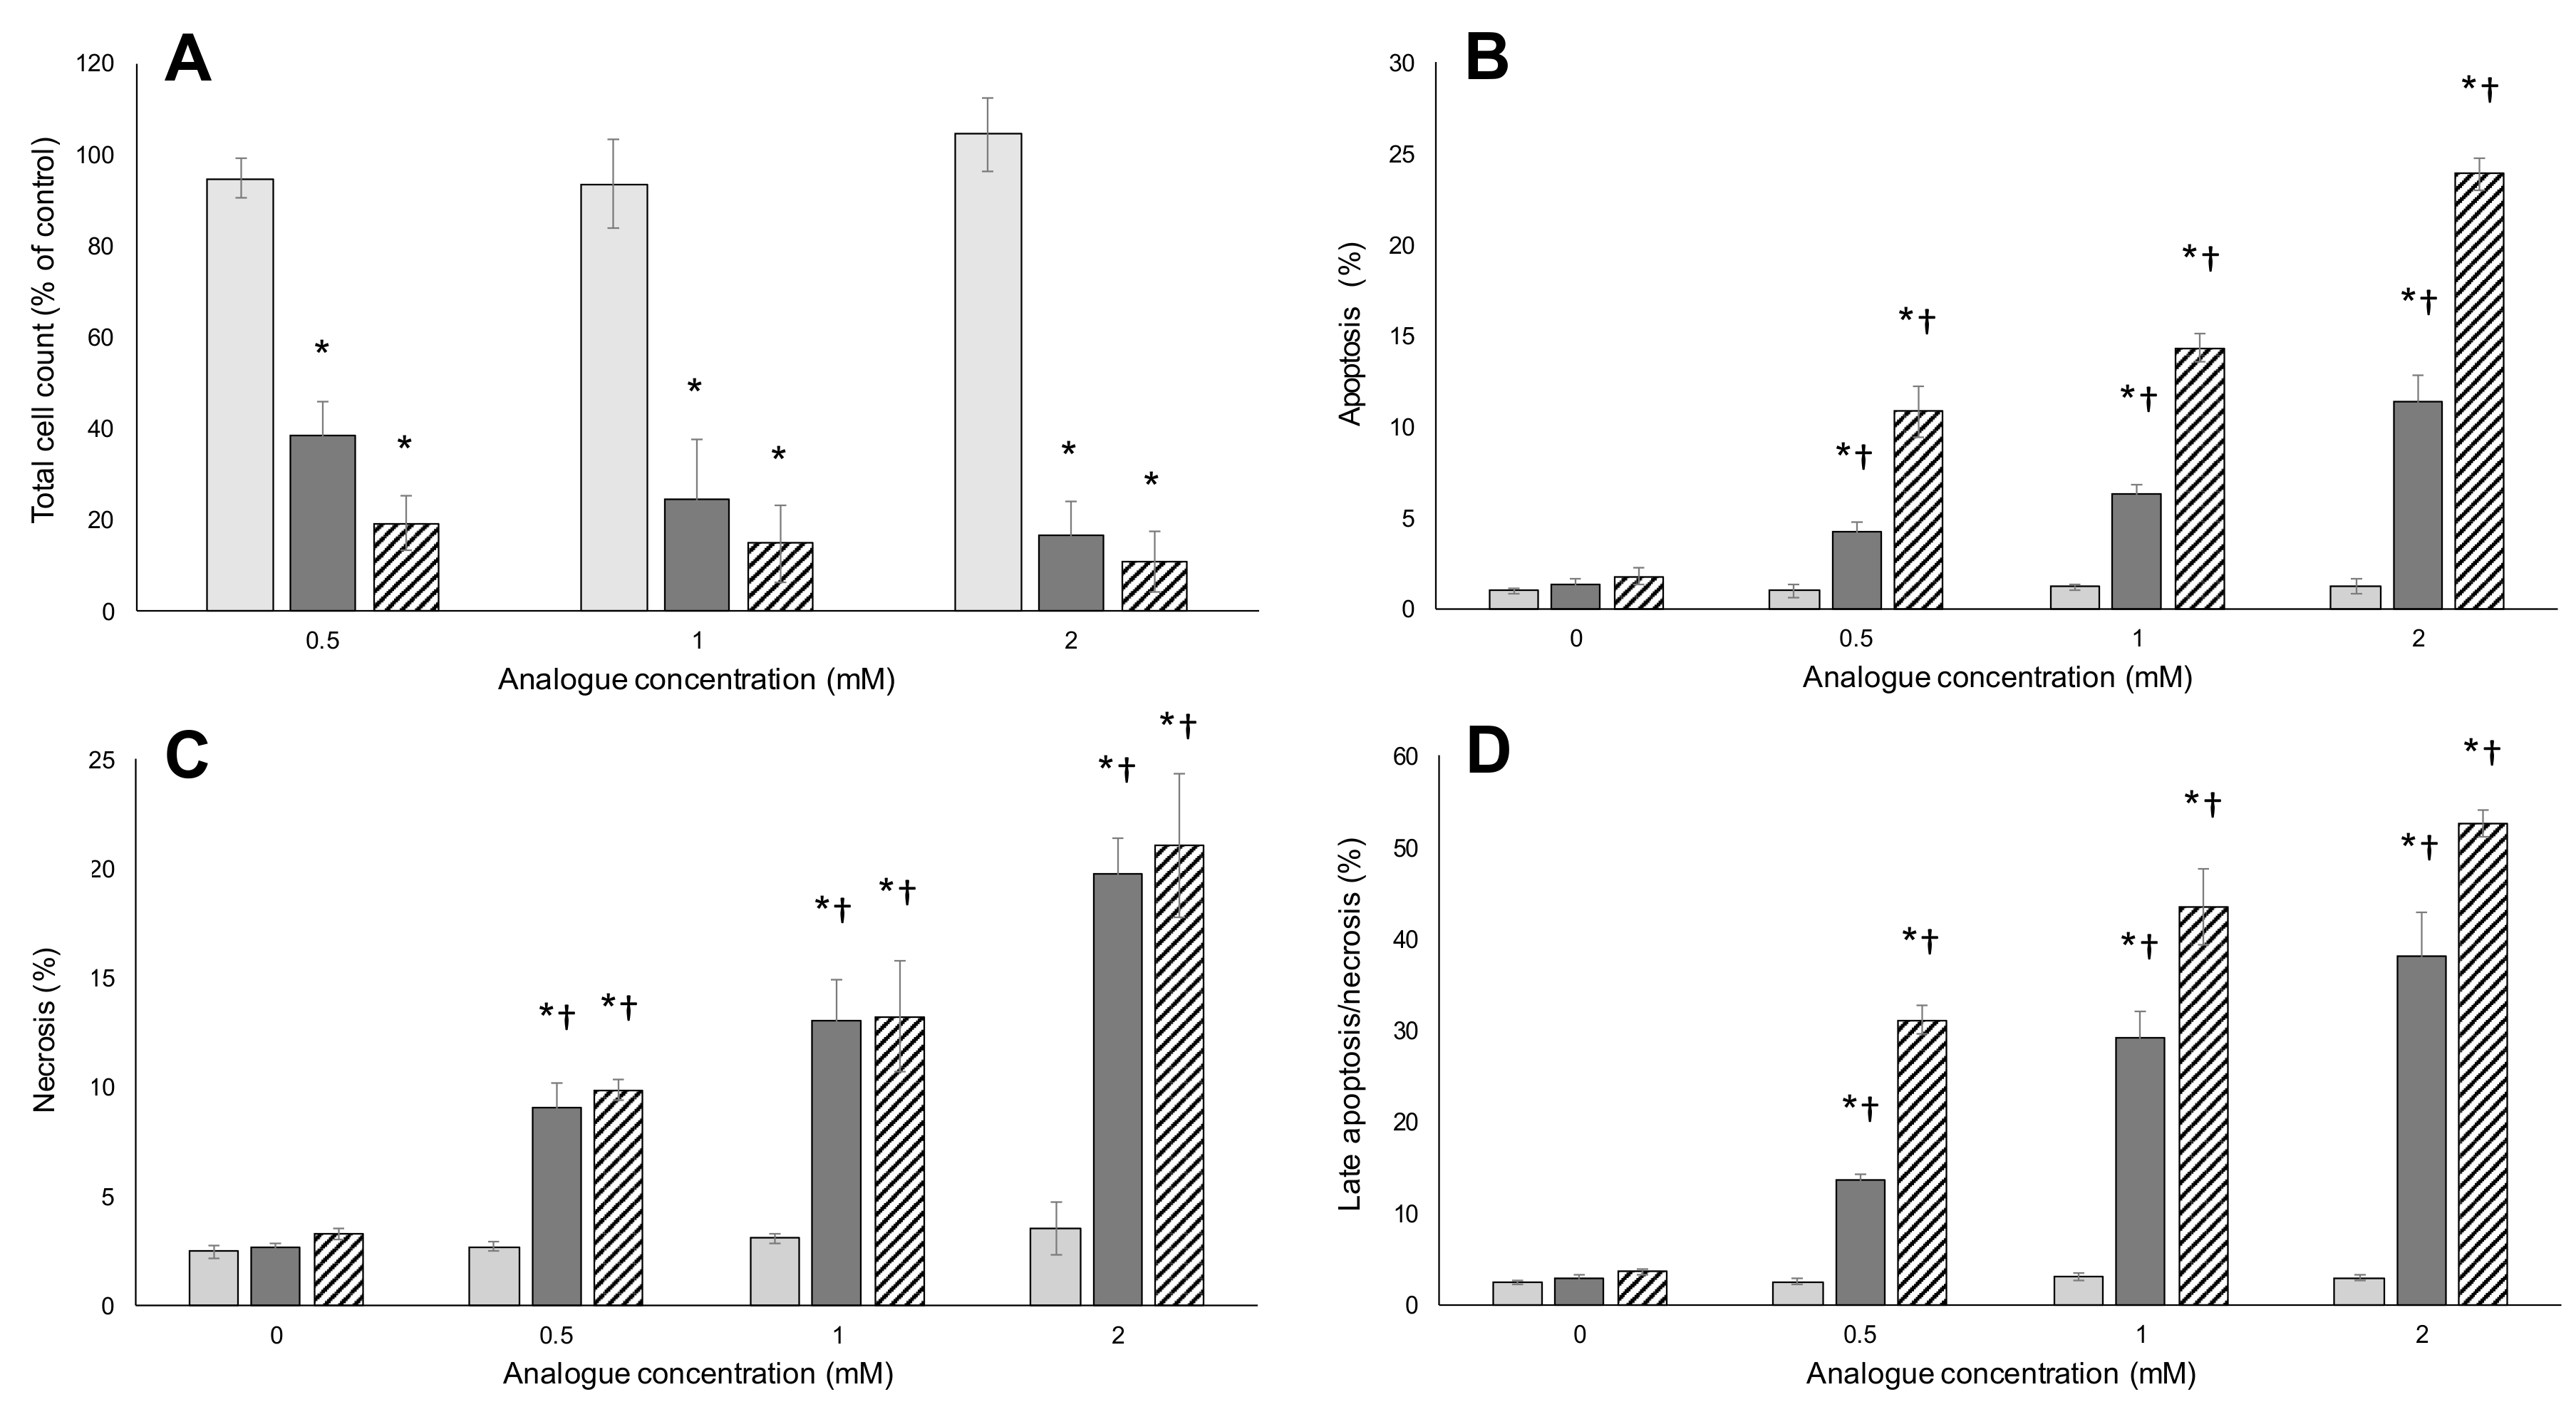
2.1. Metabolic Activity
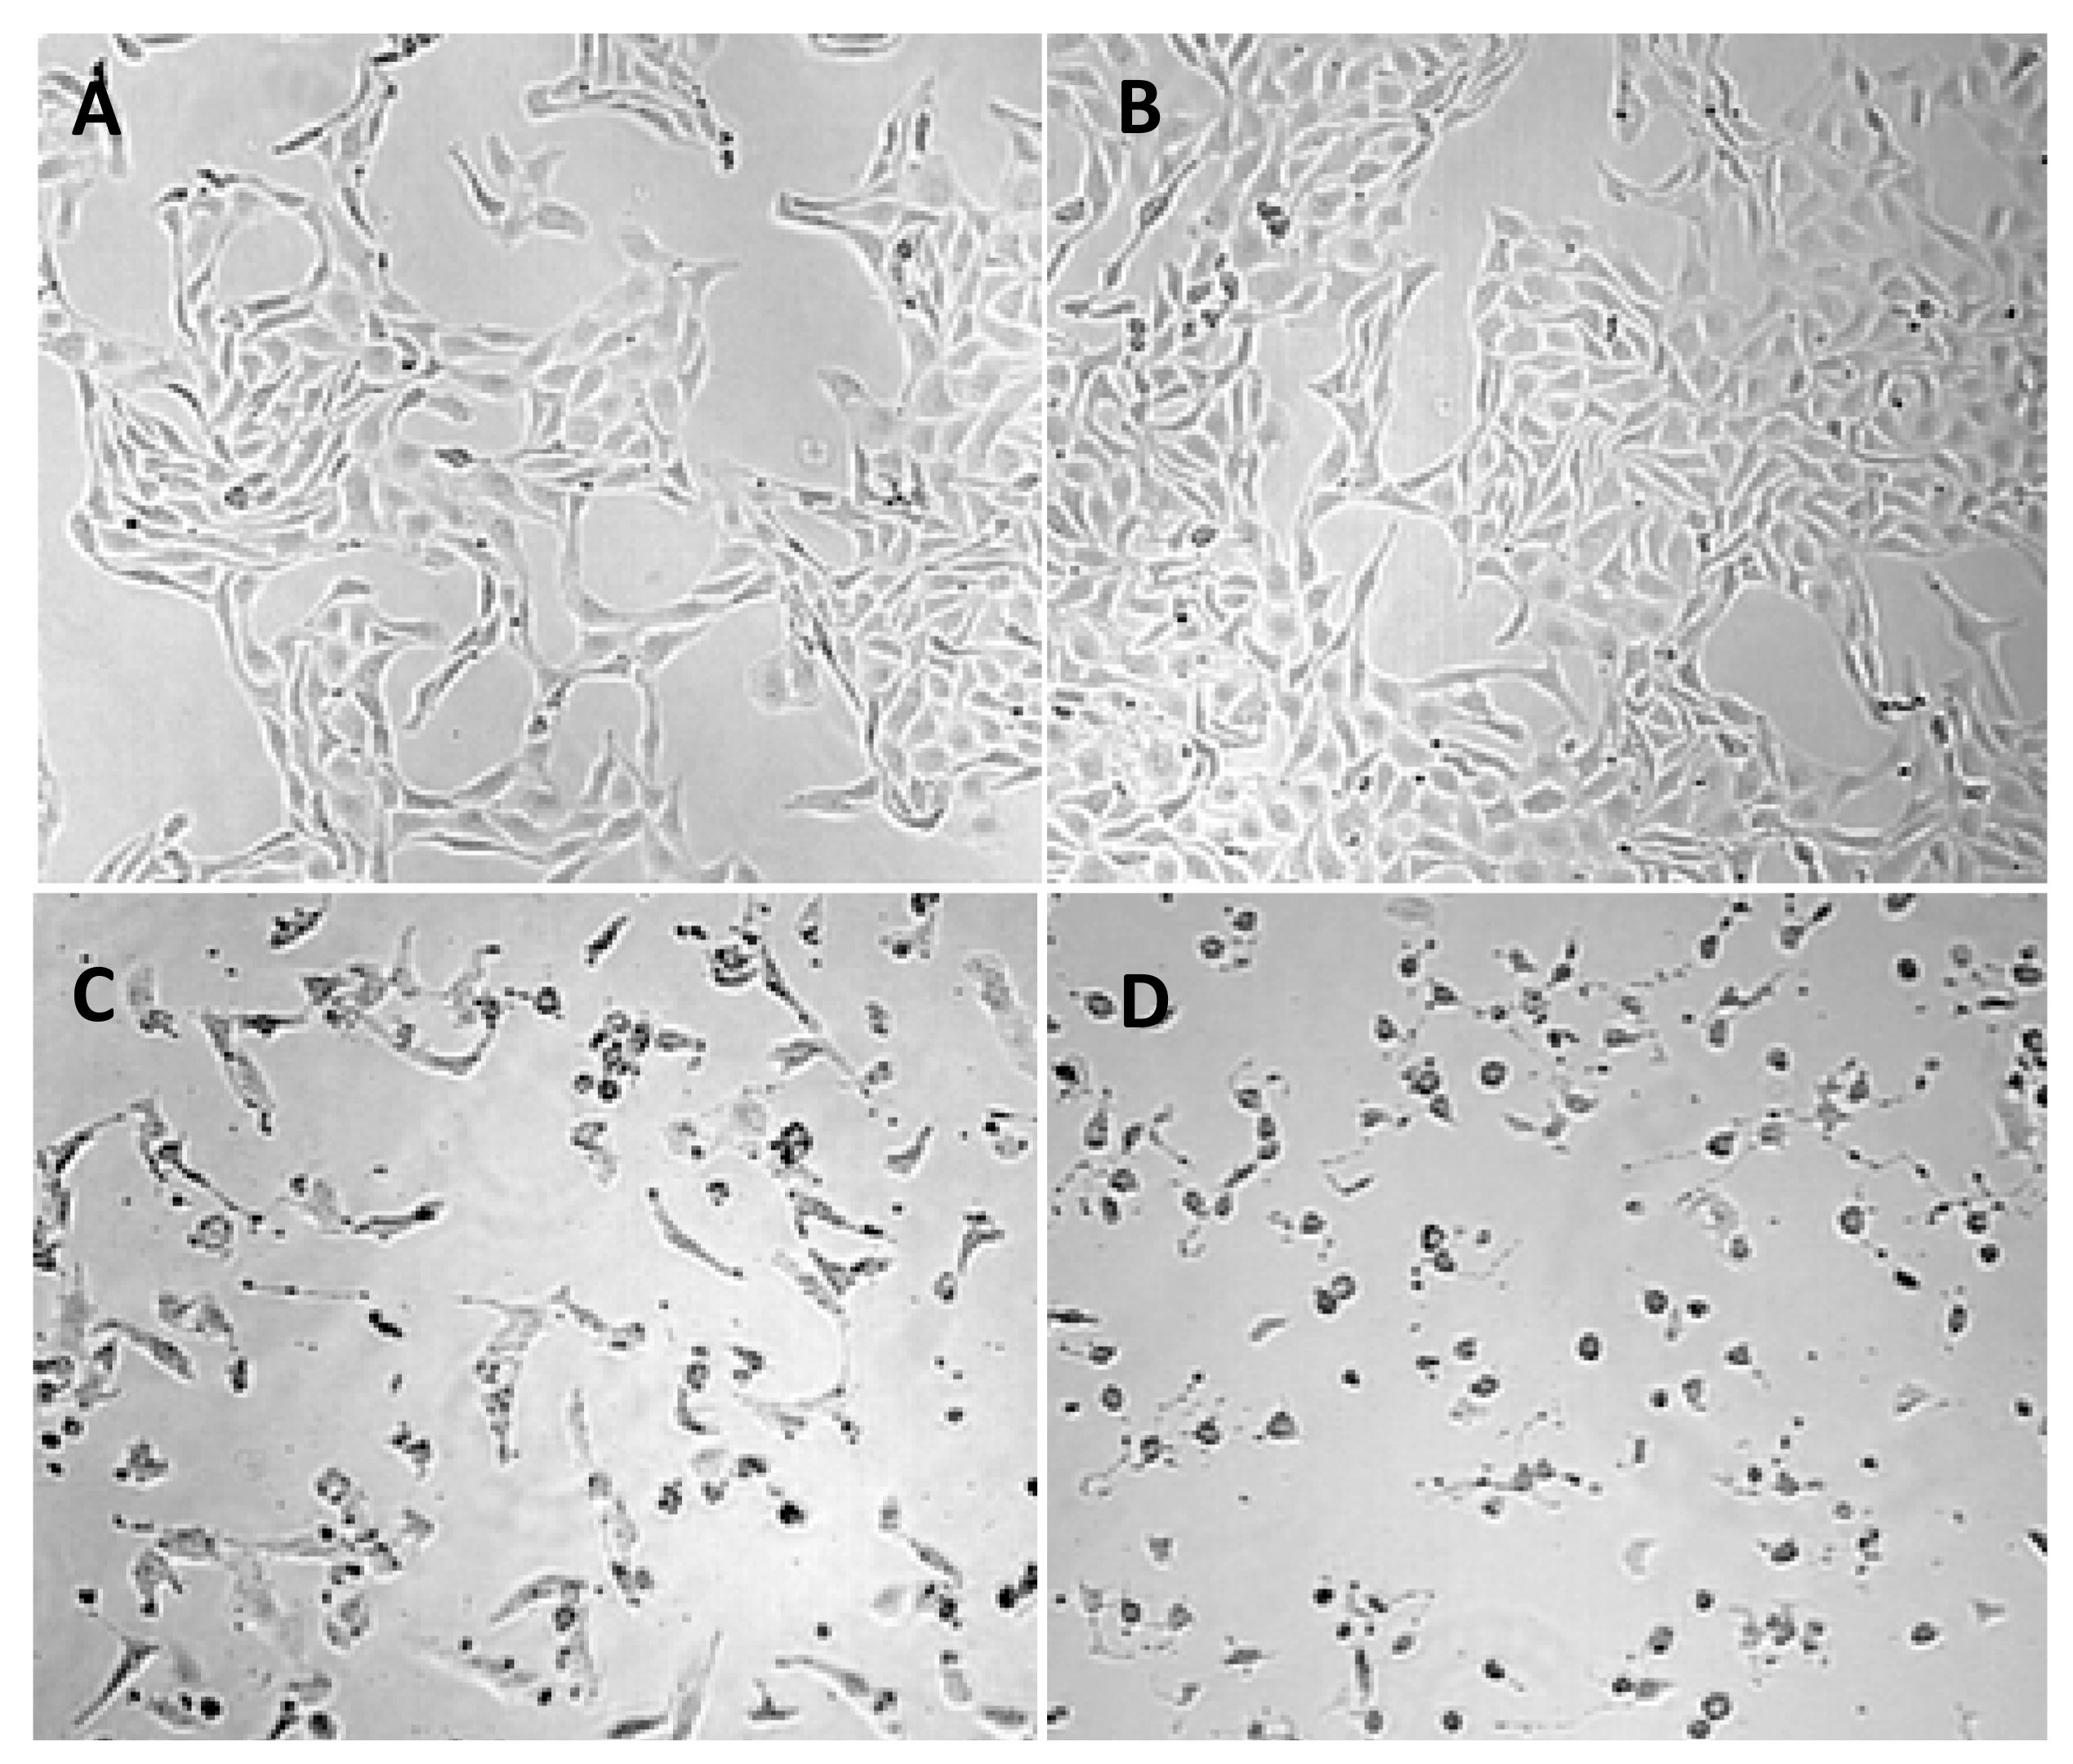
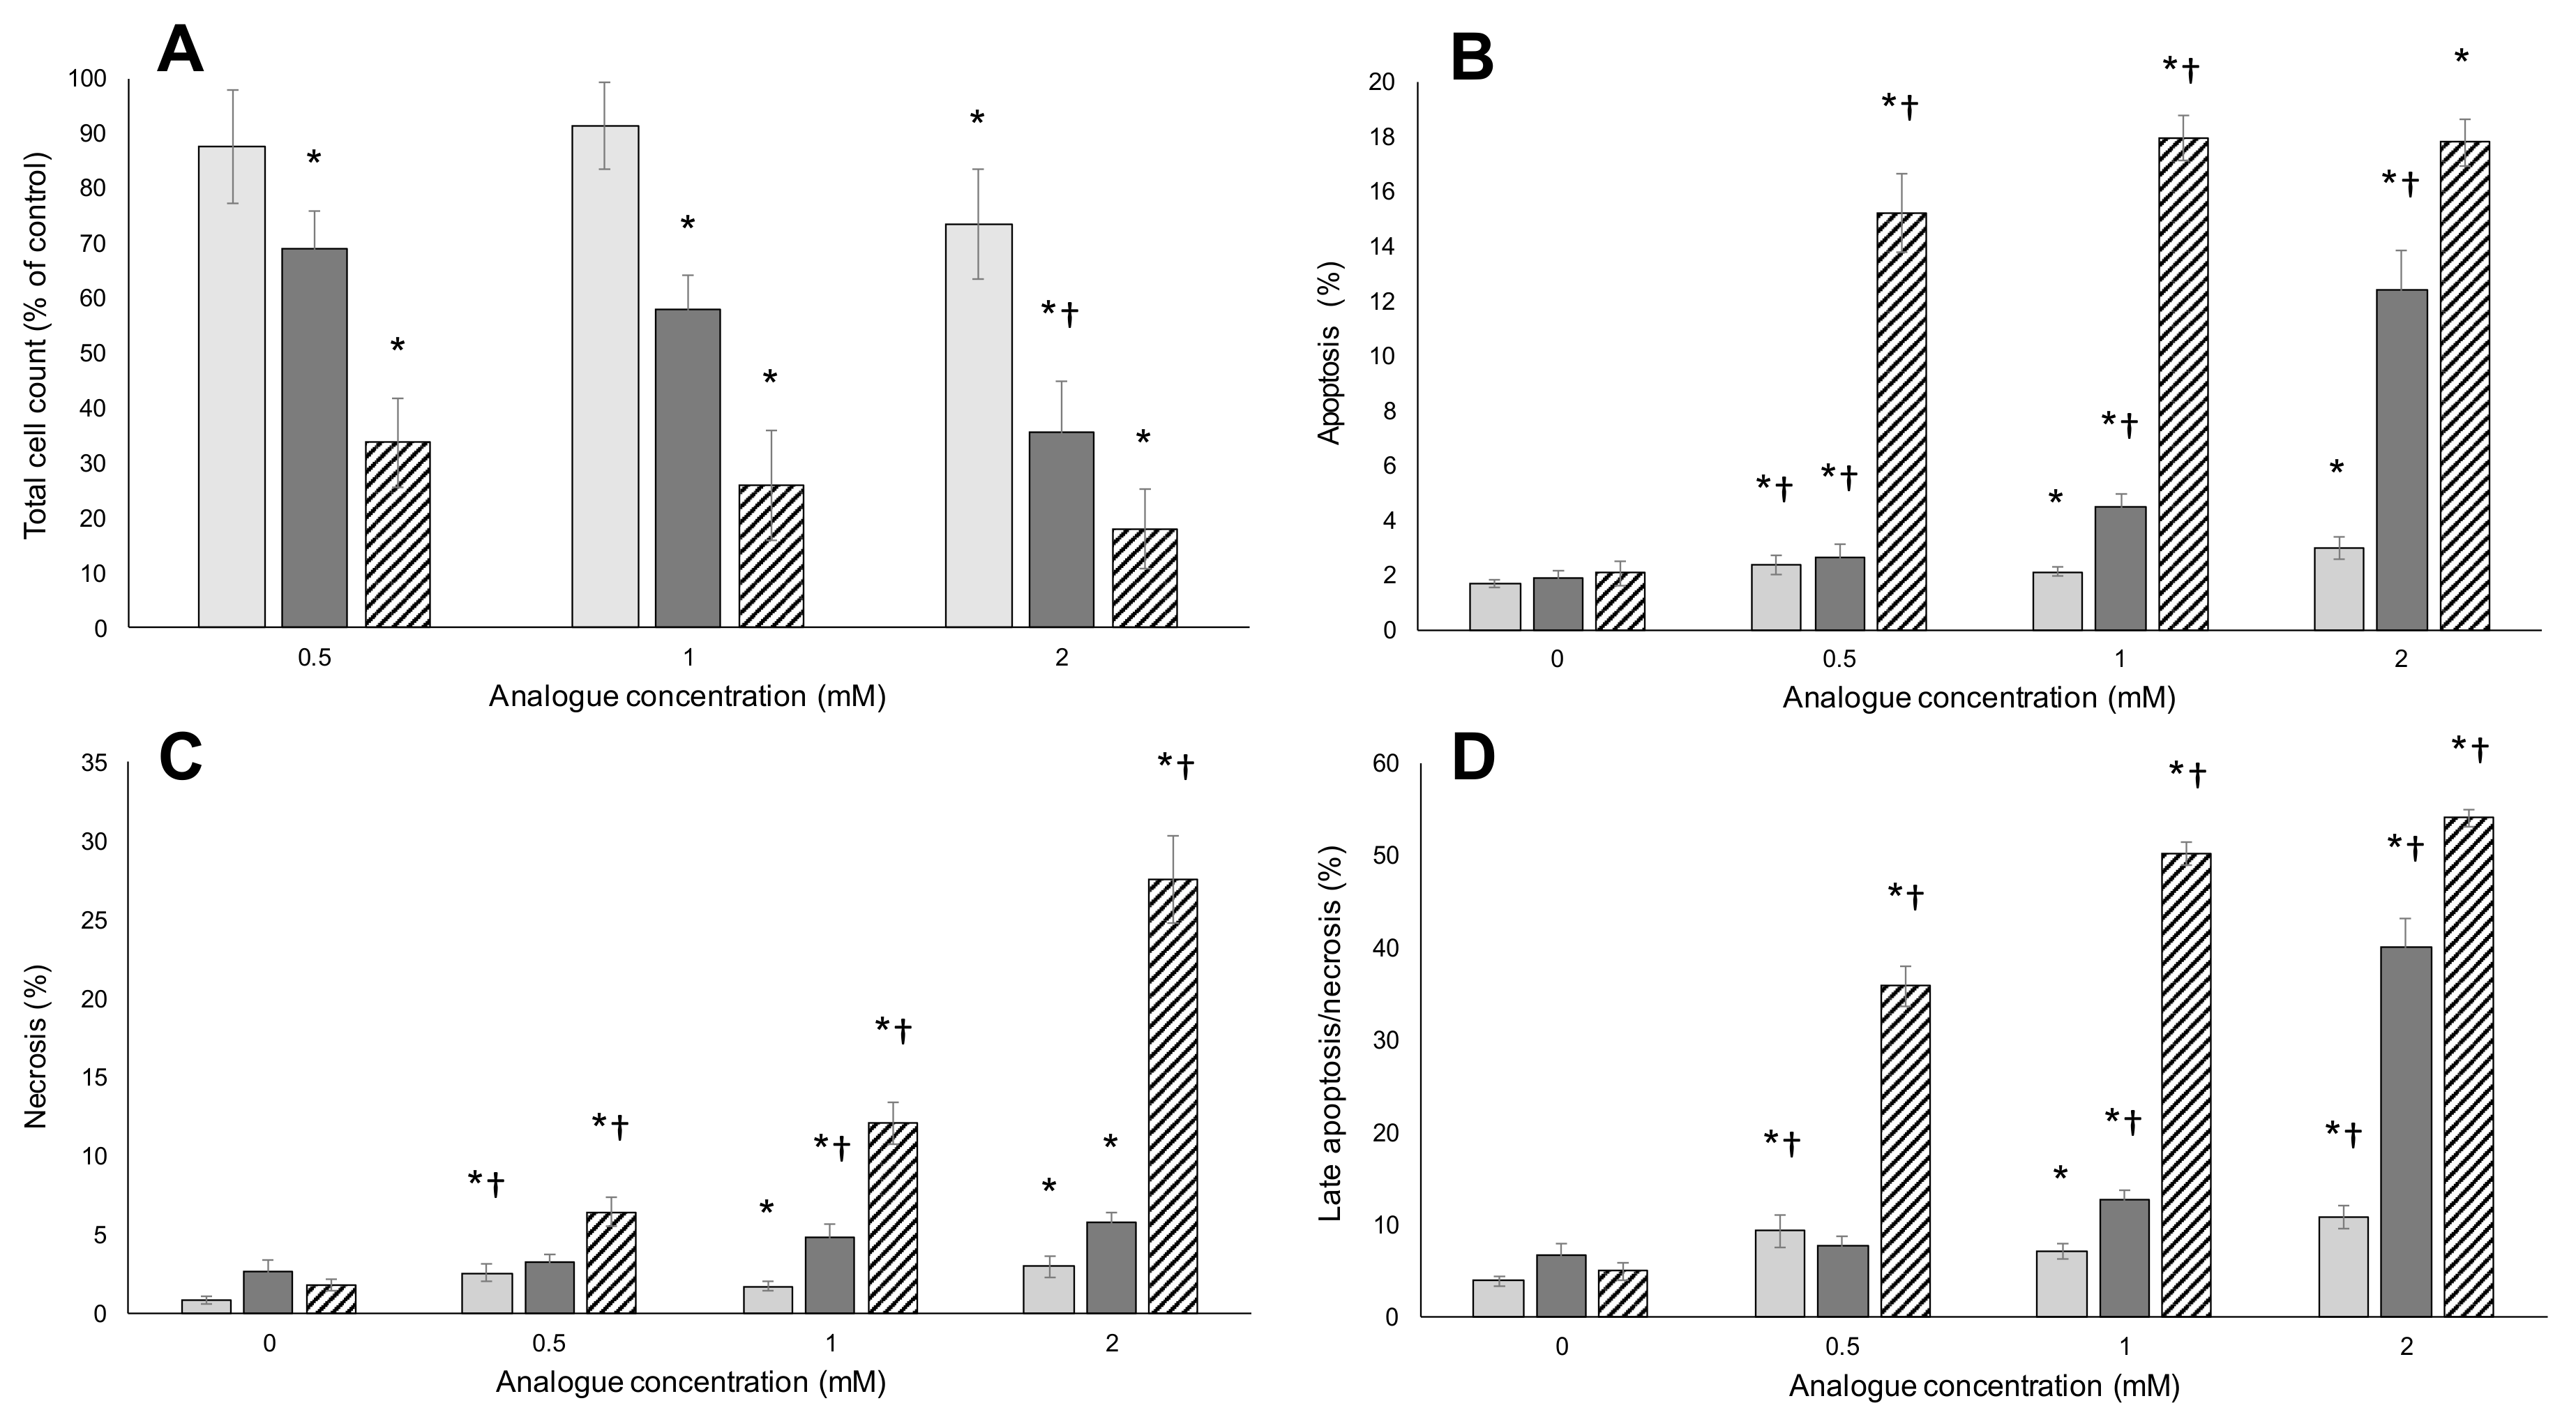
2.2. Apoptosis/Necrosis
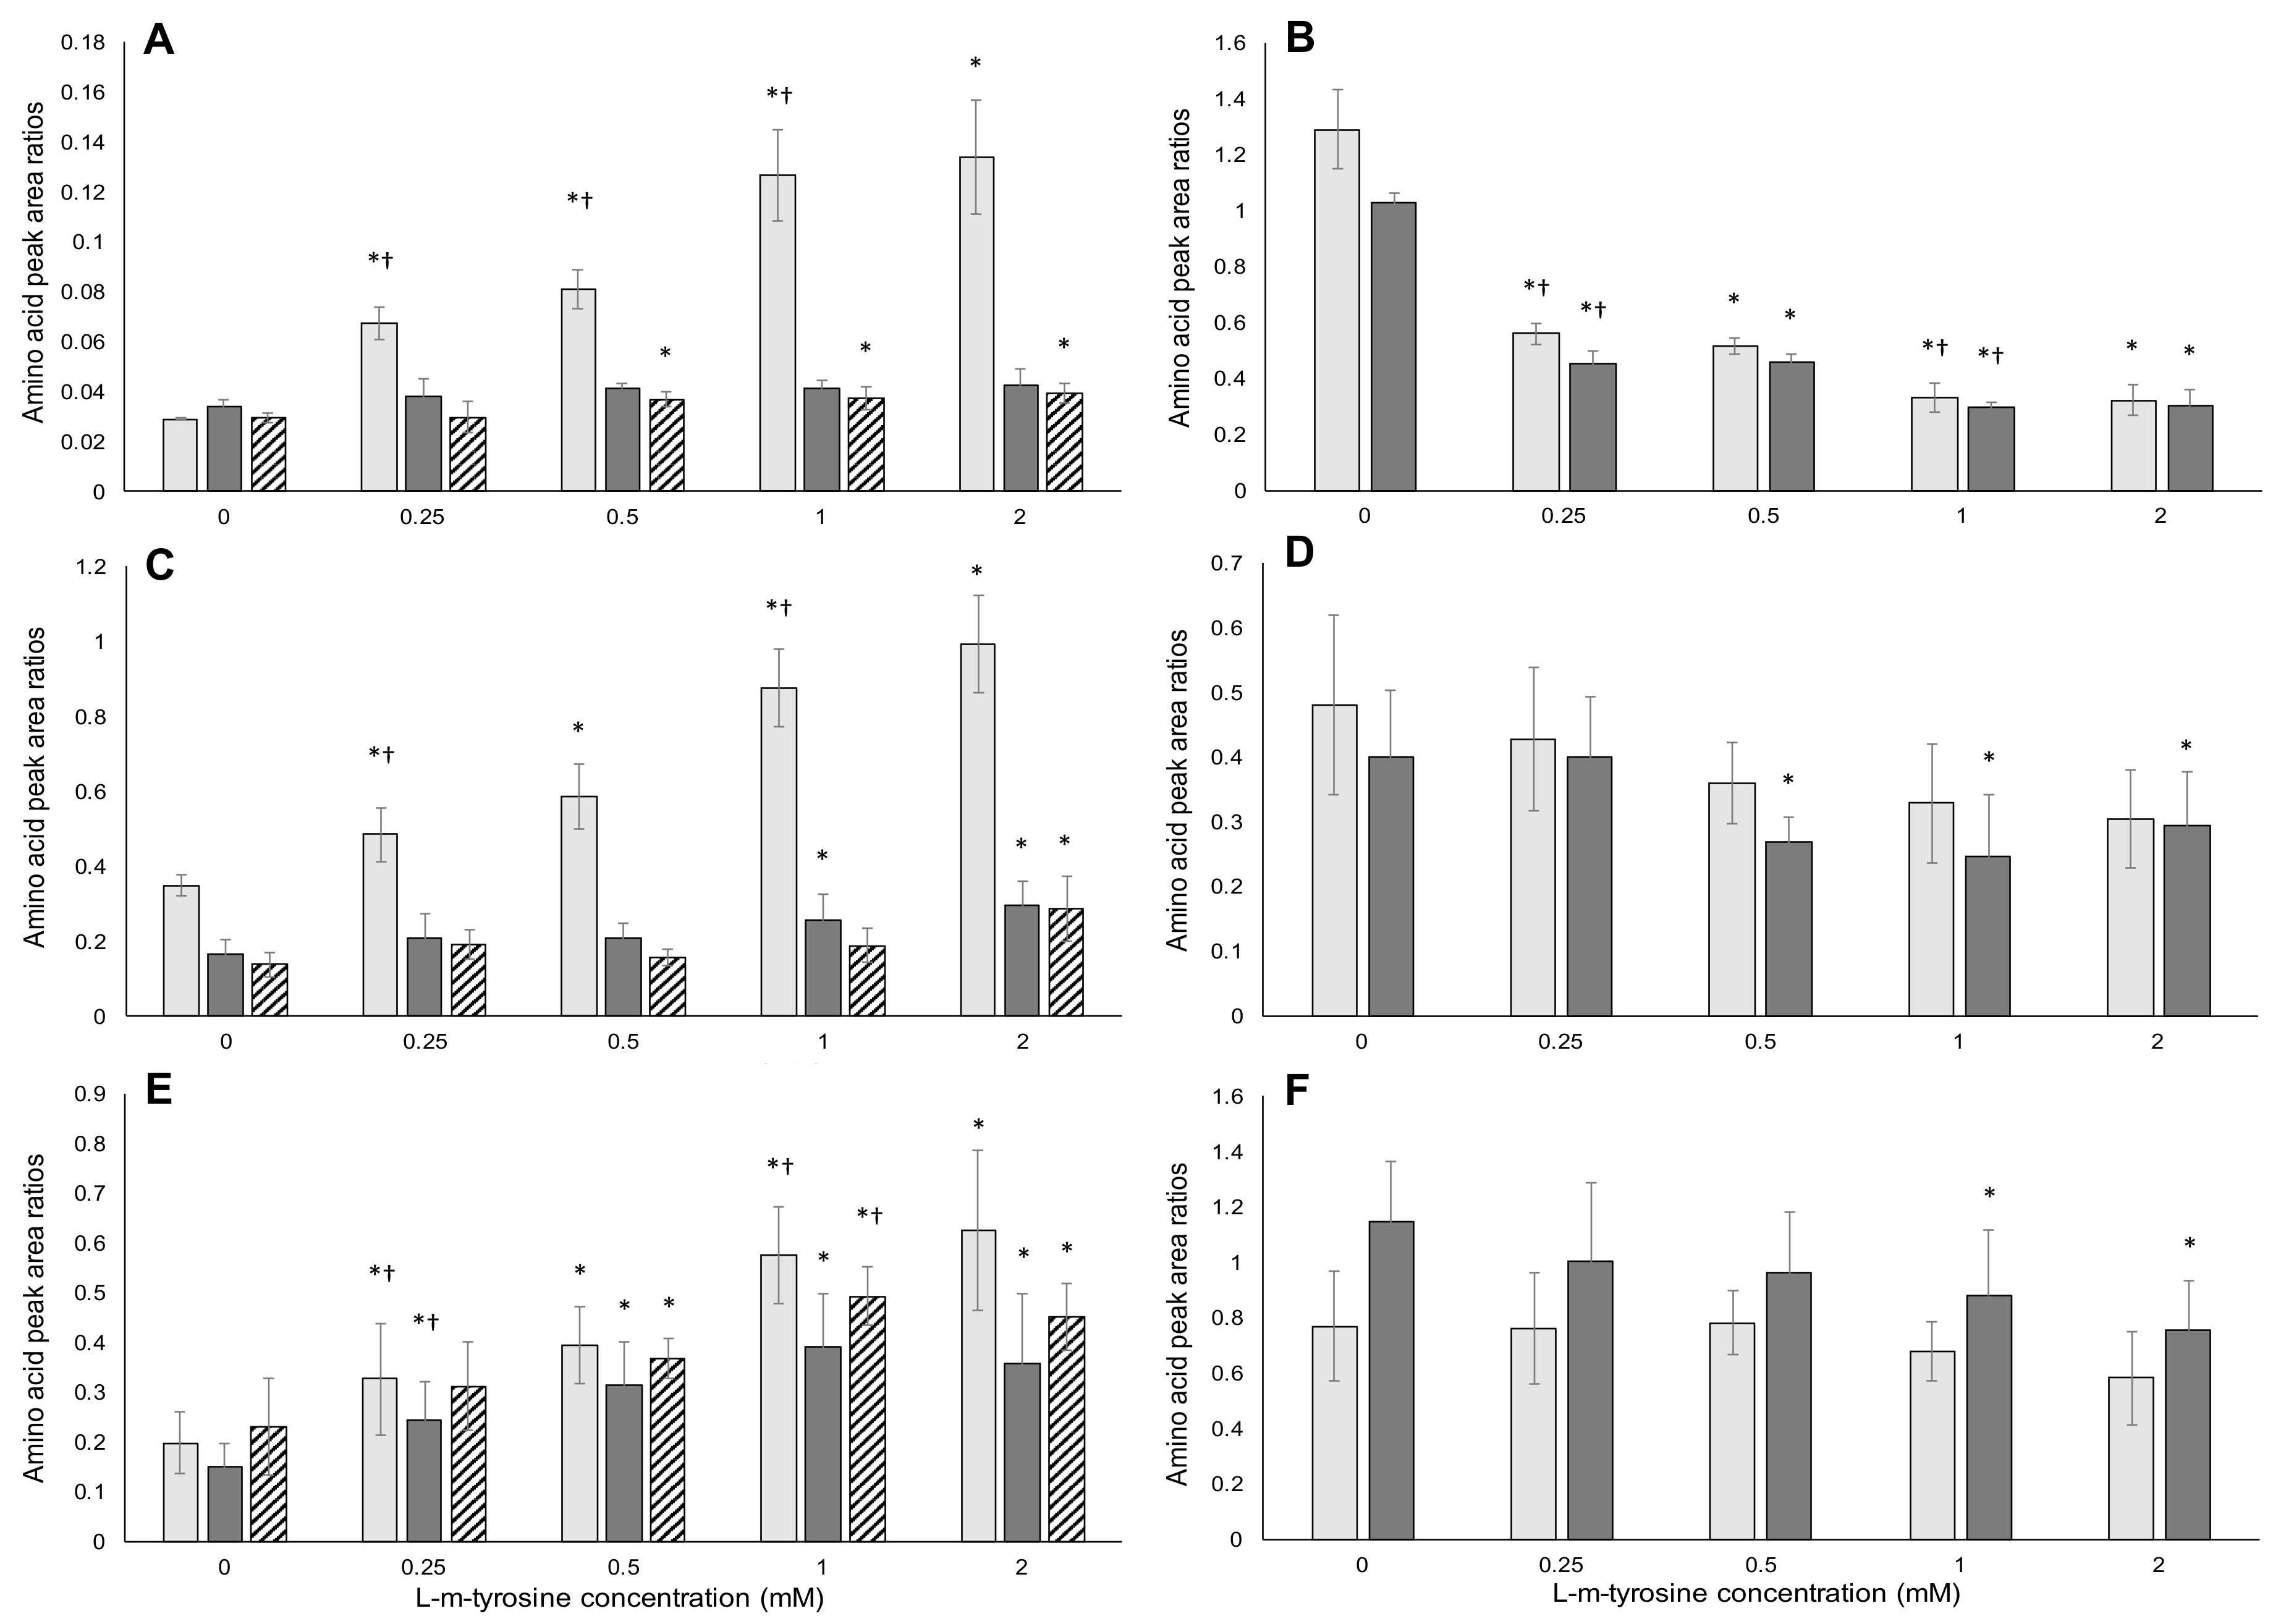
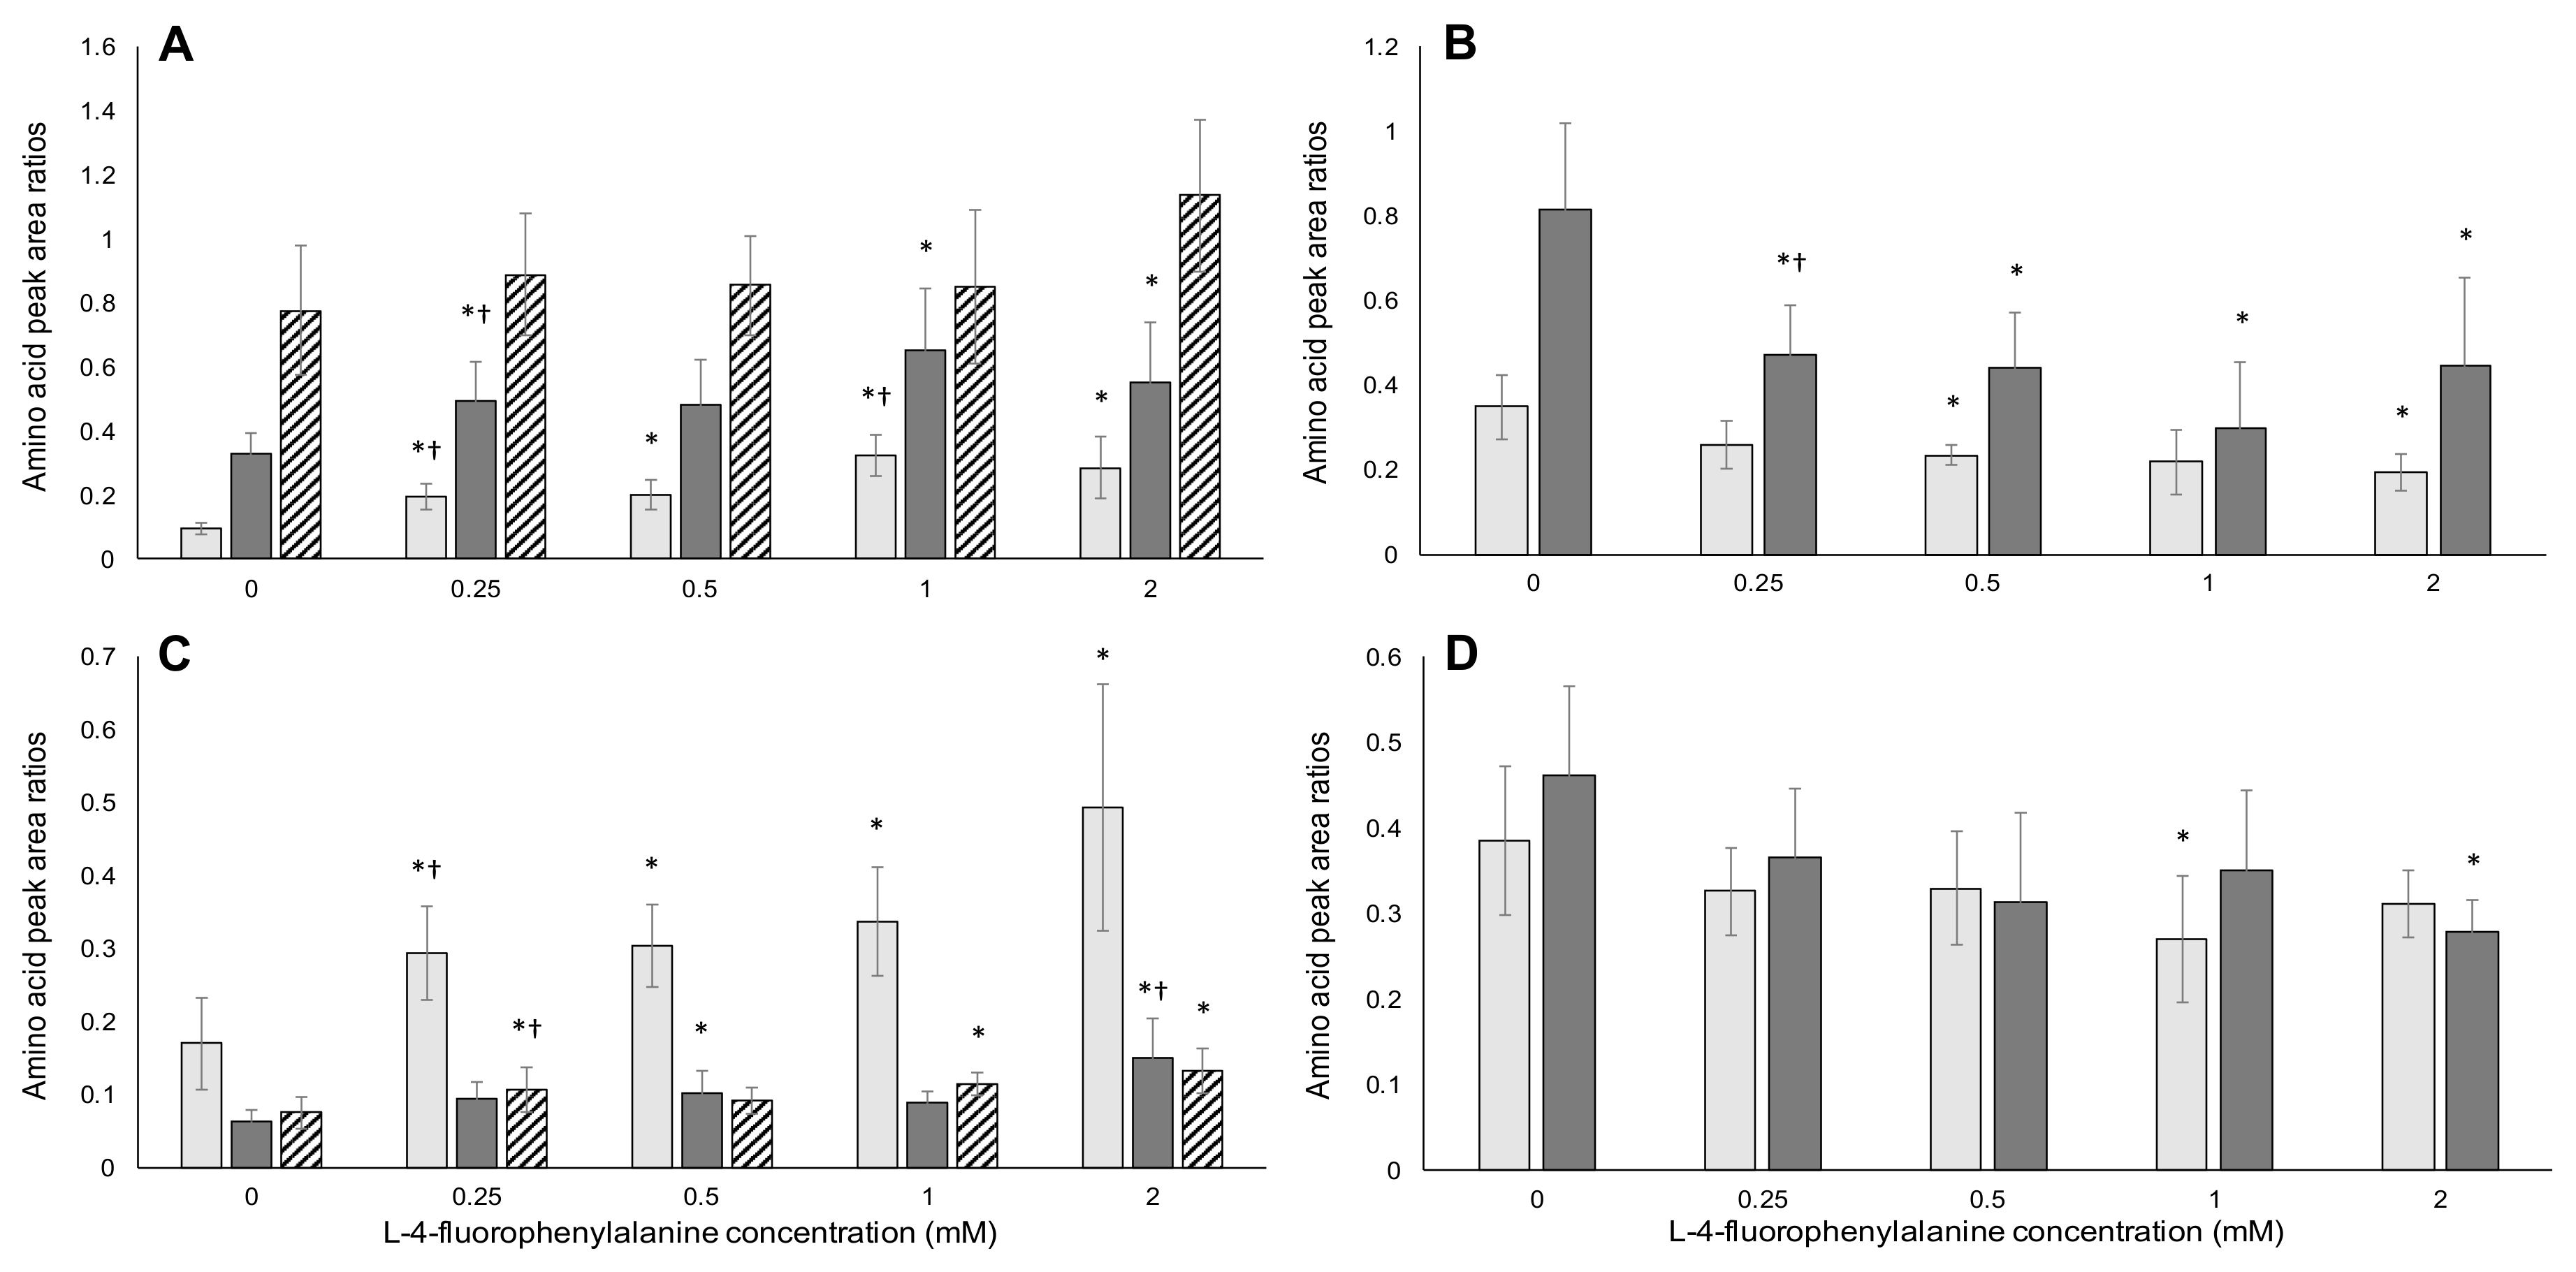
2.3. HPLC/MS-MS Analysis of Amino Acids
2.3.1. l-m-Tyrosine Analysis
2.3.2. l-4-Fluorophenylalanine Analysis
3. Conclusions
4. Materials and Methods
4.1. Cell Culture
4.2. Metabolic Activity (MTT) Assay
4.3. Phosphatidylserine Translocation (Apoptosis/Necrosis)
4.4. Exposure of Cells to Amino Acids and Preparation of Proteins for Analysis
4.5. HPLC/MS-MS Analysis of Amino Acids
4.6. Statistical Analysis
Acknowledgments
Author Contributions
Conflicts of Interest
References
- Downing, S.; Banack, S.A.; Metcalf, J.S.; Cox, P.A.; Downing, T.G. Nitrogen starvation of cyanobacteria results in the production of β-N-methylamino-l-alanine. Toxicon 2011, 58, 187–194. [Google Scholar] [CrossRef] [PubMed]
- Réveillon, D.; Séchet, V.; Hess, P.; Amzil, Z. Production of BMAA and DAB by diatoms (Phaeodactylum tricornutum, Chaetoceros sp., Chaetoceros calcitrans and, Thalassiosira pseudonana) and bacteria isolated from a diatom culture. Harmful Algae 2016, 58, 45–50. [Google Scholar] [CrossRef] [PubMed]
- Vega, A.; Bell, E.A. α-amino-β-methylaminopropionic acid, a new amino acid from seeds of Cycas circinalis. Phytochemistry 1967, 6, 759–762. [Google Scholar] [CrossRef]
- Spencer, P.S.; Nunn, P.B.; Hugon, J.; Ludolph, A.C.; Ross, S.M.; Roy, D.N.; Robertson, R.C. Guam Amyotrophic Lateral Sclerosis-Parkinsonism-Dementia linked to a plant excitant neurotoxin. Science 1987, 237, 517–522. [Google Scholar] [CrossRef] [PubMed]
- Cox, P.A.; Sacks, O.W. Cycad neurotoxins, consumption of flying foxes, and ALS-PDC disease in Guam. Neurology 2002, 58, 956–959. [Google Scholar] [CrossRef] [PubMed]
- Murch, S.J.; Cox, P.A.; Banack, S.A.; Steele, J.C.; Sacks, O.W. Occurrence of β-N-methylamino-l-alanine (BMAA) in ALS/PDC patients from Guam. Acta Neurol. Scand. 2004, 110, 267–269. [Google Scholar] [CrossRef] [PubMed]
- Chiu, A.S.; Gehringer, M.M.; Welch, J.H.; Neilan, B.A. Does α-Amino-β-methylaminopropionic acid (BMAA) play a role in neurodegeneration? Int. J. Environ. Res. Public Health 2011, 8, 3728–3746. [Google Scholar] [CrossRef] [PubMed]
- Stommel, E.W.; Field, N.C.; Caller, T.A. Aerosolization of cyanobacteria as a risk factor for amyotrophic lateral sclerosis. Med. Hypotheses 2013, 80, 142–145. [Google Scholar] [CrossRef] [PubMed]
- Weiss, J.H.; Choi, D.W. Beta-N-methylamino-l-alanine neurotoxicity: Requirement for bicarbonate as a cofactor. Science 1988, 214, 973–975. [Google Scholar] [CrossRef]
- Weiss, J.H.; Chadwich, W.C.; Choi, D.W. Bicarbonate dependence of glutamate receptor activation by β-N-methylamino-L-alanine: Channel recording and study with related compounds. Neuron 1989, 3, 321–326. [Google Scholar] [CrossRef]
- Weiss, J.H.; Koh, J.-Y.; Choi, D.W. Neurotoxicity of β-N-methylamino-l-alanine (BMAA) and β-N-oxalylamino-l-alanine (BOAA) on cultured cortical neurons. Brain Res. 1989, 497, 61–71. [Google Scholar] [CrossRef]
- Myers, T.G.; Nelson, S.D. Neuroactive carbamate adducts of β-N-methylamino-l-alanine and ethylenediamine, detection and quantification under physiological conditions by 13C NMR. J. Biol. Chem. 1990, 265, 10193–10195. [Google Scholar] [PubMed]
- Nunn, P.B.; Ponnusamy, M. β-N-methylamino-l-alanine (BMAA): Metabolism and metabolic effects in model systmes and in neural and other tissues of the rat in vivo. Toxicon 2009, 54, 85–94. [Google Scholar] [CrossRef] [PubMed]
- Kisby, G.E.; Spencer, P.S. Is neurodegenerative disease a long-latency response to early-life genotoxin exposure? Int. J. Environ. Res. Public Health 2011, 8, 3889–3921. [Google Scholar] [CrossRef] [PubMed]
- Scott, L.L.; Downing, S.; Downing, T.G. The Evaluation of BMAA inhalation as a potential exposure route using a rat model. Neurotox. Res. 2017. [Google Scholar] [CrossRef] [PubMed]
- Dunlop, R.A.; Cox, P.A.; Banack, S.A.; Rodgers, K.J. The non-protein amino acid BMAA is misincorporated into human proteins in place of L-serine causing protein misfolding and aggregation. PLoS ONE 2013, 8, e75376. [Google Scholar] [CrossRef] [PubMed]
- Ross, S.M.; Seelig, M.; Spencer, P.S. Specific antagonism of excitotoxic action of ‘uncommon’ amino acids assayed in organotypic mouse cortical cultures. Brain Res. 1987, 425, 120–127. [Google Scholar] [CrossRef]
- Zeevalk, G.D.; Nicklas, W.J. Acute excitotoxicity in chick retina caused by the unusual amino acids BOAA and BMAA: Effects of MK-801 and kynunerate. Neurosci. Lett. 1989, 102, 284–290. [Google Scholar] [CrossRef]
- Copani, A.; Canonico, P.L.; Nicoletti, F. β-N-methylamino-l-alanine (L-BMAA) is a potent agonist of ‘metabotropic’ glutamate receptors. Eur. J. Pharmacol. 1990, 181, 327–328. [Google Scholar] [CrossRef]
- Copani, A.; Canonico, P.L.; Catania, M.V.; Aronica, E.; Bruno, V.; Ratti, E.; Van Amsterdam, F.T.M.; Gavirhagi, G.; Nicoletti, F. Interaction between β-N-methylamino-l-alanine and excitatory amino acid receptors in brain slices and neuronal culture. Brain Res. 1991, 558, 79–86. [Google Scholar] [CrossRef]
- Allen, C.N.; Spencer, P.S.; Carpenter, D.O. β-N-methylamino-l-alanine in the presence of bicarbonate is an agonist at non-N-methyl-d-aspartate-type receptors. Neuroscience 1993, 54, 567–574. [Google Scholar] [CrossRef]
- Chang, Y.-C.; Chiu, S.-J.; Kao, K.-P. Beta-N-methylamino-l-alanine (L-BMAA) decreases brain glutamate receptor number and induces behavioral changes in rats. Chin. J. Physiol. 1993, 36, 79–84. [Google Scholar] [PubMed]
- Brownson, D.M.; Mabry, T.J.; Leslie, S.W. The cycad neurotoxic amino acid, β-N-methylamino-l-alanine (BMAA), elevates intracellular calcium levels in dissociated rat brain cells. J. Ethnopharmacol. 2002, 82, 159–167. [Google Scholar] [CrossRef]
- Rao, S.D.; Banack, S.A.; Cox, P.A.; Weiss, J.H. BMAA selectively injures motor neurons via AMPA/kainite receptor activation. Exp. Neurol. 2006, 201, 244–252. [Google Scholar] [CrossRef] [PubMed]
- Cucchiaroni, M.L.; Viscomi, M.T.; Bernardi, G.; Molinari, M.; Guatteo, E.; Mercuri, N.B. Metabotropic glutamate receptor I mediates the electrophysiology and toxic actions of the cycad derivative β-N-methylamino-l-alanine on substantia nigra pars compacta DAergic neurons. J. Neurosci. 2010, 30, 5176–5188. [Google Scholar] [CrossRef] [PubMed]
- Chiu, A.S.; Gehringer, M.M.; Braidy, N.; Guillemin, G.J.; Welch, J.H.; Neilan, B.A. Excitotoxic potential of the cyanotoxin β-methyl-amino-L-alanine (BMAA) in primary human neurons. Toxicon 2012, 60, 1159–1165. [Google Scholar] [CrossRef] [PubMed]
- Chiu, A.S.; Gehringer, M.M.; Braidy, N.; Guillemin, G.J.; Welch, J.H.; Neilan, B.A. Gliotoxicity of the cyanotoxin β-N-methylamino-l-alanine (BMAA). Sci. Rep. 2013, 3, 1482. [Google Scholar] [CrossRef] [PubMed]
- Manzoni, O.J.J.; Prezeau, L.; Bockaert, J. β-N-methylamino-l-alanine is a low-affinity agonist of metabotropic glutamate receptors. Neuroreport 1991, 2, 609–611. [Google Scholar] [CrossRef] [PubMed]
- Pai, K.S.; Shankar, S.K.; Ravindranath, V. Billionfold difference in the toxic potencies of two excitatory plant amino acids, L-BOAA and L-BMAA: Biochemical and morphological studies using mouse brain slices. Neurosci. Res. 1993, 17, 241–248. [Google Scholar] [CrossRef]
- Lee, M.; McGeer, P.L. Weak BMAA toxicity compares with that of the dietary supplement β-alanine. Neurobiol. Aging 2012, 33, 1440–1447. [Google Scholar] [CrossRef] [PubMed]
- Murch, S.J.; Cox, P.A.; Banack, S.A. A mechanism of slow release of biomagnified cyanobacterial neurotoxins and neurodegenerative disease in Guam. Proc. Natl. Acad. Sci. USA 2004, 101, 12228–12231. [Google Scholar] [CrossRef] [PubMed]
- Glover, W.B.; Mash, D.C.; Murch, S.J. The natural non-protein amino acid N-β-methylamino-l-alanine (BMAA) is incorporated into proteins during synthesis. Amino Acids 2014, 46, 2553–2559. [Google Scholar] [CrossRef] [PubMed]
- Okle, O.; Stemmer, K.; Deschl, U.; Dietrich, D.R. L-BMAA induced ER stress and enhanced caspase 12 cleavage in human neuroblastoma SH-SY5Y cells at low neuroexcitotoxic concentrations. Toxicol. Sci. 2012, 131, 217–224. [Google Scholar] [CrossRef] [PubMed]
- Van Onselen, R.; Cook, N.A.; Phelan, R.R.; Downing, T.G. Bacteria do not incorporate β-N-methylamino-l-alanine into their proteins. Toxicon 2015, 102, 55–61. [Google Scholar] [CrossRef] [PubMed]
- Levine, M.; Fopeano, J.V. The use of amino acid analogues in studies of plant metabolism. Phytochem. Anal. 1953, 202, 835–850. [Google Scholar]
- Cohen, G.N.; Adelberg, E.A. Kinetics of incorporation of p-fluorophenylalanine by a mutant of Escherichia coli resistant to this analogue. J. Bacteriol. 1958, 76, 328–330. [Google Scholar] [PubMed]
- Cowie, D.B.; Cohen, G.N.; Bolton, E.T.; De Robichon-Szulmajster, H. Amino acid analog incorporation into bacterial proteins. Biochim. Biophys. Acta 1959, 34, 39–46. [Google Scholar] [CrossRef]
- Yoshida, A.; Yamasaki, M. Studies on the mechanism of protein synthesis. Incorporation of ethionine into α-amylase in Bacillus subtilis. Biochim. Biophys. Acta 1959, 34, 158–164. [Google Scholar] [CrossRef]
- Rubenstein, E. Biologic effects of and clinical disorders caused by nonprotein amino acids. Medicine 2000, 79, 80–89. [Google Scholar] [CrossRef] [PubMed]
- Rodgers, K.J.; Shiozawa, N. Misincorporation of amino acid analogues into proteins by biosynthesis. Int. J. Biochem. Cell Biol. 2008, 40, 1452–1466. [Google Scholar] [CrossRef] [PubMed]
- Wright, J.E.; Srb, A.M. Inhibition of growth in maize embryos by canavanine and its reversal. Bot. Gaz. 1950, 112, 52–57. [Google Scholar] [CrossRef]
- Schachtele, C.F.; Rogers, P. Mechanism of canavanine death in Escherichia coli I: Effect of canavanine on macromolecular synthesis. J. Mol. Biol. 1968, 33, 843–860. [Google Scholar] [CrossRef]
- Malinow, M.R.; Bardana, E.J., Jr.; Goodnight, S.H., Jr. Pancytopenia during ingestion of alfalfa seeds. Lancet 1981, 1, 615. [Google Scholar] [CrossRef]
- Malinow, M.R.; Bardana, E.J., Jr.; Pirofsky, B.; Craig, S. Systemic Lupus Erythematosus-like syndrome in monkeys fed alfalfa sprouts: Role of a nonprotein amino acid. Science 1982, 216, 415–417. [Google Scholar] [CrossRef] [PubMed]
- Bardana, E.J., Jr.; Malinow, M.R.; Houghton, D.C.; McNutty, W.P.; Wuepper, K.D.; Parker, F.; Pirofsky, B. Diet-induced Systemic Lupus Erythematosus (SLE) in primates. Am. J. Kidney Dis. 1982, 1, 345–352. [Google Scholar] [CrossRef]
- Roberts, J.L.; Hayashi, J.A. Exacerbation of SLE associated with alfalfa ingestion. N. Engl. J. Med. 1983, 308, 1361. [Google Scholar] [PubMed]
- Michelangeli, C.; Vargas, R.E. l-canavanine influences feed intake, plasma basic amino acid concentration and kidney arginase activity in chicks. J. Nutr. 1994, 124, 1081–1087. [Google Scholar]
- Rosenthal, G.A.; Harper, L. L-homoarginine studies provide insight into the antimetabolic properties of l-canavanine. Insect Biochem. Mol. Biol. 1996, 26, 389–394. [Google Scholar] [CrossRef]
- Fowden, L. Azetidine-2-carboxylic acid: A new cyclic amino acid occurring in plants. Biochem. J. 1956, 64, 323–332. [Google Scholar] [CrossRef] [PubMed]
- Fowden, L.; Richmond, M.H. Replacement of proline by azetidine-2-carboxylic acid during biosynthesis of protein. Biochim. Biophys. Acta 1963, 71, 459–461. [Google Scholar] [CrossRef]
- Carrington, M.J.; Fornieri, D.; Bartlet, C.P.; Heale, G.; Levene, C.I. Biochemical and ultrastructural study of the effects of proline analogues on collagen synthesis in 3T6 fibroblasts. J. Pharm. Pharmacol. 1985, 37, 794–801. [Google Scholar] [CrossRef] [PubMed]
- Alescio, T. Effect of a proline analogue, azetidine-2-carboxylic acid, on the morphogenesis in vitro of mouse embryonic lung. J. Embryol. Exp. Morphol. 1973, 29, 439–451. [Google Scholar] [PubMed]
- Joneja, M.G. Teratogenic effects of proline analogue L-azetidine-2-caboxylic acid in hamster fetuses. Teratology 1981, 23, 365–372. [Google Scholar] [CrossRef] [PubMed]
- Rubenstein, E.; Zhou, H.; Krasinska, K.M.; Chien, A.; Becker, C.H. Azetidine-2-carboxylic acid in garden beets (Beta vulgaris). Phytochemistry 2006, 67, 898–903. [Google Scholar] [CrossRef] [PubMed]
- Rubenstein, E. Misincorporation of the proline analog azetidine-2-carboxylic acid in the pathogenesis of multiple sclerosis: A hypothesis. J. Neuropathol. Exp. Neurol. 2008, 67, 1035–1040. [Google Scholar] [CrossRef] [PubMed]
- Chalmers, G.A. Swayback (Enzootic Ataxia) in Alberta Lambs. Can. J. Comp. Med. 1974, 38, 111–117. [Google Scholar] [PubMed]
- Bertin, C.; Weston, L.A.; Huang, T.; Jander, G.; Owens, T.; Meinwald, J.; Schroeder, F.C. Grass roots chemistry: Meta-Tyrosine, an herbicidal nonprotein amino acid. Proc. Natl. Acad. Sci. USA 2007, 104, 16964–16969. [Google Scholar] [CrossRef] [PubMed]
- Aronson, J.N.; Wemus, G.R. Effects of m-tyrosine on growth and sporulation of Bacillus species. J. Bacteriol. 1965, 90, 38–46. [Google Scholar] [PubMed]
- Bullwinkle, T.J.; Reynolds, N.M.; Raina, M.; Moghal, A.; Matsa, E.; Rajkovic, A.; Kayadibi, H.; Fazlollahi, F.; Ryan, C.; Howits, N.; et al. Oxidation of cellular amino acid pools leads to cytotoxic mistranslation of the genetic code. eLife 2014, 3, e02501. [Google Scholar] [CrossRef] [PubMed]
- Gurer-Ohran, H.; Ercal, N.; Mare, S.; Pennathur, S.; Orhan, H.; Heinecke, H.W. Misincorporation of free m-tyrosine into cellular proteins: A potential cytotoxic mechanism for oxidized amino acids. Biochem. J. 2006, 395, 277–284. [Google Scholar] [CrossRef] [PubMed]
- Huggins, T.G.; Wells-Knecht, M.C.; Detorie, N.A.; Baynes, J.W.; Thorpe, S.R. Formation of o-tyrosine and dityrosine in proteins during radiolytic and metal-catalyzed oxidation. J. Biol. Chem. 1993, 268, 12341–12347. [Google Scholar] [PubMed]
- Stadtman, E.R.; Levine, R.L. Free radical-mediated oxidation of free amino acids and amino acid residues in proteins. Amino Acids 2003, 25, 201–218. [Google Scholar] [CrossRef] [PubMed]
- Klipcan, L.; Moor, N.; Kessler, N.; Safro, M.G. Eukaryotic cytosolic and mitochondrial phenylalanyl-tRNA synthetases catalyze the charging of tRNA with the meta-tyrosine. Proc. Natl. Acad. Sci. USA 2009, 106, 11045–11048. [Google Scholar] [CrossRef] [PubMed]
- Karlsson, O.; Lindquist, N.G.; Brittebo, E.B.; Roman, E. Selective brain uptake and behavioral effects of the cyanobacterial toxin BMAA (beta-N-methylamino-l-alanine) following neonatal administration to rodents. Toxicol. Sci. 2009, 109, 286–295. [Google Scholar] [CrossRef] [PubMed]
- Duncan, M.W.; Villacresis, N.E.; Pearson, P.G.; Wyatt, L.; Rapoport, S.I.; Kopin, I.J.; Markey, S.P.; Smith, Q.R. 2-Amino-3-(Methylamino)-Propionic Acid (BMAA) Pharmacokinetics and blood-brain barrier permeability in the rat. J. Pharmacol. Exp. Ther. 1991, 258, 27–35. [Google Scholar] [PubMed]
- Banack, S.A.; Murch, S.J.; Cox, P.A. Neurotoxic flying foxes as dietary items for the Chamorro people, Marianas Islands. J. Ethnopharamacol. 2006, 106, 97–104. [Google Scholar] [CrossRef] [PubMed]
- Karlsson, O.; Berg, C.; Brittebo, E.B.; Lindquist, N.G. Retention of the cyanobacterial neurotoxin β-N-methylamino-l-alanine in melanin and neuromelanin-containing cells—A possible link between Parkinson-dementia complex and pigmentary retinopathy. Pigment Cell Melanoma Res. 2008, 22, 120–130. [Google Scholar] [CrossRef] [PubMed]
- Spencer, P.S. Guam ALS/Parkinsonism-Dementia: A long-latency neurotoxic disorder caused by “Slow Toxin(s)” in food? Can. J. Neurol. Sci. 1987, 14, 347–357. [Google Scholar] [CrossRef] [PubMed]
- Van Onselen, R.; Venables, L.; Van De Venter, M.; Downing, T.G. β-N-methylamino-l-alanine toxicity in PC12: Excitotoxicity vs. Misincorporation. Neurotox. Res. 2017. [Google Scholar] [CrossRef] [PubMed]
- Richmond, M.H. The effect of amino acid analogues on growth and protein synthesis in microorganisms. Bacteriol. Rev. 1962, 26, 398–420. [Google Scholar] [PubMed]
- Nunn, P.B.; O’Brien, P. The interaction of beta-N-methylamino-L-alanine with bicarbonate: An 1H-NMR study. FEBS Lett. 1989, 251, 31–35. [Google Scholar] [CrossRef]
- Härtlein, M.; Cusack, S. Structure, function and evolution of seryl-tRNA synthetases: Implications for the evolution of aminoacyl-tRNA synthetases and the genetic code. J. Mol. Evol. 1995, 40, 519–530. [Google Scholar] [CrossRef] [PubMed]
- Metcalf, J.S.; Lobner, D.; Banack, S.A.; Cox, G.A.; Nunn, P.B.; Wyatt, P.B.; Cox, P.A. Analysis of BMAA enantiomers in cycads, cyanobacteria and mammals: In vivo formation and toxicity of D-BMAA. Amino Acids 2017, 49, 1427–1439. [Google Scholar] [CrossRef] [PubMed]
- Nunn, P.B. 50 years of reseach on α-amino-β-methylaminopropionic acid (β-methylaminoalanine). Phytochemistry 2017, 144, 271–281. [Google Scholar] [CrossRef] [PubMed]
- Metcalf, J.S.; Dunlop, R.A.; Powell, J.T.; Banack, S.A.; Cox, P.A. L-Serine: A naturally-occurring amino acid with therapeutic potential. Neurotox. Res. 2017. [Google Scholar] [CrossRef] [PubMed]
- Esterhuizen-Londt, M.; Pflugmacher, S.; Downing, T.G. The effect of β-N-methylamino-L-alanine (BMAA) on oxidative stress response enzymes of the macrophyte Ceratophyllum demersum. Toxicon 2011, 57, 803–810. [Google Scholar] [CrossRef] [PubMed]
- Esterhuizen-Londt, M.; Wiegand, C.; Downing, T.G. β-N-methylamino-l-alanine (BMAA) uptake by the animal model, Daphnia magna and subsequent oxidative stress. Toxicon 2015, 100, 20–26. [Google Scholar] [CrossRef] [PubMed]
- Laemmli, U.K. Cleavage of structural proteins during the assembly of the head of bacteriophage T4. Nature 1970, 227, 680–685. [Google Scholar] [CrossRef] [PubMed]


| Analyte | Q1 Mass (m/z) | Q3 Mass (m/z) | DP (V) | CE (V) | CXP (V) |
|---|---|---|---|---|---|
| l-glycine Q | 246.14 | 171.00 | 61 | 29 | 14 |
| l-glycine q | 264.14 | 116.20 | 61 | 63 | 18 |
| l-serine Q | 276.17 | 170.90 | 71 | 37 | 28 |
| l-serine q | 276.17 | 115.90 | 71 | 71 | 18 |
| l-phenylalanine Q | 336.15 | 171.00 | 76 | 33 | 14 |
| l-phenylalanine q | 336.15 | 115.90 | 76 | 91 | 18 |
| l-m-tyrosine Q | 352.24 | 171.00 | 81 | 33 | 14 |
| l-m-tyrosine q | 352.24 | 116.00 | 81 | 91 | 18 |
| l-4-fluorophenylalanine Q | 354.16 | 171.00 | 66 | 33 | 14 |
| l-4-flurophenylalanine q | 354.16 | 116.00 | 66 | 89 | 18 |
| l-BMAA Q | 459.20 | 171.00 | 86 | 53 | 14 |
| l-BMAA q1 | 459.20 | 119.00 | 86 | 31 | 10 |
| l-BMAA q2 | 459.20 | 258.00 | 86 | 33 | 22 |
| l-BMAA-4,4,4-d3,15N2 Q | 464.21 | 171.00 | 86 | 53 | 1 |
| l-BMAA-4,4,4-d3,15N2 q1 | 464.21 | 124.00 | 86 | 31 | 10 |
| l-BMAA-4,4,4-d3,15N2 q2 | 464.21 | 259.20 | 86 | 33 | 22 |
© 2017 by the authors. Licensee MDPI, Basel, Switzerland. This article is an open access article distributed under the terms and conditions of the Creative Commons Attribution (CC BY) license (http://creativecommons.org/licenses/by/4.0/).
Share and Cite
Onselen, R.V.; Downing, S.; Kemp, G.; Downing, T. Investigating β-N-Methylamino-l-alanine Misincorporation in Human Cell Cultures: A Comparative Study with Known Amino Acid Analogues. Toxins 2017, 9, 400. https://0-doi-org.brum.beds.ac.uk/10.3390/toxins9120400
Onselen RV, Downing S, Kemp G, Downing T. Investigating β-N-Methylamino-l-alanine Misincorporation in Human Cell Cultures: A Comparative Study with Known Amino Acid Analogues. Toxins. 2017; 9(12):400. https://0-doi-org.brum.beds.ac.uk/10.3390/toxins9120400
Chicago/Turabian StyleOnselen, Rianita Van, Simoné Downing, Gabré Kemp, and Tim Downing. 2017. "Investigating β-N-Methylamino-l-alanine Misincorporation in Human Cell Cultures: A Comparative Study with Known Amino Acid Analogues" Toxins 9, no. 12: 400. https://0-doi-org.brum.beds.ac.uk/10.3390/toxins9120400