1. Introduction
Cosmic air showers are usually detected using large arrays of particle and fluorescence detectors. In the sixties, a new, complementary method of detecting cosmic ray showers was proposed, using the Radio Frequency (RF) signature caused by the electromagnetic interactions of the shower charged particles. The Extensive Air Showers (EAS) RF signals were detected for the first time in 1965, but interest in this method of detection was soon subsided because of inadequate technology. In the beginning of the 21st century, the interest was reborn given the advances in fast digital electronics and the low cost of the antennas compared to large scintillator detectors. Since then, several experiments have studied this method [
1,
2], and more are planned for the future. The advantage of this method of detection is the good sensitivity to the cosmic ray energy and mass [
3,
4,
5], but also the large duty cycle, being of the order of 95%, compared to other methods such as fluorescence and Cherenkov detection. On the other hand, the relative weak RF signals from air showers limit the application of this technique to radio quiet environments far away from cities and human made electromagnetic noise.
In recent years, the issue of radio detection of EAS was revisited in 2003 by the LOw Frequancy ARray (LOFAR) Prototype Station (LOPES) [
6] and the COsmic ray Detection Array with Logarithmic ElectroMagnetic Antennas (CODALEMA) [
7] experiments, which paved the way for cosmic ray experiments with digital radio telescopes. In contrast to the radio quiet site of CODALEMA, the LOPES experiment was operated in strong RF background environment. However, by combining the experimental information from particle detectors and radio antennas it was demonstrated that air showers could be RF detected, despite the high radio background of the site. Since then many experiments were designed and constructed using the hybrid approach i.e., combining different detection techniques [
1]. In this work we study the potential of a small scale hybrid cosmic ray telescope (Astroneu array) to detect the RF signature of EAS when operating in urban sites with strong electromagnetic noise. The Astroneu array [
8] consists of three autonomous and hybrid-technology EAS detection stations, deployed at the Hellenic Open University (HOU) campus. Each station consists of three particle detectors along with one RF antenna and is equipped with trigger, digitization and Data Acquisition (DAQ) electronics. It is also equipped with slow control and monitor electronics and a Global Positioning System (GPS)-based timing system. Standard installation, calibration and operation procedures have been established and software for controlling, monitoring and collecting data from the detectors’ network has been developed. Furthermore, software packages to simulate in detail the response of the detectors to showers as well as to reconstruct the EAS characteristics have been advanced [
9].
The detector network has been operated, collecting data for more than 3 years. In previous studies, we evaluated the performance of the Astroneu array in detecting and reconstructing EAS using the charged particle detectors [
9], while the RF component of the EAS was studied using noise filters, timing and signal polarization [
10]. In this work we extend the analysis of the RF signals by correlating the timing and the strength of the RF signals with the particle detector data and by comparing with the simulation predictions. In
Section 2 we describe briefly the architecture of the Astroneu array, while in
Section 3 we focus on the quality criteria used to select very high energy air showers.
Section 4 focuses on the timing of the RF signals with respect to the charge particle detectors and the combined performance in estimating the angular direction of the shower axis is presented. Finally, in
Section 5 we compare the simulation prediction with the measured electric field from the RF data.
2. The Astroneu Array
The Astroneu array [
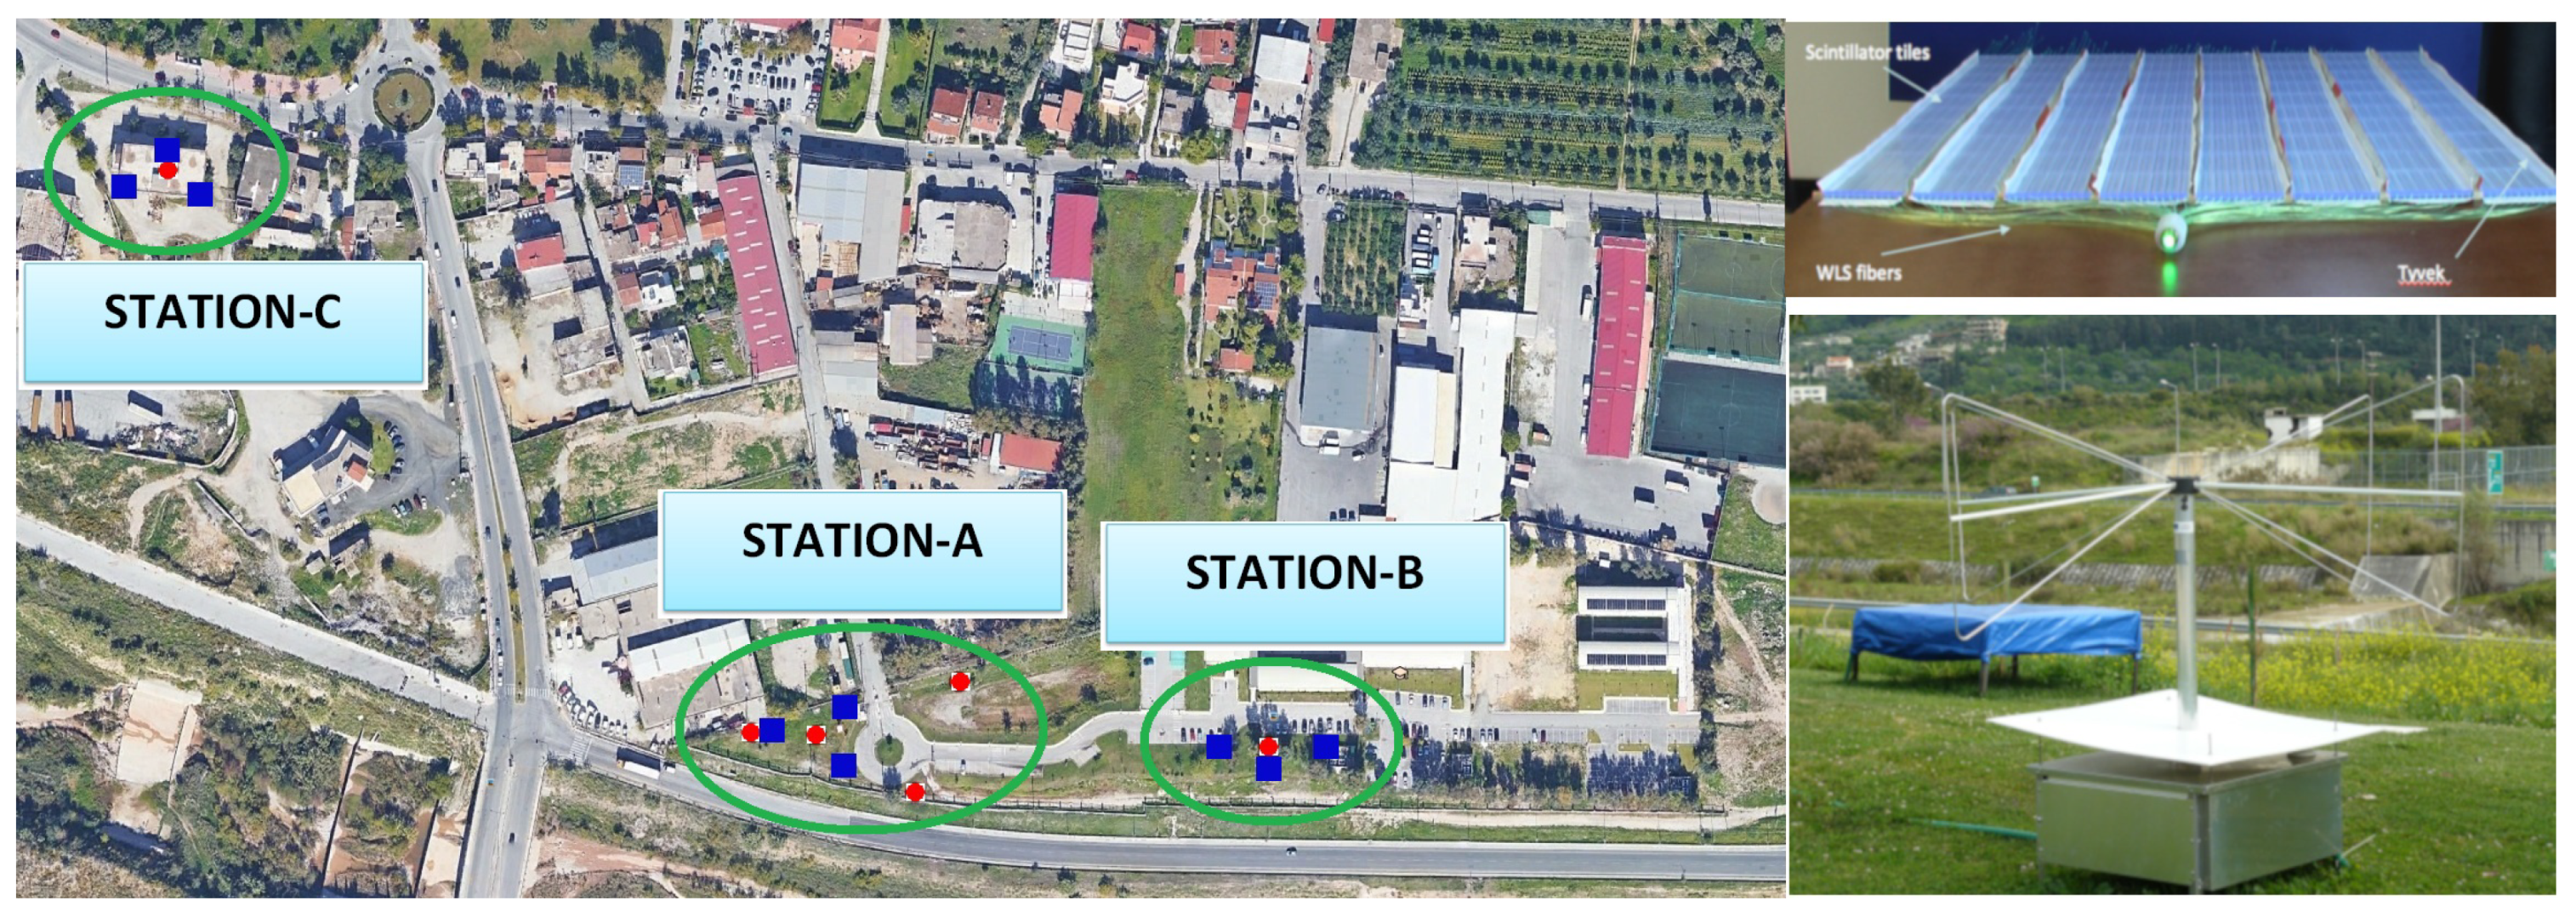
8] comprises three autonomous EAS detection stations, located as depicted in
Figure 1. Each station consists of three HELYCON
1 Detector Modules (HDM) [
8] and one
2 Codalema type butterfly RF Antenna (RFA) [
12] The HDM is made of 160 scintillating tiles covering an area of about 1 m
2. The light produced by the scintillator is guided to a single Photomultiplier tube (PMT) using 96 embedded wavelength shifting fibers (WLS).
The signals of the three HDM PMTs are acquired by a Quarknet DAQ board [
13], which employs a majority trigger logic when the signals exceed a predefined voltage threshold and measures the times of the threshold crossings of the PMT waveforms with an accuracy of 1.25 ns. The time of the first crossing defines the timing of the pulse, while the time that the pulse remains above the threshold (Time over Threshold—ToT) is used to estimate the pulse size. The RFA detection system in each Astroneu station is a Codalema-type bipolar RF antenna [
12], operating at frequencies between 20 and 80 MHz, triggered by the response of the charged particle detectors of each station
3. Apart from the external triggering, the RFA system is independent. It is equipped with its own signal detection, filtering, time-tagging of the events, DAQ and storage modules. The signals from the two polarizations (in EW and NS direction) are amplified by a two-channel low noise amplifier and then they are sampled at a rate of 1 GHz. Upon a trigger, the data sampling is“frozen” and 2560 samples of each channel are stored for offline analysis.
Using a common trigger, the experimental information is recorded by both the HDM and RFA DAQ systems of a station and these information streams are time-tagged using absolute timing provided by GPS devices embedded in the corresponding DAQs. The event building, i.e., the combination of the experimental information provided by the RFA system and the HDMs of a station, is performed offline utilising the respective time-tags. Similarly, the event building in case of multi station events, i.e., when an EAS has been recorded by two or more Astroneu stations, is performed offline based on the corresponding time-tags.
3. Selection of Very High Energy EAS
The data sample used in this analysis was collected by stations A and B (see
Figure 1), from 1 August 2014 to 16 March 2016. Each station was triggered when the HDM signals of the station were above 9.7 mV (corresponding roughly to 2 minimum ionizing particles
4) in a time window of 240 ns, while coincidence events between stations were identified offline using the event GPS time and the distance between the stations (164 m). The final sample after passing all the quality criteria [
9] consisted of 1395 events corresponding to an event rate of about 0.15 h
. For each event, the Time over Threshold (ToT) value and the timing of the six HDM pulses as well as the full waveform of each polarization of the two RF antennas were available for the next steps of the analysis.
Detailed MC studies [
9] show that these double station events correspond to EAS with energies
TeV while the energy threshold for radio detection is typically around
TeV. However, criteria for the selection of EAS of even higher energy can be defined using the experimental information from the particle detectors. In this analysis we used a simple criterion, the quantity sToT, defined as the sum of the ToT values of the 6 HDM of stations A and B over the projected HDM area perpendicular to the shower axis:
where
is the zenith angle of the shower axis direction.
The fact that the ToT value is a measure of the collected charge in each HDM
5, and the very good agreement between the experimental ToT values with the simulation prediction allows us to draw safe conclusions using the ToT information from the simulation. For example in
Figure 2 (left) is shown the distribution of the average ToT value of the HDMs of station-A (points) in comparison with the simulation, while the discrimination power of the sToT quantity is demonstrated in
Figure 2 (right) where the primary energy of the EAS is plotted against the
value.
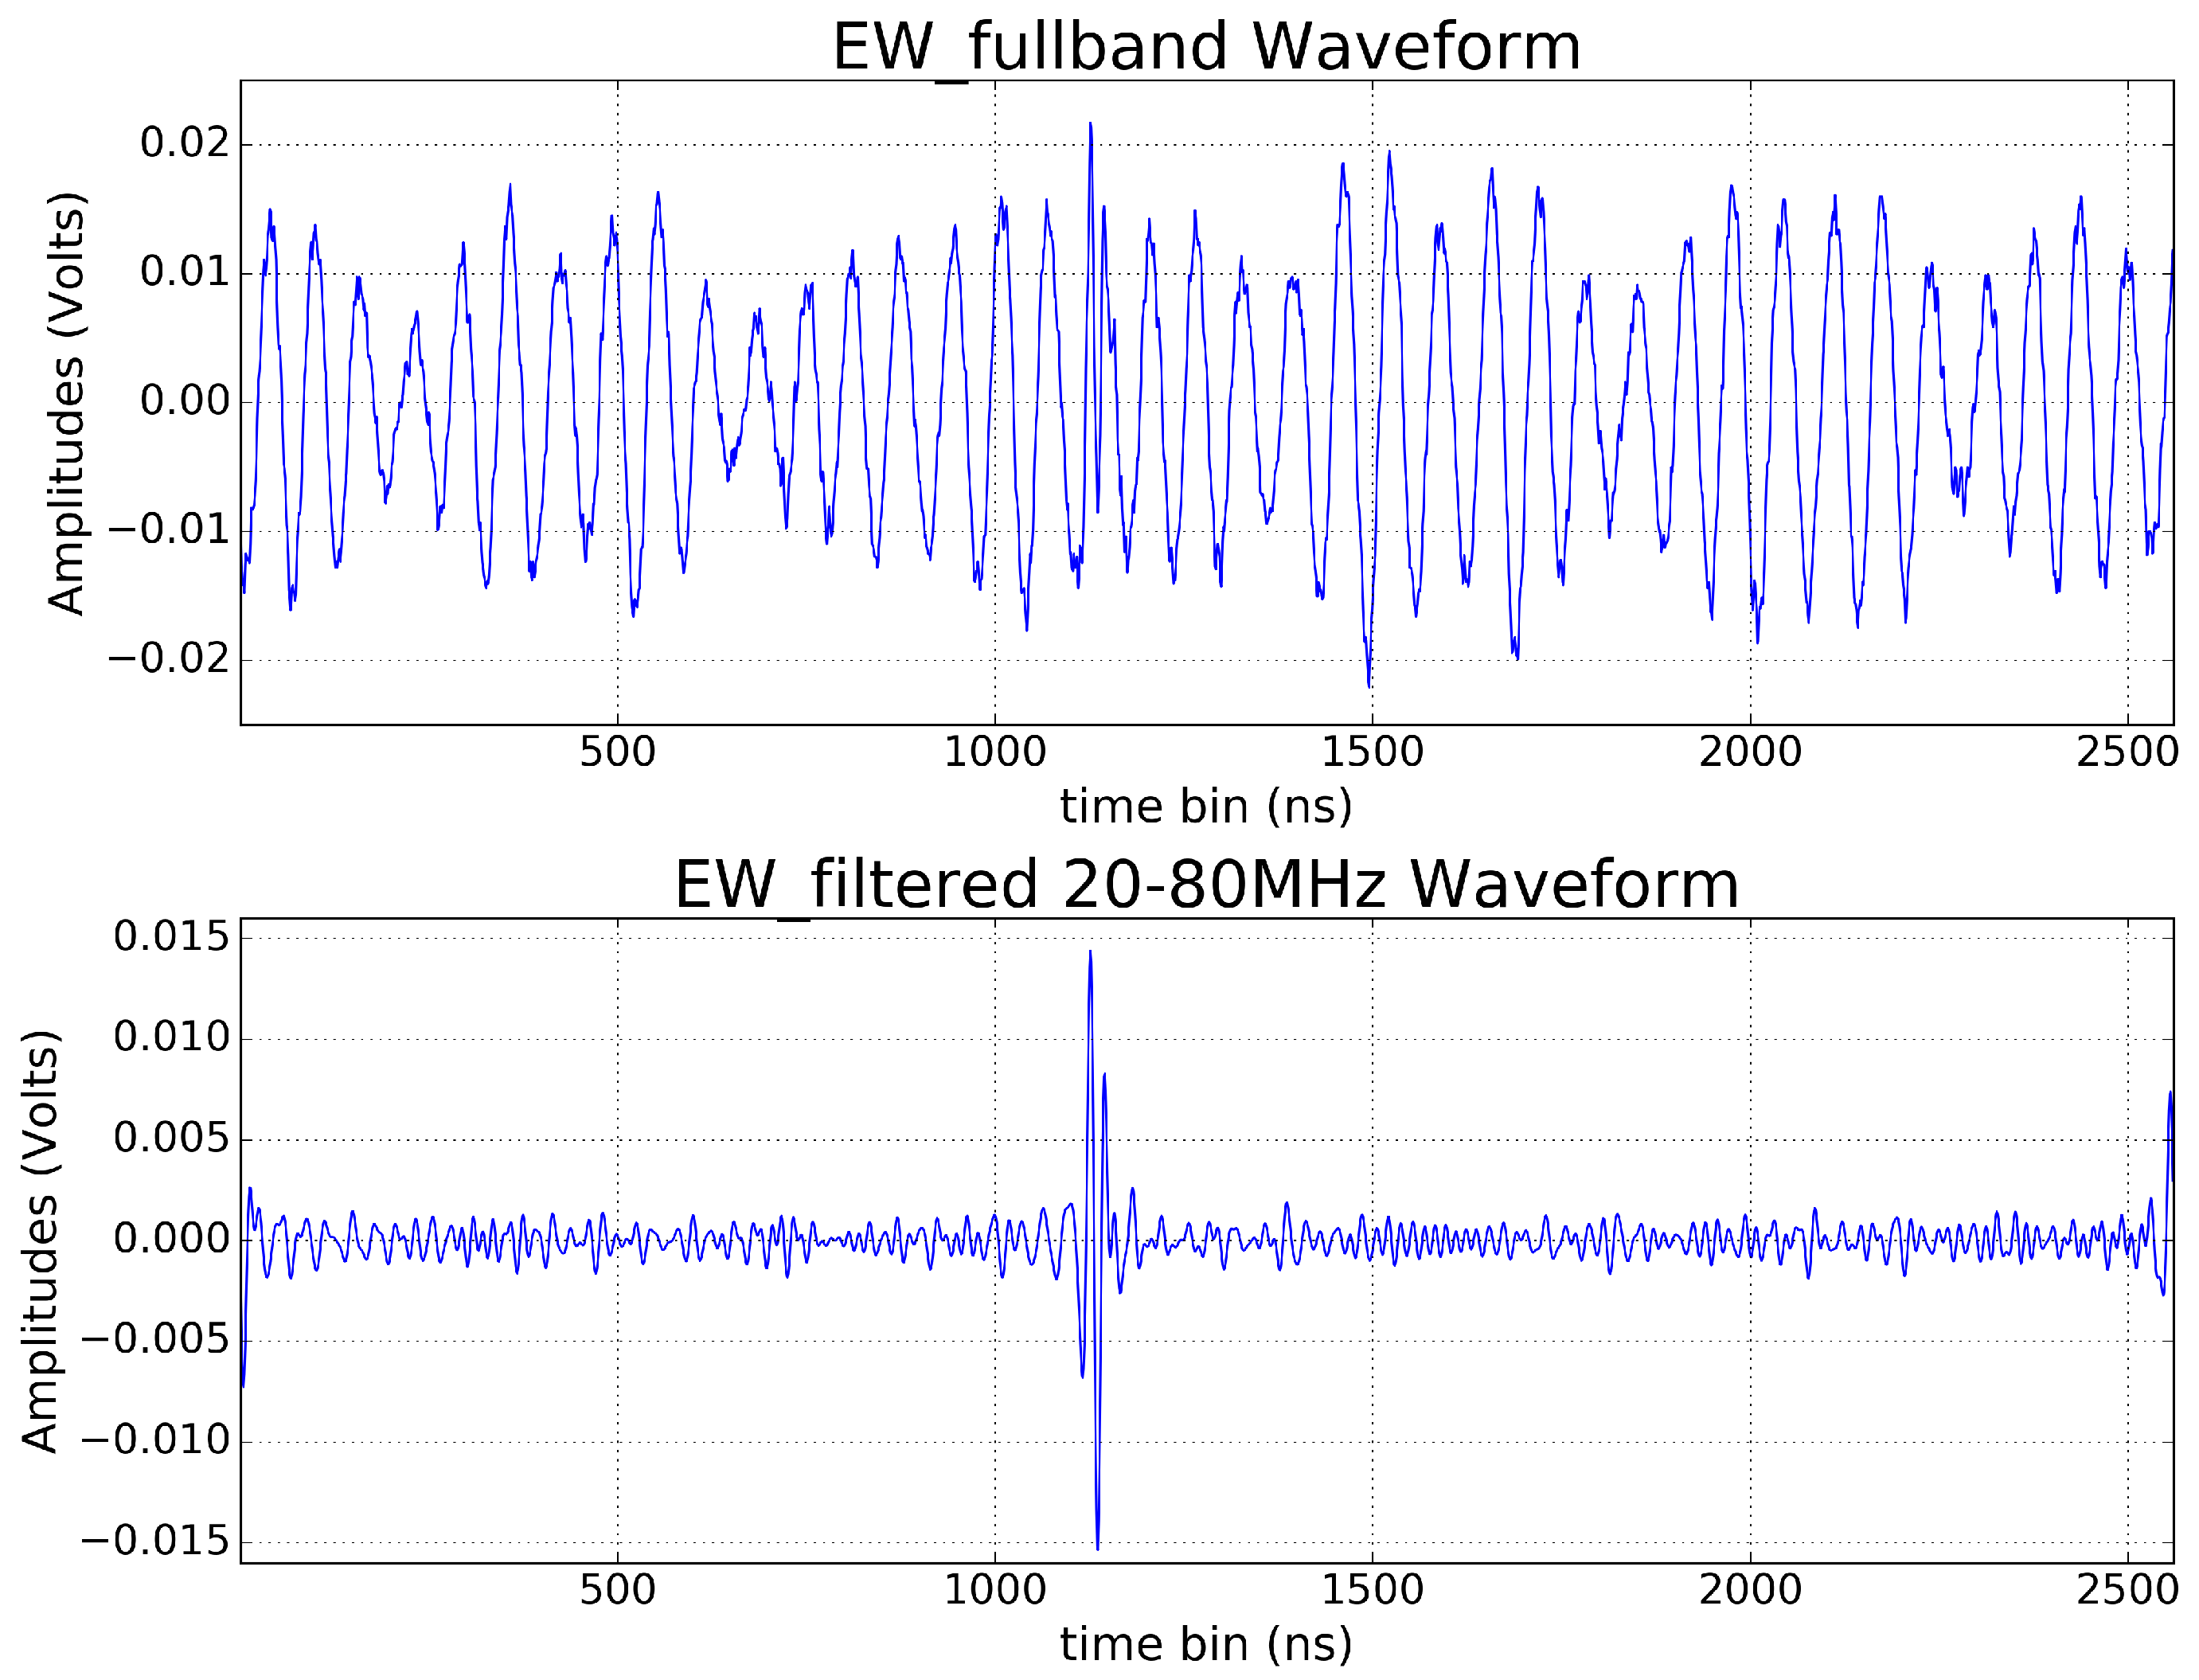
For each reconstructed shower the RF signals are filtered in order to keep frequencies in the range 20–80 MHz, since for frequencies below 20 MHz the ionosphere is strongly reflective, and human-made signals from long distances can still contribute to the noise, while at high frequencies, over 80 MHz, strong signals from the radio FM band are present. The filtering procedure is implemented in two phases. Initially, the waveform is subject to Tukey filtering, suppressing the outliers, and then, a Fast Fourier Transform (FFT) is applied. After this transformation, the non-desirable frequencies are removed and subsequently the inverse Fourier Transform (FFT
) is applied, providing the filtered signal for further analysis. Furthermore, for the analysis of the antenna recorded events, the EW component was used since the EW direction is more sensitive. This is due to the effect of the Lorentz force on the charged particles of the EAS, as the vector of the magnetic field points to the South, reinforcing the possibility of detection in the perpendicular direction EW. In
Figure 3 is shown the EW waveform before and after filtering (20–80 MHz) for a cosmic event.
The filtered RF waveforms of the data sample were selected for further analysis when a peak value grater than ten times the rms noise was observed in a time window of 100 ns around the position of the trigger signal. A total number of 42 events from station-A antenna and 51 events from station-B antenna were selected. These events, as it was expected, exhibited larger sToT values than the rest of the double station events. This is depicted in
Figure 4 (left) where the distribution of sToT is shown for shower data with identified RF signals (filled histogram) and for shower data without RF signals (unfilled histogram). In
Figure 4 (right) is shown the efficiency of detecting RF signals from double station coincidence data as a function of the sToT value. To reject low energy showers a cut value of sToT > 500 ns was applied in the rest of the analysis resulting in 34 events from station-A antenna and 49 events from station- B antenna.
4. RF Signal Timing and Combined Angular Reconstruction
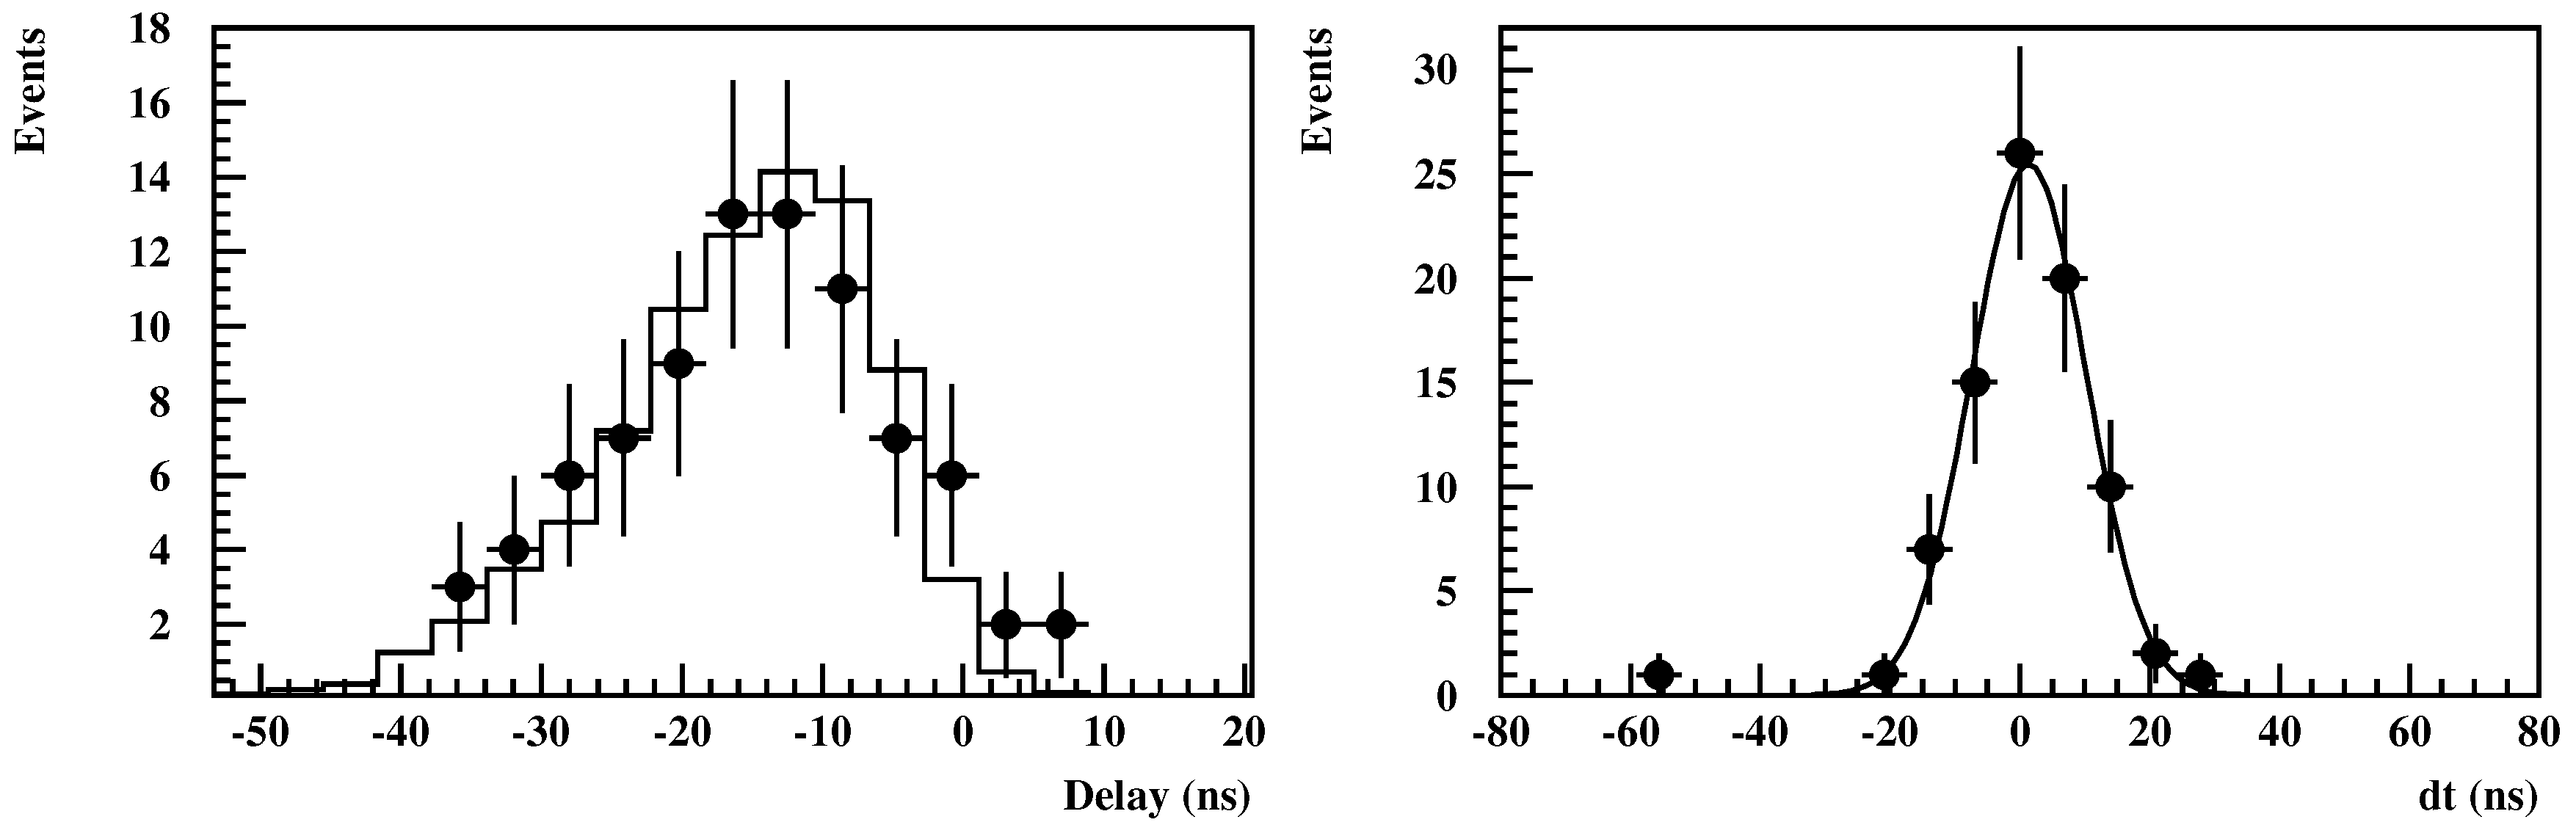
Each autonomous station of the Astroneu array is capable of reconstructing Extensive Air Showers of energy more than 10 TeV with a typical resolution of 3.5 degrees. In this mode of operation (single station operation) the reconstruction algorithm treats the shower’s front as a plane, which is a good approximation at least for the part of an EAS that hits the detectors of a single station. Using the reconstructed axis direction from the HDMs of a station and taking into account the position of the RF antenna in the local coordinate system of the station, the timing of the RF signal can be estimated. In
Figure 5 (left) is shown the expected distribution (histogram) of the RF signal timing with respect to the latest HDM
6 signal assuming plane particle front approximation. This distribution has been evaluated by taking into account the resolution of reconstructing the shower axis direction from particle data, as well as the time jitter of the trigger signal
7. The data points represent the evaluated RF timing using the peak of the EW RF pulse and they are found to be in a good agreement with the expectation. In
Figure 5 (right) is shown the deviation of the measured and the expected RF signal timing. The distribution is very well described by a gaussian function centered at zero with sigma equal to 8.8 ns.
The timing of the RF pulses can be included to the angular reconstruction algorithm of the shower axis direction. However, in multiple station operation the reconstruction algorithm has to take into account the curvature of the shower front
8. As it is described in [
9], the time over threshold values of the detectors pulses are used to estimate the curvature of the shower front and the expected delay between the two distant stations.
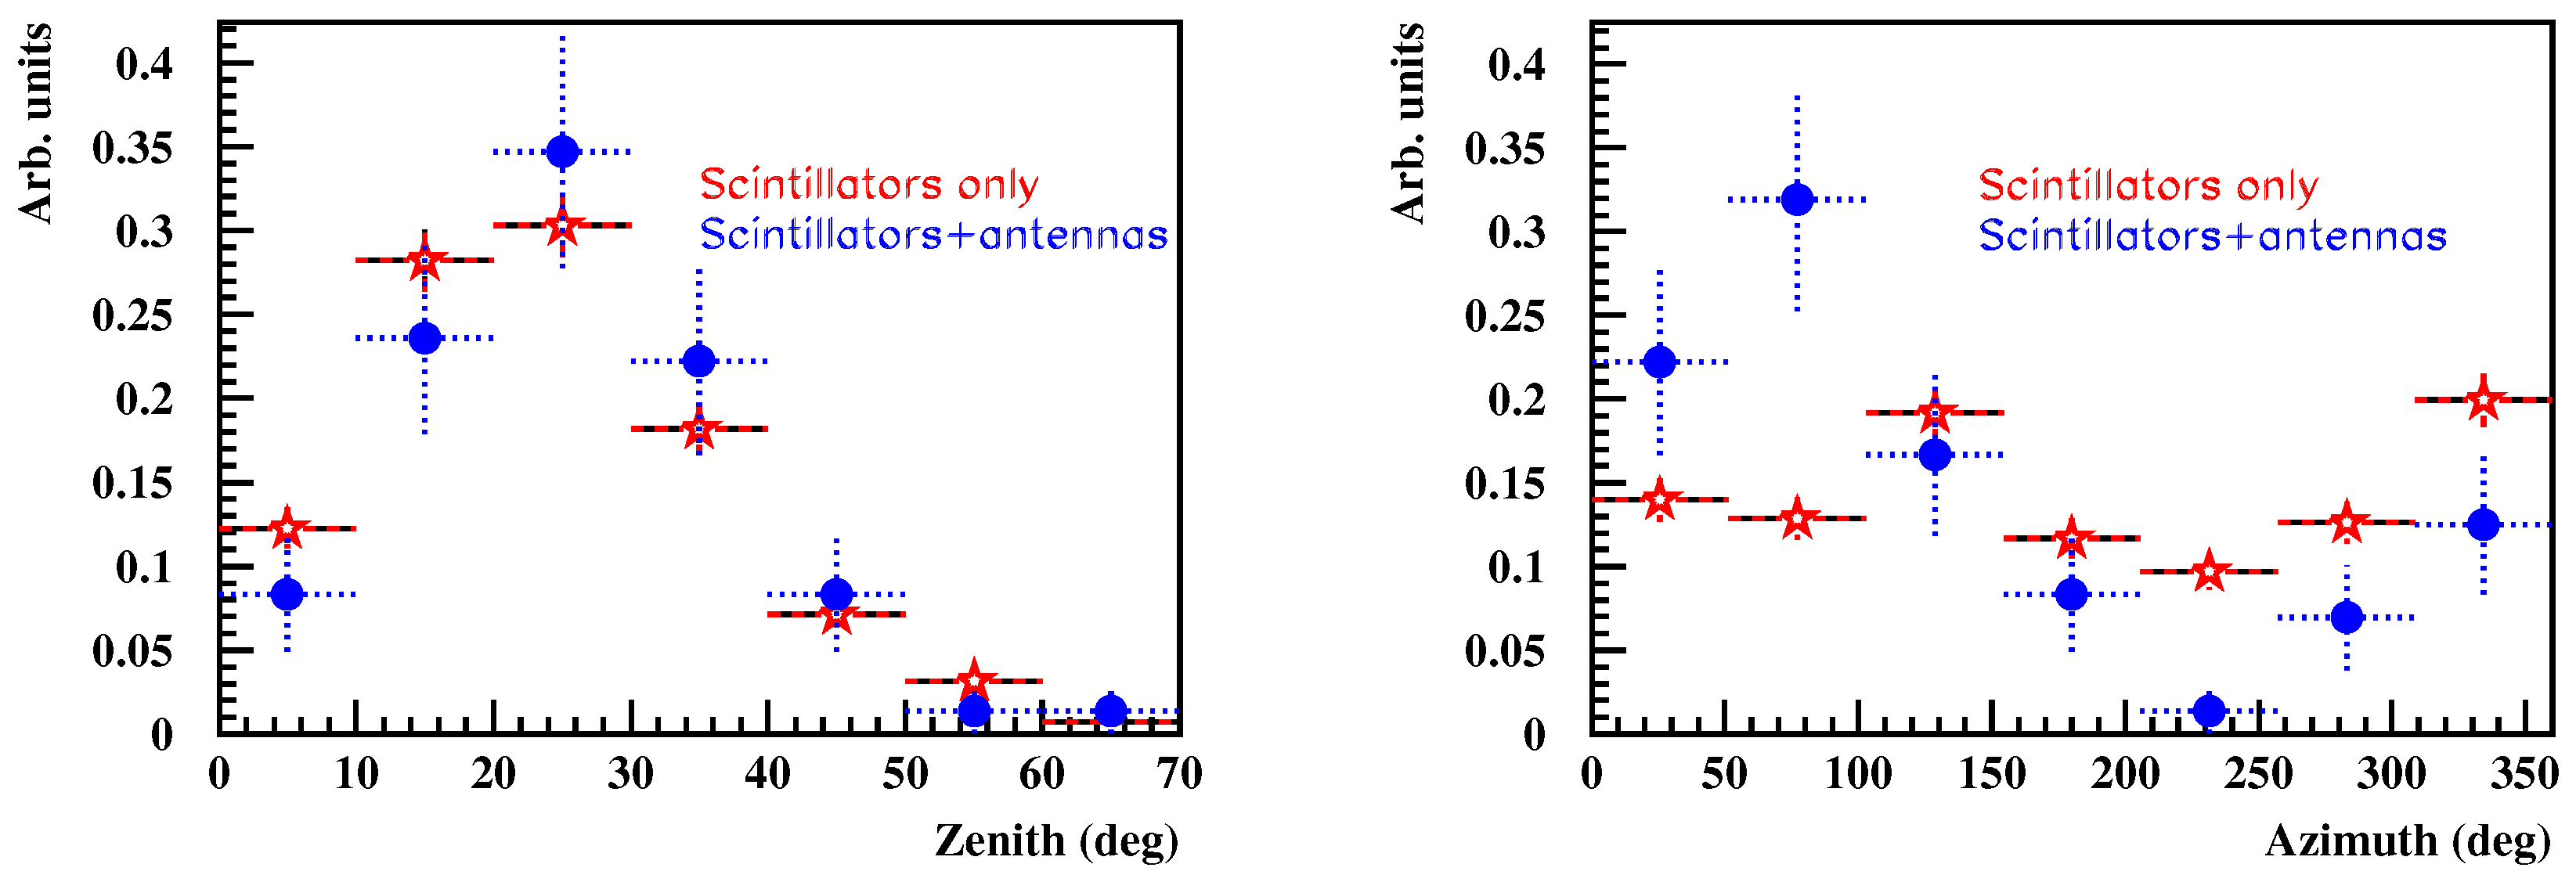
Figure 6 shows the zenith (left) and azimuth (right) distribution of reconstructed showers with sToT value grater that 500 ns. The red stars represent the data distributions of reconstructed showers using only the scintillator information, while the blue points represent the data distributions of reconstructed showers with identified RF signal (included in the angular reconstruction algorithm). The zenith angle distributions are in very good agreement, while the asymmetry in the azimuth direction is expected due to the dominant geomagnetic mechanism
9 in agreement with previous measurements [
6,
14,
15].
5. Electric Field Measurement
The simulation of the response of an Astroneu station to EAS is a two-step process. In the first simulation step, the COsmic Ray SImulations for KAscade (CORSIKA) package [
16] is employed to simulate the EAS and to provide the shower particle information at the detector level. In the second step the Hellenic Open University Reconstruction and Simulation (HOURS) package [
17,
18] is employed to simulate the response of the detectors to EAS particles which includes: (a) the interaction of each particle of the shower’s front with the HDM, (b) the production of photoelectrons at the PMT photocathode, (c) the detector’s waveform formation and signal propagation, and (d) the functionality of the digitization and triggering electronics. The simulation of the RF emission mechanisms and the response of the antennas are included at a later stage.
For the simulation of the RF signals we use the Simulation of ELectric Field from Air Showers (SELFAS) package [
19] which calculates the RF signal, in the MHz range, emitted by cosmic air showers during their evolution in the atmosphere. This simulation includes RF emission by transverse current variation (due to the opposite direction deflections of
and
in the earth magnetic field) and by charge excess variation (due to excess of electrons in the shower front). The Greisen-Iljina-Linsley (GIL) parameterization [
20] is used to provide the number of electrons and positrons as a function of the energy and type of the primary particle. The response of the antenna to the incident electric field that arrives from a given direction
, is obtained by the convolution of the field with the antenna’s vector effective length (VEL) alternative known as system transfer functions. The VEL of the specific antennas used in Astroneu depends on the gain and structural features of the antenna (i.e., the antenna radiation resistance and reactance) as well as the Low Noise Amplifier’s characteristics (e.g., input resistance and reactance) according to [
12]. The evaluation of the VEL is obtained with the Numerical Electromagnetic Code (NEC) and the 4NEC2 software [
21,
22,
23].
To compare the RF signals from double station coincidence events with the simulation predictions, a large Monte Carlo (MC) sample of shower events was generated corresponding to 112,000 h equivalent experimental time.To increase the statistics of the MC sample, each CORSIKA event was used more than once, by moving the shower’s impact point uniformly inside a large circular area around the center of the stations
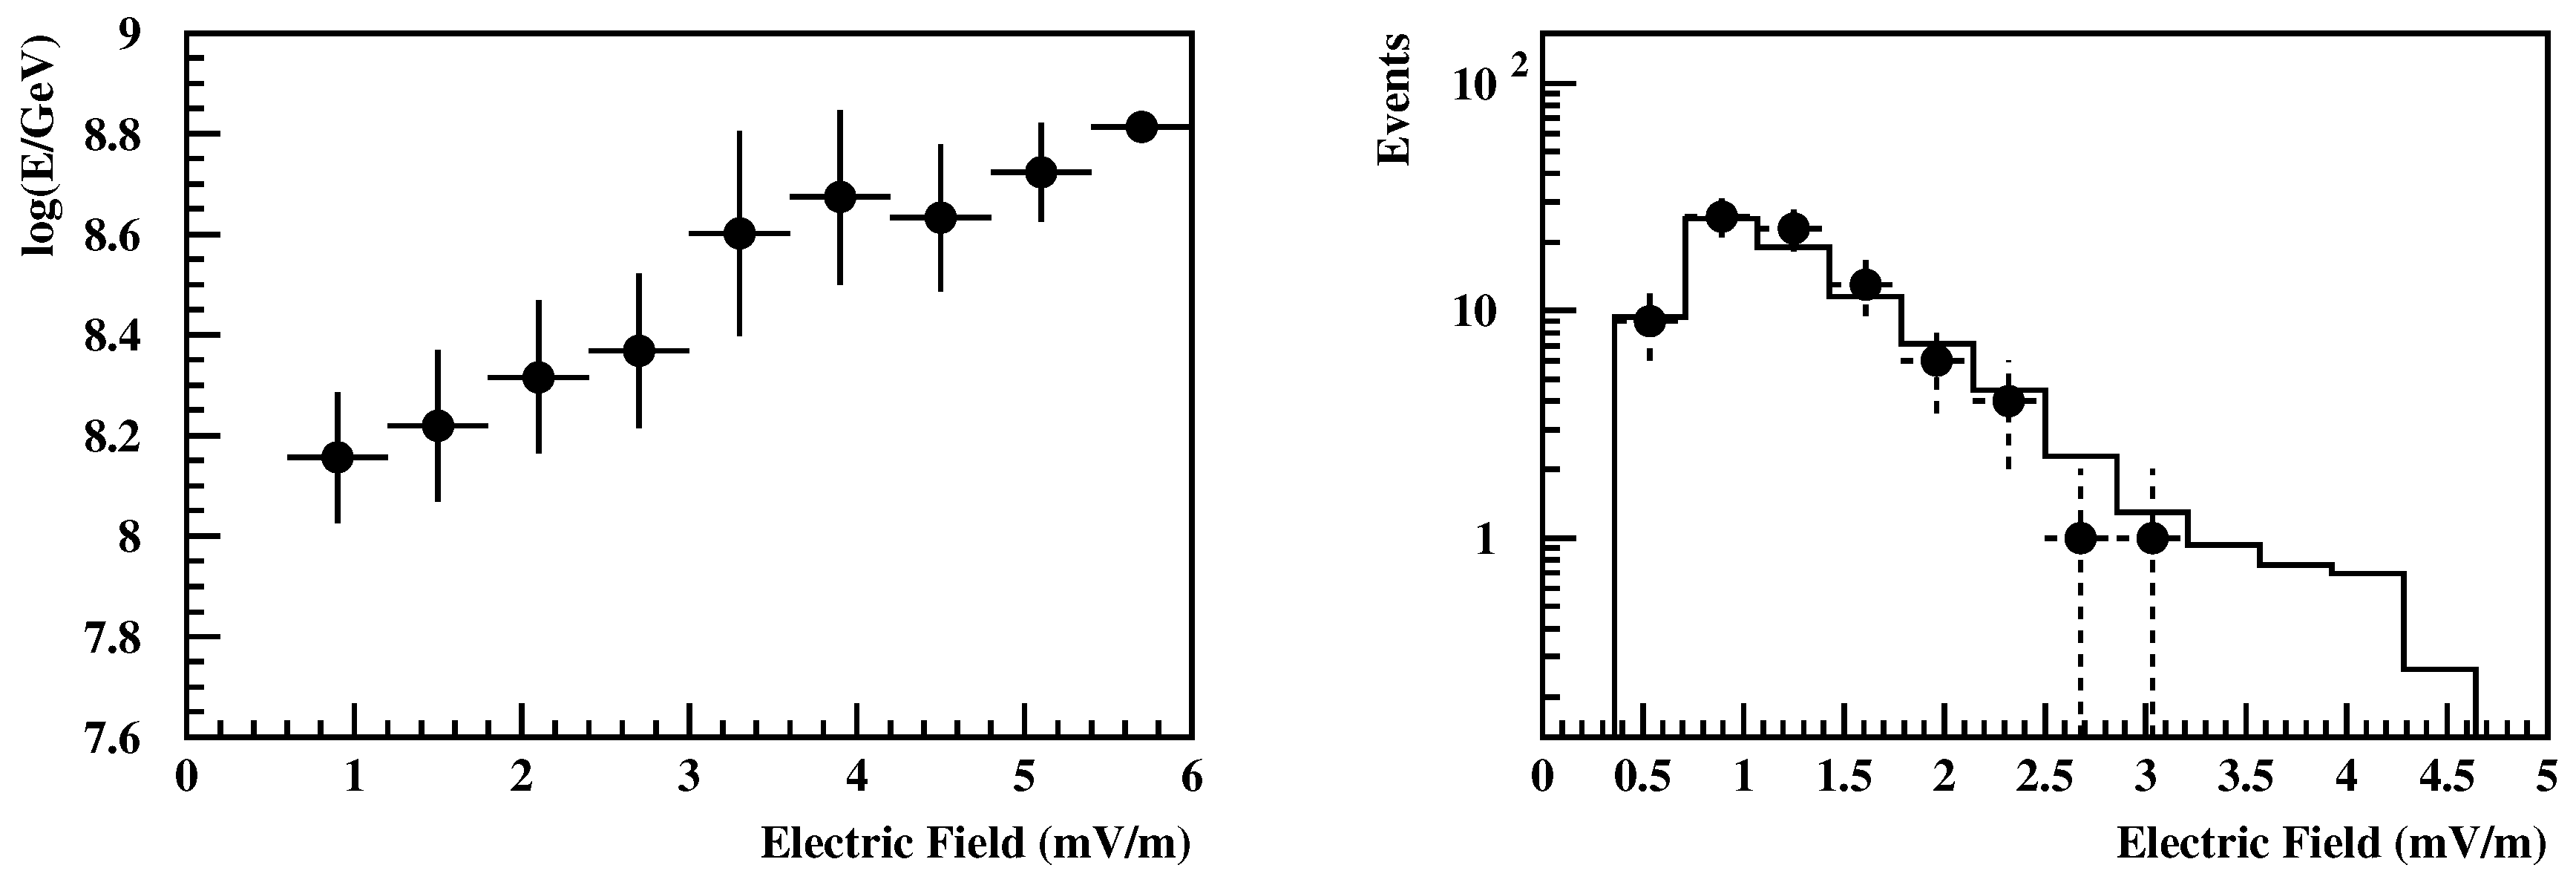
10. Events that triggered both stations A and B, survived the quality criteria for each station and reconstructed successfully by both stations were used for the calculation of the electric field at the antenna positions according to the energy, type, direction and impact point of the primary particle initiating the shower. For example in
Figure 7 (left) is shown the energy of the primary as a function of the induced electric field at the antenna
11 positions. Using the antenna transfer functions and the reconstructed direction of the shower axis, the electric field at the antennas position can be calculated from the data. The electric field distribution of the data sample that survived the selection criteria described in
Section 3 is shown in
Figure 7 (right) (points) in comparison with the expected distribution (histogram) using the simulation sample. A cut value of 0.6 mV/m was applied to the MC distribution to match the data distribution. From the energy distribution of the simulated sample that survived this selection, the energy threshold for radio detection is estimated to be approximately
eV. Furthermore, the efficiency for radio detection estimated as the ratio of the RF identified events over the expected number of reconstructed double station coincidence events with energy above
eV is estimated to be approximately 21%.
6. Discussion
Double station coincidence events between stations A and B of the Astroneu array were used to examine the correlation of the RF data with the particle detectors data. Using the strength of the EW signal and the ToT values of the HDMs a data sample was selected, which according to the simulation consists of shower events with energy grater than eV. It was found that the RF signal timing at the peak of the EW signal is compatible with the expectation using the HDM pulses timing, the angular reconstruction of the shower axis and the plane particle front approximation. The zenith and azimuth angular distribution of the reconstructed showers with identified RF signals were calculated including the RF timing in the reconstruction algorithm. It was found that the zenith angle distribution agrees with the corresponding distribution using only the scintillator data, while the azimuth angle distribution reveals the north-south asymmetry due to the dominant geomagnetic emission process in agreement with previous measurements. Finally, the antenna data were used to calculate the electric field intensity and found in good agreement with the simulation.
The above results confirm that the RF detection in a city environment or in sites with strong electromagnetic noise present is possible even with small scale hybrid arrays. The analysis is still on going in order to define more efficient selection criteria and signal processing techniques in the full data set which is a factor of 2 grater than the sample used in this analysis. In addition, further studies concerning the transfer functions of the antennas which are strongly frequency and angular dependent show that the RF signals are in agreement with the MC expectations suggesting that a single antenna might give access to the cosmic arrival direction [
24]. Finally, to examine further the potential of the RF detection, more antennas have been installed in one of the stations. Specifically, since 2017 station-A is equipped with 4 RF antennas receiving a common trigger from the HDM detectors. This will allow to study the correlation between RF signals corresponding to the same shower events.

 ,
, 


