Understanding Cumulative Hazards in a Rustbelt City: Integrating GIS, Archaeology, and Spatial History

Department of Social Sciences, Michigan Technological University, Houghton, MI 49931, USA
*
Author to whom correspondence should be addressed.
Urban Sci. 2019, 3(3), 83; https://0-doi-org.brum.beds.ac.uk/10.3390/urbansci3030083
Submission received: 30 June 2019
/
Revised: 25 July 2019
/
Accepted: 27 July 2019
/
Published: 30 July 2019
Abstract
:We combine the Historical Spatial Data Infrastructure (HSDI) concept developed within spatial history with elements of archaeological predictive modeling to demonstrate a novel GIS-based landscape model for identifying the persistence of historically-generated industrial hazards in postindustrial cities. This historical big data approach draws on over a century of both historical and modern spatial big data to project the presence of specific persistent historical hazards across a city. This research improves on previous attempts to understand the origins and persistence of historical pollution hazards, and our final model augments traditional archaeological approaches to site prospection and analysis. This study also demonstrates how models based on the historical record, such as the HSDI, complement existing approaches to identifying postindustrial sites that require remediation. Our approach links the work of archaeologists more closely to other researchers and to municipal decision makers, permitting closer cooperation between those involved in archaeology, heritage, urban redevelopment, and environmental sustainability activities in postindustrial cities.
1. Introduction
This study demonstrates the application of a temporally linked, big data historical GIS (HGIS) or Historical Spatial Data Infrastructure (HSDI) to archaeological research in postindustrial urban environments. By taking a big data approach to the historical record, we contextualize past industrial activity in our case study city of London, Ontario (Figure 1) within a complex longitudinal model (illustrative of cumulative change over time) of past and present built and social environments, one that is both fine-grained and yet can also be used to identify patterns manifesting in these environments at the scale of the city. We demonstrate how this HSDI-based longitudinal model can be used to explore human risk of exposure to pollution at both discrete periods in the past as well as the cumulative effects on the contemporary postindustrial landscape. Archaeologists play an important role in the future of postindustrial cities due to the close relationship between contemporary social, economic, and environmental issues on the one hand, and the material remains —and consequences—of past industrial activities on the other. Postindustrial cities are archaeological landscapes that bear witness to the complex processes of industrialization and deindustrialization; nowhere is this more apparent than in the rustbelt cities of the Midwest, where understanding the archaeological landscape can play a role in helping make sense of issues of environmental justice such as the Flint Water Crisis, or to better identify the hidden consequences of past industrial activity in postindustrial cities.
Archaeologists have a well-established expertise in understanding the complex, longitudinal social and material processes taking place in modern postindustrial cities – both above and below ground [1]. However, two congoing challenges complicate the archaeology of postindustrial cities. First, industrial pollution itself is generally seen by archaeologists as either a threat to archaeological remains [2,3,4], part of site formation processes [5], or as an occupational hazard to archaeologists themselves [6]. Second, in conceptualizing a modern city as itself an archaeological site with both micro- and macro-scale features and patterns of change [7], we immediately run against the challenges inherent in the adoption of an effective multiscalar perspective taking in widely varying temporal and spatial frames; this is an issue that continues to challenge the discipline of archaeology as a whole [8]. These two challenges remain obstacles for archaeological inquiry. How can we more usefully integrate the historical generation of industrial byproducts into our archaeological understanding of industrial cities? How can we organize and analyze the volume of historical data necessary to contextualize historical archaeology within the large-scale, extraordinarily complex, and dynamic landscape that is an industrial city?
We address these challenges by using GIS-based digital approaches to better access the information in historical cartography, specifically fire insurance plans or maps. Fire insurance plans, such as those made by the Sanborn and Charles Goad companies, have long been recognized as an especially invaluable historical resource, not only for historical and industrial archaeologists [9,10,11] but also for historians and geographers [12,13,14,15]. Archaeologists studying modern cities have long relied on maps, including fire insurance plans, to locate sites and identify changes in the physical landscape over time [1,16]. The application of digital, spatial technologies has further enhanced the value of historical maps for such activities [17,18,19]. Archaeologists, geographers, and other disciplines with a historical focus have increasingly also used fire insurance plans as the basis for digital reconstructions of past environments [20,21,22,23].
Archaeologists also proved to be early adopters of GIS as a tool for prospection and analysis [24,25], yet the use of GIS in historical archaeology remains underexploited and can benefit greatly by the use of GIS methodologies for the purpose of prospection, visualization, analysis and interdisciplinary collaboration [26]. We argue that one new implementation of GIS-based approaches to studying the past, namely the HSDI, can help meet that challenge by providing archaeologists with highly detailed yet scalable historical contexts for the more effective study of postindustrial cities. Our argument for the use of HSDIs in historical archaeology also serves as a potential component of a digital “grand challenge” towards building digital infrastructures for archaeology that represent contributions to “the broader epistemic and pragmatic contexts of archaeological work” [27] (p. 178). The adoption of a big data-based GIS approach also further exposes historical archaeology to the spatial turn currently driving much research in the social sciences [28,29,30].
Finally, our study links the historical archaeology of postindustrial cities to a broader body of interdisciplinary scholarship that focuses on the legacies of urban industrial activity. Tarr [31] conceptualized industrialized cities as socio-ecological systems and identified the byproducts of industrial activity as an important component of such systems. Olson [32] further argued that such work must take a historical focus and adopt a city-scale perspective to adequately understand such systems. This has led to a number of recent empirical investigations that sought to link historical industrial activity with potential pollution hazards or health risks in the modern landscape through the use of GIS-based research using historical records and cartographic data. In a pioneering study, Litt and Burke [33] demonstrated the use of GIS as a way to contextualize brownfields in southeast Baltimore within their surrounding neighborhoods, revealing the complex histories and potential health risks attached to former industrial landscapes. Using a combination of historical records of industrial facilities, pollution release, and remediation data, and demographic data from census and municipal records, they linked past industrial activities (expressed using Standard Industrial Classification (SIC) codes) to likely specific pollutants in 182 brownfield sites over 1 acre within the study area from the period 1935–1997. When they compared the study area’s census tract and municipal mortality data with city-wide and national averages, they found that the study area featured a lower average income and higher mortality [33].
Kolodziej et al. [34] also used historical fire insurance plans and modern municipal parcel data to map health risks on a postindustrial landscape within a GIS. Identifying the locations of past industrial operations in 1880, the 1960s, and 1997, Kolodziej et al. labeled each with an appropriate SIC code. Using federal pollution release data acquired from the Comprehensive Environmental Response, Compensation, and Liability Information System (CERCLIS), they then ranked each on an ascending 1–3 scale for likelihood of generating persistent soil pollution. They then aggregated these scores within census tracts to identify “hotspots” of pollution risk. Both of these studies proved the concept of linking historical industrial activity with pollution or hazard risks; however, in both cases, the spatial resolutions involved were relatively gross (e.g., points within a GIS representing industrial operations and demographic data drawn from the census tract level). More recently, Hayek et al. [35] demonstrated how historical documents, such as fire insurance plans and business directories, could be digitized within a GIS for the purposes of building a spatial database of brownfields.
Elliott and Frickle [36,37] have recently demonstrated improvements to this basic approach in their investigations of industrial legacies in the city of Portland. Like Litt and Burke and Kolodziej et al. [33,34], they used a GIS to map industrial activity longitudinally within an urban context. In mapping spatio-temporal patterns of industrial land use in Portland between 1956 and 2007, Elliott and Frickle noticed a pattern of industrial “churning”, or recursive industrial land use by multiple occupants in hotspots, alongside a slow expansion of industrial activity to new areas. Elliott and Frickle found that the lack of federal pollution release tracking of smaller industrial operations, coupled with changes in land use to non-industrial types, obscures the visibility of a substantial proportion of the potentially polluted former industrial land in Portland [37] (p. 528); Indeed, none of the sites they examined were considered brownfields, as all were occupied and in use, either for industrial or non-industrial purposes [37] (p.538). Finally, they also noted that longitudinal mappings of industrial activity result in a very different spatial view of Portland’s potentially polluted land, as seemingly isolated modern hotspots merge into larger areas of temporally overlapping historical industrial landscapes [37] (p. 532).
Our approach begins where Elliott and Frickle’s ended, and in particular represents three improvements. First, we expand the temporal scope of our study to the 129 year period 1888–2016. Our study will capture the industrial history of London beginning during a period of rapid industrialization, through maturity and on through the period of deindustrialization to the present day commercialized postindustrial city. Second, our industrial site data is digitized from historical fire insurance plans to the resolution of individual building footprints and covers the entire city of London, a substantial increase in detail and comprehensiveness over the studies discussed previously. Third, we recognize that “industrial churning” [37] (p. 536) results in complex site histories, and also recognizing that many smaller industrial operations are often ignored in both the tracking of pollution release and the study of industrial legacies [37] (p. 538). To address these issues, our study considers all industrial activity taking place in the city, including not only small-scale operations likely to have been missed in previous studies, but also certain commercial operations—such as gas stations and auto repair shops—that are not classed as industrial but that present risks of pollution. To accomplish this, we employ a novel GIS-based longitudinal model of London, Ontario.
New Infrastructures for Studying Industrial Activity Across Time and Space
The foundation of our improvements in investigating industrial landscapes lies in the creation and use of a robust and flexible digital infrastructure that we refer to as a Historical Spatial Data Infrastructure (HSDI). We introduce the HSDI concept and describe technical details relating to its construction elsewhere [18]; in brief, it is a digital infrastructure that links the research benefits of Historical GIS with the flexibility, scalability, and robustness of Spatial Data Infrastructures (SDIs) that underpin critical big data projects such as the Minnesota Population Center’s Integrated Public Use Microdata Series (IPUMS) [38,39,40].
The Imag(in)ing London Historical GIS project [22] represents an early implementation of the HSDI concept [18] and this project (hereafter referred to as the London HSDI) forms the basis of the present longitudinal investigation of industrial hazards. The London HSDI consists of two environmental “stages”: the Built Environment (BE) stage and the Social Environment (SE) stage. The BE stage is a GIS-based reconstruction of London’s built environment derived from scanned and georeferenced historical cartography that has been vectorized in GIS and populated with attribute data from the source material including the building’s address, construction materials, number of stories, and occupant. The BE consists primarily of building footprints and road and rail networks (Figure 2). To date the London HSDI contains over 116,000 historical building footprints as well as a representation of modern London’s built infrastructure obtained from the City of London’s municipal GIS. The SE stage populates this virtual historic landscape with historical records of the population that lived in London, with each record geocoded to the person’s place of residence and linked to workplaces, schools, and institutional organizations each person can be linked to. We focus on the BE stage within the present study, although we will address the relevance of the SE stage to our findings subsequently in our concluding discussion.
2. Materials and Methods
To develop our longitudinal industrial hazard model, we substantially modified the existing London HSDI by mapping the industrial landscapes (past and present) in greater detail, integrating a set of real-world predictive pollution data into the HSDI, building the model using GIS-based spatial analysis tools, and finally checking the predictive hazard model against real-world remediation data.
2.1. Mapping Industrial Activities at Finer Scales within the London HSDI
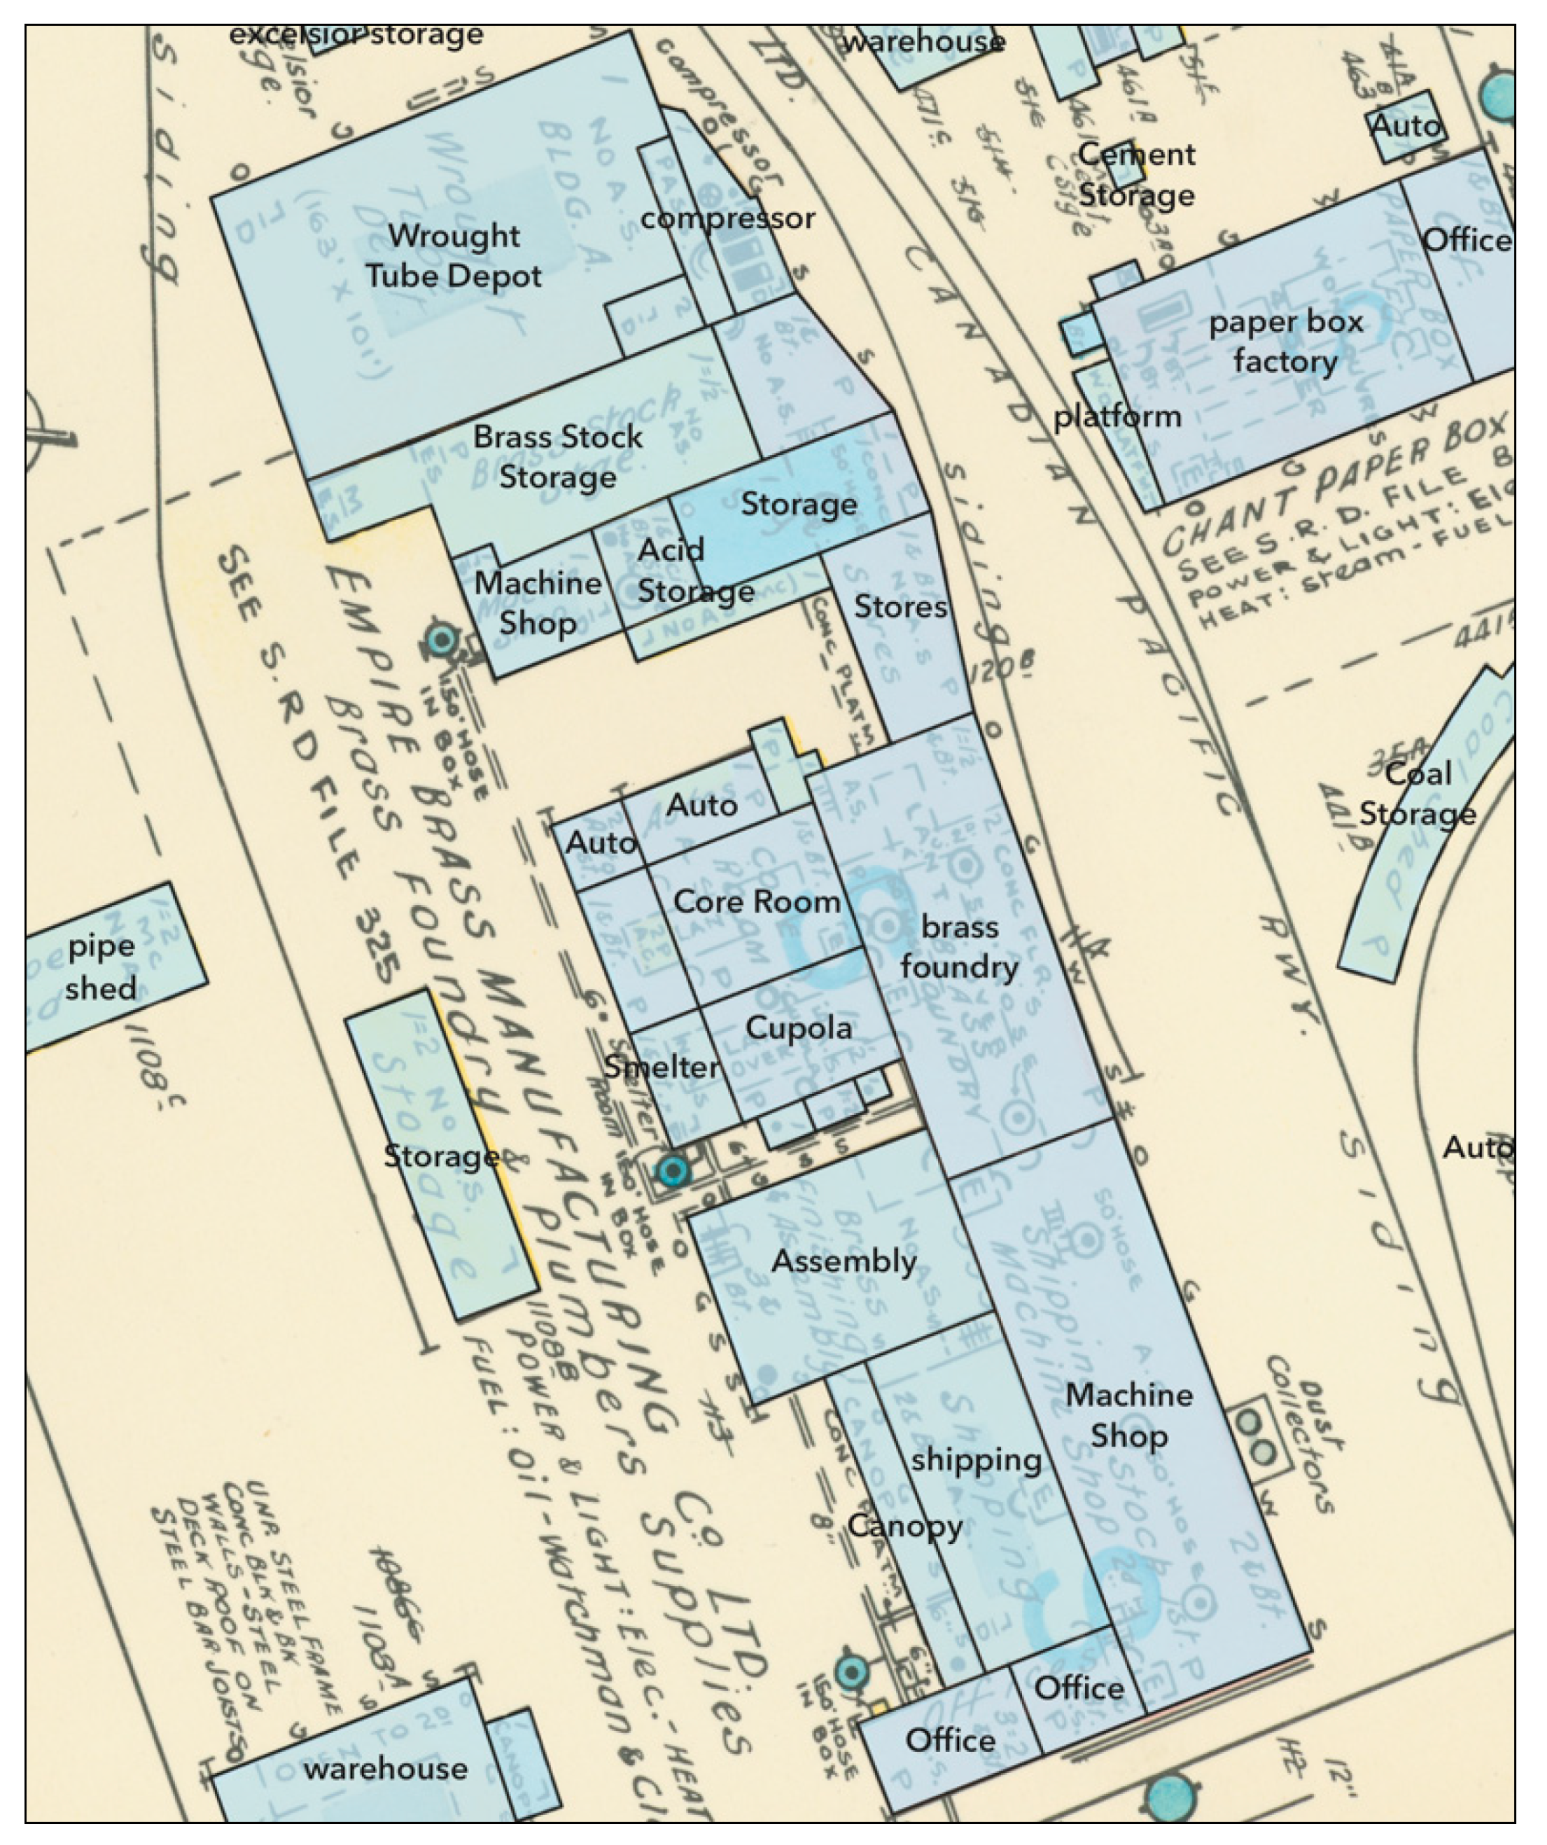
While the London HGIS BE data provides a highly detailed building-scale representation of past environments in London, it does not take full advantage of the resolution provided by the historical fire insurance plans. Within the fire insurance plans, dwellings and commercial buildings are often represented by a building footprint, with additions and major structure divisions often delineated. In the case of industrial buildings, especially larger industrial building complexes, the internal divisions are often shown in greater detail. For example, within the Empire Brass Foundry at 1108 Dundas Street in 1958 (Figure 3) we find that the fire insurance plans record in detail rooms representing various stages of the brass founding process: a core room where sand and loam molds are prepared, a cupola furnace room where brass is melted in preparation for casting, and the foundry floor where the molds are filled with brass and allowed to cool, and the machine shops and finishing rooms where the castings are machined and assembled into finished products. Producers of fire insurance plans such as the Sanborn and Charles Goad companies originally undertook this more detailed mapping of industrial structures because different industrial processes (of which there may be many within one industrial complex) produce substantially different fire risks. Thus, industrial complexes are often mapped at the sub-building level, with individual rooms or parts of rooms labeled with the specific industrial processes and equipment that occupied those locations. This is an extremely valuable resource for the archaeologist and historian; few historical sources map human activity over such a large area at such fine scales with useful accuracy. From an archaeological perspective, these distinct small-scale physical divisions of the industrial process can be likened to activity areas—areas devoted to a specific historical activity, in this case industrial activities such as the Empire Brass foundry, and it is here that the HSDI begins to connect to the micro-scale human activities fundamental to archaeology. Each of these rooms represents different industrial activity areas that incorporate different raw materials and human activities, and—most importantly for the present study—may represent point sources for very different hazards.
In order to incorporate this activity-area scale record of historical industrial activity into our industrial hazard landscape model, we undertook a process of augmenting the BE data within the London HSDI to capture this high level of detail within the HSDI. We expanded the digitization of industrial landscapes from building footprints to each labeled room or subdivision within the building as a discrete polygon and transcribed data regarding the industrial activity taking place within each of these spaces from the fire insurance plans. We then appended the full suite of attribute data (including building address, building material, and owner) for the overall building or complex to each of these rooms. This allowed us to do the next step of construction of our predictive model, the mapping of hazards stemming from these industrial activities.
2.2. Integrating Real-World Pollution Data
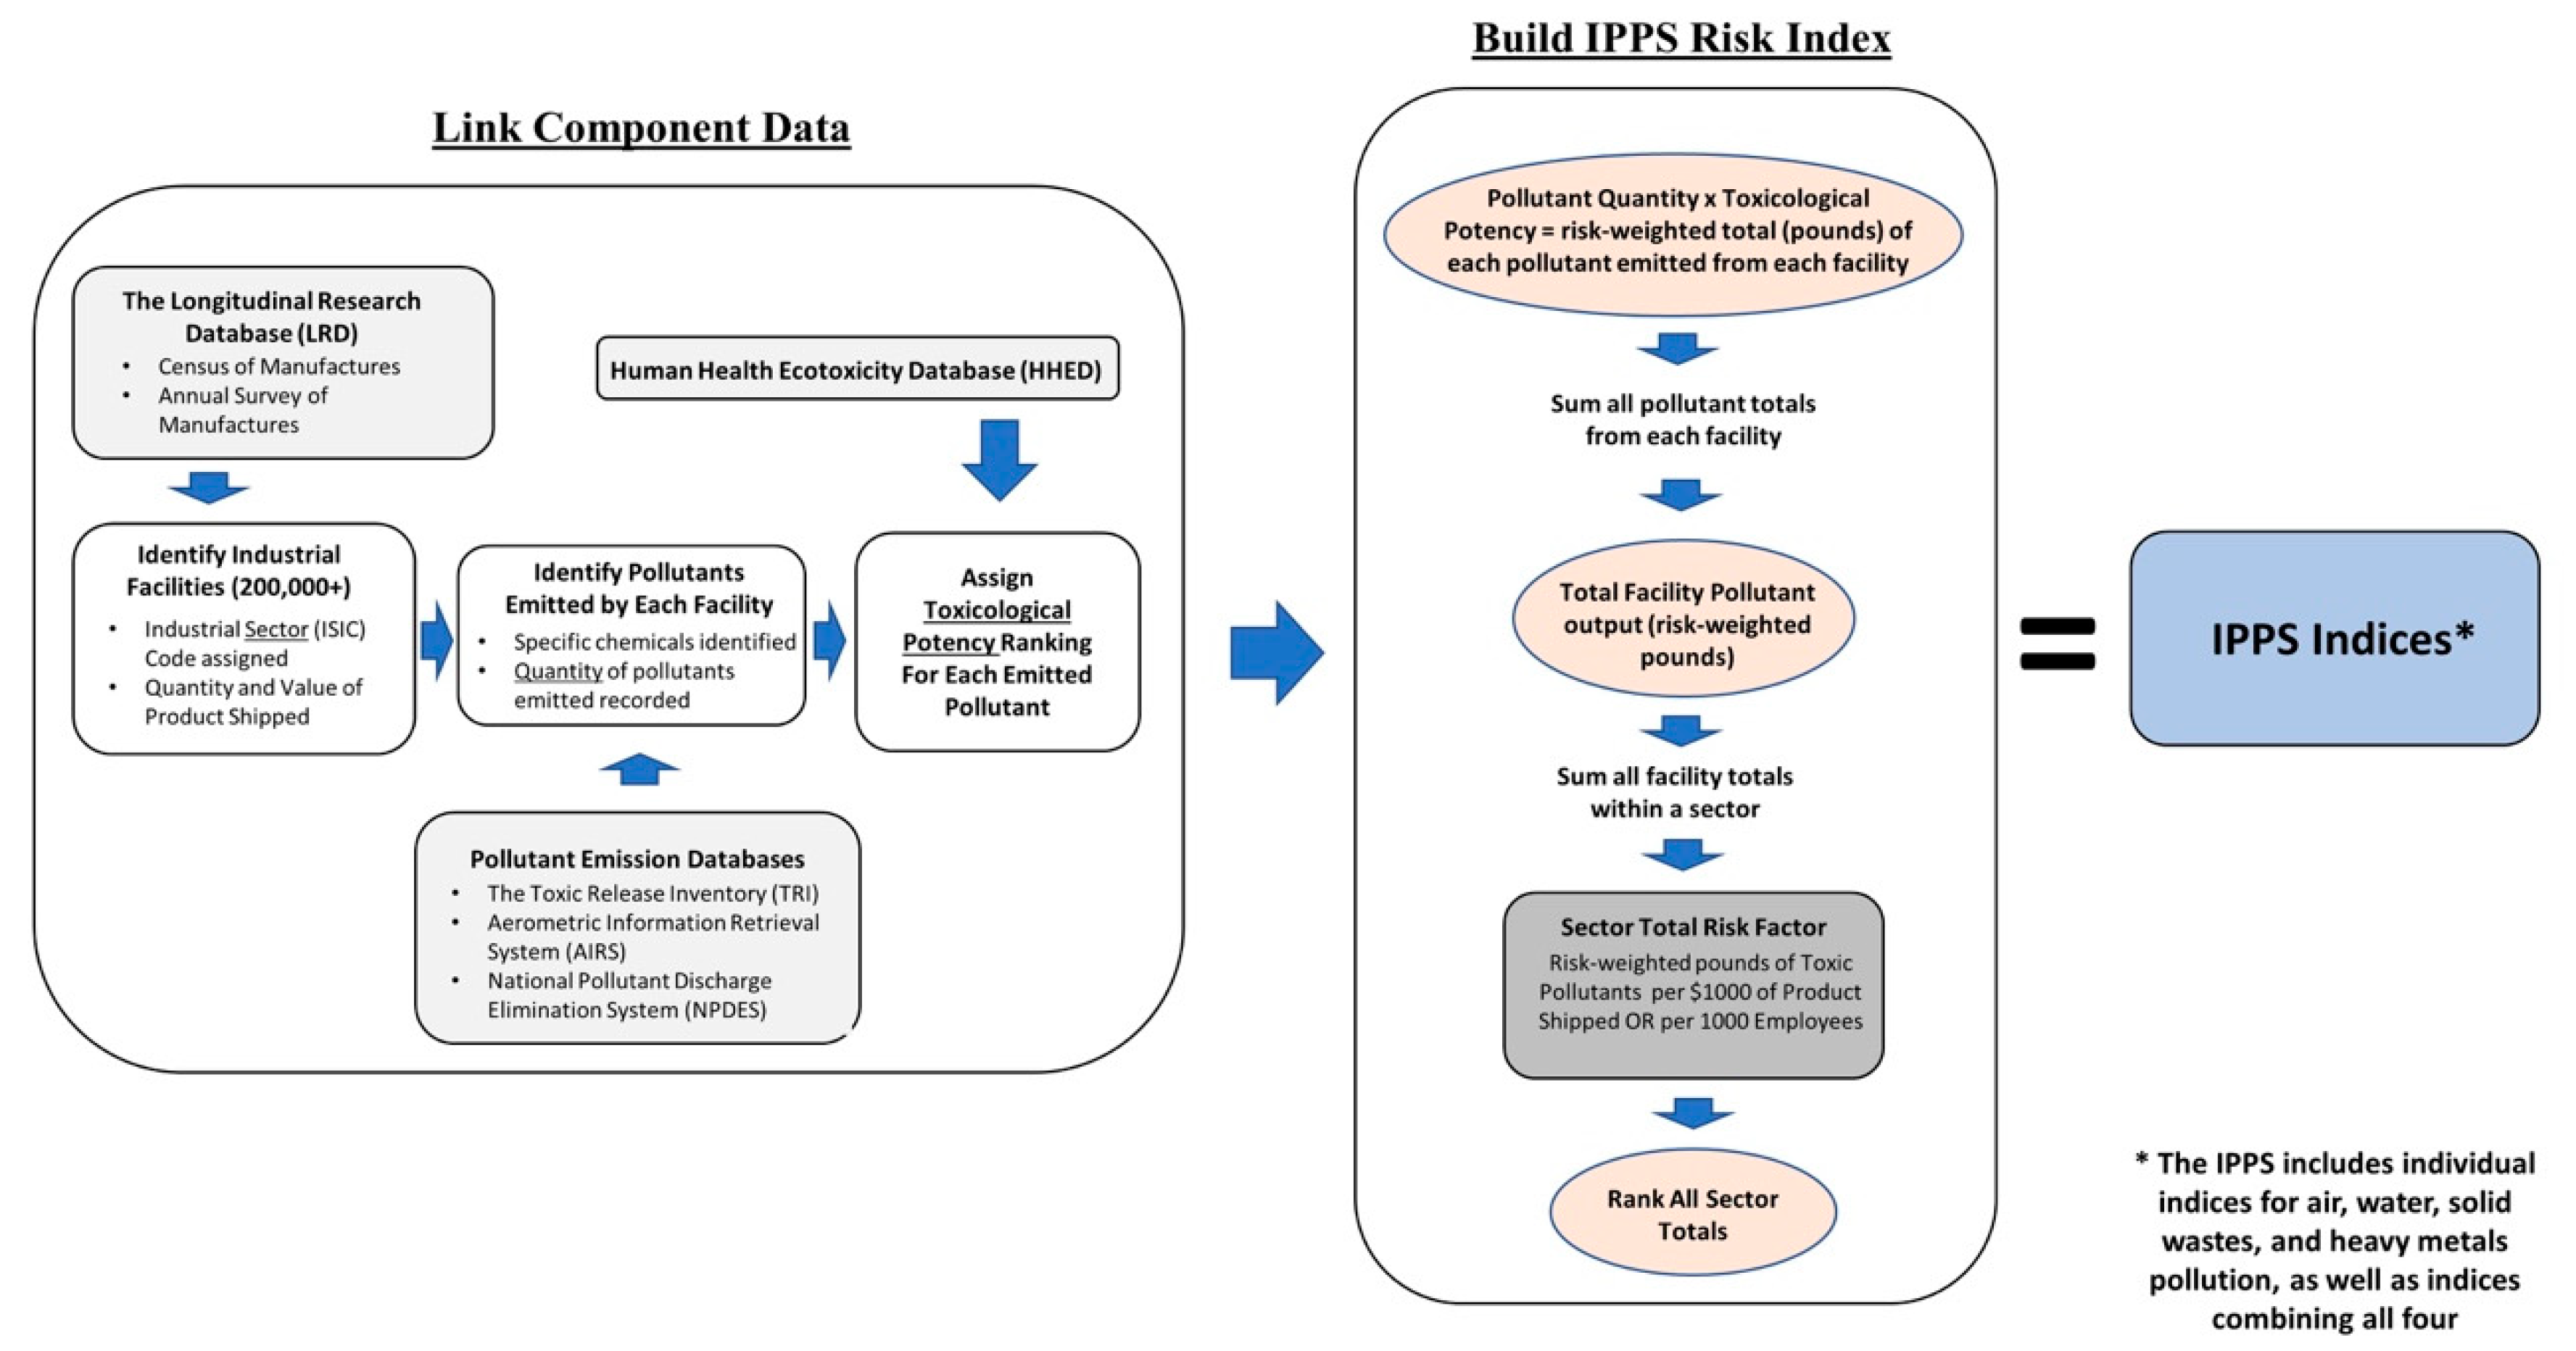
As modified, the London HSDI is now capable of illustrating the spatial patterning of industrial activities across the city of London at four time periods (1888, 1915, 1958, 2016). To understand what kinds of hazards specific sites may have represented at various times in the past, and to link such sites to the persistence of historical pollutants on the contemporary landscape, we must link specific industrial activities with the potential emission of specific classes of pollutants. To do this, we link our mapped historical industrial activity areas to pollution estimates developed by the Industrial Pollution Projection System (IPPS). IPPS is the result of research conducted by the World Bank to aid developing nations in formulating environmental regulation [41] (p. I). The IPPS is based on the premise that the nature and scale of industrial pollutant emissions depend heavily on three factors [41] (p. I): 1) the scale of industrial activity; 2) the specific industrial sector involved; 3) the specific industrial processes in use. The IPPS was based on a sophisticated analysis of over 200,000 industrial facilities in the United States. Industrial activities were organized into sectors using the International Standard Industrial Classification of All Economic Activities (ISIC) code system at the four-digit level of aggregation. Industrial output data and other information for each of the over 200,000 facilities involved in the study were collected using the Longitudinal Research Database (LRD), a digitized database derived from the Census of Manufactures (CM) (1963–1987) and the Annual Survey of Manufactures (ASM) (1973–1989) [41] (pp. 13–14). Environmental pollution data for each facility was collected by linking the LRD with five US Environmental Protection Agency databases tracking air, water, and soil pollution. Together, these datasets allow the IPPS to link several hundred thousand specific industrial facilities to the release of hundreds of specific air, water and solid waste pollutants based on real-world industrial output and pollutant discharge data (Figure 4) [41] (pp. 1–2). The basic concept behind the IPPS is the development of a “pollution intensity” ranking for each ISIC industrial sector, expressed as follows:
Pollutant Output Intensity = (Pollutant Output) / (Total Manufacturing Activity)
For the numerator (pollutant output) Hettige et al. ranked all of the recorded pollutants emitted by the industrial facilities in a descending scale of toxicological potency (1–4, with 1 being the most hazardous) [41] (p. 21). They then multiplied the amount of each chemical released by a facility by its toxicological potency ranking, resulting in each release being expressed as risk-weighted pounds of toxic pollutants. Each of these individual risk-weighted results were then summed to establish a total risk-weighted release for each facility, and all facilities within a sector were summed to create the final sectoral totals [41] (pp. 22–23).
The IPPS used three different measures for the denominator (total manufacturing activity): total product shipment value, value added, and number of employees [41] (pp. 18–19). For our study, we selected the risk factor data using the employment denominator. Final risk factor tables for air, water, soil, and toxic metal pollution types are included, as well as tables combining all four risk factors for each sector [41] (pp. 1–2). To help compensate for biases and lacunae in the datasets, Hettige et al. produced three sets of final estimates: upper bound, upper bound inter-quartile mean, and lower bound estimates. We have chosen to use the lower bound estimates in our research, because they provide the most complete set of risk estimates across sectors and pollution types; however, it must be noted that, of the three sets of estimates, the lower bound results are also the most likely to be biased downward in their estimates of pollution intensities [41] (pp. 20–21).
The IPPS has been successfully applied to project industrial pollution risks in developing countries [42,43]. It has also proved to be popular as a source of sectoral industrial pollution estimates by researchers discussing issues relating to environmental regulation and economic development [44,45,46,47,48,49]. Though the IPPS was originally intended to project pollution risks in developing countries, the system is based on a uniquely detailed analysis of 20th century industrial output and pollution on the United States and is therefore reasonably well suited to historical investigations involving industrialized North American cities such as London. Incorporating the IPPS data into the London HSDI involved linking the IPPS total lower bound risk factors to each polygon representing an industrial building footprint, subdivision, or room within the London HSDI. To do this, we manually assigned to each polygon within the London HSDI an ISIC code that corresponded with the industrial activity documented within that space by the historical record.
2.3. Developing a Zoning-Based Proxy Hazard Factor
Because the IPPS focused on ISIC sectors related to industrial production and manufacturing rather than service or office activities, the results of our ISIC coding step left us with a substantial number of polygons that could not be classified directly using an ISIC code linked to the IPPS. These were assigned a generic four-digit code (9999). In order to apply our pollution analysis to the entire study area and all time slices, including non-industrial buildings and industrial buildings with a generic code, we developed a zoning code-based ranking system to which we could apply IPPS risk factor data. We simplified London’s current zoning code into six zones (Table 1). Non-industrial buildings were manually assigned an appropriate code (residential, commercial, institutional) based on the guidelines within London’s current bylaws. For industrial properties with a generic four-digit code, we divided the ISIC sectors represented within the IPPS into the simplified light, general, and heavy industrial sectors derived from London’s current zoning bylaws. We then calculated the mean IPPS risk factor value for each group to represent that zone’s risk factor. We extrapolated a risk factor for institutional zone by dividing the light industrial risk factor by two. We then applied risk factors to commercial and residential zones by dividing the institutional value sequentially for each. This allows us to assign an IPPS-derived risk factor to industrial activities not directly considered within the IPPS itself. This also results in a risk factor that drops dramatically from heavy industrial to general and light industrial zones—a trend that replicates the results of the original IPPS data, where a small number of heavily polluting sectors produce a dramatically higher risk factor than the rest.
2.4. Creating a Predictive Model
To spatialize the relative severity of hazards generated by industrial activity in London in each of our time slices, we incorporate the IPPS-derived risk factor data into our BE stage data in the form of a numerical hazard factor. To calculate this hazard factor, we multiply the IPPS or zone-based pollutant output numbers assigned to each polygon (representing kilograms of toxic produced by product per 1000 employees) by the polygon’s area in square meters. The area measurement thus serves as a proxy for employment figures for each historical industrial operation, which are not available within the London HSDI. As a result of this calculation each polygon within the London HSDI is assigned an IPPS-derived hazard factor expressed as kilograms of toxic byproduct per polygon. It is important to note that despite our use of IPPS data that is based on real-world observation of industrial pollution outputs, the final hazard factor used in our hazard model serves as a relative measure of industrial hazard rather than an attempt to estimate the precise amount or type of toxic byproduct that may have been produced in a given location or have been deposited there.
2.5. Applying a Weighted Spatial Interpolation
To create an interpolated surface representing the spatial distribution of industrial hazards at each time slice within the London HSDI, we first convert the building polygon data containing our IPPS-derived hazard factors into a point feature class within ArcGIS pro that replaces each building footprint polygon with a set of points corresponding to each vertex in the original building footprint polygon. This point feature class (still containing all building footprint attribute data) is converted into a raster where each pixel value corresponds to the hazard factor value present in the parent point feature class. We then conducted a spatial analysis of the raster data within ArcGIS Pro. Mapping the spatial distribution of soil pollution is often accomplished using spatial interpolation approaches [50]. We chose to use an inverse-distance weighting method (IDW), as it has proven to be an appropriate choice for identifying industrial pollution hotspots [50,51]. We generated the raster outputs at a 10 meter resolution using the IDW tool within ArcGIS Pro with a weighting power of two. Given the large number of sample points generated from the building footprint data, the IDW function considered the nearest 500 neighboring points in order to calculate a final hazard value for each pixel in each output raster. We repeated this process for each of our four time slices. Each of the resulting acute hazard maps (Figure 5) represents the spatial distribution of the effects of industrial point-source pollution at a discrete time period. Each pollution source can be visualized in terms of location and severity based on the IPPS-derived hazard data, and the specific industrial sectors and/or industrial processes involved may be identified by querying the attributes in the spatially coextensive BE data.
The acute hazard maps are useful for studying historical industrial hazards within each of their discrete time frames based on industrial activities taking place at that moment in time. Because the London HSDI contains data from multiple time slices, we can use GIS-based spatial analysis tools to generate an interpolated surface representing the accumulation of industrial hazards over time, while maintaining the spatial linkages to all of the historical data previously collected. In order to do this, we used the Cell Statistics tool within ArcGIS Pro to sum the hazard factor values generated within each of our acute hazard maps. This process generates a 10 meter resolution output raster covering the entire study area whereby each pixel represents the sum of all of the predicted hazard factors in that location over time. This cumulative hazard map thus represents the hazard potential resident in the contemporary or postindustrial urban landscape of London. Within this map, “hotspots” represent a more complex interaction of discrete industrial activities and changes in land use over time.
2.6. Creating a “Ground Truth” Remediation Dataset
In order to evaluate the predictive power of the cumulative hazard map, we compared it against areas in London where soil testing has revealed sufficient levels of pollution to require soil and water testing and/or remediation prior to redevelopment. We acquired this data from two primary sources. The first is a list of brownfields and contaminated sites made available by the province of Ontario’s Ministry of the Environment, Conservation, and Parks [52]. This publicly-available information identifies the location of each property (both street address and lat/long coordinates), the property owners, the results of soil testing undertaken at each property, and whether the property required remediation. To prepare this data for use with the London HSDI, the geographic coordinates for each property were transcribed into a spreadsheet along with the address and whether or not the property required remediation. We then imported this data into ArcGIS Pro and converted it into a point feature class using the geographic coordinates provided. Once within this format the data was applied to polygons representing current London parcels.
The municipal government of the city of London provided the second set of remediation data. Due to liability concerns, a condition of our access to spatial data locating remediated properties was that it had to be degraded in spatial accuracy and all specific information identifying the owners of the property redacted. This remediation data is therefore also represented at the parcel level rather than at the building footprint level or by precise geographic locations where soil samples were collected. This second remediation dataset consists of a list of those privately-owned properties (identified by address) that have taken advantage of the City of London’s Brownfield Incentive Program to partially fund soil and water testing and remediation of contaminated properties. These addresses were matched with appropriate modern parcel data with the London HSDI and merged with the provincial brownfield data. Altogether, these two datasets provided us with parcel-level spatial data representing 46 sites that underwent soil and water pollution testing. Of these, 35 required remediation, and 11 did not require remediation. Together this data serves as a means of ground-truthing the hotspots generated by our cumulative hazard map against real-world pollution test results.
3. Results
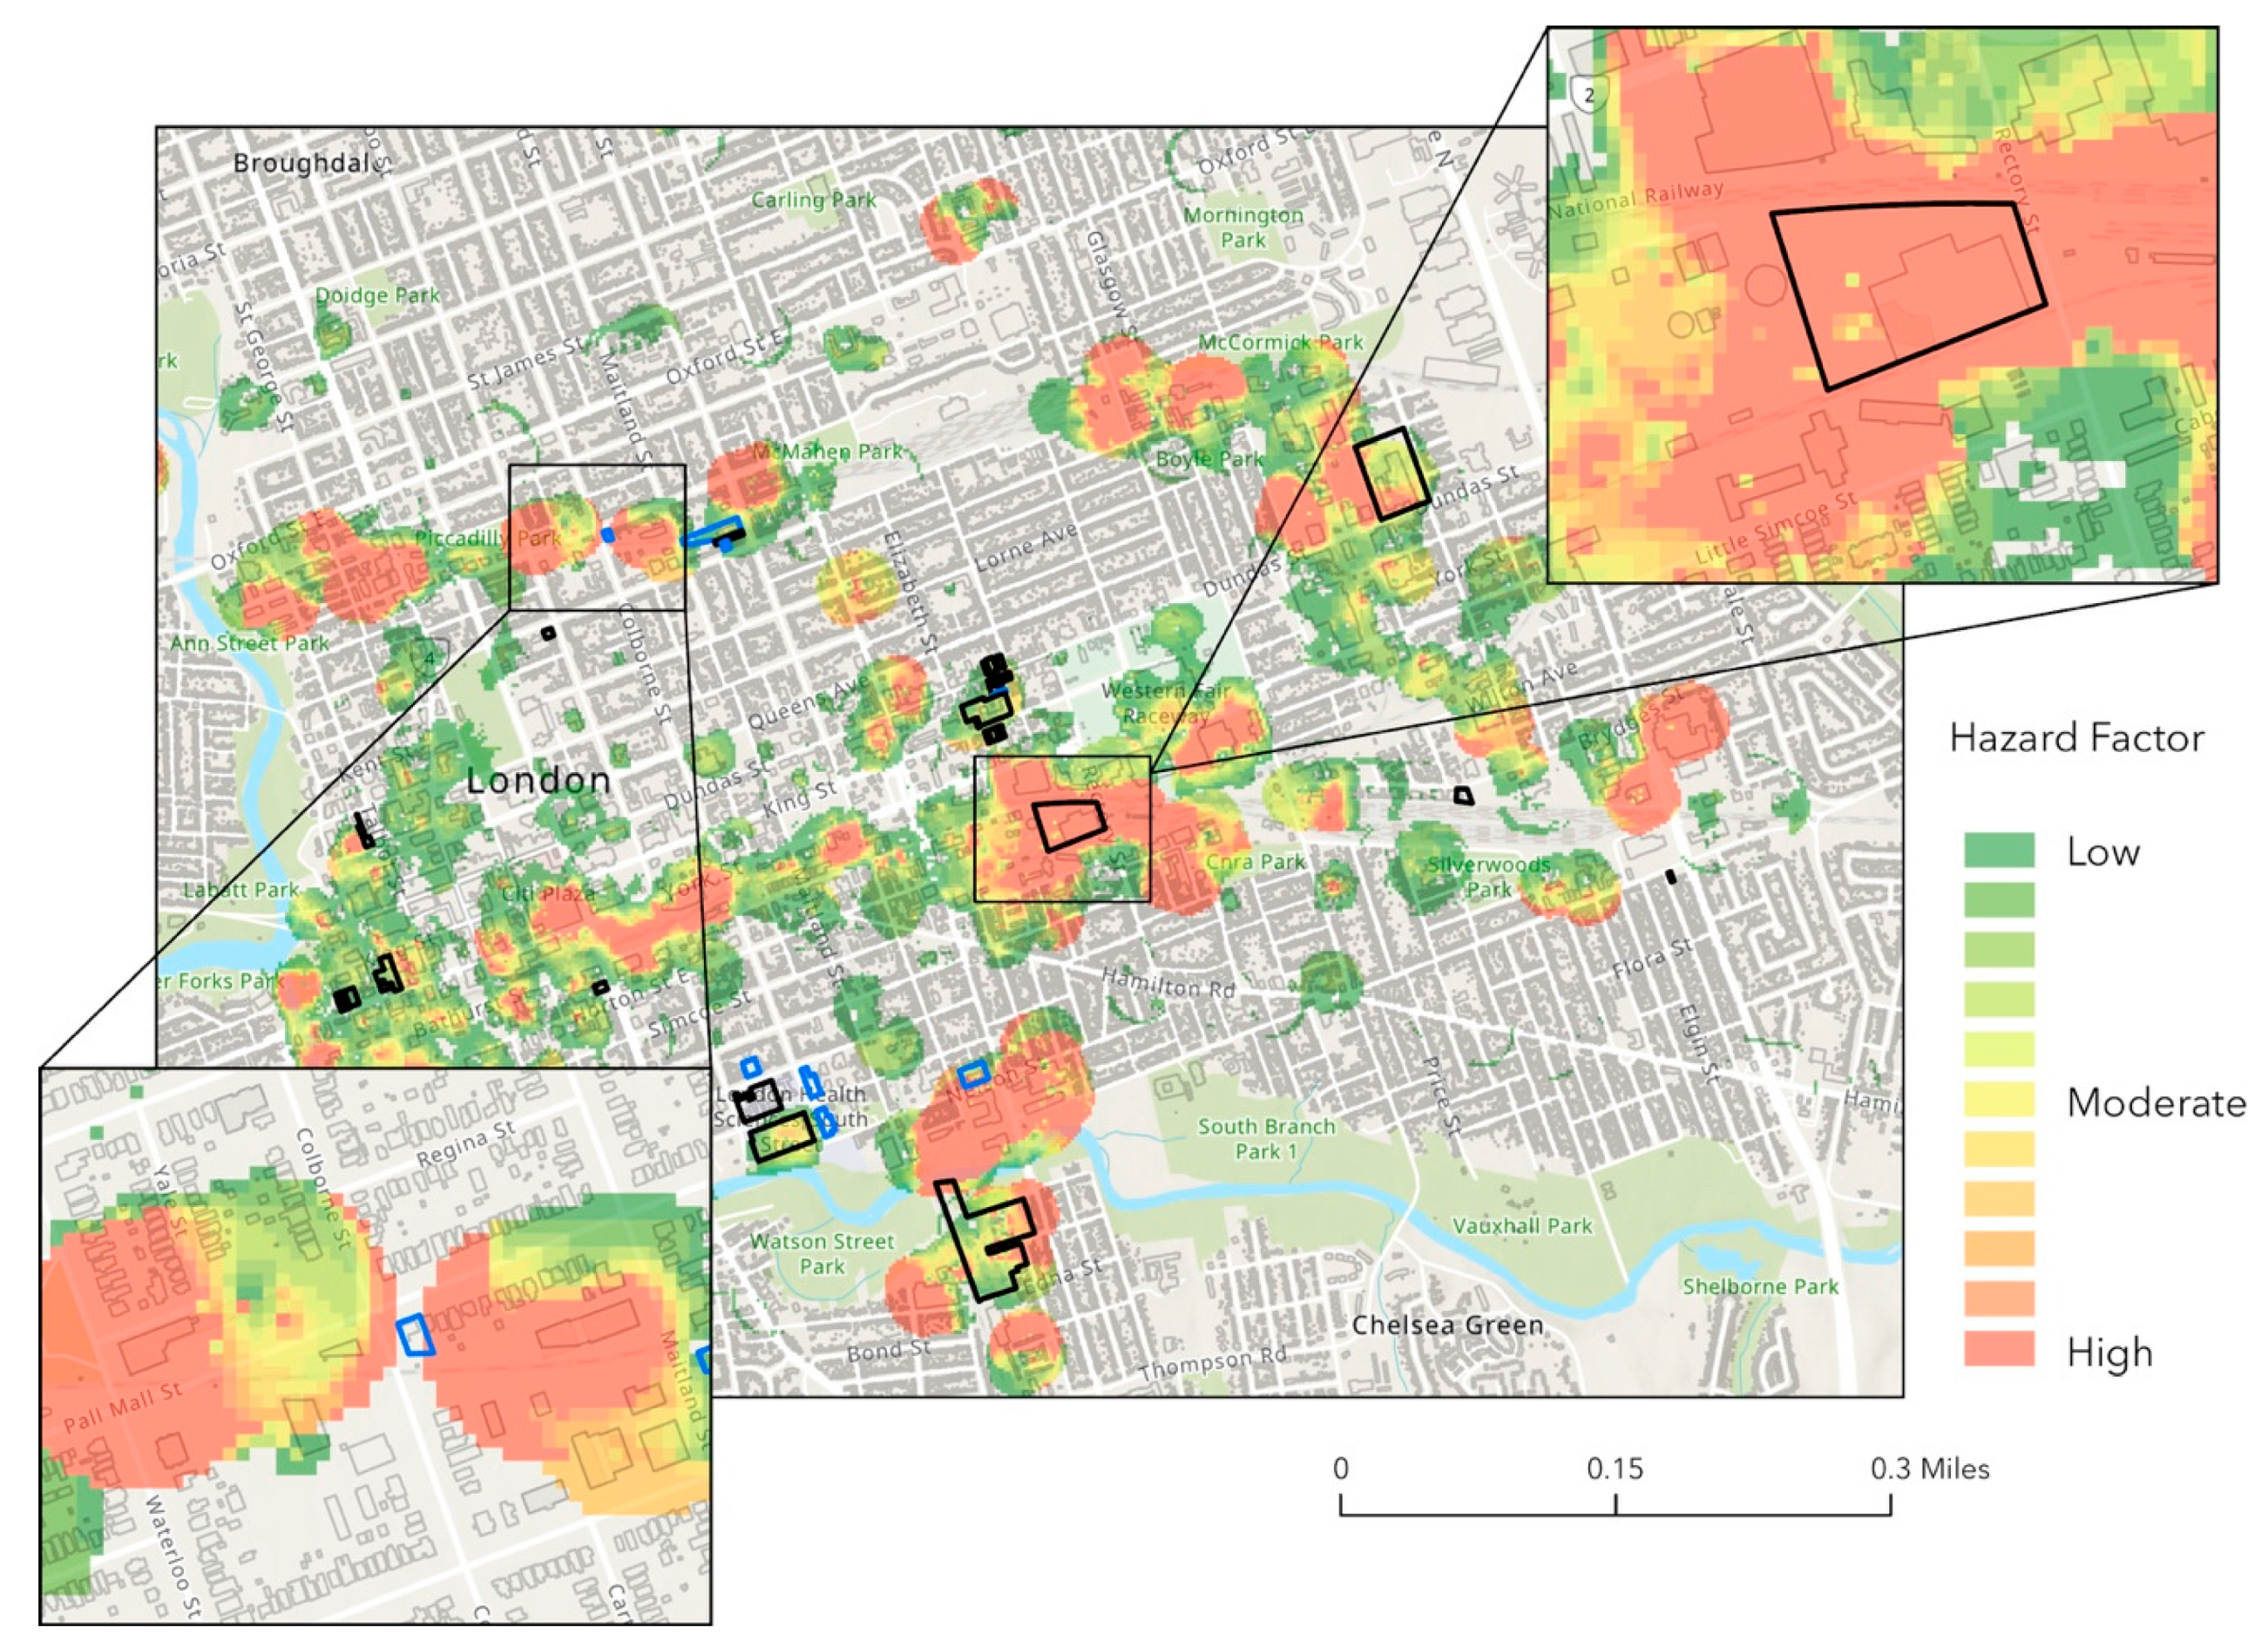
After overlaying the tested parcels on our cumulative hazard map, we find a substantial correlation between locations where the hazard model predicted an elevated hazard factor and tested sites that required remediation (Figure 6). Of the 46 sites tested for pollution, the hazard model predicted a high hazard factor for 22 out of 35 (63%) of the tested sites that required remediation. The model predicted a low hazard factor for eight out of the 11 (73%) tested sites that did not require remediation. While our hazard model remains in development, these initial results illustrate several important advantages of our HSDI-based model compared with previous attempts to map the legacies of industry in urban areas. First, the temporal depth of the London HSDI bookends the city’s era of industrial activity, thus giving us a more complete picture of the changing industrial landscape than previous models with less comprehensive temporal coverage. Second, due to its construction at the building footprint and sub-building scale rather than the parcel scale allows us to model industrial activity within a parcel, bringing a new level of detail to the modeling of historical industrial landscape. This permits a far more sophisticated contextualization of industrial activity that begins to approach the micro scales that archaeologists seek to reconstruct. Third, and finally, our model is capable of illustrating the historical process of industrial “churning” in more detail due to the amount of information carried within the London HSDI’s BE data; small-scale operations such as blacksmith shops and non-industrial hazard point sources such as auto service stations are factored into the London HSDI’s hazard model. The addition of these small-scale, temporally more ephemeral and non-industrial sites may generate hazard hotspots in the cumulative model that would have been overlooked in models based on a narrower set of industrial hazard sources.
The higher level of spatiotemporal detail achieved within the London HSDI underscores the daunting complexity of the phenomena we are attempting to map. Three phenomena in particular underlie this complexity: the sheer number of industrial activities taking place in the city, their complex spatial patterning, and the changing use of the landscape over time. Hundreds, later thousands, of industrial operations are scattered throughout London. Each of these operations are composed of a series of micro-scale activities, each with its own features and each producing distinct byproducts; each of these thousands of unique industrial loci must be taken into account when attempting to model an urban industrial landscape. Second, the distribution pattern of industrial sites is important. While they tend to cluster in districts, some are relatively isolated and even districts may vary widely from one another in their composition and context. Understanding the spatial patterning of this landscape requires us to consider not only the numerous industrial operations, but also their context within the natural landscape, non-industrial portions of the built environment, and of course the social environment occupying this physical landscape. Finally, land use may change rapidly in an industrial city, continually altering the context of industrial operations, which themselves also appear and disappear, or expand and contract as time passes; succeeding land uses may or may not be industrial.
Currently, identifying industrial hazards within this landscape is pursued piecemeal and on a small scale—contemporary environmental testing for persistent pollution covers only a tiny fraction of the city’s total area. This is done on a site-by-site basis prior to redevelopment and is not part of a larger program of mapping the presence of historical hazards in the city as a whole. A geographically comprehensive program of soil and water testing in London is clearly not practicable, making any useful proxy for testing—particularly one that can operate at large as well as fine scales—a valuable addition to real-world testing efforts. Our predictive model helps fill this gap in knowledge. The model has the benefit of mapping industrial point-source hazards at a very high spatial resolution using the historical record, while retaining a city-scale frame of reference. The high level of detail achieved by historical fire insurance plans is mirrored in the BE data of the London HSDI, so that individual activity areas can be linked to hazard factors that are appropriate for their corresponding industrial sector. The calculation of hazards at the sub-building level brings additional nuance to the interpolation of industrial hazards where no testing data, or only limited testing data, may be available.
Ongoing Challenges and Future Development of the Model
In cases where the predicted values did not correlate with the pollution levels in tested sites, our model predicted a low hazard value for 13 of the 35 sites that required remediation, and a high hazard value for three of the 11 sites that did not require remediation. This indicates that the model tends to underestimate the real-world hazard factor. Several factors may account for this. First, as previously mentioned, our decision to use the total lower bound pollution estimates within the IPPS results in predicted hazard factors that are likely to be conservative. Second, while the spatial coverage for each time slice within the London HSDI is fairly comprehensive within the study area, the temporal coverage is limited by the number of years for which fire insurance plans were produced. While new time slices with city-scale coverage is costly and time-consuming, the spatial coverage of the London HSDI’s hazard model will improve in the future as further historical cartography is gradually incorporated. A secondary consideration in the use of fire insurance plans is the fact that they were amended over time to show changes in the built environment [9]; major alterations or demolition events are reflected in these amendments, possibly erasing records of earlier industrial activities. Together, these gaps in the built environment record may conceal industrial operations that were active during periods not covered by the historical cartography. Third, and finally, the hazard model does not take account of vernacular, undocumented, or illegal dumping of waste. These dumping episodes may result in in real-world testing results indicating high levels of pollution where no formal industrial activity took place. Of the three sites where the model predicted higher hazard values in locations where real-world testing did not find elevated levels of pollution, two were situated close to hotspots with higher hazard factors. These may represent false positives that could be eliminated through further adjustments to the IDW parameters, such as the power factor and number of neighboring points considered.
Because our hazard model is based on building footprints (with the exception of the modern acute hazard map, which is parcel-based), the model is focused on point sources of pollution generated in historically recorded building footprints and storage areas (such as chemical tanks or coal storage bins). This approach does not consider pollution point sources generated by the undocumented dumping of toxic byproducts elsewhere on an industrial site. The smoothing effect of the IDW interpolation mitigates this to a degree, but it is likely that the acute and cumulative maps underestimate local hazard factors in areas where on-site dumping occurred.
As we iteratively develop the London HSDI, we plan to address these limitations using three approaches that will expand the spatial and temporal breadth of the model, incorporate new forms of data and identify improved analysis techniques. First, ongoing expansion of the HSDI to incorporate additional historical maps and new archival data (including additional company records, blueprints, and work diaries) will continue to fill gaps in spatial and temporal coverage within the London HSDI. Second, we will continue to add real-world environmental testing data to the model as it is generated, to ground truth the predictive model and also to serve as a spatial representation of documented contemporary industrial hazards. Additionally, we can link groups of pollutants identified by environmental testing to groups of industrial operations that occupied a given location through time as represented in the HSDI—narrowing down the potential source of recorded pollution to specific historical industrial operations or even specific activity areas. Finally, continual experimentation with a variety of differing spatial analysis approaches, such as those discussed in Xie et al. [50] will lead to improvements in the hazard model in future iterations of this analysis.
4. Discussion
The results of this investigation demonstrate that the historical record continues to offer important new insights on the legacies of long-term industrial activity when examined from a new perspective, and that this new perspective can be beneficial to archaeologists. When digitized and manipulated in the form of spatialized historical big data within an HSDI, seemingly familiar sources such as fire insurance plans and business directories can be visualized and analyzed in ways their creators could not possibly have envisioned, providing us with new insights into the formation processes underlying the postindustrial landscape and the hazards it conceals. The industrial hazard model within the London HSDI improves upon previous research [33,34,37] that investigated the ways in which different scales, types, and durations of industrial activity produce vastly different material legacies, and how changes in land use concealed hidden risks. Just as our model is the result of an interdisciplinary approach to studying the postindustrial city, its value can be understood from multiple disciplinary perspectives including archaeology, historical geography, and historical GIS, and the spatial humanities. Our methodology moves us towards a transdisciplinary approach to studying the postindustrial city that links not only scholars and researchers from different disciplines, but also potentially the public and municipal decisionmakers as well.
By incorporating the IPPS within the London HSDI, we extend the predictive value of the IPPS to historical archaeology research. This demonstrates that big data-based HGIS and HSDI concepts originally developed by geographers can be combined with the basic elements of predictive modeling to create a novel type of GIS-based longitudinal industrial hazard model. The London HSDI may be employed to serve archaeologists in several ways. For cultural resource managers, the HSDI, a mutually contextualized, easily explored repository of big historical data, can serve as a starting point for historical research when evaluating the historical significance of a property prior to redevelopment and/or during the process of consideration for heritage status, such as listing in municipal or provincial heritage registers in London, or nomination to the National Register of Historic places in the USA. Academic researchers could use the London HSDI as a predictive model in other ways, for example to identify similar sites suitable for comparative analysis prior to committing to resources to field work. In both cases, the model may also serve to alert archaeologists to pollution that may present a hazard to the archaeologists themselves, reducing the chance that fieldworkers suffer accidental exposures to hazardous materials. This study also underscores the need for archaeologists working in postindustrial urban contexts to consider industrial byproducts as archaeological evidence in its own right as well as a hazard, evidence that may contribute to better understandings of the behaviors of both historical and contemporary urban dwellers. Our application of the HSDI to archaeology demonstrates one innovative way historical archaeologists may use a familiar tool, GIS, to address issues of scale in archaeological research by contextualizing the lives of past people at new levels of detail within a sophisticated, spatiotemporal, city-scale model of industrial hazard exposure. The adoption of such infrastructures as a new way to access the historical record represents a worthy contribution by historical archaeologists to broader “grand challenges” in digital archaeology [53,54,55].
While the focus of the current investigation is on an archaeological application of the London HSDI, the HSDI itself represents a substantial evolution in historical GIS approaches. In using it as the basis for our investigation we augment HGIS research currently being developed by historical geographers, historical demographers, historians, and others by incorporating a historical archaeology frame of reference. This more advanced form of HGIS, incorporating archaeological approaches, is a useful step towards building deep maps, a rapidly growing are of interest within the spatial humanities [56]. The application of archaeological knowledge to deep mapping and the spatial humanities shows a great deal of promise but remains in its infancy as an area of research [18,57]. The current project pushes this promising collaboration forward.
We developed the London HSDI’s industrial hazard model not only for its research potential, but also with an eye towards broader consumption. Government and nonprofit cultural heritage management professionals could use the HSDI to contextualize properties within “lost” neighborhoods and districts when evaluating historical significance of properties, and the HSDI itself could easily incorporate heritage registry or listing data. Municipalities increasingly rely on their GIS in order to help manage a wide range of municipal demand including property management, development, infrastructure, transportation, sanitation, and law enforcement. What these GIS currently lack is temporal depth. The BE data, SE data, and industrial hazard model within the London HSDI can help provide this context. Being able to survey the historical built environment and the accumulation of industrial hazards in London from the city-scale to the sub-building scale at once can help guide planners, developers, and other municipal decisionmakers at the early stages of any project involving ground disturbance, potentially avoiding costly delays or inadvertent exposure of historical hazards.
While all of these individual benefits are valuable, we see the most crucial benefit of the London HSDI to be its potential for collaboration and communication between archaeologists and researchers, municipal decision makers, and the public. While the construction of an HSDI is time and resource-intensive [58,59], the HSDI can serve as a common space–time platform where users of archaeological, historical, and municipal spatial data may connect, share information, and better recognize each other’s needs, approaches, and challenges. Ideally, the HSDI can serve as a communal decision-making tool facilitating community heritage-making, archaeologically sensitive urban redevelopment, and city management [60]. While the HSDI is an approach to modeling the past, its most important application lies in addressing the needs of the present: understanding and confronting the industrial legacies of the urban rustbelt.
Author Contributions
Conceptualization, D.T. and D.L.; methodology, D.T. and D.L.; analysis, D.T.; investigation, D.T.; data curation, D.T. and D.L.; writing—original draft preparation, D.T.; writing—review and editing, D.T. and D.L.; visualization, D.T.; supervision, D.L.
Funding
This research was funded in part by the following grants: Social Science and Humanities Research Council of Canada Standard Research Grant, Social Science and Humanities Research Council of Canada Vanier Canada Graduate Scholarship, National Endowment for the Humanities Collections and Reference Resources (Grant # PW-234885-16) and the Michigan Space Grant Consortium Graduate Fellowship.
Conflicts of Interest
The authors declare no conflict of interest.
References
- Rothschild, N.A.; diZerega Wall, D. The Archaeology of American Cities; University Press of Florida: Gainesville, FL, USA, 2014. [Google Scholar]
- Cassar, J. The Historical and Archaeological Heritage: Pollution and Non-Urban Sites. In Urban Pollution and Changes to Materials and Building Surfaces; Brimblecombe, P., Ed.; Imperial College Press: London, UK, 2015; pp. 255–290. [Google Scholar]
- Nord, A.G.; Tronner, K.; Mattsson, E.; Borg, G.C.; Ullén, I. Environmental Threats to Buried Archaeological Remains. AMBIO J. Hum. Environ. 2005, 34, 256–263. [Google Scholar] [CrossRef]
- Historic England. Land Contamination and Archaeology: Good Practice Guidance; Historic England: London, UK, 2017.
- Howard, J.L.; Ryzewski, K.; Dubay, B.R.; Killion, T.W. Artifact Preservation and Post-Depositional Site-Formation Processes in an Urban Setting: A Geoarchaeological Study of a 19th Century Neighborhood in Detroit, Michigan, USA. J. Archaeol. Sci. 2015, 53, 178–189. [Google Scholar] [CrossRef]
- Dangerous Places: Health, Safety, and Archaeology; Poirier, D.A.; Feder, K.L. (Eds.) Bergin & Garvey: Westport, CT, USA; London, UK, 2001. [Google Scholar]
- Cantwell, A.-M.; diZerega Wall, D. Unearthing Gotham: The Archaeology of New York City; Yale University Press: New Haven, CT, USA, 2001. [Google Scholar]
- Big Histories, Human Lives: Tackling Problems of Scale in Archaeology; Robb, J.; Pauketat, T.R. (Eds.) School for Advanced Research Press: Santa Fe, NM, USA, 2013. [Google Scholar]
- Bloomfield, G.T. Canadian Fire Insurance Plans and Industrial Archeology. IA J. Soc. Ind. Archeol. 1982, 8, 67–80. [Google Scholar]
- Wright, H. Insurance Mapping and Industrial Archeology. IA J. Soc. Ind. Archeol. 1983, 9, 1–18. [Google Scholar]
- Orser, C.E. Historical Archaeology, 3rd ed.; Routledge: London, UK; New York, NY, USA, 2017. [Google Scholar]
- Keister, K. Charts of Change. Hist. Preserv. 1993, 45, 40–49. [Google Scholar]
- Krafft, T. Reconstructing the North American Urban Landscape: Fire Insurance Maps—An Indispensable Source. Erdkunde 1993, 47, 196–211. [Google Scholar] [CrossRef]
- Moulder, C. Fire Insurance Plans as a Data Source in Urban Research: An Annotated Bibliography of Examples. Art Ref. Serv. Q. 1994, 1, 49–62. [Google Scholar] [CrossRef]
- Oswald, D.L. Fire Insurance Maps: Their History and Application, 1st ed.; Lacewing Press: College Station, TX, USA, 1997. [Google Scholar]
- Neumann, T.W.; Sanford, R.M.; Harry, K.G. Cultural Resources Archaeology: An Introduction, 2nd ed.; Alta Mira Press/Rowman & Littlefield: Lanham, MD, USA, 2010. [Google Scholar]
- Berry, J.W., III. Historical Sanborn Maps in the Digital Age: City of New Orleans. J. GIS Archaeol. 2003, 1, 74–78. [Google Scholar]
- Trepal, D.; Lafreniere, D.; Gilliland, J. Historical Spatial Data Infrastructures for Archaeology: Towards a Spatio-Temporal Big data Approach to Studying the Post-Industrial City. Hist. Archaeol. 2020, in press. [Google Scholar]
- White, A.P. X Marks the Spot: Extracting Data from Historical Maps to Locate Archaeological Sites. J. Map Geogr. Libr. 2013, 9, 140–156. [Google Scholar] [CrossRef]
- Arnold, J.D.M.; Lafreniere, D. Creating a Longitudinal, Data-Driven 3D Model of Change Over Time in a Postindustrial Landscape Using GIS and CityEngine. J. Cult. Herit. Manag. Sustain. Dev. 2018, 8, 434–447. [Google Scholar] [CrossRef]
- Douglass, M.J.; Day, Z.R.; Brunette, J.C.; Bleed, P. Virtual Reconstruction as Archaeological Observation: Embracing New Ways of Treating Sites, Places and Landscapes. Adv. Archaeol. Pract. 2019, 7, 127–139. [Google Scholar] [CrossRef]
- Lafreniere, D.; Gilliland, J. “All the World’s a Stage”: A GIS Framework for Recreating Personal Time-Space from Qualitative and Quantitative Sources. Trans. GIS 2015, 19, 225–246. [Google Scholar] [CrossRef]
- Page, B.; Ross, E. Envisioning the Urban Past: GIS Reconstruction of a Lost Denver District. Front. Digi. Humanit. 2015, 2. [Google Scholar] [CrossRef] [Green Version]
- Kvamme, K.L. Recent Directions and Developments in Geographical Information Systems. J. Archaeol. Res. 1999, 7, 153–201. [Google Scholar] [CrossRef]
- Ebert, D. Applications of Archaeological GIS. Can. J. Archaeol./Journal Canadien d’Archéologie 2004, 28, 319–341. [Google Scholar]
- González-Tennant, E. Recent Directions and Future Developments in Geographic Information Systems for Historical Archaeology. Hist. Archaeol. 2016, 50, 24–49. [Google Scholar] [CrossRef]
- Dallas, C. Curating Archaeological Knowledge in the Digital Continuum: From Practice to Infrastructure. Open Archaeol. 2015, 1, 176–207. [Google Scholar] [CrossRef]
- Goodchild, M.F.; Janelle, D.G. Toward critical Spatial Thinking in the Social Sciences and Humanities. GeoJournal 2010, 75, 3–13. [Google Scholar] [CrossRef]
- Toward Spatial Humanities: Historical GIS and Spatial History; Gregory, I.N.; Geddes, A. (Eds.) Indiana University Press: Bloomington, IN, USA, 2014. [Google Scholar]
- Deep Maps and Spatial Narratives; Bodenhamer, D.J.; Corrigan, J.; Harris, T.M. (Eds.) Indiana University Press: Bloomington, IN, USA, 2015. [Google Scholar]
- Tarr, J.A. The Metabolism of the Industrial City: The Case of Pittsburgh. J. Urban Hist. 2002, 28, 511–545. [Google Scholar] [CrossRef]
- Olson, S. Downwind, Downstream, Downtown: The Environmental Legacy in Baltimore and Montreal. Environ. Hist. 2007, 12, 845–866. [Google Scholar] [CrossRef] [Green Version]
- Litt, J.S.; Burke, T.A. Uncovering the Historic Environmental Hazards of Urban Brownfields. J. Urban Health 2002, 79, 464–481. [Google Scholar] [CrossRef] [PubMed] [Green Version]
- Kolodziej, K.; Lejano, P.P.; Sassa, C.; Maharjan, S.; Ghaemghani, J.; Plant, T. The Industrial Archeology of Boston. URISA J. 2004, 16, 5–14. [Google Scholar]
- Hayek, M.; Novak, M.; Arku, G.; Gilliland, J. Mapping Industrial Legacies: Building a Comprehensive Brownfield Database in Geographic Information Systems. Plan. Pract. Res. 2010, 25, 461–475. [Google Scholar] [CrossRef]
- Elliott, J.R.; Frickel, S. Environmental Dimensions of Urban Change: Uncovering Relict Industrial Waste Sites and Subsequent Land Use Conversions in Portland and New Orleans. J. Urban Aff. 2011, 33, 61–82. [Google Scholar] [CrossRef]
- Elliott, J.R.; Frickel, S. The Historical Nature of Cities: A Study of Urbanization and Hazardous Waste Accumulation. Am. Sociol. Rev. 2013, 78, 521–543. [Google Scholar] [CrossRef]
- Sobek, M.; Cleveland, L.; Flood, S.; Hall, P.K.; King, M.L.; Ruggles, S.; Schroeder, M. Big Data: Large-Scale Historical Infrastructure from the Minnesota Population Center. Hist. Methods J. Quant. Interdiscip. Hist. 2011, 44, 61–68. [Google Scholar] [CrossRef] [Green Version]
- Ruggles, S.; McCaa, R.; Sobek, M.; Cleveland, L. The IPUMS Collaboration: Integrating and Disseminating the World’s Population Microdata. J. Demogr. Econ. 2015, 81, 203–216. [Google Scholar] [CrossRef]
- Ruggles, S.; Genadek, K.; Goeken, R.; Grover, J.; Sobek, M. Integrated Public Use Microdata Series: Version 7.0; University of Minnesota: Minneapolis, MN, USA, 2017. [Google Scholar] [CrossRef]
- Hettige, H.; Martin, P.; Singh, M.; Wheeler, D.R. The Industrial Pollution Projection System; WPS 1431; World Bank: Washington, DC, USA, 1995. [Google Scholar]
- Oketola, A.; Osibanjo, O. Estimating Sectoral Pollution Load in Lagos by Industrial Pollution Projection System (IPPS). Sci. Total Environ. 2007, 377, 125–141. [Google Scholar] [CrossRef]
- Odesanya, B.O.; Ajayi, S.O.; Shittu, M.; Oshin, O. Use of Industrial Pollution Projection System (IPPS) to Estimate Pollution Load by Sector in two Industrial Estates in Ogun State, Western Nigeria. Int. J. Sci. Eng. Res. 2012, 3, 748–753. [Google Scholar]
- Dessus, S.; O’connor, D. Climate Policy Without Tears: CGE-Based Ancillary Benefits Estimates for Chile. Environ. Resour. Econ. 2003, 25, 287–317. [Google Scholar] [CrossRef]
- Dinda, S. Environmental Kuznets Curve Hypothesis: A Survey. Ecol. Econ. 2004, 49, 431–455. [Google Scholar] [CrossRef] [Green Version]
- Cole, M.A. US Environmental Load Displacement: Examining Consumption, Regulations and the Role of NAFTA. Ecol. Econ. 2004, 48, 439–450. [Google Scholar] [CrossRef]
- Akbostanci, E.; Tunç, G.İ.; Türüt-Aşık, S. Pollution Haven Hypothesis and the Role of Dirty Industries in Turkey’s Exports. Environ. Dev. Econ. 2007, 12, 297–322. [Google Scholar] [CrossRef]
- Levinson, A.; Taylor, M.S. Unmasking the Pollution Haven Effect. Int. Econ. Rev. 2008, 49, 223–254. [Google Scholar] [CrossRef]
- Shapiro, J.S.; Walker, R. Why is Pollution from US Manufacturing Declining? The Roles of Environmental Regulation, Productivity, and Trade. Am. Econ. Rev. 2018, 108, 3814–3854. [Google Scholar] [CrossRef]
- Xie, Y.; Chen, T.-B.; Jun Yang, M.L.; Guo, Q.-J.; Song, B.; Zhou, X.-Y. Spatial Distribution of Soil Heavy Metal Pollution Estimated by Different Interpolation Methods: Accuracy and Uncertainty Analysis. Chemosphere 2011, 82, 468–476. [Google Scholar] [CrossRef] [PubMed]
- Guan, Y.; Shao, C.; Gu, Q.; Ju, M.; Zhang, Q. Method for Assessing the Integrated Risk of Soil Pollution in Industrial and Mining Gathering Areas. Int. J. Environ. Res. Public Health 2015, 12, 14589–14609. [Google Scholar] [CrossRef] [Green Version]
- Brownfield Redevelopment. Available online: https://www.ontario.ca/page/brownfields-redevelopment (accessed on 1 May 2019).
- Huggett, J. Disciplinary Issues: Challenging the Research and Practice of Computer Applications in Archaeology. In Archaeology in the Digital Era. Series: Computer Applications and Quantitative Methods in Archaeology; Earl, G., Sly, T., Chrysanthi, A., Murrieta-Flores, P., Papadopoulos, C., Romanowska, I., Wheatley, D., Eds.; Amsterdam University Press: Amsterdam, The Netherlands, 2013; pp. 13–24. [Google Scholar]
- Huggett, J. A Manifesto for an Introspective Digital Archaeology. Open Archaeol. 2015, 1, 86–95. [Google Scholar] [CrossRef]
- Huggett, J. Challenging Digital Archaeology. Open Archaeol. 2015, 1, 79–85. [Google Scholar] [CrossRef]
- Making Deep Maps: Foundations, Approaches, and Methods; Bodenhamer, D.J.; Corrigan, J.; Harris, T.M. (Eds.) Indiana University Press: Bloomington, IN, USA, 2019. [Google Scholar]
- Earley-Spadoni, T. Spatial History, Deep Mapping and Digital Storytelling: Archaeology’s Future Imagined Through an Engagement with the Digital Humanities. J. Archaeol. Sci. 2017, 84, 95–102. [Google Scholar] [CrossRef]
- Southall, H. Applying Historical GIS beyond the Academy: Four Use Cases for the Great Britain HGIS. In Toward Spatial Humanities: Historical GIS and Spatial History; Bodenhamer, D.J., Corrigan, J., Harris, T.M., Eds.; Indiana University Press: Bloomington, IN, USA, 2014; pp. 92–117. [Google Scholar]
- Lafreniere, D.; Weidner, L.; Trepal, D.; Scarlett, S.; Arnold, J.; Pastel, R.; William, R. Public Participatory Historical GIS. Hist. Methods J. Quant. Interdiscip. Hist. 2019, 52, 1–18. [Google Scholar] [CrossRef]
- Trepal, D.; Scarlett, S.F.; Lafreniere, D. Heritage Making through Community Archaeology and the Spatial Humanities. J. Community Archaeol. Heri. 2019, in press. [Google Scholar]
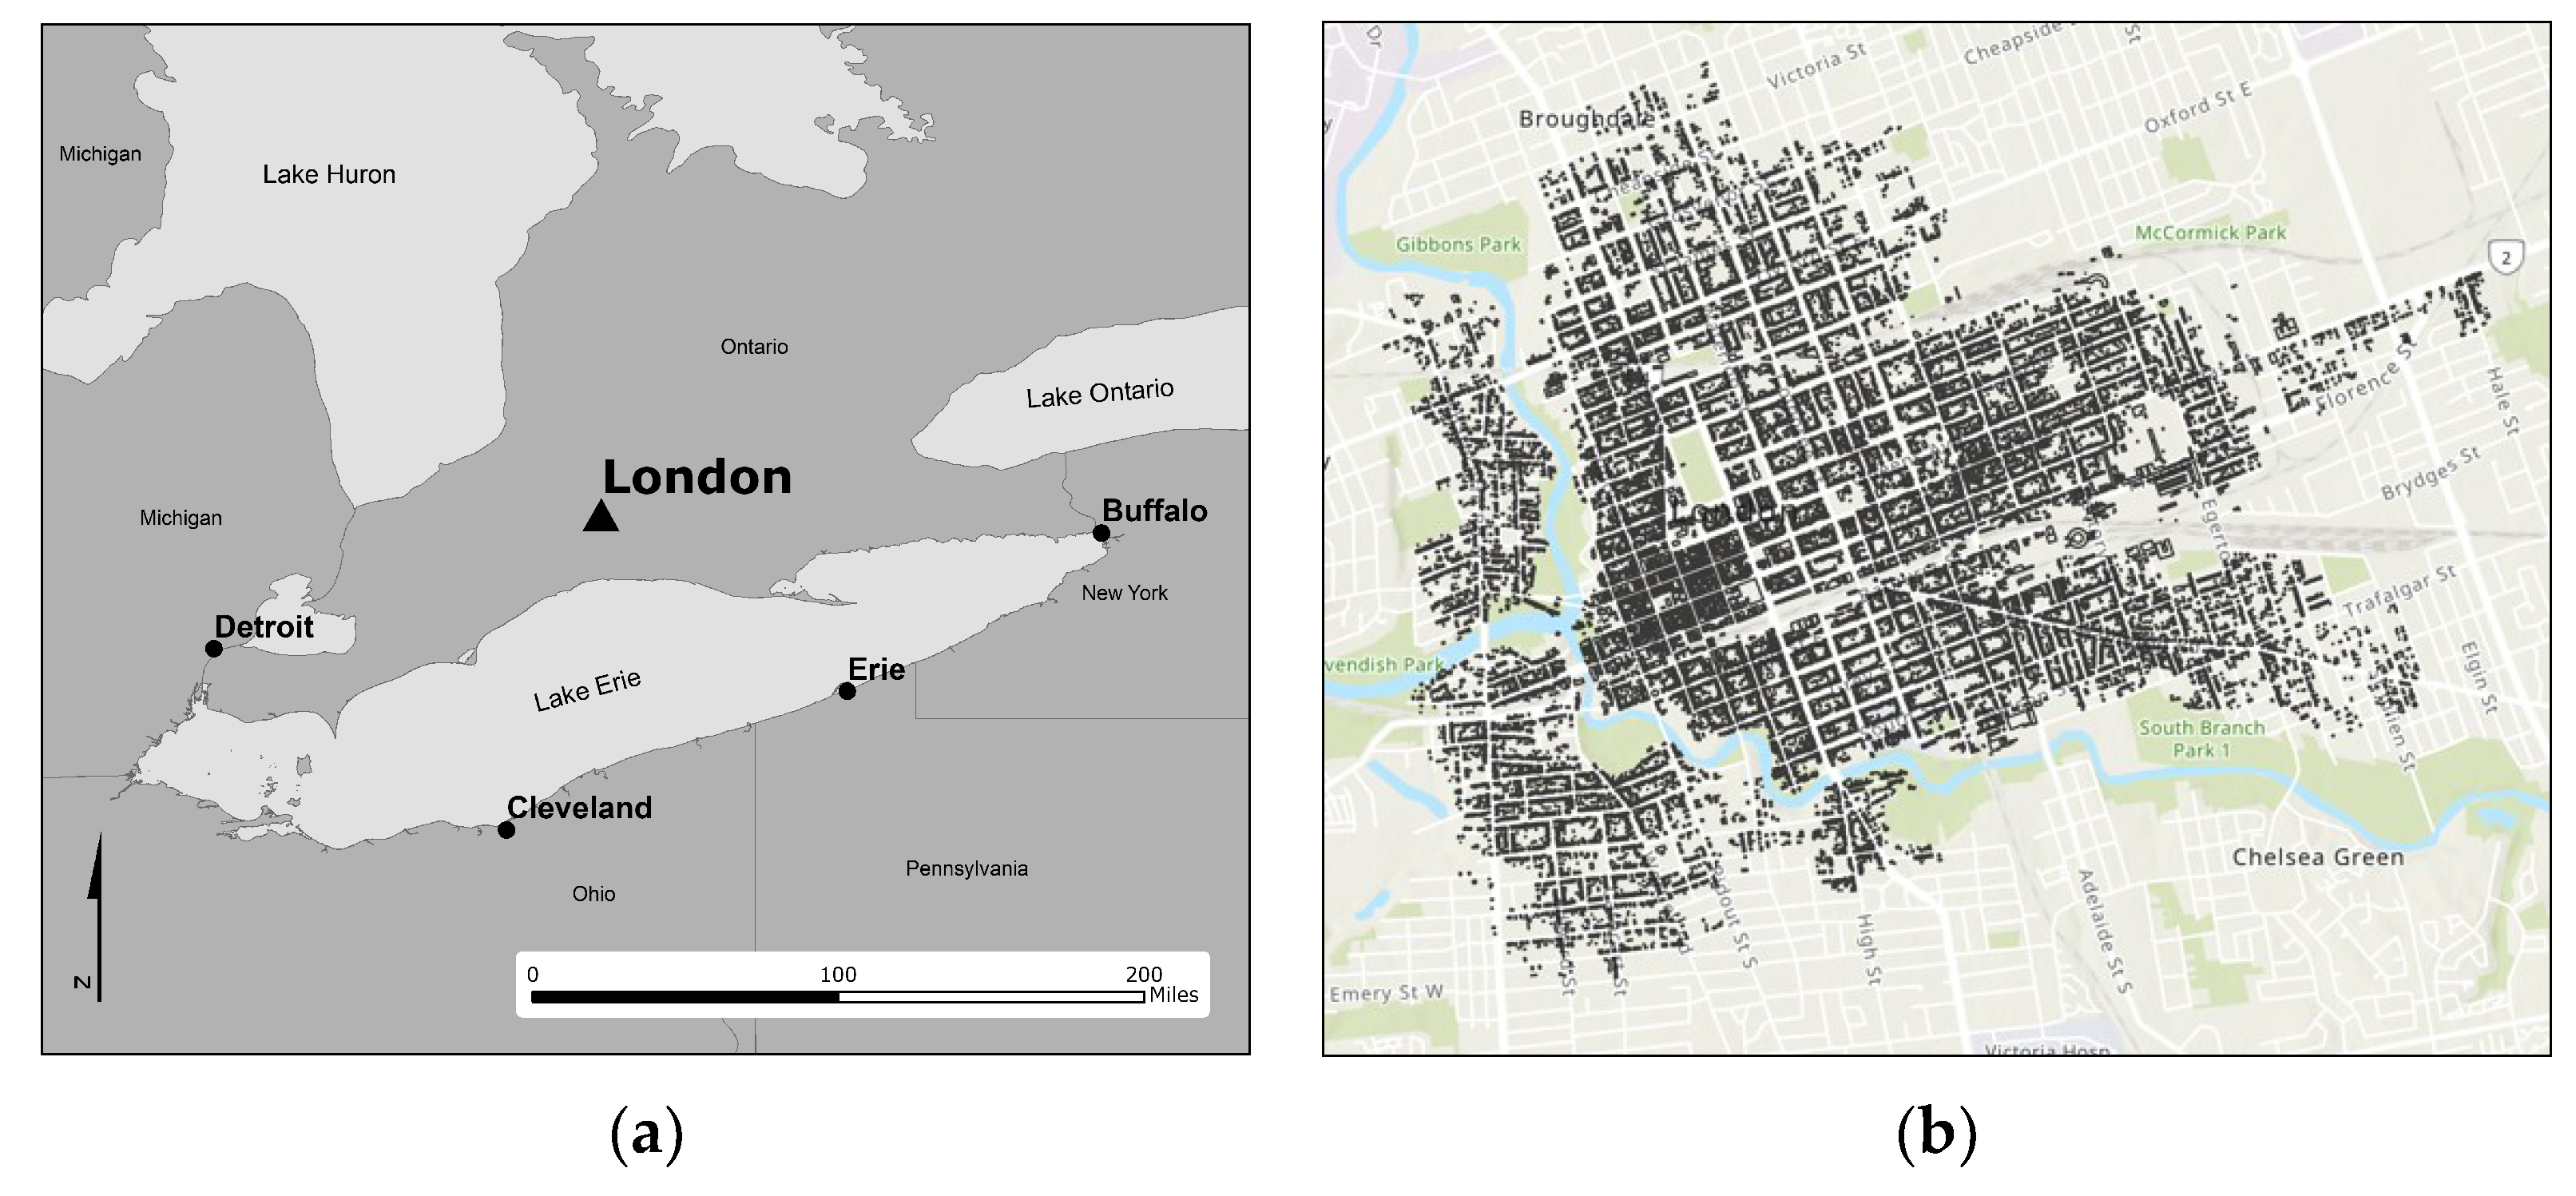
Figure 1.
The project study area is London, Ontario, found in the heart of the North American Rust Belt (a). The study is focused on the urban portions of London, Ontario across the period 1888 to present (b). Map by author.
Figure 1.
The project study area is London, Ontario, found in the heart of the North American Rust Belt (a). The study is focused on the urban portions of London, Ontario across the period 1888 to present (b). Map by author.

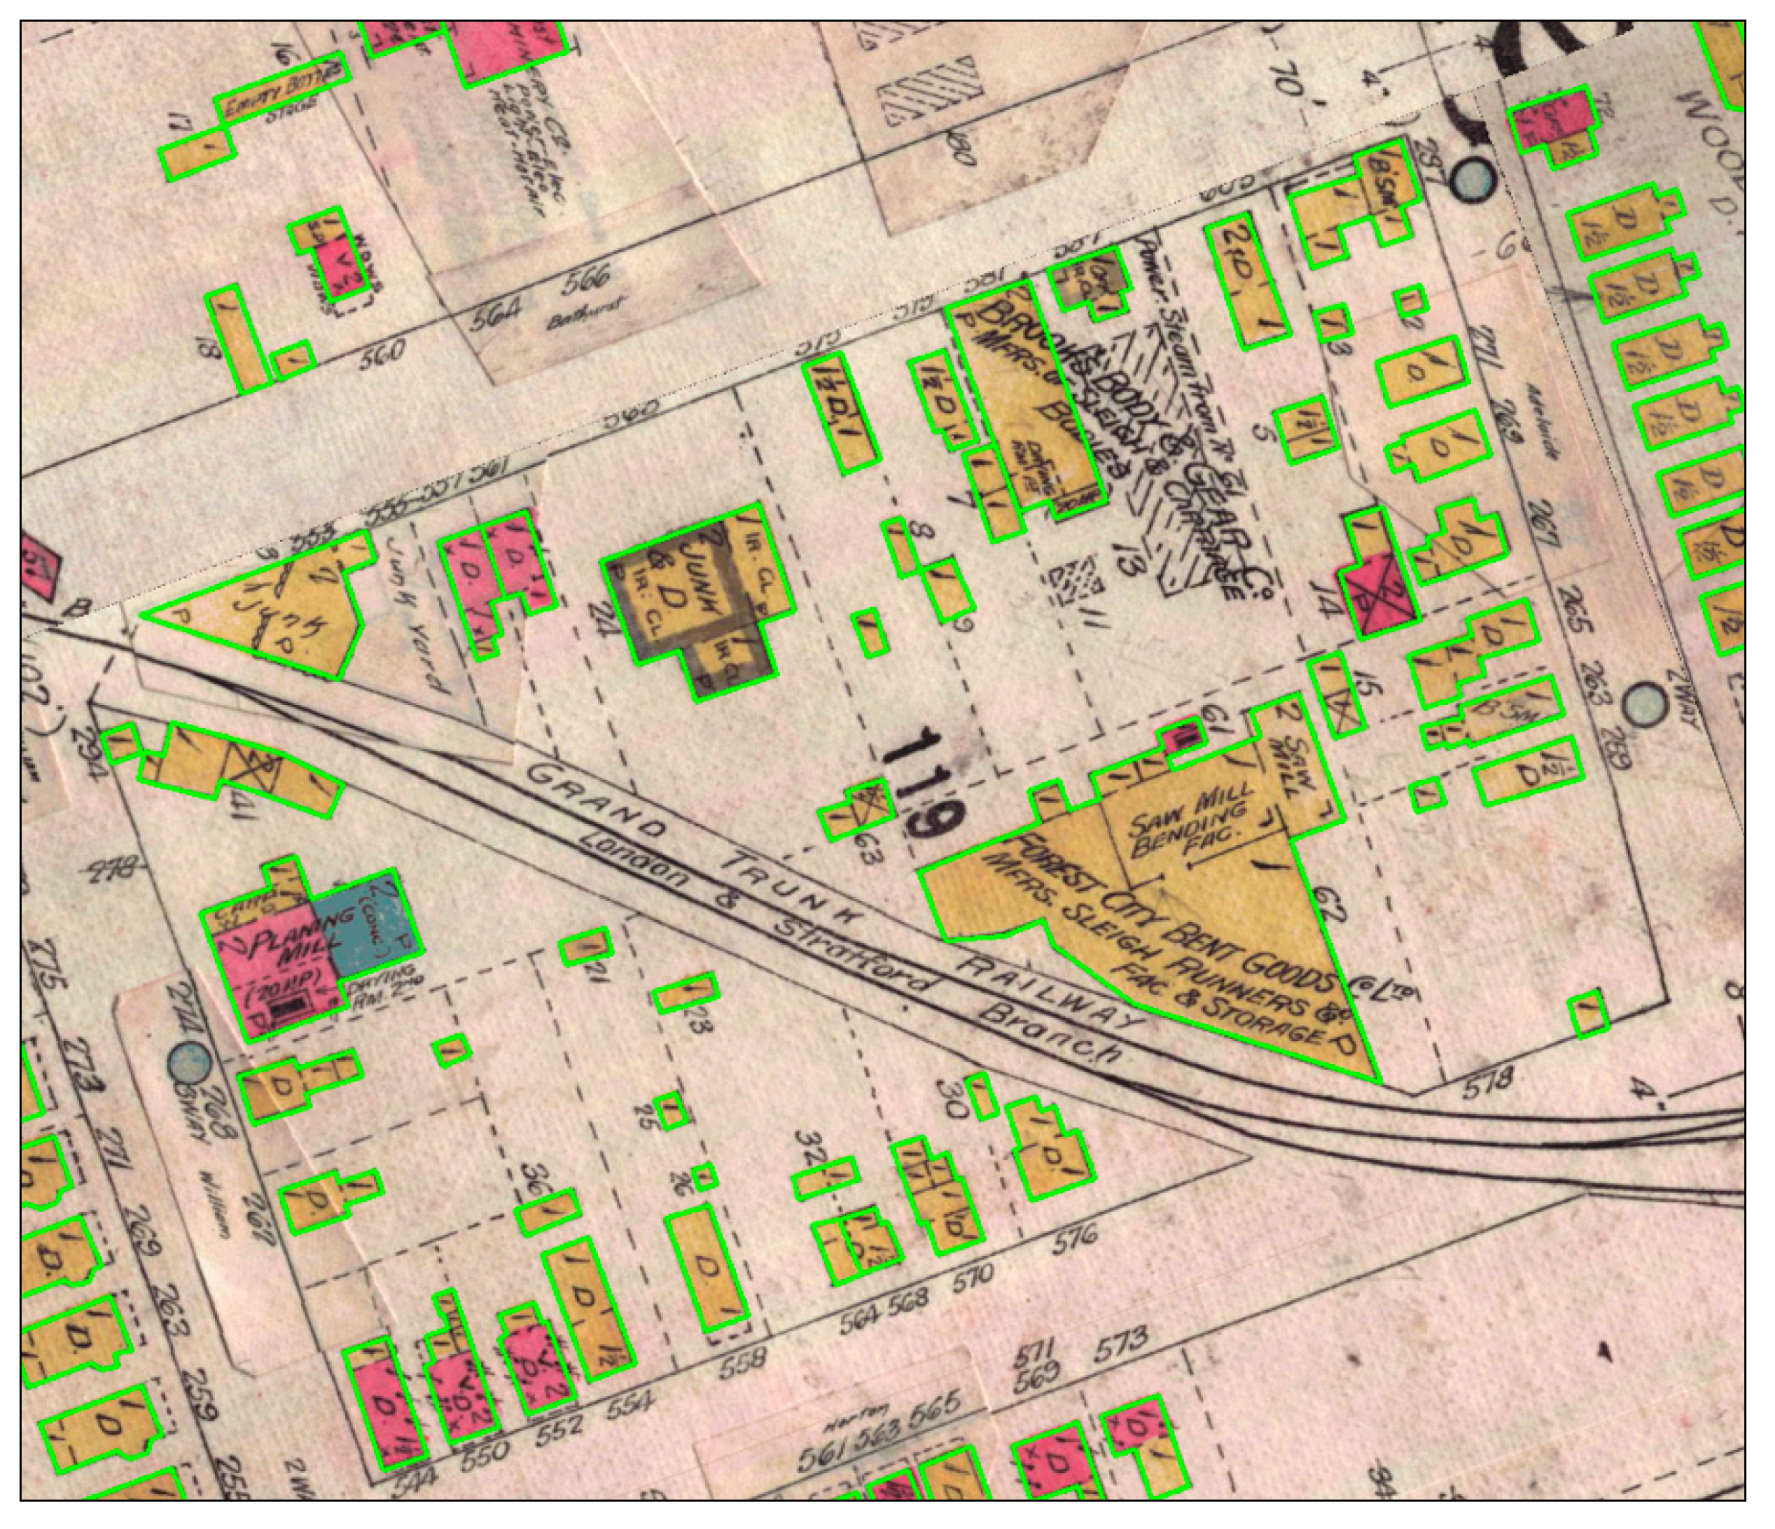
Figure 2.
The London Historical Spatial Data Infrastructure’s (HSDI) built environment data incudes over 116,000 manually digitized building footprints covering the period 1888–2016. Each footprint (shown above in green) is linked in the HSDI to detailed attribute information derived from historical fire insurance plans, business directories, and other archival sources. Image by author.

Figure 3.
Industrial activity within the London HDSI is recorded at the sub-building footprint resolution, identifying discrete historical activity areas within a building or building complex. Image by author.
Figure 3.
Industrial activity within the London HDSI is recorded at the sub-building footprint resolution, identifying discrete historical activity areas within a building or building complex. Image by author.

Figure 4.
Industrial Pollution Projections System (IPPS) workflow illustration by author, modified after [41].
Figure 4.
Industrial Pollution Projections System (IPPS) workflow illustration by author, modified after [41].

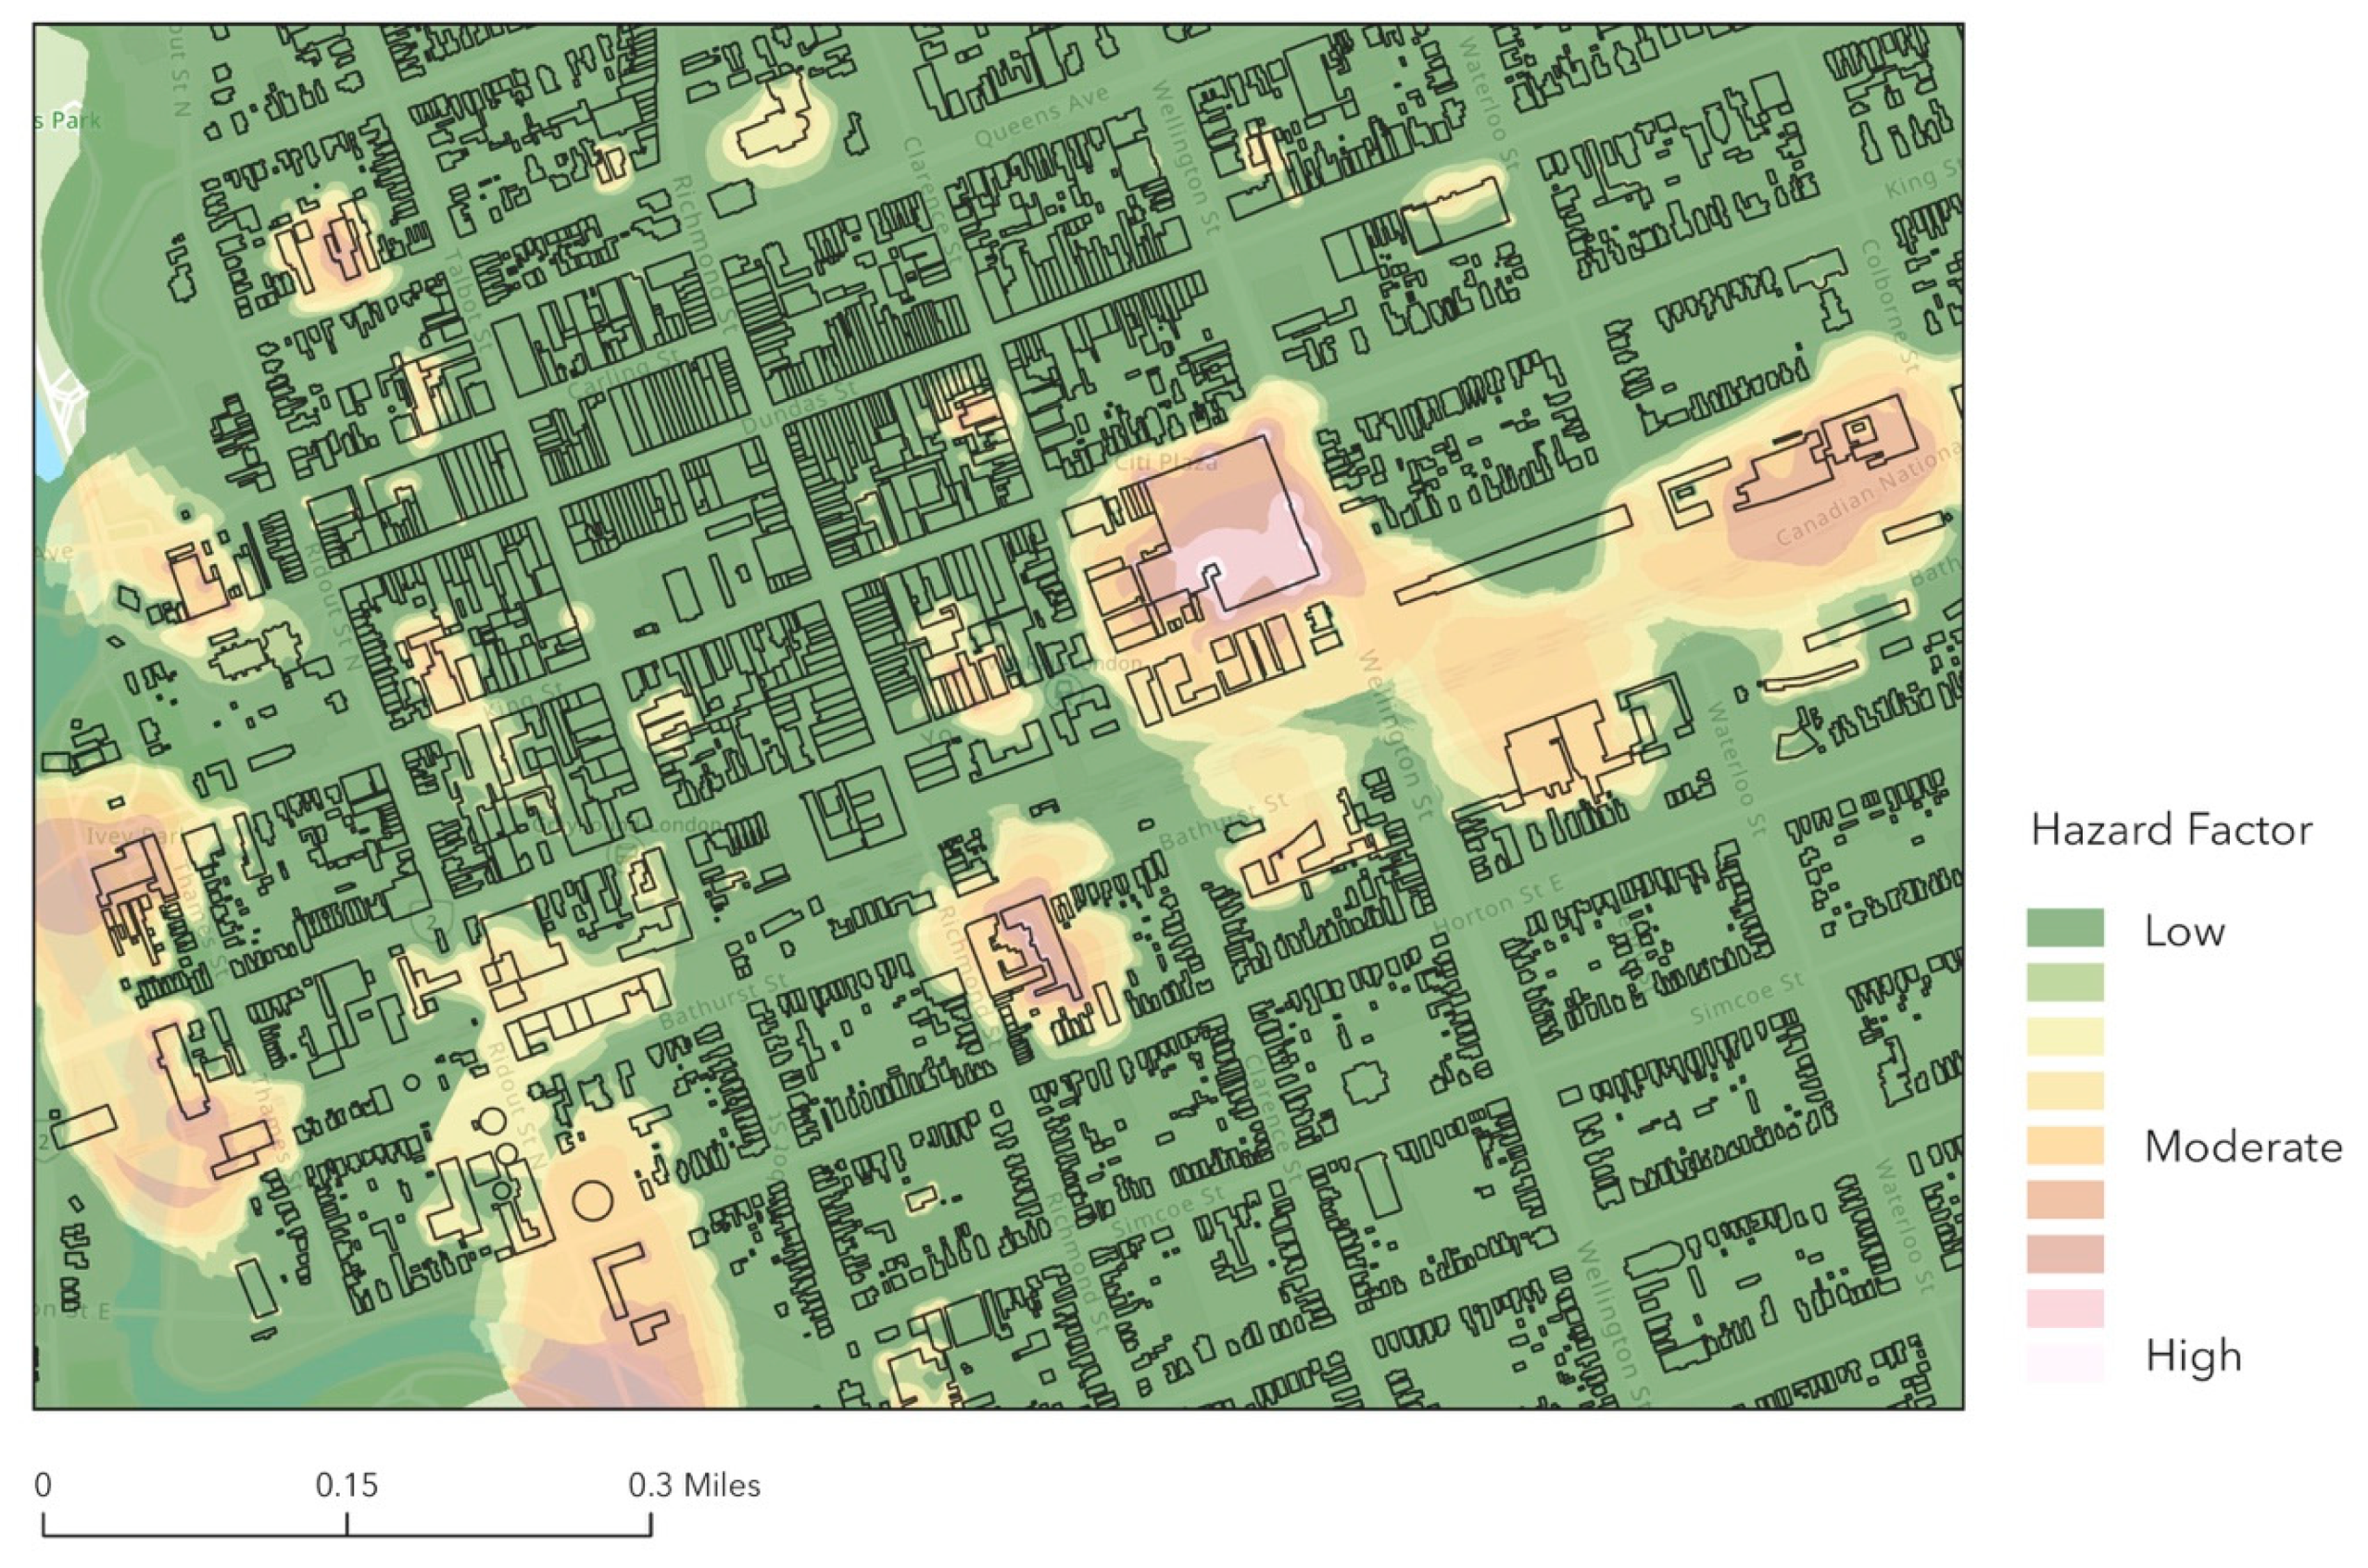
Figure 5.
Detail of acute hazard map of London, 1915. Industrial hazards present in London at various time periods can be visualized at the city scale within the London HSDI by applying an inverse-distance weighting (IDW) spatial interpolation to the IPPS-derived hazard factors appended to the London HSDI Built Environment (BE) data. This image shows the distribution of industrial hazards across a large section of London in 1915. Image by author.

Figure 6.
By summing the acute hazards recorded in multiple time periods, the London HSDI can be used to visualize the estimated accumulation of industrial hazards on a postindustrial landscape and highlight higher-risk hotspots. This predictive model can then be checked against real-world pollution testing data. In the image above, contaminated properties are outlined in black, while properties that were tested but did not contain contamination are outlined in blue. Image by author.


Table 1.
Zone-based extrapolated hazard factors.
| Land Use Zone | IPPS Total Lower Bound Risk Factor (Kilograms of Toxic Byproduct/1000 Employees) |
|---|---|
| Residential | 7879 |
| Commercial | 15,758 |
| Institutional | 31,516 |
| Light Industrial | 63,031 |
| General Industrial | 85,969 |
| Heavy Industrial | 1,195,628 |
© 2019 by the authors. Licensee MDPI, Basel, Switzerland. This article is an open access article distributed under the terms and conditions of the Creative Commons Attribution (CC BY) license (http://creativecommons.org/licenses/by/4.0/).
Share and Cite
MDPI and ACS Style
Trepal, D.; Lafreniere, D. Understanding Cumulative Hazards in a Rustbelt City: Integrating GIS, Archaeology, and Spatial History. Urban Sci. 2019, 3, 83. https://0-doi-org.brum.beds.ac.uk/10.3390/urbansci3030083
AMA Style
Trepal D, Lafreniere D. Understanding Cumulative Hazards in a Rustbelt City: Integrating GIS, Archaeology, and Spatial History. Urban Science. 2019; 3(3):83. https://0-doi-org.brum.beds.ac.uk/10.3390/urbansci3030083
Chicago/Turabian StyleTrepal, Dan, and Don Lafreniere. 2019. "Understanding Cumulative Hazards in a Rustbelt City: Integrating GIS, Archaeology, and Spatial History" Urban Science 3, no. 3: 83. https://0-doi-org.brum.beds.ac.uk/10.3390/urbansci3030083